Introduction
The Montreal Cognitive Assessment (MoCA) (Nasreddine et al., Reference Nasreddine2005) is a screening test for cognitive impairment that has been validated based on high accuracy for classifying older persons with dementia, mild cognitive impairment, or normal cognition (Lee et al., Reference Lee2008; Wen et al., Reference Wen, Zhang, Niu and Li2008; Duro et al., Reference Duro, Simoes, Ponciano and Santana2009; Fujiwara et al., Reference Fujiwara2010; Pendlebury et al., Reference Pendlebury, Cuthbertson, Welch, Mehta and Rothwell2010). We recently demonstrated using Rasch analysis that the MoCA test items collectively assess cognitive ability as a unidimensional construct, such that the total score can be validly interpreted as a quantitative estimate of global cognitive ability (Koski et al., Reference Koski, Xie and Finch2009). As a result, the MoCA test can be used not only for screening, but also for the purpose of tracking changes in global cognition over time within an individual or group.
The results of our previous study (Koski et al., Reference Koski, Xie and Finch2009) pointed to a potential limitation of the MoCA total score as an estimate of ability in persons within a certain range of ability: We refer to the relatively weaker measurement precision obtained for persons at the high end of the ability continuum. This limitation can be understood most clearly with reference to the graph shown in Figure 1a depicting the results of our previous study in 222 geriatric outpatients. The distribution of MoCA item difficulties are shown in the lower bars and the distribution of person abilities are shown in the upper bars. We note that fewer items assess cognition at the extremes of the difficulty hierarchy, especially at the end representing higher cognitive ability (right side of graph). This decreases the capacity of the test to precisely quantify cognitive ability in these ranges. The information function (plotted line in upper part of graph) shows that measurement precision is greatest below the mean difficulty level of the items, dropping off precipitously in the range from 1 to 2 standard deviations above the mean difficulty level. This is precisely the mid-range of the distribution of cognitive impairment in our patient sample, implying a limitation in the MoCA's ability to detect change in the very people we would most like to target with cognition-modifying interventions. Sensitivity to change is an essential attribute of an outcome measure when even modest improvements in cognition would be seen as a desirable outcome (e.g. brief interventions or clinical trials with short follow-up times). Improving the existing tools to increase precision in estimates of cognitive ability would produce better outcome measures with greater ability to detect change.
(a) Distribution of items (bottom bars) and persons (top bars) by location on the cognitive ability scale measured by the MoCA alone in 222 patients (Koski et al., Reference Koski, Xie and Finch2009). The lower bars in each graph show the difficulty of the items, which are centered on a mean of zero, with cognitive ability quantified in units of standard deviation from this mean. Easier items are to the left and harder items are to the right of the mean. The bottom y-axis indicates the number (left) and percentage (right) of items at each ability interval. The ability level of the patient sample is shown in the upper bars of each graph, with persons of lower ability to the left of the distribution and persons of higher ability to the right of the distribution. The top y-axis indicates the number (left) and percentage (right) of people located at each ability interval. The line plotted in the upper half of the figure is the information function, which is inversely related to the standard error and indicates precision of measurement obtained at each point along the cognitive ability continuum. Note that measurement precision is greatest between 0 and –1 logits, yet the average person targeted by the test is located at the opposite end of the distribution, at +1.2 logits. (b) Distribution of items (bottom bars) and persons (top bars) by location on the cognitive ability scale measured by the MoCA alone in the subset of 185 patients making up the current sample. (c) Distribution of items (bottom bars) and persons (top bars) by location on the cognitive ability scale measured by the MoCA and MMSE items combined in 185 patients. Diagonal-fill item bars represent items from the MoCA, and black item bars represent items from the MMSE. Note that this method of cognitive estimation allows for improved measurement precision and a wider range of possible scores, as detailed in the text.

Measurement precision is improved by adding to a test new items that fall within a difficulty range that is poorly covered by existing items. Unfortunately, adding to the length of a screening test is not an ideal approach due to time constraints. We noted that in the clinical context, the Mini-Mental State Examination (MMSE) and the MoCA are usually administered in series following the recommendations to administer a MoCA in a patient who presents with cognitive complaints but who obtains a score within normal limits on the less sensitive MMSE (Nasreddine et al., Reference Nasreddine2005). The MMSE as a whole is an easier test; however, it does contain some questions that we hypothesized would be helpful for filling gaps in the higher end of the cognitive difficulty spectrum, thus improving the precision with which we can measure cognition. Moreover, including MMSE responses that have already been collected in our estimate of cognitive ability would maximize the use of existing clinical data rather than adding to test burden. Thus the objective of the present study was to evaluate the extent to which precision in the quantification of cognition using the MoCA test would be improved by the addition of questions from the MMSE. Considering the desirability of minimizing assessment burden while optimizing measurement precision, we also evaluated a streamlined version of the dataset that included all of the items from the MoCA plus a select subset of items from the MMSE that best filled the gaps at the higher end of the cognitive continuum.
Methods
Design
This study compared the measurement precision obtained by estimating global cognitive ability using (1) responses to the MoCA test alone (MoCA), (2) combined responses to both the MMSE and MoCA (MoCA+MMSE), and (3) responses to the MoCA plus a subset of responses to the MMSE (MoCA+5), within the same sample of geriatric outpatients. For the MoCA+5 dataset we added to the MoCA responses only the five MMSE items that contributed information at the high end of the ability spectrum.
Sample and setting
This study, approved by the McGill University Health Centre (MUHC) Research Ethics Board, was conducted as part of a clinical epidemiologic research project designed to characterize the nature and extent of cognitive impairment observed in individuals attending geriatric assessment clinics at the MUHC. Following standard practice guidelines for the outpatient clinics, the MMSE is administered by clinic nurses or geriatricians to all patients referred either to the specialty Geriatric Cognitive Disorders Clinics or for comprehensive geriatric assessment where cognitive impairment is suspected. As recommended (Nasreddine et al., Reference Nasreddine2005), those patients who score at least 20/30 on the MMSE are subsequently administered the MoCA in either English or French, depending on the patient's mother tongue and preference. The MMSE allows the option of administering either the serial subtraction of 7s or the spelling of “world” backwards. Because of the potential overlap with the MoCA 7s subtraction item, our clinics administer “world” backwards on the MMSE. All data were coded in a clinical database.
Data collection
For this study, data were extracted from the clinical database for all patients to whom the MMSE and MoCA were administered on the same day between 1 February 2006 and 11 November 2007. Because of the additional requirement that both tests had to be administered during the same clinic visit, the resulting sample size for this study is 185 patients, representing a subset of the 222 patients analyzed in our previous study (Koski et al., Reference Koski, Xie and Finch2009). The following information was extracted: clinic site (Royal Victoria Hospital or Montreal General Hospital), sex, years of education, language of test (English or French), date of birth, date of test, diagnosis at time of test, and itemized test scores for the MoCA and the MMSE. Years of education were coded as low (elementary: 0–8 years), medium (secondary: 9–12 years), or high (post-secondary: 13+ years). Age was coded as ≤ 80 years and >81 years old.
Each patient had a diagnosis recorded by the geriatrician at the time of the visit. The diagnosis was made according to DSM-IV criteria for dementia (Amercian Psychiatric Association, 2000) and revised criteria for mild cognitive impairment (MCI; Petersen, Reference Petersen2004) based on a clinical evaluation that included a full chart review, history, physical examination, assessment of basic and instrumental activities of daily living, blood tests, brain CT, as well as the results of the cognitive screening tests. The recorded diagnosis was classified for the purposes of this study as Dementia (any type), Mild Cognitive Impairment without dementia, and Normal (cognition within normal limits). Cases in which a definitive determination between MCI and dementia had not yet been made by the clinician were classified as Cognitive Impairment Unspecified. Cases in which cognitive impairment was attributed to a primary psychiatric impairment were classified as Psychiatric. The remaining cases were those for which no diagnostic information relevant to cognition was recorded.
All of the individual items from the MoCA were scored dichotomously (0 or 1) except serial subtraction of 7s, which was coded as a single 4-option item with a range of 0 to 3 points. Most of the MMSE items were scored dichotomously, excepting 3-word repetition, 3-word recall and 3-step command (all 4 options, range: 0 to 3), and “world” backward (6 options, range: 0 to 5). The questions evaluating orientation to year, month, date, day of week, place, and city are identical for the two tests so only the results obtained during the MoCA assessment were retained in the dataset.
Statistical analysis
Frequency counts, means, standard deviations, and ranges were used to characterize the patient sample on demographic and clinical variables, with cross-tabulation to assess the distribution of patients on demographic variables. The use of a total score to quantify cognitive ability requires that the scale is unidimensional. The validity of this assumption was verified for each of the three datasets using RUMM2020 software (RUMM Laboratory Pty. Ltd.), according to procedures described previously (Koski et al., Reference Koski, Xie and Finch2009). To address our primary objective, we compared the distribution of items within the difficulty hierarchy for the MoCA dataset and the MoCA+MMSE dataset, identifying locations in the cognitive continuum for which the MMSE provided added precision. The five MMSE items that contributed to the high end of the difficulty hierarchy were added to the MoCA data to build the MoCA+5 dataset. For both the MoCA+MMSE and the MoCA+5 datasets, the change in the standard error of the cognitive ability estimate compared with the MoCA dataset was calculated for each patient and averaged across the sample to yield an estimate of improvement in measurement precision. Paired t-tests were used to evaluate the significance of the change, and mean change scores are reported with 95% confidence intervals in parentheses. To evaluate the improvement in measurement precision obtained for different cognitive ability levels, the patient sample was divided into quartiles to evaluate the improvement in measurement precision obtained with the MoCA+MMSE dataset and with the MoCA+5 dataset. Finally, we also compared measurement precision obtained with the three methods in different diagnostic subgroups.
Results
Description of the sample
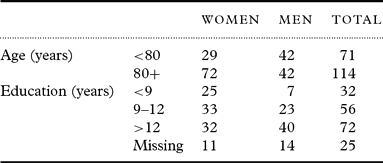
Of the 185 patients extracted from the database, 62% were more than 80 years of age and just over half the sample (55%) was composed of women. Educational level was less than 9 years for 17%, 9–12 years for 30%, more than 12 years for 39%, and missing for 14% of the sample. Table 1 shows the distribution of sex by age and by education. Cross-tabulation of sex by age and by education showed that women tended to be older (Pearson χ2 = 8.8, df = 1, p = 0.003) and less well educated (χ2 = 11.7, df = 3, p = 0.008) than the men. Women comprised 65% of the sample with an age of 80 or more years but only 41% of those below 80 years of age. Women represented 78% of those with fewer than 9 years of formal education, whereas the distribution of women and men was more equal for higher levels of education. The test language was English for 71% of the patients, with the remaining 29% tested in French. Test language showed a similar distribution across age, sex, and education.
Demographic frequency distributions of the patient sample

The total score out of 30 ranged from 17–30 (mean 26.2; SD 2.6) for the MMSE and 9–30 (mean 19.7; SD 4.2) for the MoCA. The clinical diagnosis at time of testing was Normal in 10.3%, Mild Cognitive Impairment in 35.1%, Cognitive Impairment Unspecified in 13.5%, Dementia in 31.4%, Psychiatric disorder in 6.5%, and missing in 3.2% of the sample.
Confirmation of unidimensionality
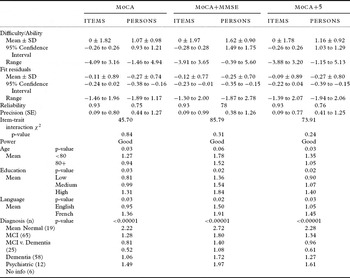
Both the MoCA and the MoCA+MMSE datasets showed good fit to a unidimensional Rasch model after correction for disordered thresholds and underused response categories for polytomous items (MMSE 3-word repetition 1 for 3 correct, or 0 for < 3 correct; 3-word recall 0 for 0 correct, 1 for 1–2 correct, or 2 for 3 correct; world backward 0 for 0 correct, 1 for 1–4 correct, or 2 for 5 correct; subtract 7s 0 for 0 correct, 1 for 1–2, 2 for 3–4, or 3 for 5 correct). Table 2 presents the item fit statistics, reliability and precision of estimates, and power of the test-of-fit for the MoCA and the MoCA+MMSE datasets. All individual items fit the model within the cut-off of +/−2.0 used to identify misfitting items based on standardized residuals (Wolfe and Smith, Reference Wolfe and Smith2007), and the non-significant χ2 statistic (p > 0.05) indicates good global fit to the unidimensional Rasch model for each of the three datasets. Power to detect items that did not fit the model was considered “good” given the spread of persons across the hierarchy of ability, and the estimates of internal consistency were acceptable (person-separation index ≥0.75). The mean estimate of cognitive ability is +1.07 logits for the MoCA (20.1 out of 28 points) and +1.62 logits for the MoCA+MMSE (33.6 out of 45 points).
Summary statistics for fit to a Rasch model, with mean ability scores by demographics

“Difficulty” = the position of an item within the hierarchy of difficulty; “Ability” = the position of a person within the population tested; Reliability of Persons = the person separation index; Power = power of the test-of-fit statistics to detect misfit; P-value is for the one-way ANOVA assessing effect of age, education, language of testing, and diagnosis (cut-off criterion p = 0.05, uncorrected).
Principal components analysis of the residuals from each dataset revealed evidence of only very weak multidimensionality. The first component in the residuals for each dataset accounted for ≤10% of the variance (MoCA: 10.1%, MoCA+MMSE: 7.7%, MoCA+5: 9.0%), was observed to correlate positively (>0.4) with performance on the recall questions, and was interpreted as the memory factor identified previously for the MoCA (Koski et al., Reference Koski, Xie and Finch2009). A second component accounting for ≤7% of the variance in each dataset correlated with items involving sentence comprehension (MoCA sentence repetition and MMSE 3-step command).
One-way ANOVAs were used to evaluate the impact of demographic variables on cognitive ability estimates obtained from each method. Cognitive ability estimates were affected significantly by age, educational level, and test language (Table 2). The age and education effects have been reported previously for the MoCA test (Nasreddine et al., Reference Nasreddine2005; Duro et al., Reference Duro, Simoes, Ponciano and Santana2009; Hanna-Pladdy et al., Reference Hanna-Pladdy, Enslein, Fray, Gajewski, Pahwa and Lyons2010); however, the language effect was unexpected and was explained by the fact that patients whose first language was not English or French were more likely to be administered the screening tests in English than in French. Cognitive ability estimates obtained from the MoCA+MMSE dataset were not significantly affected by the sex of the patient (p = 0.47). Cognitive estimates declined when moving across the diagnostic categories of cognitively normal, MCI, Cognitive Impairment Unspecified, and Dementia (see Table 2). Differential Item Functioning (DIF) related to age, sex, education, or test language was investigated using two-way analyses of variance (ability level by factor) and found to be non-significant for all items (p-value >0.05, Bonferroni corrected).
Contribution of MMSE items to the item hierarchy and measurement precision
Figures 1b and 1c show the distribution of the test items (downward bars) and of the people (upward bars) across the continuum of cognitive ability for the MoCA dataset (Figure 1b) and the MoCA+MMSE dataset (Figure 1c). The black-filled bars under the x-axis in Figure 1c show how the MMSE items slot into the item difficulty hierarchy for the MoCA.
The information function for the MoCA+MMSE (line plotted on upper bars of Figure 1c) shows a broader distribution than the information function for the MoCA alone, with peaks at −1 and +1 and a more gradual decline into the higher ranges that represent the ability of the majority of our population. This indicates that the addition of MMSE items improved measurement precision across a range of abilities. One patient's ability could not be estimated accurately because he obtained a perfect score on all items. Upon exclusion of this patient, the standard errors for the MoCA dataset showed a mean of 0.49 (0.48–0.50) and a range of 0.44−0.74, whereas the standard errors for the MoCA+MMSE dataset had a mean of 0.41 (0.42–0.43) and a range of 0.38–0.71. This represents a 13.8% (13.3–14.3%) reduction in measurement error when adding information from the MMSE to the MoCA. The greatest reduction in measurement error was observed for people with a dementia diagnosis (14.9%, 14.0–15.9%); however, significant improvements in precision were also observed in those with MCI (13.3%, 12.6–14.1%), normal cognition (13.0%, 11.2–14.9%), and in those classified as Cognitive Impairment Unspecified (13.6%, 12.7–14.4%).
Unsurprisingly, most of the MMSE items contribute to measurement in the low end of cognitive ability spectrum, from −3.9 to −1.0 logits. Nevertheless, we find that some MMSE items provide additional information for estimating cognitive ability in the higher ranges of cognitive ability. In terms of difficulty, recalling all three words on the MMSE (+2.516) falls between the Cube copy (+2.298) and the easiest Recall item of the MoCA (+2.661). The copy of the intersecting pentagons on the MMSE (+1.324) falls between Naming a rhino (+1.230) and the threshold for obtaining 2 vs. 3 points on Serial 7s (+1.409). Repeating a sentence (+1.006), at least one correct response on spelling “world” backwards (+0.662), and recalling at least one of the three words (+0.611) provide additional information in the range from 0 to 1.0 logits. These were the items selected for inclusion in the MoCA+5 dataset.
The columns on the far right of Table 2 summarize the item and person statistics and fit to the Rasch model for the MoCA+5 dataset. The mean ability estimate obtained with the MoCA+5 dataset is +1.16 logits, or 24.1 out of a maximum possible score of 35 points. Comparison with the mean ability estimates obtained from the other estimates reveals improved targeting of the population when only the five more difficult MMSE items are added to the MoCA than when using all items from both tests. The addition of just five MMSE items to the MoCA data resulted in a 9.3% (8.8–9.7%) reduction in measurement error over the standard MoCA dataset. The greatest improvement in measurement precision over the MoCA alone was observed for those patients classified as cognitively normal (10.3%; 8.3–12.3%) or MCI (9.7%; 9.1–10.4%), with slightly lower but still significant improvements in patients with a diagnosis of dementia (8.9%; 8.1–9.7%).
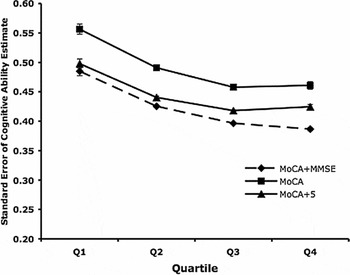
Figure 2 presents a graphical display of the measurement precision (mean standard error) obtained in each quartile from each method. The addition of MMSE items to the MoCA data yielded an improvement in precision of the person ability measurements in all quartiles of the patient distribution. Improved precision was also seen when only five MMSE items were added. This benefit could be seen not only for patients with higher cognitive ability (Quartile 1) but across all ability quartiles (all p < 0.00001).
Mean measurement error (standard error of the cognitive ability estimate) associated with each of the three methods of cognitive estimation. The standard error of the mean, shown in error bars, is minimal. MoCA = MoCA alone; MOCA+MMSE = the combined dataset from both tests, excluding identical questions; MoCA+5 = the MoCA items plus the five most difficult MMSE items. The x-axis labels, Q1 through Q4, indicate quartiles of patient ability. Improvements in measurement precision relative to MoCA alone are seen in all quartiles for both of the alternative methods of cognitive estimation (p < 0.001).

Discussion
The principal finding of this study was that global cognitive ability can be estimated with greater precision when information from the MoCA and the MMSE is combined. From our previous work, it was known that items from the MoCA test alone fit a unidimensional Rasch model (Koski et al., Reference Koski, Xie and Finch2009) and could thus serve the purpose of quantifying cognition. However, we observed weaker measurement precision in the higher ranges of cognitive ability where the importance of accurate estimation is arguably the most important. With this study, we present a method of correcting this limitation by integrating information obtained from testing with the MMSE. The addition of the MMSE items led to a significant reduction in measurement error throughout the continuum of cognitive ability, as compared with the MoCA alone. The method presented here yields more precise estimates of cognitive ability than those obtained from the MoCA alone, yet entails no added test burden in geriatric clinics where the recommended procedures are followed for screening with the MMSE and the MoCA. We also presented a streamlined version of the method in which only the responses to five MMSE questions can be integrated with the MoCA for improved measurement precision in the higher end of the cognitive ability continuum at minimal cost. The outcome is a method for quantifying cognition that is more sensitive to change than that provided by the MoCA alone. The clinical impact in terms of tracking cognitive decline and response to interventions will be greatest for patients with milder impairment, whose level of ability is targeted by relatively few items, yet whose at-risk status makes them an ideal target for interventions aimed at preventing or slowing the onset of dementia.
Previous investigations into dimensionality of the MMSE had yielded conflicting results (Tennant et al., Reference Tennant2004; Elhan et al., Reference Elhan2005; Schultz-Larsen et al., Reference Schultz-Larsen, Kreiner and Lomholt2007). Therefore, before adding MMSE items to the calculation of cognitive ability, we had to demonstrate that the combined MoCA+MMSE dataset still showed good fit to a unidimensional Rasch model. The difficulty hierarchy identified for the MMSE was similar to that obtained in a recent study in which Rasch analysis was conducted on the MMSE, the Alzheimer's Disease Assessment Scale–Cognitive, and the Cambridge Cognitive Assessment (CAMCOG) data obtained in several clinical trials (Wouters et al., Reference Wouters, Gool, Schmand, Zwinderman and Lindeboom2010). The goal of that study was to fit all items to a common dimension of global cognitive impairment to allow comparisons of results across trials that use different outcome measures. Consistent with our observations for the MoCA, the authors observed that measurement precision provided by the MMSE was poorer for persons of higher ability. The MMSE items of greater difficulty as identified by Wouters et al. (Reference Wouters, Gool, Schmand, Zwinderman and Lindeboom2010) were similar to those identified here, including 3-word recall and design copy. Also identified as more difficult were orientation to time (date and day of the week) and serial 7s, which were considered as part of the MoCA in the present study.
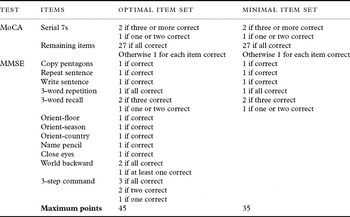
Having proposed and validated a method for improving precision in measuring and tracking cognitive ability in geriatric outpatient populations, we also demonstrate how to apply this method for clinical use. One of the strengths of the proposed approach lies in maximizing the measurement yield of available clinical data, since clinics that use the MoCA will usually have screened first with the MMSE. Table 3 presents an algorithm for calculating points obtained by an individual patient that can be summed together to yield an estimate of cognitive ability, where the maximum possible is 45. This number could be converted to a percentage score that will behave like a ruler with interval-like spacing for the purposes of describing differences in cognitive ability between groups or for monitoring cognitive ability over time. Alternatively, if both tests (MoCA and MMSE) are not already administered as part of the normal screening process, and if the population under study is relatively high functioning, one might choose to administer only the small subset of MMSE items that fill known gaps in the upper end of the MoCA continuum (see right-hand section of Table 3). This would save time when estimating cognitive ability while better targeting the ability level of the mildly impaired population.
Algorithms for calculating cognitive ability estimate

It must be emphasized that the score calculated from this method is an estimate of global cognitive ability with good precision for the purposes of comparing patients or tracking changes over time: It has not been validated as a tool to screen for cognitive impairment. The design of this study does not permit the establishment of cut-off scores that could be used to screen for cognitive impairment because the clinical diagnosis that might be used to validate severity of cognitive impairment was based on criteria that incorporated knowledge of the screening test scores. The screening cut-offs currently in use for the MoCA and/or MMSE might continue to be used to the extent that they are valid for the population in which they are used; however, for quantitative comparison of patients or tracking change in an individual patient over time, the methods we present will yield more psychometrically sound estimates of cognition than the total score that is used for screening purposes.
A limitation of the proposed approach is that it was developed using data from patients attending a cognitive specialty clinic who may differ from older persons living in the community in terms of the memory contribution to global cognition. Indeed, the principal components analysis of the residuals revealed a tendency for the memory items to behave somewhat independently of the test items as a whole. Of note, one previous study in a similar population conducted a confirmatory factor analysis that supported a two-factor model of the MoCA, consisting of separate factors for memory and attention/executive functions (Duro et al., Reference Duro, Simoes, Ponciano and Santana2009). However, the residual component in the current study accounted for less than 10% of the variation in the residuals. Moreover, it is essential to note that the estimates of unidimensionality in the test items as a whole were acceptable. Cognition is constructed from the operation of many different mental functions. Nevertheless, the results of the Rasch analysis support the validity of the construct of global cognition. With this study we have demonstrated that combining responses to the MMSE and the MoCA optimizes measurement precision in the estimates of cognitive ability obtained for geriatric patients.
Conflict of interest
None.
Description of authors' roles
Lisa Koski was responsible for the concept and design of the study, data analysis and interpretation, and preparation of the paper. Haiqun Xie and Susanna Konsztowicz contributed to data collection and analysis, and contributed to the content of the paper.
Acknowledgments
We acknowledge the help of Roslyn Tetteh, Rebecca Sussex, and Aisha Bassett with database management and proofreading of this paper. Funding was provided by the Hutchison Foundation, a private foundation dedicated to funding geriatric research. An award from this foundation was used to support clinical database management, data entry and statistical consulting.