


Introduction
The predominant atmospheric circulation in the arctic ocean forces the world’s thickest, oldest Sea ice against the northwestern edge of the queen elizabeth islands (qei), nunavut, canada (Reference Agnew, Alt, de Abreu and JeffersAgnew and others 2001; Reference Jeffers, Agnew, Alt, de Abreu and McCourtJeffers and others 2001; Reference MellingMelling 2002). ice in the channels of the qei facing the arctic ocean (fig. 1) normally remains consolidated most of the time, acting as a barrier to this thick old ice. in 1998, an extremely warm year in the qei, the whole northwestern edge of the qei consolidated ice barrier broke. previous Studies have examined the conditions that led to these events, their relationship to the longterm mean, and the initial recovery of the ice regime (Reference Agnew, Alt, de Abreu and JeffersAgnew and others, 2001; Reference Jeffers, Agnew, Alt, de Abreu and McCourtJeffers and others, 2001; Reference MellingMelling 2002; Reference Howell and YackelHowell and yackel, 2004; Reference AtkinsonAtkinson and others, 2006; climate change action fund Summer 1998 project team, http://www.socc.ca). these Studies Showed 1962, 1981 and 1998 as the extreme minimum Sea-ice Summers within the 40 year record, although only in 1962 and 1998 did both the Sverdrup channel and nansen Sound ice plugs disappear. the nature of these plugs, investigated by Reference sersonSerson (1972, Reference Serson1974) and Reference Jeffries and ShawJeffries and Shaw (1993), is discussed in Reference Jeffers, Agnew, Alt, de Abreu and McCourtJeffers and others (2001). the Summer of 1998 was not only anomalously warm, but this warming lasted until the end of october, resulting in the Seasonal Sea-ice minimum in the 40 year record (28 September). initial recovery from the 1998 light ice year did not appear to be as rapid as that Seen after previous light ice years. these Studies also found that relationships to atmospheric and ocean circulation tended to be complex.
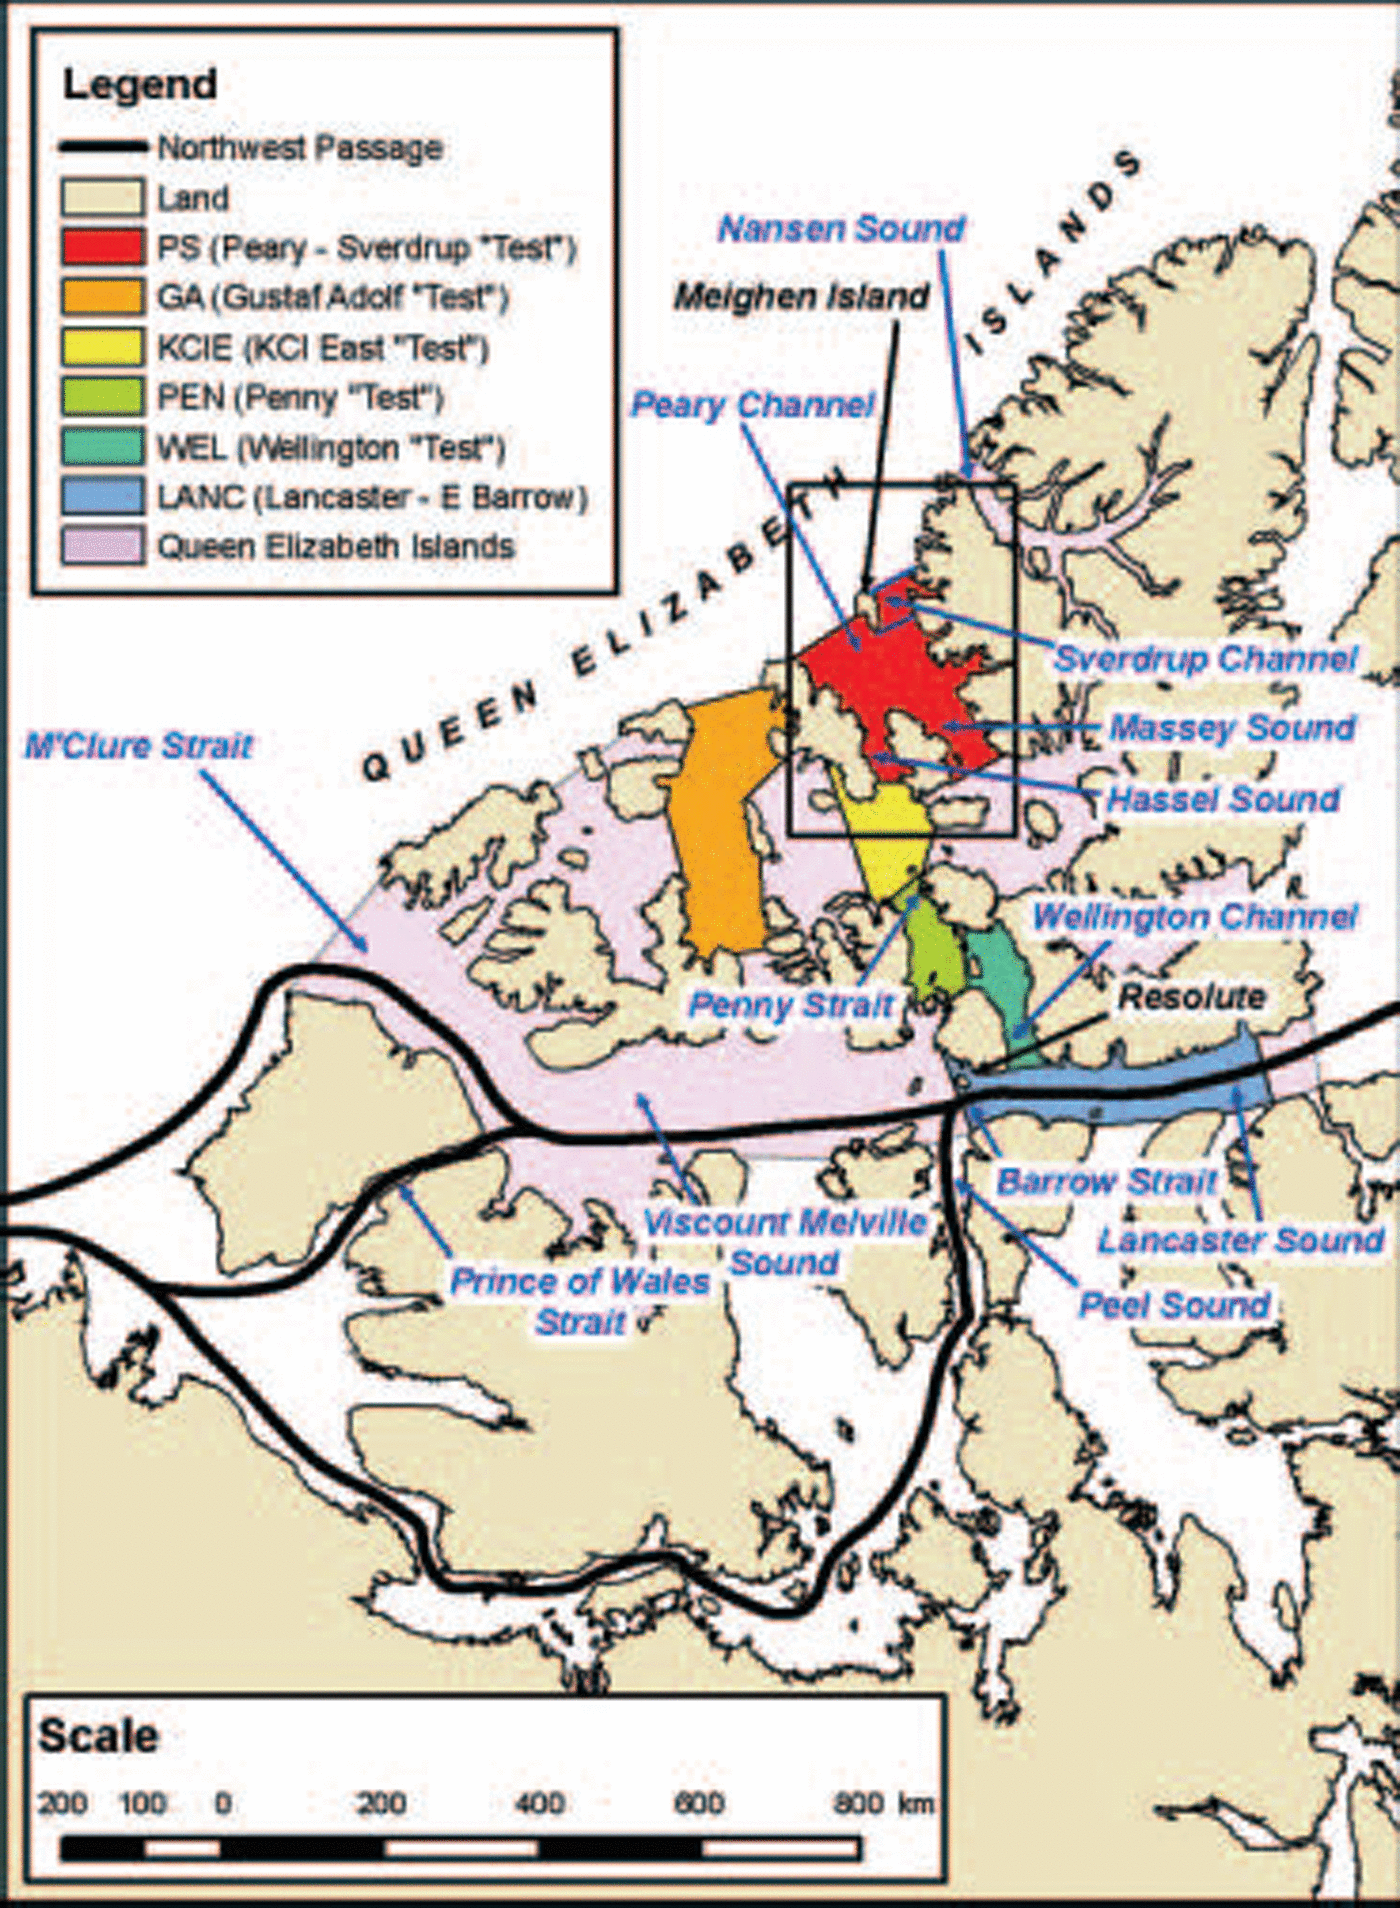
Location map, Showing the case-study focus: Peary–sverdrup ‘test’ Subregion (Ps in red); additional ‘test’ Subregions: Gustaf Adolf (GA in orange), King Christian Island East (KCIE in yellow), Penny (PEN in green) and Wellington (WEL in blue-green), as well as the Subregion Lancaster–E Barrow (LANC in blue); the Queen Elizabeth Islands area (QEI) constructed for the present Study from CIS-IRR regions (QEI area in light purple includes all the coloured Subregions); and main Northwest Passage routes (Peel Sound, Prince of Wales Strait and M’Clure Strait). The Sverdrup Plug fills northern Sverdrup Channel, and the Nansen Plug fills northern Nansen Sound. The black rectangle centered over Meighen Island Shows the extent of the RADARsAT images (Figs 7–9).
In his detailed review of Sea-ice conditions in the qei, melling (2002) proposes a three-phase cycle of ice movement through Sverdrup basin which lasts 2–5 years in the west and may be more rapid in the east. ice mobility in the inter-island channels has been examined by tracking ice islands (Reference GreenawayGreenaway, 1952; Reference BlackBlack, 1965; Reference Jeffries and ShawJeffries and Shaw 1993; j.r. marko, unpublished information) and by use of ice charts and Satellite images (j.r. marko, unpublished information). their findings are Summarized by melling (2002). Reference Howell and YackelHowell and yackel (2004), examining the navigability of the western portions of the northwest passage, Show that in 2001, 3 years after the light Summer of 1998, old ice invaded western parry channel.
This case Study focuses on the area of the Sverdrup plug and peary channel and offers comparisons to the prince gustaf adolf Sea barrier area to the west and the qei inter-island areas to the South (fig. 1). the case Study quantifies the amount and timing of the import, export and through-flow of old ice in the months and years following the 1998 break-up of the Sverdrup plug and the consolidated ice barrier in peary channel. it examines the recovery of the old-ice regime from the light ice Summer of 1998 and estimates the relative importance to this recovery of old ice imported from the arctic ocean vs old ice formed in Situ. it also updates long-term qei time Series to 2005 and examines the events of 2005 relative to the case-study results. the Study combines quantitative evaluations from the canadian ice Service (CIS) digital archive–regional charts with detailed analysis of radarsat imagery and results from the cis ice-motion algorithm (tracker).
Data and Methodology
CIS Digital Archive and ice-coverage parameters
The cis digital archive–regional charts, created by digitizing the weekly operational regional charts (1968–present), essentially integrates all available real-time remote-sensing information combined with Surface observations, airborne and Ship reports, operational model results and the expertise of experienced ice forecasters. the database, updated in near-real time, is available through cis. in the present Study, multi-year ice and Second-year ice are combined into the old-ice Stage of development due to inhomogeneities in the record (Reference MellingMelling 2002; Reference Howell and YackelHowell and yackel, 2004; cis, http://ice.ec.gc.ca/ia_doc/cisads_no_001_e.pdf).
Total accumulated coverage (TAC), defined as the Sum of weekly coverage values (concentration×area), is a robust parameter. by Summing the ice coverage for the whole Summer period, the effect of errors in Single charts is ameliorated. the danger with analysis of a Single chart-week was found in earlier Studies derived from the database. all the total accumulated coverage values used in the present Study are for the 17 week Season 25 june–15 october (Reference Falkingham, Chagnon and McCourtFalkingham and others, 2001; CIS, 2002; personal communication from G.B. crocker, 2002). for the 37 year cis record (1969–present), TAC can be calculated for the total ice concentration (ct) (fig. 2a and b) or for partial concentrations of individual ice types (e.g. old ice, fig. 3). the ‘test’ Subregions (see below) used in the present Study are very Small and have questionable information in early years, So even TAC time Series cannot be used for trend analysis (figs 2b and 3). errors in identifying Stage of development/ice type (e.g. old ice interpreted as first-year ice during the digitizing process) in 1971 have been corrected. homogeneity Studies found that concentration values, particularly of old ice, were overestimated on the regional charts during the pre-satellite period 1969–71 due to lack of information. these concentrations Should be 2–5% lower than those Seen in the time Series from the remote Subregions of the high arctic. the results are presented as Standardized anomalies for the period 1969–2005.
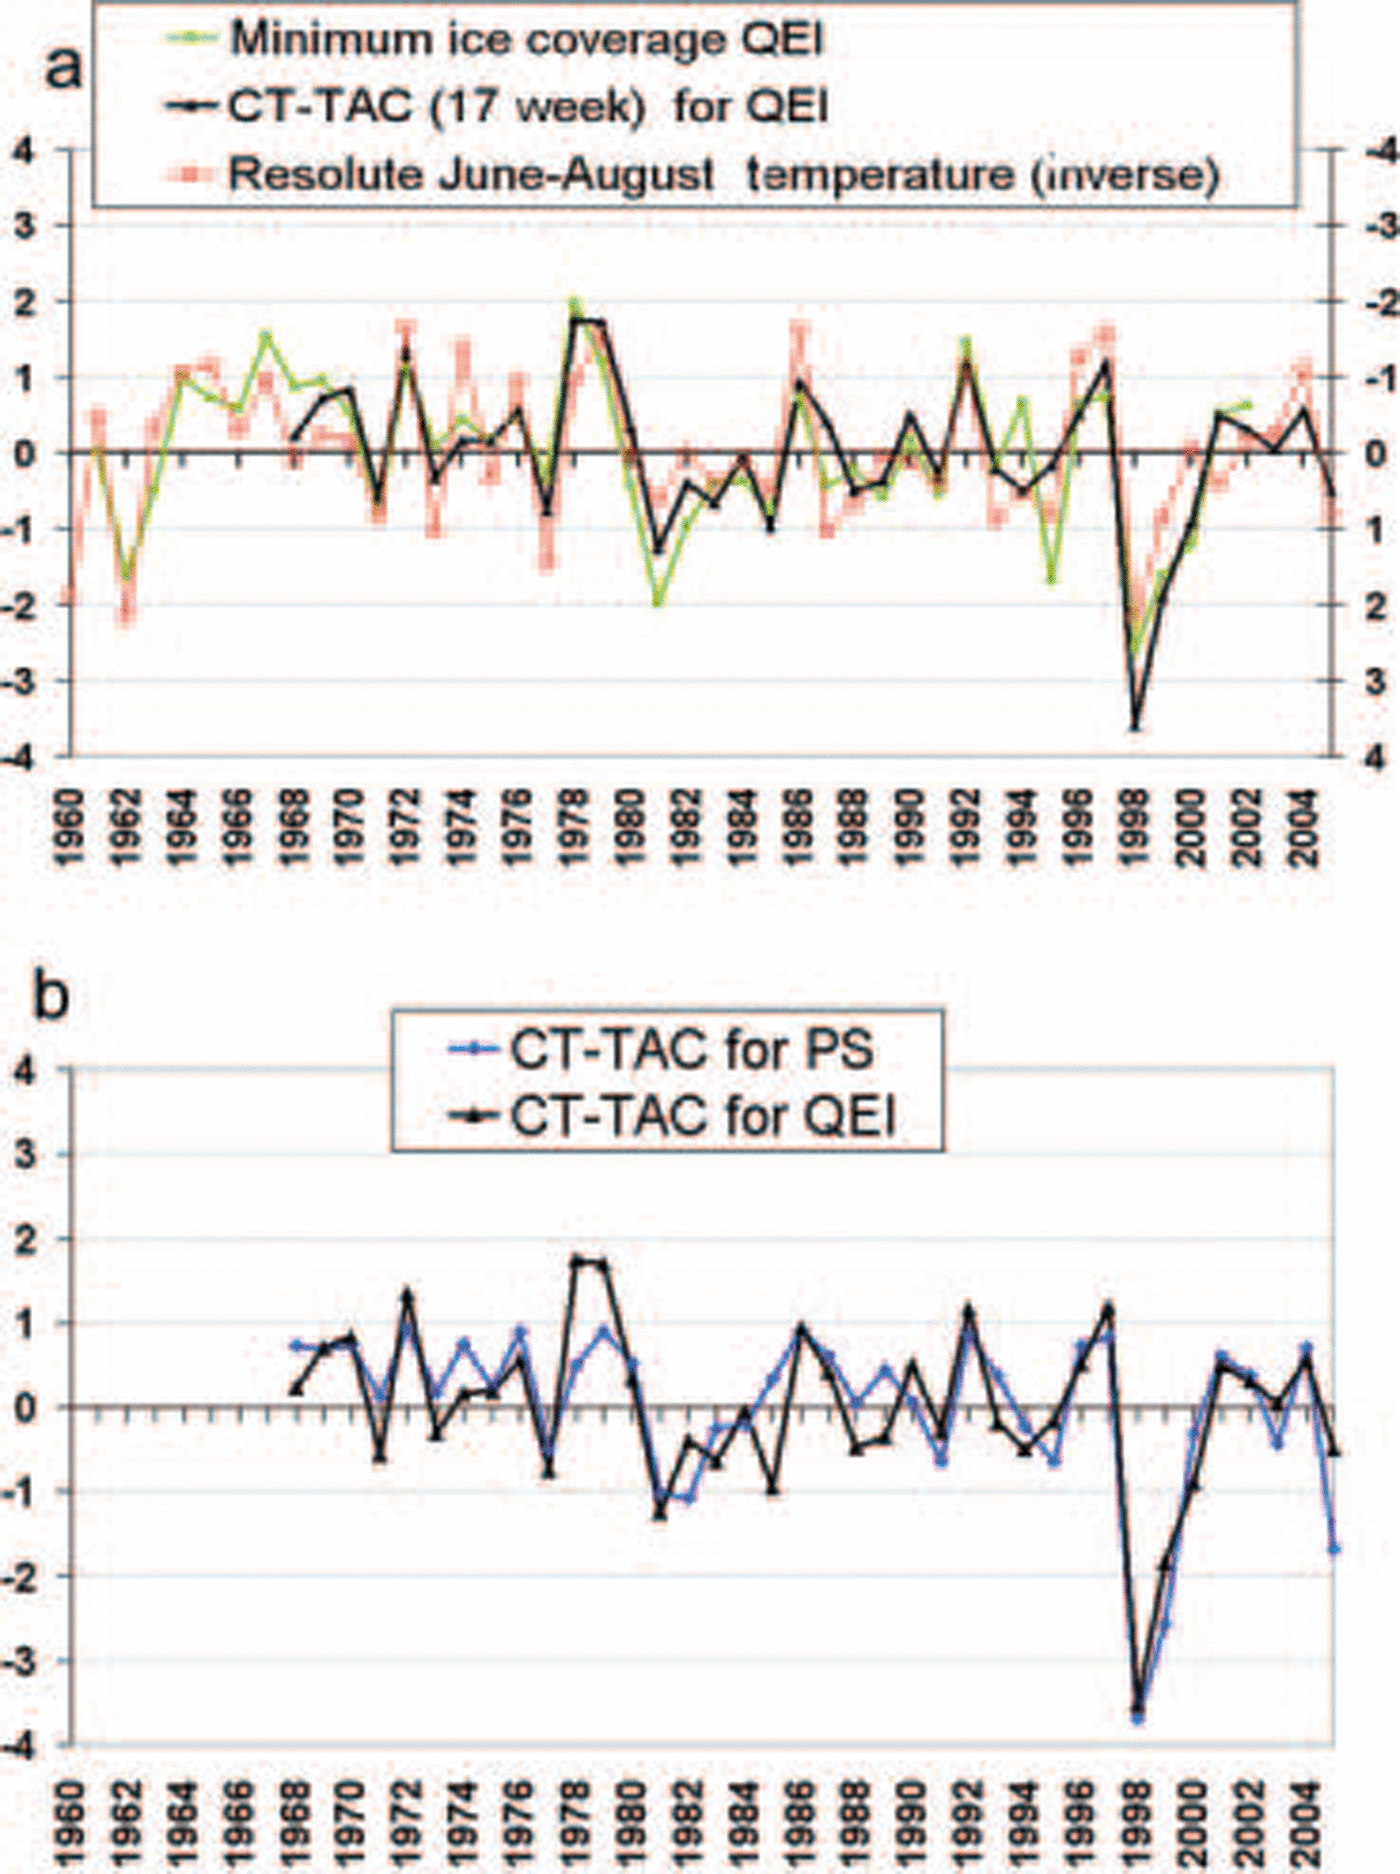
(a) Green curve: 42 year (1961–2002) composite (CIS/Polar Continental Shelf Project) time Series of minimum ice coverage for QEI area (R 2 = 0.0666). Red curve: Resolute Summer (June–August 1960–2002) temperature inverted (R 2 = 0.0042). Black curve: CIS 37 year (1969–2005) time Series of 17 week total accumulated coverage for total ice concentration (CT-TAC; R 2 = 0.12310). Time Series are expressed as Standardized anomalies (1969–2005). (b) CIS 37 year (1969–2005) time Series of 17 week CT-TAC (26 June–15 October) for the Study area Ps (blue curve) compared to the whole QEI (black curve). Time Series are expressed as Standardized anomalies.
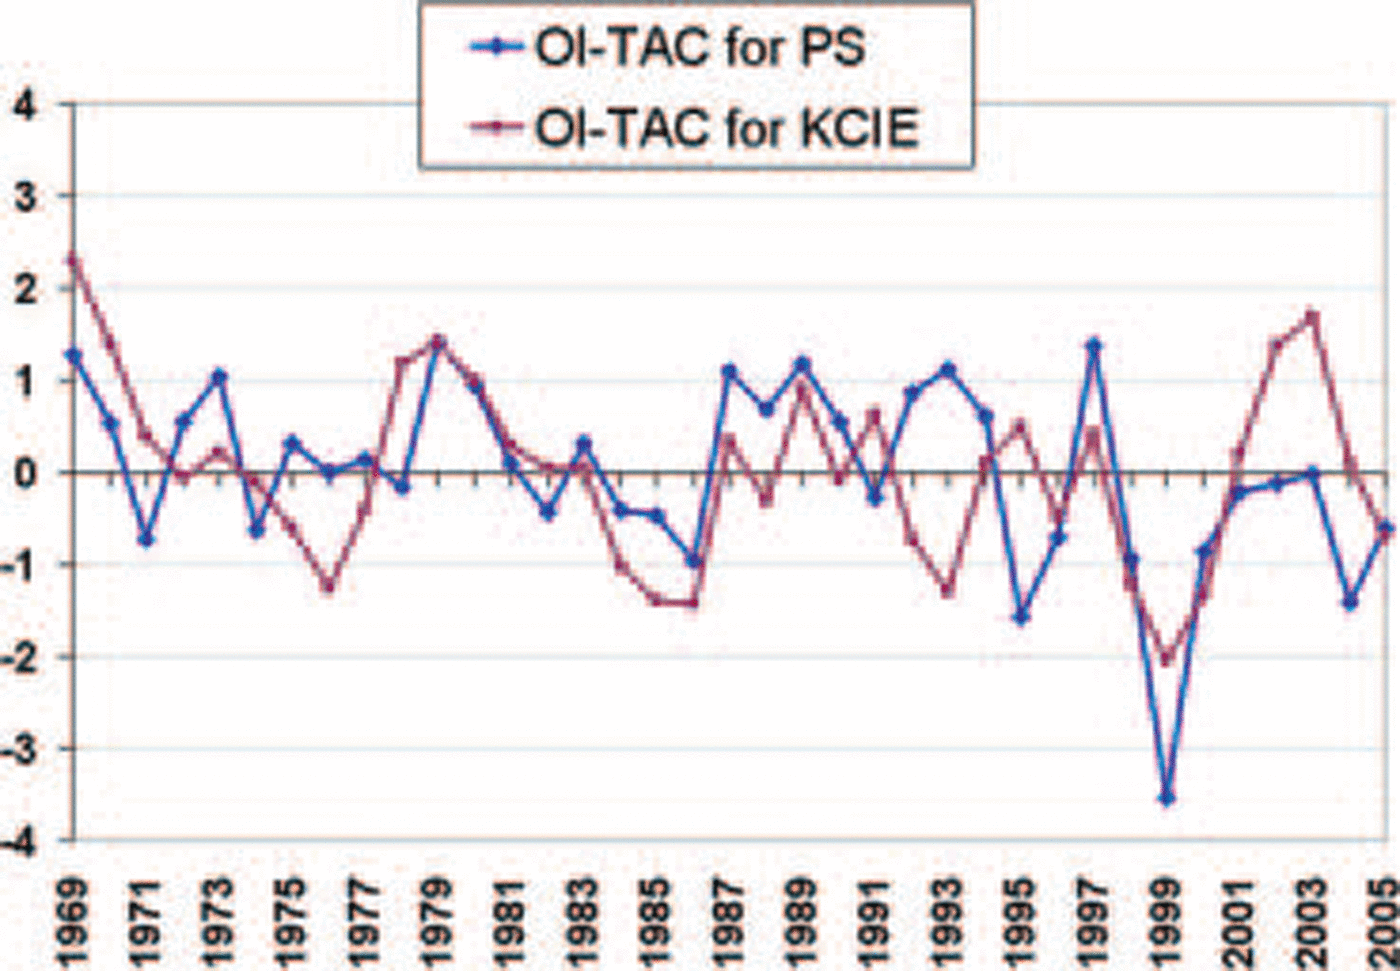
Cis 37 year (1969–2005) time Series of 17 week TAC for old ice (OI-TAC) for Ps (blue curve) and KCIE (burgundy curve). Time Series are expressed as Standardized anomalies. Errors in the Stage of development (old ice interpreted as first-year ice during the digitizing process) in 1971 have been corrected, but the 1969–71 old-ice (and possibly total concentration) values were found to be too high. The OI coverage (and total coverage) for the early years are overestimated due to lack of information on the regional charts. A correction of 2–5% Should be applied to the years 1970–71.
A 42 year time Series (fig. 2a) for minimum ice coverage has been constructed by combining the cis digital archive minimum ice with manual evaluations for the first decade (from the polar continental Shelf project ice atlas (Reference LindsayLindsay, 1975)). minimum ice is a less robust parameter than total accumulated coverage, as it is based on the chart for the week Showing the least ice (most open water) each year. this Single week varies from year to year and may not be representative of the conditions in all parts of the qei. the errors associated with this time Series are discussed in Reference Agnew, Alt, de Abreu and JeffersAgnew and others (2001).
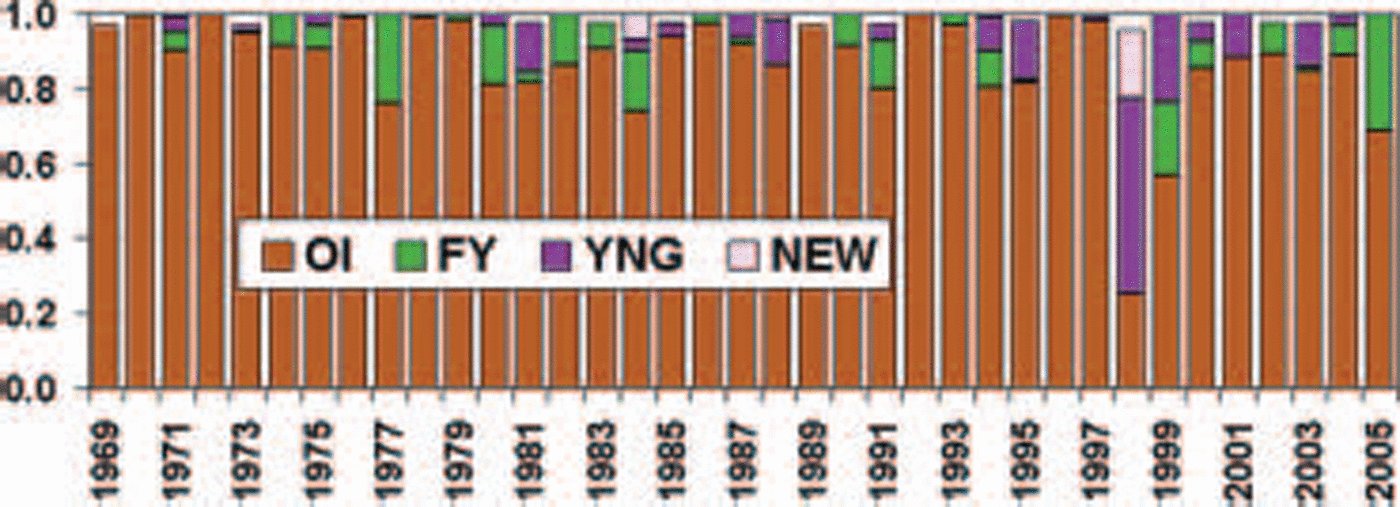
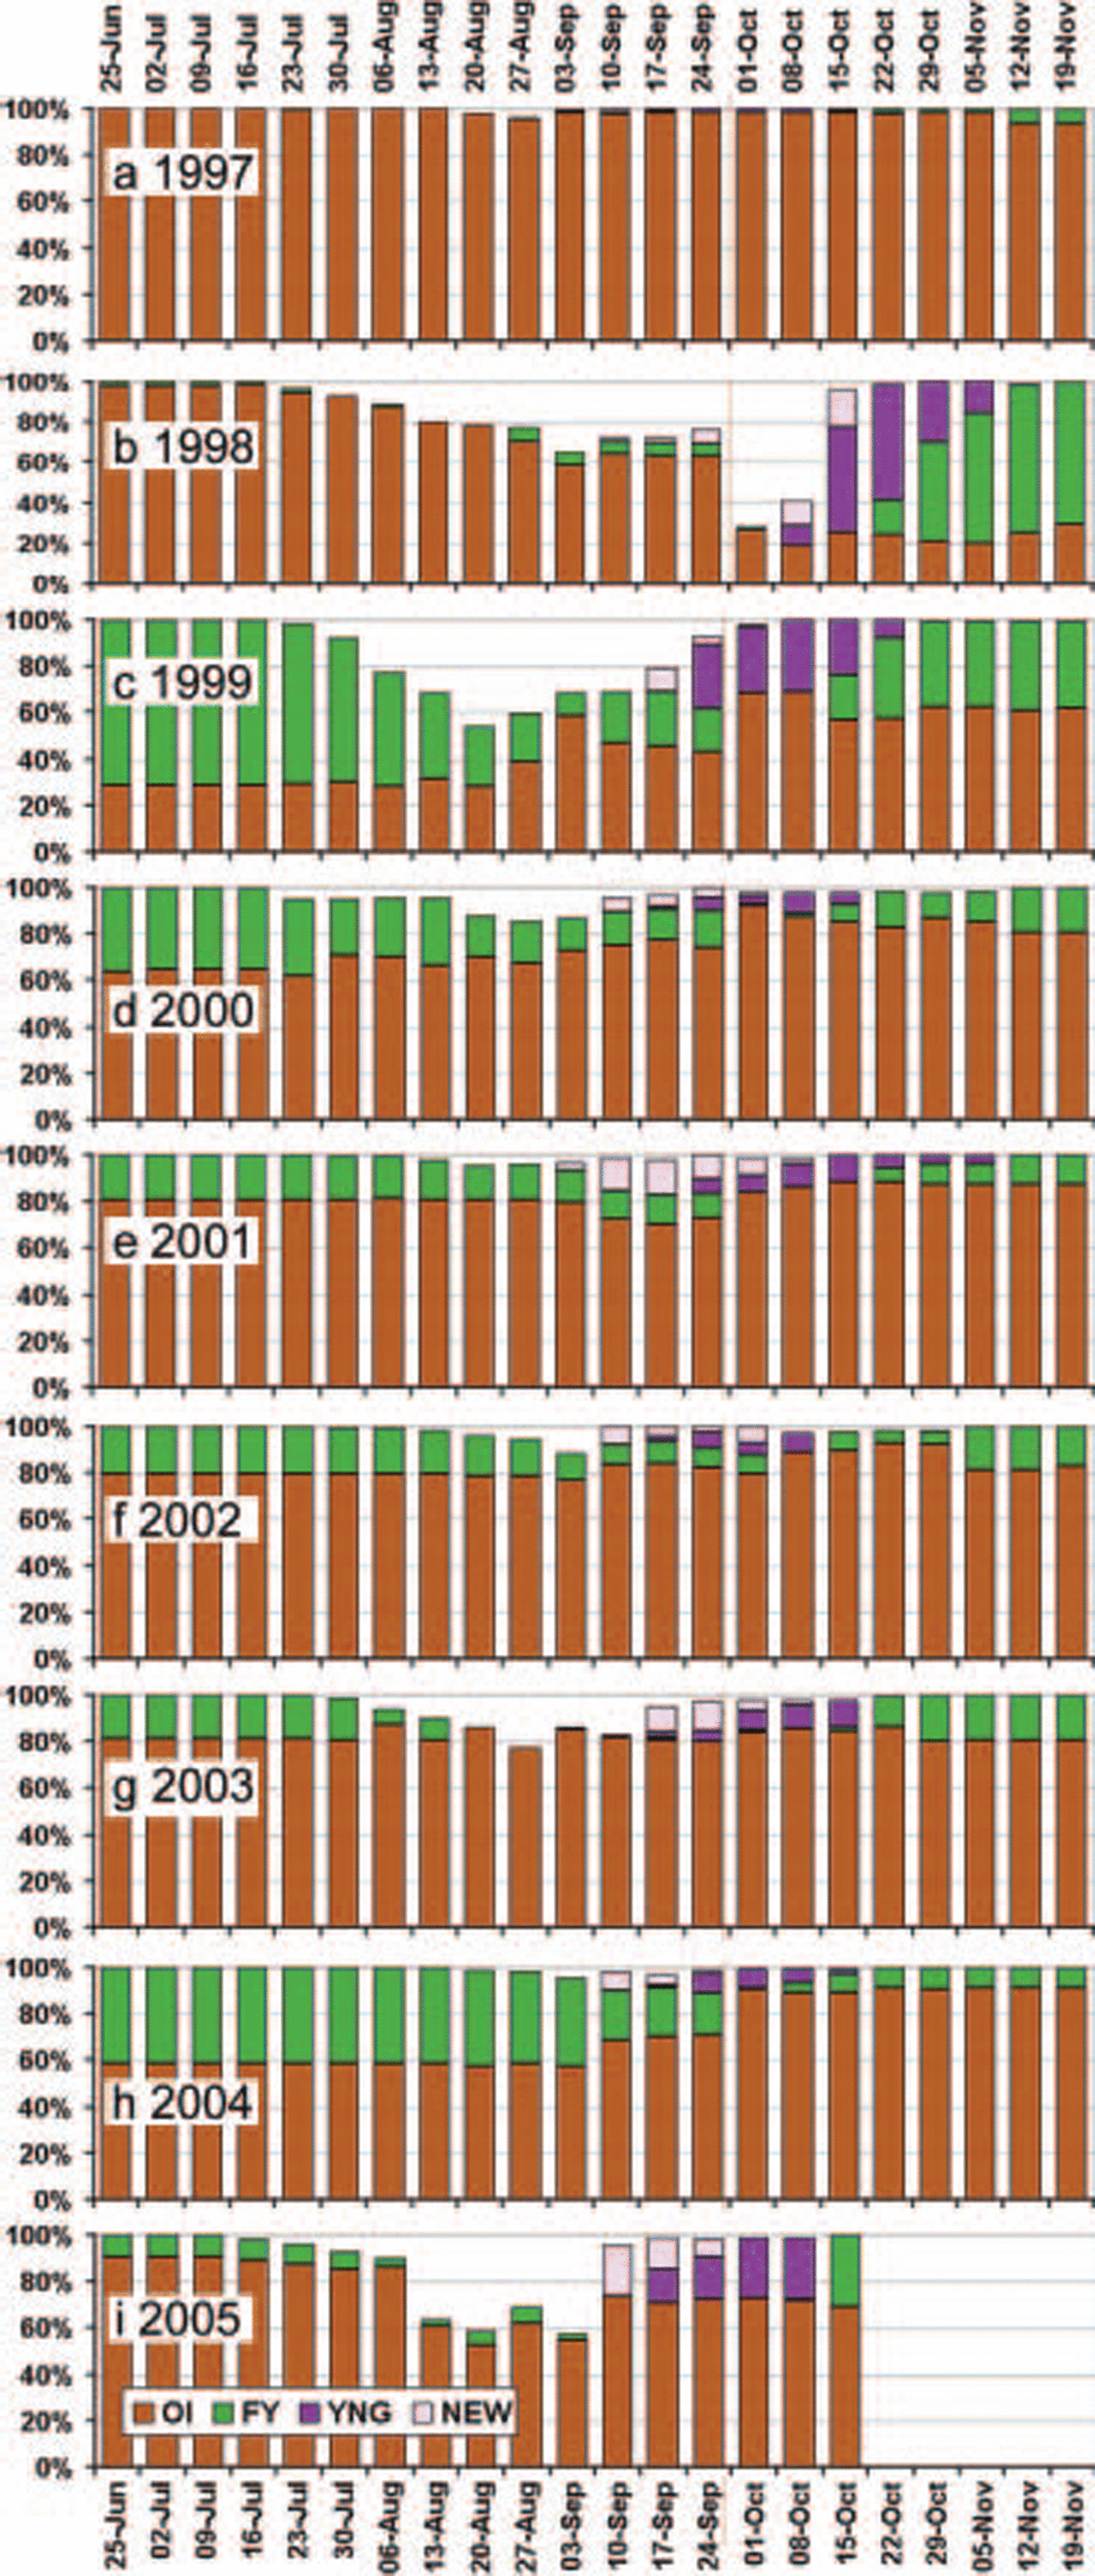
Time Series of partial concentrations of old ice, first-year ice, young ice and new ice for individual weeks (fig. 4) are also not as robust as the accumulated Seasonal tac. they are Suspect in early years and Should definitely not be used for trend analysis. the progression of weekly partial ice concentrations for the years 1997–2005 (figs 5 and 6) are from the radarsat era and are thus expected to be Sufficiently reliable to provide initial quantification of the total concentration (ct) and old-ice coverage for the Subregions examined in the Study.
Ice coverage of the four ice types (old ice (OI); first-year ice (FY); young ice (YNG); and new ice (NEW)) for Peary–sverdrup, 1968–2005, expressed as percent of total ocean area. The time Series is for the 15 October historical week (the weekly regional chart closest to 15 October). The World Meteorological Organization (WMO) Stage of development (ice type) colour legend is used.
Peary–sverdrup area time Series of weekly ice coverage of the four ice types (OI, FY, YNG, NEW) expressed as percent of total ocean area for: (a) 1997, (b) 1998, (c) 1999, (d) 2000, (e) 2001, (f) 2002, (g) 2003, (h) 2004 and (i) 2005. (WMO Stage of development (ice type) colour legend.)
Area time Series of weekly ice coverage of the four ice types (OI, FY, YNG, NEW) expressed as percent of total ocean area for (a) KCIE 1998; (b) KCIE 1999; (c) KCIE 2000; (d) PEN 2000; (e) WEL 2000; and (f) LANC 2000. (WMO Stage of development (ice type) colour legend.)
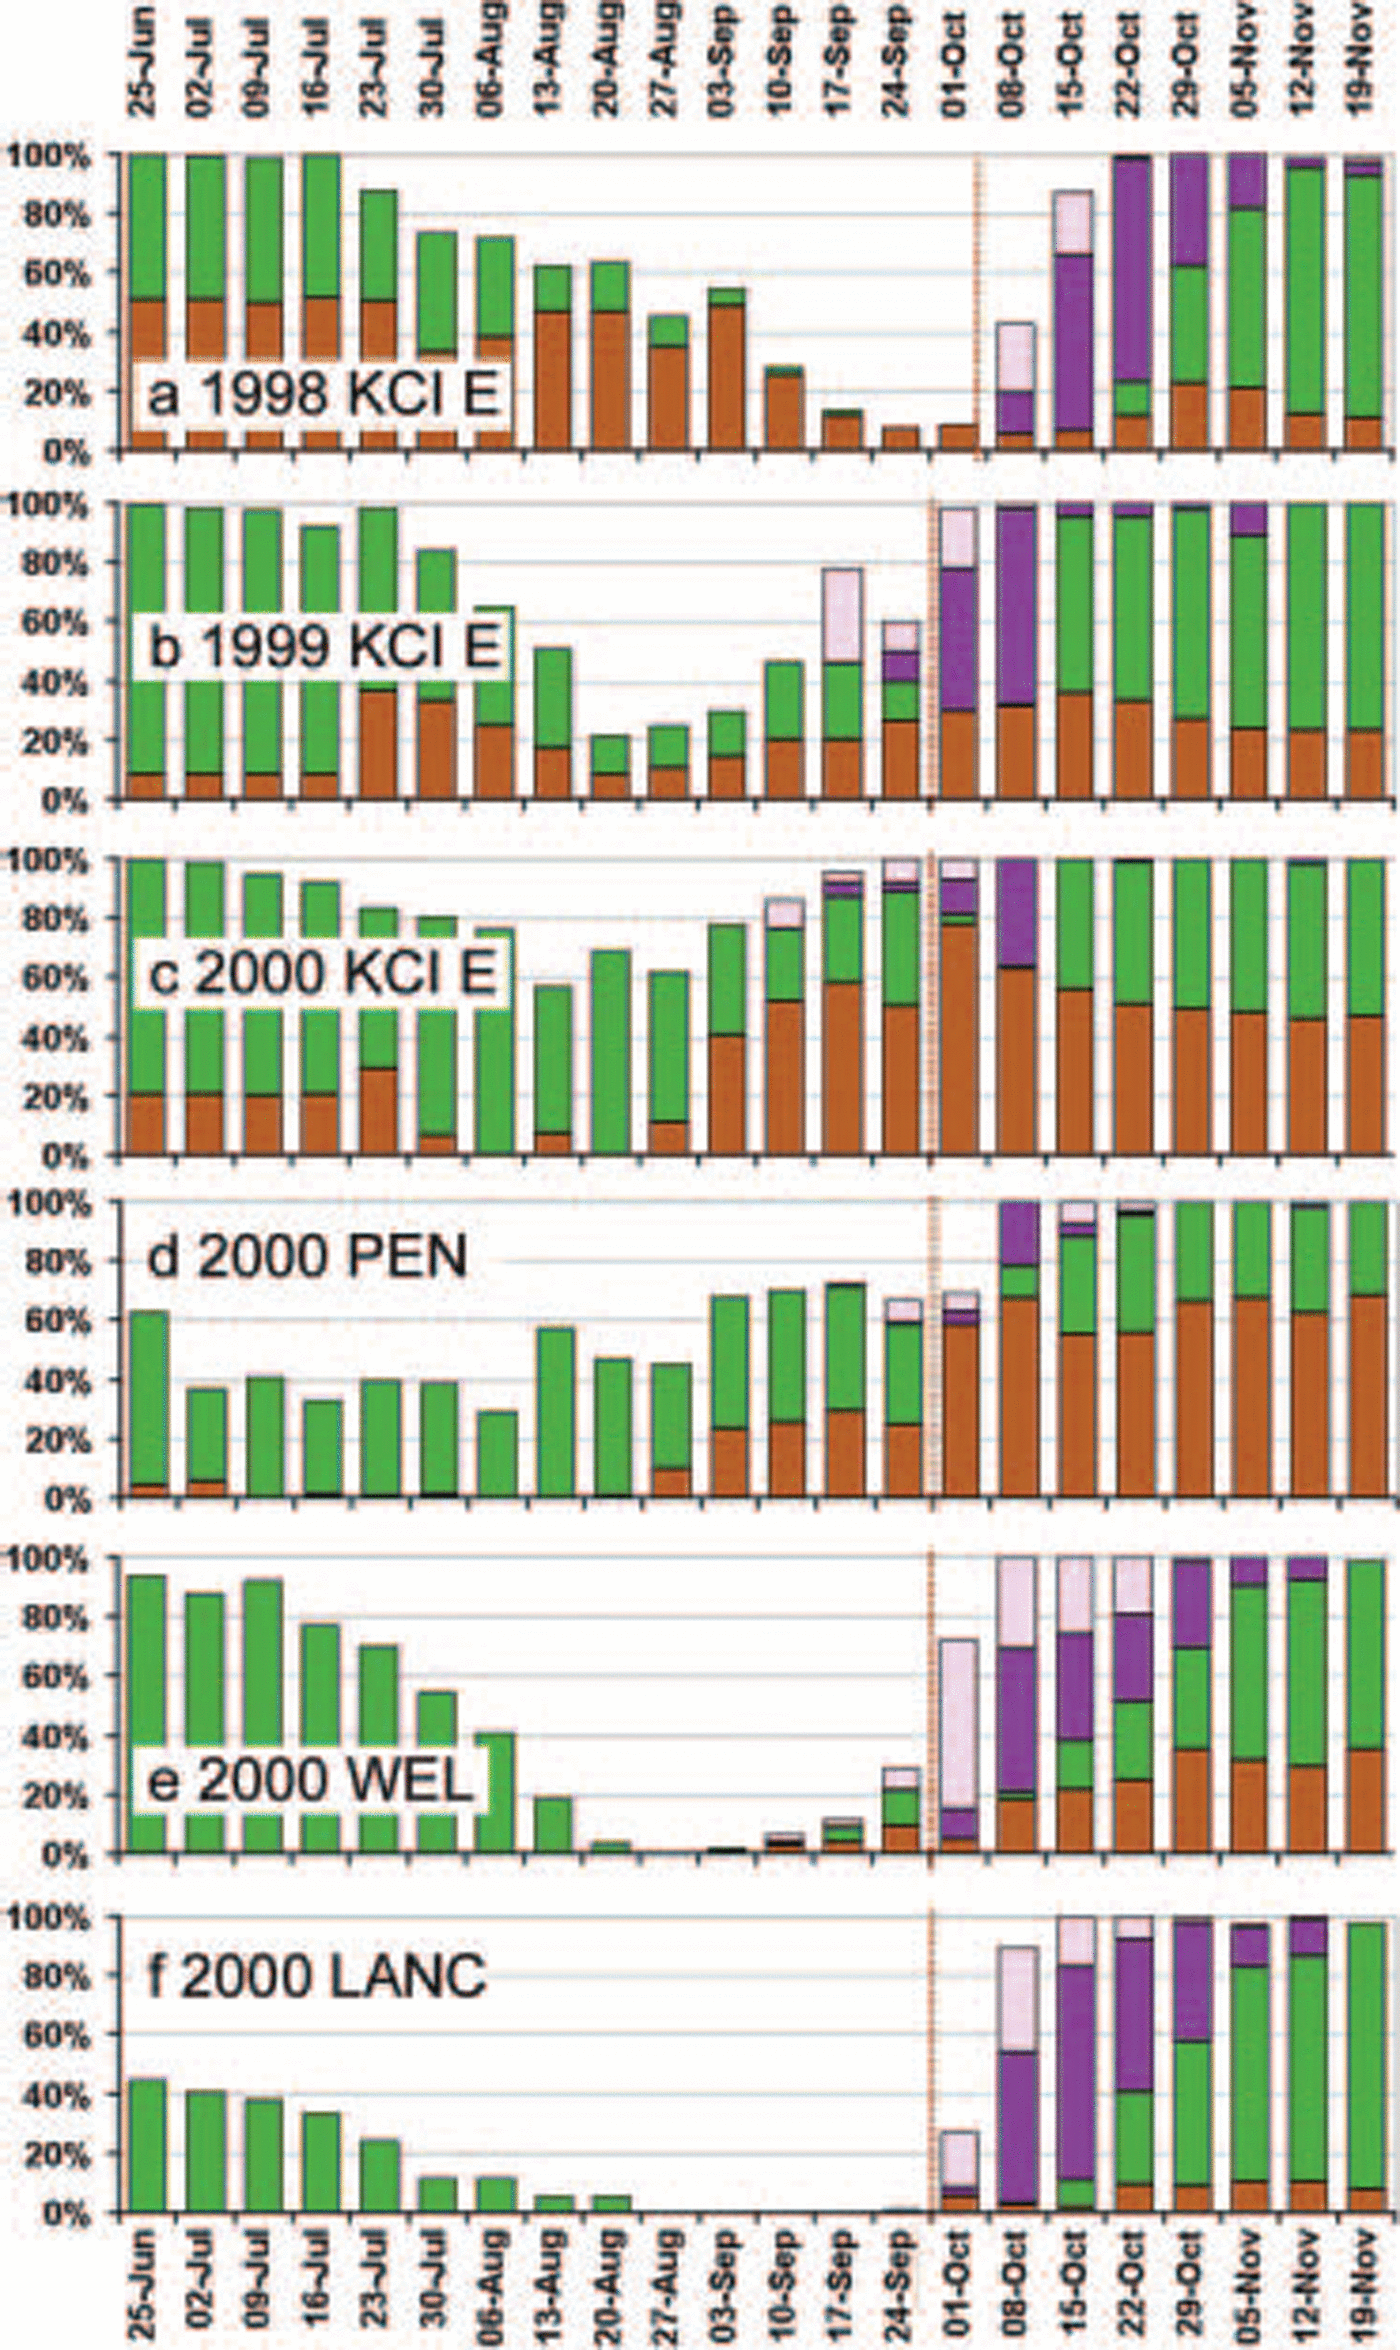
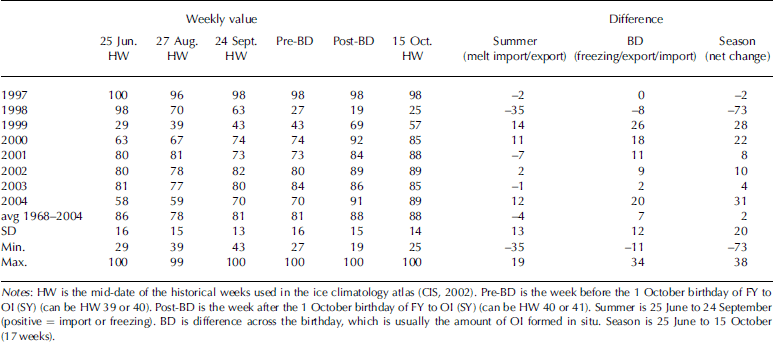
table 1 is based on the weekly values of old-ice coverage expressed as a percentage of total ocean area. positive values represent import of old ice and formation of Second-year ice in Situ. by definition, first-year ice which has Survived the Summer becomes Second-year ice on 1 october. this date is referred to as the birthday (BD), and the amount of ice which becomes Second-year ice on 1 october represents the amount of Second-year ice (old ice) formed in Situ that Season. negative values represent export or melting. note that the period covered in table 1 is within the radarsat era. these are minimum import figures. if there is export across the Southern boundary of the Subregion, as there appears to be in September 2000, then the net import into the islands will be greater. previous quantitative estimates of old-ice change (reported in Reference Wilson, Falkingham, Melling and de AbreuWilson and others, 2004; table 1) were based on a larger area which included much of the king christian island east Subregion.
Peary–Sverdrup changes in old-ice coverage (%) for specific periods
study area: CIS ice-regime regions and Subregions
Previous time-series analyses employed various combinations of northern canadian arctic archipelago inter-island ice areas to examine the ice conditions in the qei and individual ice regimes within the area (Reference Agnew, Alt, de Abreu and JeffersAgnew and others, 2001; Reference Falkingham, Chagnon and McCourtFalkingham and others, 2001; Reference Jeffers, Agnew, Alt, de Abreu and McCourtJeffers and others, 2001; Reference MellingMelling 2002; cis, http://ice.ec.gc.ca/ia_doc/cisads_no_003_e.pdf). the recently established cis ice-regime regions (CIS-irrs) (CIS, http://ice.ec.gc.ca/ia_doc/cisads_no_003_e.pdf) were used in the present Study. the CIS-irrs were defined in consultation with canadian Sea-ice experts. they represent areas for which 30 year time Series can be constructed with Some confidence. additional ‘test’ regions and Subregions were defined for research purposes and cannot Safely be used for trend analysis due to data Scarcity in the pre-satellite era and in non-shipping areas and/or to the Small Size of the area in the case of Some of the Subregions. these CIS-irrs and ‘test’ conventions will be used for cis data releases and research efforts and are Suggested as a tool for the research community to facilitate comparison of results and avoid unviable time-series analysis (see cis, http://ice.ec.gc.ca/ia_doc/cisads_no_003_e.pdffor further details).
The Study focuses on the peary–sverdrup ‘test’ Subregion (ps) and also examines conditions in the gustaf adolf (GA), king christian island east (KCIE), penny (pen) and wellington (WEL) ‘test’ Subregions (fig. 1). these Subregions are designated as ‘test’ Subregions due to their Small Size, the lack of information in early years and, in the case of the northern regions, the lack of Shipping activity over the whole period of record. they do, however, represent unique ice regimes critical to the discussion of old-ice import from the arctic ocean into the inter-island channels. the lancaster–e barrow Subregion (LANC), which has been a Shipping area throughout the whole period of record, is also discussed (fig. 1). the qei Study area (QEI) used in previous work is approximated by a combination of four CIS-irr regions which cover the area Shown in light purple in figure 1 (including the Study Subregions). the northern route of the northwest passage is part of the qei as defined for this Study.
Radarsat and Tracker
Remotely Sensed data have proven to be a useful tool in the manual and automated tracking of Sea ice through time-sequential images (Reference Heacock, Hirose, Lee, Manore and RamsayHeacock and others, 1993; Reference Agnew, Le and HiroseAgnew and others, 1997; Reference Kwok, Schweiger, Rothrock, Pang and KottmeierKwok and others, 1998). the capabilities of Synthetic aperture radar (SAR) Systems to provide coverage during polar darkness and through almost all atmospheric conditions have led to more reliable Satellite-based ice-motion tracking.
The cis acquires approximately 4000 radarsat Satellite (c-band, hh polarization) Scansar wide (SCW; 100m resolution within a 450–500km Swath width) images per year (Reference Ramsay, Manore, Weir, Wilson and BradleyRamsay and others, 1998). the polar orbit of the Satellite provides a daily revisit period over canadian regions north of 60˚ n, allowing for frequent temporal Sampling (rsi, 1995). the tracker algorithm calculates Sea-ice displacements by comparing time-sequential and Spatially overlapping Scw images. changes in ice-floe position are calculated using common cross-correlation coefficients of eight-bit digital numbers between image pairs and then calculating the Spatial offset. further details on the tracker algorithm are given in Reference Heacock, Hirose, Lee, Manore and RamsayHeacock and others (1993).
Radarsat-derived ice motions using tracker were validated using in Situ ice beacons during the north water polynya experiment. tracker magnitude and direction coefficients of determinations (R 2) were 0.93 and 0.79 respectively, with Standard errors of estimate of 3.6 km in magnitude and 38.8˚ in direction (Reference Wilson, Barber and KingWilson and others, 2000).
Tracker analysis for 1998, 1999 and 2000 is Summarized in k. wilson (http://www.socc.uwaterloo.ca/summer/ftp/ftp.html). the complete tracker archive for the area for 1998–2000, tracker results produced for operational use in 1999–2001, cis winter atlas radarsat mosaics (1998– 2004) and additional radarsat imagery for 1998 and Subsequent years were also examined in the Study.
Other data resources used in the Study
The following datasets were also used and are available in the data Section of the canadian climate action fund report, ‘the State of the arctic cryosphere during the extreme warm Summer of 1998’ (http://www.socc.uwaterloo.ca/summer/ftp/ftp.html): canada Surface and upper air charts for 1998 (ii:21), charts from the meteorological Service of canada arctic weather centre experimental marine wind prognosis for T+0 for july–october 1998 (ii:20), and daily temperature, wind and precipitation data for the 1960–99 period for eureka, resolute bay, mould bay and alert (ii:13).
Analysis
Peary–sverdrup ice conditions in the long-term context
The light ice year of 1998 Stands out in both the 37 year record of total concentration (TAC) and the 42 year record of minimum ice coverage for the qei area (fig. 2a). accumulating the ice conditions over the 17 week Season reduces the Strength of the 1981 light ice year. as would be expected, total concentration tac Shows a better correlation to resolute temperature than does the minimum ice parameter. based on the 42 year temperature and minimum ice-coverage time Series, the early 1960s, particularly 1962, experienced light ice conditions Similar to 1998. the 2005 light ice year is well within the variability Seen in the pre-1998 record (less than one Standard deviation below normal).
The 37 year total concentration tac time Series for the qei (fig. 2a) Shows a trend towards lighter ice conditions, Significant at the 95% level. however, this trend begins during the heavy ice years of the 1970s and would probably lose its Significance if it were corrected for overestimation of ice concentration in the pre-satellite years. in addition, the minimum ice time Series and temperature time Series Suggest that, if the period were extended back to the 1960s, the trend would definitely lose its Significance. the time Series does Show, however, that in the 8 years Since 1997 the qei has not experienced an extreme heavy ice year (>1 Standard deviation (sd)), in contrast to the rest of the 42 year record in which the longest period between extreme heavy ice years is 5 years.
The 37 year total concentration tac time Series for peary–sverdrup (fig. 2b) is Surprisingly Similar to that for the qei. the 1998 peary–sverdrup Sea-ice minimum is half a Standard deviation Stronger than the qei minimum, and the 1981 minimum is considerably weaker than the 1998 minimum. both the 1981 and 1998 total concentration tac minima in peary–sverdrup last for 2 years and are followed by recovery to above-average total concentration tac within 4–5 years. the 2005 light ice year appears to be Stronger for peary–sverdrup than for the whole qei, but this is partially a result of the Shorter record (producing a Shorter Standardization period) and the Stronger effect of the overestimates of total concentration in 1969 and 1970 on the Smaller area. during the post-1998 period, the total concentration tac for peary–sverdrup has not approached the extreme heavy conditions (near-total coverage for the whole 17 weeks) experienced at least every 5 years in the 37 year record.
The 37 year time Series of old-ice tac for peary–sverdrup Shows a Strong old-ice minimum in 1999 following the light ice year of 1998 (fig. 3). there is only a weak minimum following the 1981 light ice year, although there is a general decrease in old ice in the mid-1980s. by 2005 the old-ice regime has been near normal for 6 years, but no above-normal years have occurred. to the South of peary–sverdrup
In king christian island east, the old-ice minimum in 1999 is not Significantly Stronger than that in the mid-1980s (and mid-1990s), and a Strong maximum of old ice is experienced in 2003 (fig. 3).
Detailed analysis of ice import and export in Peary–sverdrup
The detailed analysis was constructed from all the information discussed in the data and methodology Section. however, the following year-by-year discussion will reference only the material presented in table 1 and figures 4–9, due to Space constraints.
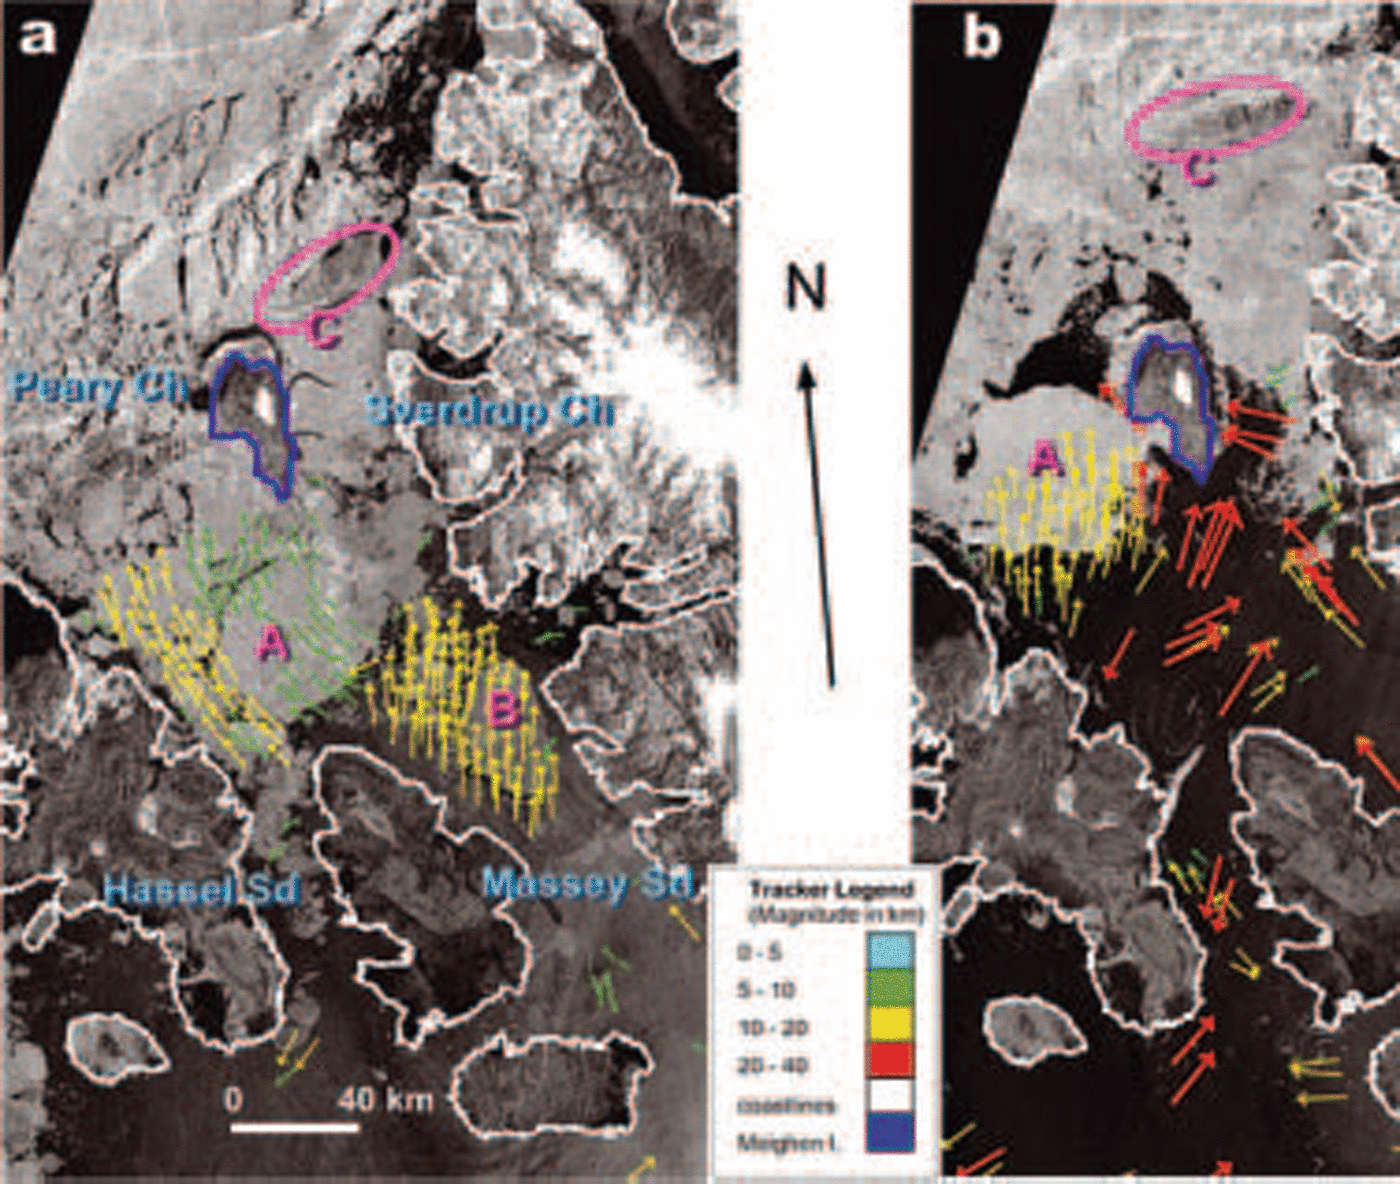
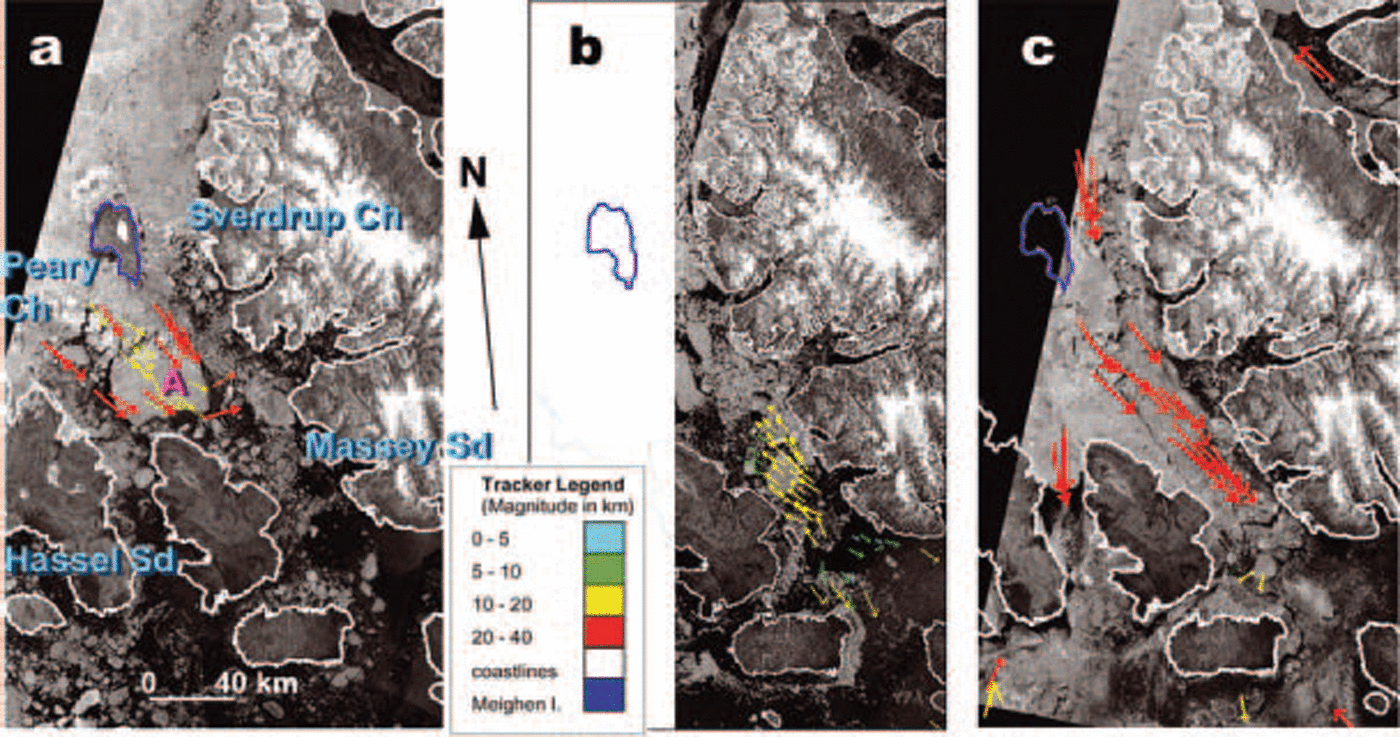
Radarsat ice-motion images centred on Peary and Sverdrup Channels, with the Arctic Ocean to the northwest and Hassel and Massey Sounds to the Southeast. Meighen Island is outlined in blue. See Figure 1 for location within the QEI. (a) 20 September, 2232 UTC (not Shown) to 21 September, 1346 UTC (shown), 1998. (b) 26 September, 2257 UTC (not Shown) to 28 September, 1342 UTC (shown), 1998. Three distinctive floes labeled A–C Show locations before (a) and after (b) the passage of a Storm with gale-force winds from the South on 23 September. Images have been geocorrected to a Lambert Conic Conformal map projection. Coloured arrows Show range of displacement in kilometers over the period between the images. Red: 20–35; yellow: 10–20; green: 5–10; blue: 0–5. Radarsat images © Canadian Space Agency.
Radarsat ice-motion images. (see Fig. 1 for location.) Meighen Island is outlined in blue. (a) 8 September, 2339 UTC (not Shown) to 13 September, 1436 UTC (shown), 1999. (b) 26 September, 2314UTC (not Shown) to 27 September, 1427 UTC, 1999 (shown). (c) 30 September, 2330 UTC (not Shown) to 4 October, 1423 UTC, 1999 (shown). Images have been geocorrected to a Lambert Conic Conformal map projection. Coloured arrows Show range of displacement in kilometers over the period between the images. Red: 20–35; yellow: 10–20; green: 5–10; blue: 0–5. Radarsat images © Canadian Space Agency.
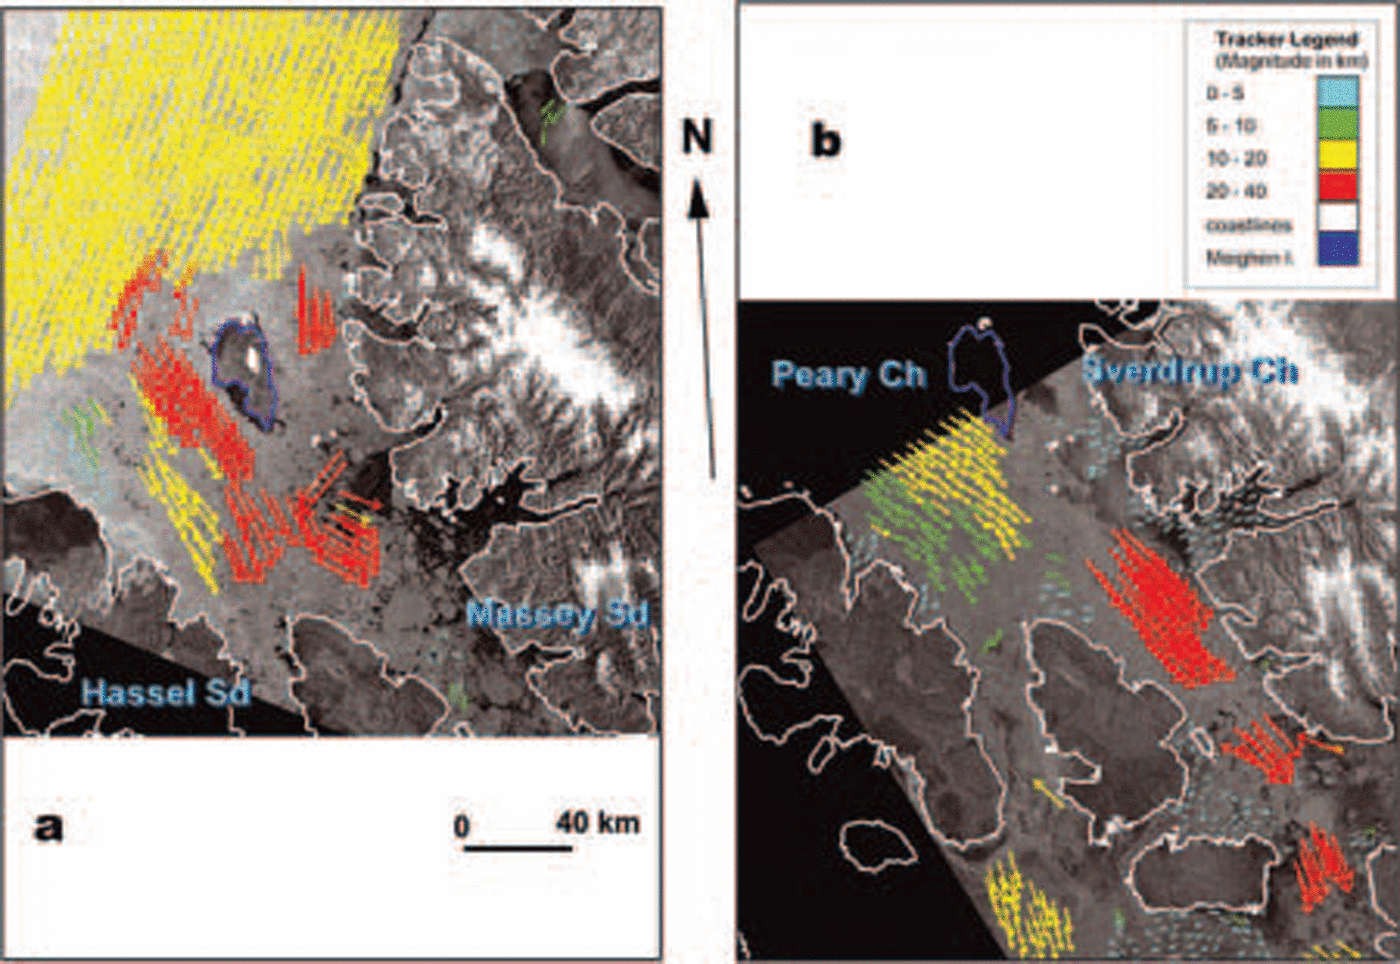
Radarsat ice-motion images. (see Fig. 1 for location.) Meighen Island is outlined in blue. (a) 27 August, 1443 UTC (not Shown) to 30 August, 1508 UTC (shown), 2000. (b) 24 September, 2225 UTC (not Shown) to 26 September, 23:39 UTC (shown), 2000. Images have been geocorrected to a Lambert Conic Conformal map projection. Coloured arrows Show range of displacement in kilometers over the period between the images. Red: 20–35; yellow: 10–20; green: 5–10; blue: 0–5. Radarsat images © Canadian Space Agency.
1998
The Season began with a high concentration of old ice (98%) in peary–sverdrup (table 1), 30% of which was formed in Situ in autumn 1996 (not Shown). the channels South of the peary–sverdrup fractured by mid-july. from mid-july through mid-august, old-ice loss in peary–sverdrup (30% = 8050 km2) and old-ice gain in king christian island east (15% = 1880 km2) Suggest export of inter-island ice to the South (figs 5b and 6a). the passage of a low-pressure System over peary–sverdrup (11–18 august) completed the fracture of the Sverdrup plug and the peary channel ice barrier and resulted in an additional 9% (2415km2) old-ice loss in peary–sverdrup and 11% (1379km2) old-ice gain in king christian island east and a Similar gain in old ice in lancaster–e barrow (not Shown). the lancaster Sound old ice disappeared in early September (not Shown).
From mid-august to mid-september, alternating minor import and export dominated northern peary channel, producing little net motion. floe b (fig. 7a) was in the Same place on 13 September as when it fractured from the fast ice on 6 august (not Shown). by 21 September, however, floes a and b and the fractured Sverdrup plug, including distinctive floe c, had moved northward in response to Strengthening Southerly winds in front of an approaching Storm (fig. 7a).
Gale-force winds (southeast 40 knots (75kmh–1), 23 September) dominated peary–sverdrup for more than 24 hours, and by 28 September floe c had moved 60 km into the arctic ocean while floe a had moved a Similar distance north in peary channel (fig. 7b). the peary–sverdrup old-ice coverage dropped 30% (fig. 5b) as old ice in northern peary–sverdrup moved north into the arctic ocean, leaving open water Stretching north to the Sverdrup plug area (fig. 7b). during the following week, Southerly winds held the polar pack off the northern coasts. by 5 october, the continued export (melt) resulted in another 10% reduction in old ice, bringing the old ice in peary–sverdrup to <20%, the lowest weekly old-ice coverage in the 30 year peary–sverdrup record (fig. 4). new and young ice covered the open northern channels by this time (fig. 5b).
On 6 october, the prevailing northerly winds returned. old ice re-entered the northern channels from the arctic ocean over the next 3 weeks, but progress was restricted by the thickening young ice, and the resulting old-ice coverage at the end of 1998 was in the 20–30% range (fig. 5b). most of the old floes returning into the channels were quite Small, but floe a remained intact and moved back into peary channel (not Shown). thus the old ice in northern peary and Sverdrup channels was ice that originated, at least in the Summer of 1998, from those very channels rather than from the arctic ocean.
1999
Break-up in peary–sverdrup began Several weeks later in 1999 than in 1998 (fig. 5b and c). however, melt proceeded quickly due to the extensive areas of first-year ice (70%), and by mid-august less than half the first-year ice remained (fig. 5c). ice from Sverdrup channel was again exported north into the arctic ocean, but floe a does not appear to reach as far north as meighen island (fig. 8), and this export event occurs 1 month earlier (27 august) than in 1998 and is not followed immediately by freeze-up (fig. 5b and c).
During the first 2 weeks of September, arctic ocean ice filled Sverdrup channel, reaching as far South as massey Sound, and floe a rotated and began to move South (fig. 8a). export out of Southern massey and hassel Sounds during September (fig. 5c) is reflected in the old-ice increase in king christian island east (fig. 6b). by 26 September, however, the motion reversed and the ice in massey Sound moved northward once again (fig. 8b).
The 20% old-ice increase in early october in peary–sverdrup reflects in Situ formation of Second-year ice (table 1). old ice exported South out of massey Sound (fig. 8c) in early october resulted in a Small mid-october old-ice increase in king christian island east (fig. 6a). the remnants of floe a blocked northern hassel Sound during october (fig. 8c), and motion ceased by the end of october (fig. 5c). there is a very Small amount of old ice in lancaster–e barrow in late Summer–early fall (not Shown).
2000
In 2000, in response to Southerly winds and warm-air advection, first-year ice loss began 1 week earlier than in 1999, but the loss (15%) was less than one-third of that experienced in 1999 (fig. 5c and d; table 1). ice was mobile in northern peary–sverdrup (including the Sverdrup plug area) 6 weeks earlier than in 1998, about the Same time as in 1999 (fig. 5d). however, when the plug area broke, northerly atmospheric circulation favoured import of arctic ocean ice into the islands. ice Streamed Southward through northern peary–sverdrup and gustaf adolf during the first half of September, producing a 15% increase in old-ice coverage by late September (fig. 5d; table 1).
Sverdrup channel consolidated almost 1 month earlier than in 1999 in response to cold northerly atmospheric flow off the arctic ocean. however, peary channel remained in motion, and import continued into late September (fig. 9b). this import combined with 20% in Situ Second-year ice formation to produce above-normal old ice (fig. 5d; table 1). during the first few weeks of october, old ice continued to be exported out of the Southern end of the area, depleting the old ice in peary–sverdrup by 10% by the end of november.
The Strong ice motion from the arctic ocean (fig. 9a) South through peary–sverdrup and into Southern qei channels (fig. 9b) produced a Substantial increase in old ice in king christian island east (fig. 6c) in September, followed by a loss in october–november (as in peary–sverdrup). in penny (directly South of king christian island east) old-ice increase began at the Same time as in king christian island east but continued into november (fig. 6d). wellington (south of penny) experienced Some old-ice import in late September, and Substantial import in october and november (fig. 6e). old-ice import into lancaster–E barrow lagged that in wellington by 2 weeks (fig. 6f).
2001–05
2001 was a heavy ice year (fig. 5e; table 1). break-up was Several weeks behind the previous two years, and freeze-up began by the end of august. there was less than a 10% loss of old ice in September and this was regained by in Situ Second-year ice formation, So the year ended with normal old-ice coverage (88%). the Sverdrup plug area did not break up, for the first time Since 1997, and peary channel and northern gustaf adolf remained Solid. the Southern channels were mobile, and old ice entered wellington and lancaster–e barrow by early august.
2002 began with 81% old ice (fig. 5f; table 1). melt was not initiated until early august. no old ice was lost. the Sverdrup plug area did not appear to break up, but peary channel was mobile. freeze-up began in early September, and once again there was 10% in Situ Second-year ice formation. in early november, the old ice dropped to 80%, perhaps due to late activity in peary channel. old ice entered lancaster–e barrow intermittently from august to September.
In 2003, melt began by the end of july, and all the first-year ice was lost by the end of august (fig. 5g; table 1). the 20% open water persisted into September and there was no first-year ice to become in Situ Second-year ice. the Sverdrup plug area fractured, but the ice remained essentially in place. Significant old-ice export to viscount melville and lancaster Sounds was Seen from mid-august through october.
2004 Shows another 3 week melt Season with <10% ice loss in peary–sverdrup (fig. 5h). freeze-up occurred by the beginning of September, thus marking a return to normal conditions.
2005 began with Slightly above-normal old ice in peary–sverdrup (fig. 5i; table 1). the Sverdrup plug area fractured in late august. this occurred Several days after the dramatic break-up of the nansen plug between 15 and 16 august (personal communication from j.c. falkingham, 2005). the nansen plug had remained in place Since 1999. in peary–sverdrup a total ice loss of 40% total coverage by august included all the first-year ice, So there was no first-year ice left to become Second-year ice in the fall and therefore no in Situ old-ice formation. the 30% loss of old ice in peary–sverdrup during the Summer and a 10% import of old ice in September left the old ice 20% lower than normal at the end of october. preliminary investigations Suggest that there was little or no import of arctic old ice through Sverdrup channel, but it appears that import occurred through peary channel. no old ice was Seen in lancaster–E barrow (not Shown). further Study, including the ice-motion analysis, is needed.
Discussion and Conclusions
The results Show that >70% of the old ice in peary–sverdrup was lost during 1998, half by melt and export to the South and the other half by export north into the arctic ocean. no arctic ocean old ice was imported into peary–sverdrup, but old ice from peary–sverdrup was imported into king christian island east, and Some of this inter-island old ice did reach lancaster–e barrow in 1998, but did not remain long. in 1999, a net import of 10% old ice was Seen in peary–sverdrup, with Some indication of through-flow into the inter-island areas, but no Significant old ice reached lancaster–e barrow. in 2000, no net import of old ice occurred in peary–sverdrup, but there was Significant through-flow, with evidence of old ice reaching the northwest passage by november, 1 year before old ice was found along Reference Howell and YackelHowell and yackel’s (2004) m’clure Strait and prince ofwales northwest passage routes. this Supports Reference MellingMelling 2002 Suggestion, based on the passage of hobson’s choice ice island (Reference Jeffries and ShawJeffries and Shaw, 1993), that progress of arctic ocean old ice through the qei is faster in the east than in the west. old ice peaked in the lancaster Sound/barrow Strait/viscount melville Sound portion of the northwest passage in 2003, 5 years after the extreme light ice Season. there appears to have been arctic ocean old-ice import into peary–sverdrup (and no old ice in lancaster–e barrow) in 2005.
Recovery of the ct and old-ice coverage to normal conditions was complete in the peary–sverdrup by the end of 2001. more than two-thirds of the recovery was due to the in Situ formation of Second-year ice from Surviving first-year ice. conditions in the following 3 years were near normal. the recovery in the ice regime lagged the recovery in the air-temperature regime, Summer temperatures at resolute reaching near normal by 2000 (fig. 2a). in fact, in august 1999, due to the extensive first-year ice coverage (70%) resulting from the extreme open-water conditions of the previous year, ice coverage in peary–sverdrup was the lowest in the 37 year record (not Shown). Similar lags can be Seen following the 1962 and 1981 light ice Seasons. two further observations can be made concerning the nature of the recovery.
The ice regime in the qei, and in peary–sverdrup particularly, has not recovered to the extent of producing an extreme heavy ice year (>1 Sd for qei and >0.8 Sd for peary–sverdrup) in the 8 years following the light ice year of 1998. by contrast, a heavy ice year was experienced within the 5 years following both the 1962 and 1981 light ice years (figs 2 and 3). this may reflect the Strength of the 1998 light ice Season or it may Suggest that the recovery is not as complete as in the past.
There is proof of the break-up of the Sverdrup plug in 1962, 1971 (and likely 1978) prior to 1998. following 1998, the Sverdrup plug area broke up in 1999, 2000 and 2005, and fractured but remained in place in 2003 and 2004. thus it is questionable whether the plug can actually be Said to have re-formed. in any case, break-up of the area appears to be more common than in the past three decades.
The break-up of both the Sverdrup and nansen plugs in 2005 was not accompanied by the extreme light ice conditions experienced in 1998 (or 1962), and the total accumulated coverage for the whole qei area was <1 Sd below normal, putting it well within the range of light ice years experienced in the 1969–2005 record (fig. 2a). in Spite of the light ice year of 2005, there is Still no reliable, Statistically Significant trend towards less ice in the qei over the 1960–2005 period. rather, the time Series is dominated by high interannual variability. if Reference MellingMelling’s (2002) Suggestion of an inherent three-phase cycle in the inter-island ice regime is accepted, the conditions in 2005 can be interpreted as a phase 3 flushing event Similar to those he found in the previous record. the mechanisms of ice–ocean–atmosphere interactions within the inter-island area are very complex due to the intricate land–ocean distribution and the intersection of three atmospheric influences (arctic ocean, north atlantic and continental north american) over the islands and the large-scale ice dynamics which continually forces the arctic ice pack up against the northern coastline of the qei.
This variability is also responsible for the formation of in Situ old ice. the results of the year-by-year analysis Suggest that in Situ old ice is formed in two Situations, both involving the alternation of light and heavy ice years. both are also dependent on the ice conditions of the previous Summer Season(s) as well as the progression of ice break-up during the Summer in question. in Situations Such as 1999, the very high percentage of first-year ice (70%) at the beginning of the Season (due to the extreme open-water conditions in the Summer and fall of 1998), together with continued, predominantly Southerly winds which limited intrusion of arctic ocean old ice, produced a 30% coverage of first-year ice which Still remained on 1 october to become Second-year ice. by contrast, in 2001 the barriers across peary and Sverdrup channels remained fast, and the first-year ice which formed in the near-normal ice conditions of the previous Summer did not break up at all, resulting in an 11% gain of in Situ Second-year ice. the latter is the more normal process of in Situ old-ice formation in the peary–sverdrup ice regime. Reference MellingMelling (2002) points out that the ice-ridge-building forces affecting this locally produced old ice are weak and fetch-limited, making it quite distinct from the highly deformed old ice imported from the zone of heavy ridging along the northwest coast of the islands.
Until detailed analysis of all available data Sources for the peary–sverdrup area was undertaken, it was assumed that the ice in Sverdrup channel Seen on the radarsat image for 28 September 1998 was intruding arctic ocean pack ice (Reference Jeffers, Agnew, Alt, de Abreu and McCourtJeffers and others, 2001). however, the close analysis undertaken in this Study Shows that all the ice in Sverdrup channel and 100 km out into the arctic ocean came from within the islands.
The detailed analysis also emphasized the fact that, for the peary–sverdrup portion of the consolidated ice barrier, the regional atmospheric conditions which Support the break-up of the barrier (southerly winds and warm-air advection) do not Support the import of old ice from the arctic ocean. rather, they clear the way for the import of thick old ice when the circulation returns to the prevailing northwesterly flow. only then does the very heavily ridged ice from the arctic ocean enter the islands and proceed Southward through the islands, first emerging into the northwest passage 2–3 years after the break-up. old ice from the inter-island channels does reach the northwest passage in the early part of the light ice Season, but this does not Survive long in the essentially ice-free channel. as Reference MellingMelling (2002) points out, this ice would be a combination of in Situ formed old ice and modified arctic ocean old ice and thus not as hazardous to Shipping as arctic ocean ice transiting the islands over a 1–2 year period after a light ice year or Series of light ice years.
Reference Falkingham, Chagnon and McCourtFalkingham and others (2001), Reference MellingMelling (2002), Reference Howell and YackelHowell and yackel (2004) and Reference Wilson, Falkingham, Melling and de AbreuWilson and others (2004) discuss the implications of the possibility of increased old-ice presence in the northwest passage during the transition to the GCM2 2×co2 model Scenarios which Show Summer ice-free conditions along the passage. these old-ice intrusions could cause major hazards to Shipping during the transition period.
The detailed analysis Showed that by combining ice-motion results with digital ice-chart data for a Single ice regime (peary–sverdrup ‘test’ Subregion) it is possible to obtain quantitative estimates of export, import and through-flow; follow the exported ice through the other individual ice regimes to the South; and assess the importance of arctic ocean old ice vs in Situ old ice in the recovery of the qei from an extreme light ice year. this localized case Study provides another piece of the complex northern canadian arctic archipelago (QEI) ice–ocean–atmosphere interaction puzzle. the methods Should be applied to the more complex ga area. they might also be useful in providing validation for Short- and long-term ice-modeling efforts in the qei.
Acknowledgements
This research was Supported in part by the cryosphere System in canada (CRYsYs) project. the authors wish to thank S. mccourt, who performed the area calculations from the cis digital archive and prepared figure 1, and the reviewers and Scientific editor who offered helpful comments on how to improve the paper.



