A recent article on the industrial growth of post-Unification Italy completed the set of sector-level production series with ad hoc estimates, and took a peek at the likely path of aggregate production.1
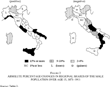
If one is going to peek, one might as well get an eyeful: this article combines the new production figures with census labor-force data to estimate industrial production in each of Italy's 16 regions (
) at four usefully separated dates (1871, 1881, 1901, and 1911).
Those census data have long been used to illuminate the relative development of Italy's regions; the new national estimates allow their conversion into more direct measures of production. These measures are of course imprecise, as the algorithm corrects the labor-force figures for differences in product per worker over time and across sectors, but not for interregional differences within each sector; but the patterns they reveal are already of considerable interest.
The estimates for industry as a whole point to a widening of industry's regional base over the four decades at hand: the “industrial triangle” represented by Piedmont, Lombardy, and Liguria stands out in 1911, but in 1871 only Lombardy was manifestly above the rest. A discontinuity in that evolution appears around 1881, with implications for a number of long-standing debates.
In 1871 the less industrial half of the Italian peninsula was not so much the South as the East: the familiar divisions evident in 1911 were then essentially new. The observed rearrangement suggests a transition from traditional handicrafts attracted to the cities that consumed the surplus to factory production attracted by cost-reducing regional resources.
Different patterns also appear both within the industrial Northwest and the backward South. Piedmont, an industrial leader, was weak overall; Sicily and Apulia appear remarkably strong despite their industrial weakness. The association between the regions' industrial performance and the overall vigor of their economies turns out to be surprisingly loose.
The sector-level figures are also suggestive. The relative importance of the extractive industries varies widely, depending on natural endowments. Beyond that, however, and especially within the dominant manufacturing group, what is striking is the pervasive similarity of the different regions' industrial structure, which declines over time but remains noteworthy even in 1911. The more industrial regions thus appear to attract not more industries, or the larger industries, but larger shares of most industries: as if their comparative advantage in manufacturing were general rather than sector-specific. This casts a novel light on the effects of tariff policy, and prompts speculation as to the nature of those advantages.
OF SOURCES AND METHODS
The Sources and the State of Play
Italy's “Southern Question” has been on the table for over a century. The debate over regional disparities prior to the First World War has long since passed from the politicians and economists of the day to the historians of later generations; but closure seems as distant now as then, not least because the extent and development of those disparities remains highly conjectural.2
For a brief guide to the issues and the literature see Cohen and Federico, Growth, pp. 25–29.
Because the traditional contrast lies between the developed “industrial triangle” in the North-West and the backward South (the Mezzogiorno), with the North-East and Center in between, the regions' relative industrial growth is at the heart of the issue; but as near as makes no difference it is simply unknown. Vera Zamagni obtained regional estimates of industrial production in 1911 from Italy's first, highly incomplete (and regionally biased) industrial census; Anthony Esposto later presented estimates for 1889–1893 derived from the province-level industrial surveys taken from 1885 to 1902, and measured relative progress from the differences between his figures and Zamagni's.3
Zamagni, Industrializzazione; Esposto, “Italian Industrialization.” The Italian provincia is a relatively small territorial unit, identified by its major city. Post-Unification Italy was divided into 16 regions, and these in turn into 69 provinces; exceptionally, three regions (Umbria, Latium, and Basilicata) contained a single province (respectively Perugia, Rome, and Potenza).
Their underlying sources, however, are very different, and over the period at hand each is the sole example of its kind; neither Zamagni's nor Esposto's estimates can be replicated for other years, and the diachronic content of their differences is in the eye of the beholder.
4 Between Unification and the World War the only comprehensive, repeated surveys are the demographic censuses, taken at decadal intervals from 1861 (but not, as an economy measure we can only regret, in 1891); from 1871 they include a highly detailed breakdown of the population of working age by industry and then by occupation, as well of course as by geographic unit.5
Ministero di agricoltura, industria e commercio, Statistica…Censimento…1871, Censimento…1881, Censimento…1901, and Censimento della popolazione…1911.
The mainstream attempts to shed light on the regions' relative progress have accordingly relied on these labor-force benchmarks. Their investigation was pioneered by Ornello Vitali, who devoted considerable effort to correcting for the modification of the industrial classification from census to census; his work has been followed up by Giorgio Fuà and Samuele Scuppa and, not least, by Zamagni herself.
6 Vitali, Aspetti; Fuà and Scuppa, “Industrializzazione”; and Zamagni, “Century.”
These analyses, which come relatively far forward in time, all begin with the census of 1881; the failure to make use of the comparably detailed census of 1871 is regrettable, as major controversies turn precisely on the extent to which the early post-Unification decades differed from the later ones.7
Fenoaltea, “Notes.” The 1871 census does not contain, as the others do, regional labor-force figures; but these are readily reconstructed by aggregating over the relevant provinces.
The evidence of relative industrial performance was also limited to the labor-force figures themselves, as their transformation into more direct estimates of regional production was simply not possible with the then available data.
8 Vitali himself had earlier calculated annual real product series for the extractive, manufacturing, construction, and utilities industries from 1861 on (Vitali, “Stima”; and Ercolani, “Documentazione”); the critical limitation was the lack of any breakdown within the dominant manufacturing group.
This data constraint has now been loosened. This article combines the census labor-force data with the new, sector-specific estimates of national industrial production to obtain a first set of comparable benchmark estimates of regional production. It also extends the sample set to include 1871.
The New Evidence and the Present Exercise
Time series measuring national production by value added at 1911 prices are now available for 15 industrial sectors: one each for the extractive, construction, and utilities industries, extensively revised with respect to their predecessors, and, for the first time, 12 that disaggregate manufacturing itself.9
The present article uses the 1871, 1881, 1901, and 1911 census labor force data to estimate regional production benchmarks, sector by sector, on the simple assumption that within each sector the geographic distribution of production matched that of the labor force. The obvious advantage of this method is that it corrects the regional labor-force figures for differences in product per worker across years and sectors; its obvious limitation is that it does not also allow for intratemporal, intrasectoral differences in that product between one region and another.
10 The relevant issues are here presented very briefly; for further details see Appendix 1.
Because the national sector product to be allocated among the regions is given ex ante, and the labor-force figures enter the calculations only as shares of their own sector- and year-specific totals, the intertemporal and intersectoral heterogeneity of the census data becomes essentially irrelevant.11
In the early censuses, for example, the construction-industry figures include only skilled workers, and unskilled day-laborers are not usefully broken down by sector. Increasing the reported construction-industry totals by a uniform percentage to allow for the complementary unskilled labor would clearly leave each region's share of the sector total, and therefore the present output estimates, absolutely unchanged.
The textile labor-force figures, which are notoriously heterogeneous not only over time but across regions, are subjected to a preliminary correction; with that one exception the labor-force figures used here are simple sums of the elementary census data, aggregated to fit the industrial categories of the national production estimates.
12 At the present level of aggregation that classification is essentially standard. The labor-force figures were derived directly from the census data, rather than from Vitali's elaborately revised figures, because the latter are not always available (1871), and even where they are (1881 ff.) they need not improve the data for the purpose of the present calculations. Intertemporal homogeneity would be critical to productivity calculations, but these are entirely beyond the scope of the present article.
The product-per-worker weights which convert these labor-force figures into the present production estimates naturally reflect the intersectoral and intertemporal differences in the census figures' coverage, as well as differences in product per effective unit of labor.13
That coverage is at times deficient (note 11), at times excessive: in the early censuses the elementary data often fail to separate the sales and production personnel of traditional small shops (for example, bakeries).
By 1911, however, the elementary census categories were very close to the desired ones, and the intersectoral differences in coverage were largely eliminated; the relative weights computed for that year are quite close to “pure” relative products per worker, and suggestive of the differences that would emerge if one generated strictly comparable labor-force figures for the other years as well.
14 The foodstuffs industry remains an exception, as the census figures systematically omit both the temporary workers processing perishables after the harvest, and the farm-sector workers who also processed milk, slaughtered animals, and so on.
These intersectoral differences are not small: the lowest weight (for the female-labor-intensive clothing industry) differs by almost a full order of magnitude from the highest within manufacturing alone (chemicals), and by almost twice that from the highest overall (utilities).15
Within each region, therefore, the sectoral distribution of industrial production will differ markedly from that of the labor force; across regions the distribution of the total industrial product will deviate from that of the total industrial labor force to the extent that the latter is itself differently distributed among the various sectors.
16 This simply repeats a familiar index-number point: in calculating price indices, for example, the quantity weights of different years will yield the identical average change if relative quantities remain the same, and all weighting schemes will obviously return the same average change if every price increases in the same proportion. In the case at hand value added per worker differs markedly across sectors, but the interregional differences in the distribution of workers among sectors are not extreme.
For the purpose of assessing the regions' relative industrial progress, therefore, the present estimates of regional industrial production represent a significant step beyond the labor-force figures utilized by the earlier literature. That step does not of course reach the end of the road: the present estimates do not also allow for the differences in product per worker that are at once intratemporal, interregional, and intrasectoral. The present estimates are correspondingly imprecise, and must be considered preliminary. They may also appear to be biased against the industrial leaders; but this impression at least bears reconsideration.
The estimates' margin of error will of course decline as the industrial classification is made more detailed, and each sector more nearly homogeneous. The present calculations distinguish only 15 broad sectors; error creeps in if from region to region these contain a different mix of dissimilar components (for example, blacksmithing and machine-building within “engineering”).17
The error is of course limited by the difference in product per worker from subsector to subsector; these differences appear to be altogether smaller than the corresponding differences across the sectors themselves.
The error biases the results if the industrial leaders contained a disproportionate share of the more capital-intensive, high-product subsectors. It is natural to presume that they did; but that presumption receives no support at all from the available aggregate and sectoral data.
18 Overall, according to the 1911 industrial census, the industrial triangle contained exactly the same share of total horsepower in use as of total labor. At the sectoral level the industrial triangle was particularly concentrated in textiles, a labor-intensive industry with a product per worker well below the overall average.
Even a highly refined industrial classification would fail to pick up interregional differences in the ratio of the actually employed to the census labor-force count, or in productivity per employed worker in the same specific activity. Once again, productivity would be systematically higher in the industrial triangle if production there were systematically more capital intensive; but the evidence suggests that it was not.19
More subtly, too, in a spatial context relative physical productivity carries no clear implications for relative real product per worker—at least if the workers' “real product” is measured in common units, as “real wages” are, and not in each industry's own output.
The rate of employment also presumably varied, but need not have been systematically higher in the more industrial areas: the slippage between industrial and overall regional performance documented below, the sector-specific time series documented elsewhere, and the seasonal suspensions documented by the industrial census all suggest that it was not.
20 Because employment dominates unemployment, too, even large differences in unemployment rates would be strictly second-order differences in employment rates.
The regional production estimates presented here are not exact, but not palpably distorted.21
Because these estimates do not clearly over- or understate interregional differences, they are presented here as they emerge from the simple algorithm that generates them. The reader with a different impression can readily rescale them, rather as one converts Fahrenheit to Centigrade; and even the most skeptical reader will concede that temperatures convey a great deal even if we cannot say that Monday was n times hotter than Tuesday.
Interpreted with ordinary prudence, they can tell us a good deal about regional differentiation in post-Unification Italy.
AGGREGATE PRODUCTION AND RELATIVE INDUSTRIALIZATION
The Regions' Industrial Production
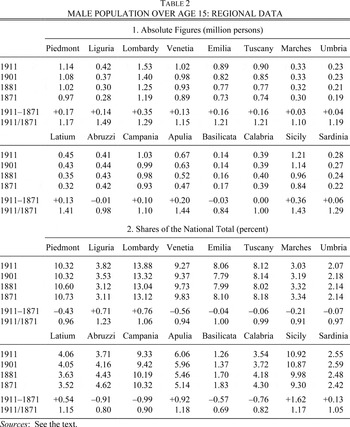
Industrial production, measured by value added at 1911 prices, is here disaggregated into 15 sectors. Manufacturing is broken down to distinguish foodstuffs, tobacco, textiles, clothing, leather, wood, metalmaking, engineering, nonmetallic mineral products, chemicals (including rubber), paper and printing, and the small residual; the other major groups (the extractive, construction, and utilities industries) are treated as single sectors. In each census year, each national sector-specific production estimate is allocated among the regions in proportion to their shares of the corresponding labor force. Summing over the sectors one obtains the year-specific estimates of each region's total industrial production (at 1911 prices) transcribed in the upper panel of Table 1. The Table's lower panel expresses these same figures as shares of the national total; both panels also report the cumulative absolute and relative changes from 1871 to 1911.22
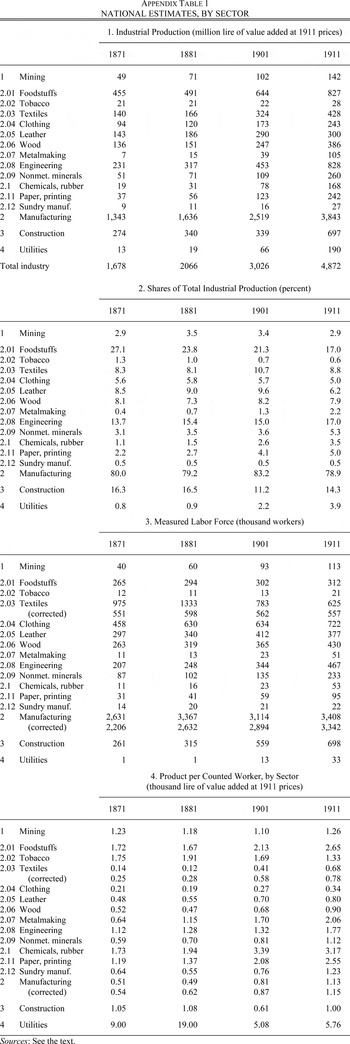
For reasons of space only summary results are presented here, and much detail is relegated to the Appendices. The national estimates by sector and census year are transcribed in Appendix Table 1; the corresponding regional figures are reported in Appendix Table 2.
From 1871 to 1911, total production grew in every region.23
In the interest of brevity the cautionary disclaimers will not be repeated, and the results will henceforth be discussed as if they were free of error.
Total production grew as well in every intercensal period (with the single exception of Basilicata between 1881 and 1901, and that too is a halt rather than an outright decline). At this level and at these dates, therefore, there is no evidence of regional deindustrialization.
24 Similarly (mutatis mutandis) Esposto, “Italian Industrialization,” p. 362.
Long-term growth rates differ widely, however, and regional shares vary over time. The fastest growth is recorded in the northwestern regions. Liguria heads the list, with an almost five-fold increase in output and a 64 percent increase in its share, followed at a measurable distance by Lombardy, and then by Piedmont. Tuscany, Latium, Emilia, and Sardinia follow close behind, with growth rates barely above that of the national aggregate. The other regions lag behind, and their shares of the aggregate decline: by some 7 percent in Umbria and Apulia, 14 percent in Venetia and Campania, 22–24 percent in the Marches and Sicily, some 30 percent in the Abruzzi and Calabria, where production barely doubled, and by 50 percent in Basilicata, where production increased by less than half. The broad pattern is divergent, and the ratio of the highest regional product (in Lombardy) to the lowest (in Basilicata) grows from 14 in 1871 to 34 in 1911.
The intermediate benchmarks point to an accelerated divergence after 1881: the share of the total represented by the northwestern triangle grows from 32.7 percent in 1871 to 33.8 in 1881, 37.9 in 1901, and 40.5 in 1911, at an average annual rate that rises from 0.3 percent in the first intercensal period to 0.6–0.7 in the succeeding ones. The lack of a census in 1891 robs us of a crucial observation; but unless the pace of change displayed dramatic discontinuities things must have started picking up around the 1881 benchmark itself. Various implications of this pattern bear notice, at least as working hypotheses.
With respect to Italy's overall industrial development, first of all, one may recall that total industrial output seems to have increased relatively slowly from 1861 to 1878, with minor cyclical peaks in 1865 and 1874. It grew rapidly from 1878 to 1887, only to slow again to virtual stagnation in 1887–1895; the following strong upswing lasted right up to 1913, with growth rates peaking around 1905–1908.25
The regional evidence suggesting a break
circa 1881, close to the beginning of the first major upswing in 1878, is quite consistent with the sense that the growth spurts of the 1880s and the early 1900s were essentially of a piece, as some of us have long maintained.
26 Fenoaltea, “Notes,” and references therein.
Alexander Gerschenkron had down-played the 1880s as a false start, and argued that Italy experienced a “big push” only after, and thanks to, the creation of the German-style banks in 1895.
27 This would imply a break much nearer 1901 than 1881; and of that, in the regional data, there is no sign.
With respect to the impact of public policy, in turn, the major debates concern the impact of the tariff, and that of public works.28
Cohen and Federico, Growth, passim; also Fenoaltea, “Notes,” and references therein.
Italy's tariff history is marked by an early period of trade liberalization, followed by a return to protection in 1878 and a significant tariff increase in 1887; the protected sectors were primarily metalmaking, textiles, and grain (subsequently joined by sugar). The apparent break in the pace of regional differentiation around 1881 suggests that the return to protection was of particular benefit to the industries of the North; this point bears further elaboration, however, and is returned to below.
Public works were marked in particular by State support of railway construction, which in the 1860s and '70s added the peninsular trunks to the pre-existing northern network, and subsequently much thickened the total network by adding myriad minor lines. Rosario Romeo and Emilio Sereni both attached critical importance to the early extensions of the network: the former because the trunks represented the “essential infrastructure” that had to be completed before industrialization could begin, the latter because they opened the Southern market to Northern manufactures.29
Romeo, Risorgimento; and Sereni, Capitalismo.
The present author has argued instead that the forward linkages of the water-competing peninsular trunks were in fact much weaker than those of the subsequent land-locked minor lines.
30 The apparent break around 1881 speaks to the issue, but with Delphic ambiguity. If one believes that railway networks are continuous (“differentiable”), and have essentially immediate effects, the evidence ties growing regional differentiation to the post-1880 construction of minor lines; if one believes that the effects of railway construction are long delayed (whether because of internal complementarities that require “completion” before the effects are felt, or simply because the private sector responds very slowly), the post-1881 differentiation points rather to the belated effect of earlier construction. The present author prefers the former interpretation, but the latter cannot be ruled out.
With respect to the origins of the North-South differential, finally, scholars continue to disagree over the extent to which it pre-dated Unification, was quickly created by the liberalization of trade with Unification itself (as internal customs were abolished, and the mild Piedmontese tariff was extended nation-wide), or grew more slowly as the result perhaps of transport improvements.31
Cohen and Federico, Growth, p. 29.
Here above all one misses the crucial observation that would have been provided by the 1861 census, had it only included adequate labor-force data; one notes however the relative lack of change between 1871 and 1881. There is no evidence of a polarizing “Unification effect,” at least after 1871: either it was quickly exhausted, or it never occurred at all. Between 1871 and 1881, rather, Campania in particular appears in relative progress; but this result must of course be confirmed by sturdier figures.
The Regions' Relative Industrialization
Each region's share of national industrial production at any point in time obviously reflects its relative size as well as its relative industrialization. Table 2 reports the various regions' male population over age 15, both in absolute figures and as shares of the national totals, and the cumulative changes in these from 1871 to 1911.32
The (geographically disaggregated) male population over age 15 was of course directly reported by all four censuses.
The dynamics of that male population differ in various ways from those of industrial production. Relative changes are much smaller, and growth is no longer universal: the figures for Basilicata decline in every period, those for the Abruzzi decline after 1901 and overall, those for Calabria decline from 1881 to 1901. Over the long term the regions with the fastest growth, and a share that increases by over 5 percent, are (in descending order) Liguria, Apulia, Sicily, Latium, Lombardy, and Sardinia. Emilia and Tuscany maintain an approximately constant share. The shares of the others decline: by some 3–4 percent in Piedmont and Umbria, 6 percent in Venetia, 9–10 percent in the Marches and Campania, some 20 percent in the Abruzzi and Calabria, and 30 percent in Basilicata (Figure 2). Again, the extremes diverge: the ratio of the highest regional population (in Lombardy) to the lowest (in Basilicata) grows from 7 in 1871 to 11 in 1911.
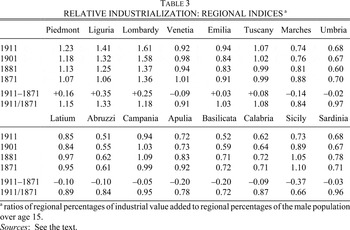
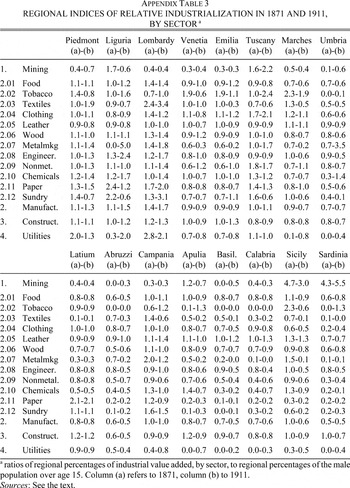
Table 3 presents the indices of relative industrialization calculated by dividing each region's share of industrial production by its share of the male population over age 15.33
The correction for scale yields a pure number (like the coefficient of variation). The present index is algebraically equivalent to the ratio of the region-specific average industrial product per adult male to the corresponding national average; it also approximates a conventional coefficient of specialization, with the region's share of the adult male labor force as a proxy for its (unknown) share of the total national product.
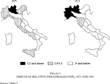
In 1911 the industrial triangle clearly stands out (
Figure 3): the three highest indices are those for Lombardy (1.61), Liguria (1.41), and Piedmont (1.23). Elsewhere, only Tuscany has an index above one (1.07). It is followed by Emilia, Campania, and Venetia (0.92–0.94), Latium (0.85), the Marches, Apulia, and Sicily (0.72–0.74), Umbria and Sardinia (0.68), Calabria (0.62), and the Abruzzi and Basilicata (0.51–0.52). The three northwestern regions are also those with the most rapid growth in the index between 1871 and 1911: Liguria leads with a 33 percent increase, followed by Lombardy and Piedmont with increases of 18 and 15 percent, respectively. These are followed in turn by Tuscany and Emilia, with small increases, and then, with increasing declines, Umbria, Campania, and Sardinia (near −4 percent), Venetia and Latium (near −10 percent), Calabria, the Marches and the Abruzzi (near −15 percent), Apulia (−22 percent), Basilicata (−28 percent), and Sicily (−34 percent). These changes in the index clearly pick up the broad features of Italy's industrial differentiation, with the Northwest in the lead, the South in relative decline, and the Center and Northeast in between.
The variations in the regional indices depend of course on the relative variation of the shares of industrial output, and of the male population over 15. The relative changes in that population presumably reflect the differential impact of stock-adjusting interregional and international migration; they accordingly measure the relative development of the regional economy as a whole, and the part played by industry emerges from a joint examination of the industrial share and the demographic share.34
The presumption that the changing allocation of this stock of labor reveals the relative development of the different regions is predicated on the assumption that there was enough mobility to overcome the effects of differential birth and death rates. It may be worth recalling, in this connection, that over the two decades straddling the census of 1901 the number of (temporary and permanent) migrants to foreign countries alone exceeded a quarter of the population present at the census date (Istat, Sommario, pp. 39, 65; also Cohen and Federico, Growth, p. 43). The males over 15 considered here were themselves the most mobile segment of the population; and the adjustment to the regional stocks could come from actual internal mobility as well as from variations in the rate of foreign migration.
From this perspective one notices significant differences even within the industrial triangle. In Liguria and Lombardy—the regions with the highest index in 1911, and the fastest growth in the index from its level in 1871—the growth in the region's share of national industrial production is accompanied by growth in its share of the male population, which in turn limits the growth of the index: these regions grew at above-average rates, and industry appears to have led their development. In Piedmont, in contrast, the growth of the region's share of total industry is much smaller, and much of the growth in the index comes from the decline in the share of the male population; the region appears to have been in overall relative decline, and to have fallen back on industry to compensate for the low vitality of the nonindustrial sectors.
Elsewhere, over the long run the index grows only in Emilia and Tuscany. Here too, as in Piedmont, the share of industry grows as the share of the male population falls, but the latter decline is minimal. The share of national industrial production grows in Latium and Sardinia too; but their share of the male population grows even more rapidly, causing a fall in the index of relative industrialization, especially in Latium. Sardinia and especially Latium thus display relative progress overall, led by other sectors so vigorous that their industry declines as a share of the regional economy even as it grows as a share of national industry.
Almost all the other regions appear to be mirror-images of Lombardy and Liguria, with low industrial growth “leading,” so to speak, low overall growth: the index declines, despite the fall in the share of the male population, because the share of industry falls even faster. Such declines are slight in Umbria, noticeable in Venetia, the Marches, and Campania, dramatic in Calabria and the Abruzzi; they are greatest in Basilicata, a failing region with a significant demographic decline even in absolute terms.
The surprising exceptions are Apulia and Sicily. These appear as mirror-images of Piedmont: their shares of industry decline (by roughly a tenth and a fifth, respectively), but their indices decline even more (by roughly a fifth and a third, respectively), thanks to the spectacular growth in the share of the male population, comparable to that of Liguria (the overall leader, and winner of the industrial contest), and greater even than that of Latium (pulled along by the new national capital). Apulia and Sicily thus appear to be regions in noteworthy relative progress, led by as yet unidentified sectors so vigorous as to offset the relative decline of their industry.35
The hypothesis that the Apulian and Sicilian economies were particularly vigorous stems from the assumption that adult males were relatively mobile; the demographic growth of these regions would of course have very different implications, were it due to a high rate of natural reproduction, and an inability to shed excess population. Because migrants were predominantly male, however, the male-female ratio in the remaining population is itself an indicator of the incidence of migration. Excluding children under 15, the 1911 census recorded 93 males per 100 females in Apulia and 97 in Sicily, against 83 in Basilicata and 78 in Calabria and the Abruzzi; this would tend to confirm the hypothesis that Sicilians and Apulians had less reason to migrate because of the more rapid growth of the local economies. At first blush neither Apulia nor Sicily appears to have developed a noticeable transit trade, nor of course national government services, so the leading sector was presumably specialized agriculture (respectively wine and citrus fruit, possibly combined with sheep-raising).
Industrialization is considered the key to growth and modernization. The redistribution of the mobile labor force suggests that overall regional development was not tied in fact to industrial success: Figure 2 (left panel) and Figure 3 (right panel) stand in striking, unexpected contrast.36
The presumption that industrialization was the road to growth shaped public policy (as well as the present author's research agenda). The governments of postwar Italy pursued Southern development by subsidizing its industry; the then-prevalent belief that Italy's national industrial growth had been held back by capital-supply constraints (Fenoaltea, “Notes”) led them specifically to subsidize industrial capital, with the predictable result that the subsidies attracted capital-intensive, environment-destroying petrochemicals rather than labor-intensive light industry or services. History may or may not matter, but its interpretation certainly does, and economic historians too have done their bit to increase human misery.
The Transformation of the Map
The industrial triangle emerges clearly in 1911, but not at all in 1871 (Figure 3, left panel). At that date only Lombardy stands out, with an index (1.36) well above the others'. Next comes Sicily (1.10), followed by Piedmont and Liguria (near 1.07). Venetia, Tuscany, Latium, and Campania cluster near the national norm; Emilia, the Marches and Apulia are somewhat below it (near 0.90), Umbria, Basilicata, Calabria, and Sardinia lower still (near 0.70), and the Abruzzi lowest of all (0.61).
A basic feature of post-Unification Italy's industrial growth thus appears to be the broadening of industry's geographic base, from Lombardy alone to the three regions of the industrial triangle. As noted, moreover, within that triangle industrialization seems altogether less vigorous in Piedmont than in Lombardy or (in particular) Liguria.
In 1871 the interregional differences are less marked than in 1911: the ratio of the highest regional index to the lowest is just 2.2, against 3.2 forty years later. What stands out, however, is so to speak the difference in the differences: as is evident from Figure 3 the industrial pattern of 1871 is not a muted version of that prevalent 40 years later, but a different one altogether. Eminent scholars from Richard Eckaus to Luciano Cafagna have argued that the North-South differential antedated Unification, and that its subsequent widening was the natural result of those initial conditions.37
Eckaus, “North-South Differential,” pp. 315–16; similarly Cafagna, “Contro tre pregiudizi,” pp. 300–01, 317. For further discussion see Fenoaltea, “Contro tre pregiudizi.”
In fact, and apart from Lombardy which was then clearly exceptional, the industrial divide in 1871 ran essentially east-west rather than north-south; the differential that opened up after that was clearly the result of changing current conditions, and not the path-dependent amplification of a pre-existing diversity.
The left panel of Figure 3 suggests that in 1871 the relatively industrialized regions were those that were most recently independent, or the home region of an independent state; the laggards were those long ruled from somewhere else (Sardinia, long attached to the Continent; Emilia, the Marches, and Umbria, long part of the Papal States; and the Abruzzi, Apulia, Basilicata, and Calabria, long subject to whoever was king in Naples).38
Sicily and the continental South had long been a single kingdom, but Sicily retained a significant if subsidiary capital.
Lombardy apart, therefore, in 1871 Italy's industrial map seems to be that of a traditional
ancien régime economy: one in which “industry” is not factory production, exported beyond the confines of the strictly local market and attracted by cost-reducing resources (cheap energy, transportation, and so on), but handicraft production for the ruling classes that spend tax revenues and land rents, export-oriented only if of world-beating quality, and naturally concentrated next to the court. The industrial, “
manufacturing” regions are those with the former capitals, of the preceding decades and centuries; the relatively nonindustrial regions are those that had long been peripheral parts of broader political units.
In such a context, the appropriate unit of analysis is not in fact the region, but (in Italy) the much smaller province.39
In a traditional economy, indeed, the surplus is drained from the entire subject territory and spent primarily in the capital; the outlying parts of the region with the capital are no different from the other regions. In the continental South that was once ruled from Naples, for example, the 1871 census counts almost 53,000 clothing and leather workers in the two provinces of Naples and Caserta (the Neapolitan Versailles), an average of 9,000 in the other provinces of Campania, and provincial averages of 7,000 to 11,000 in the Abruzzi, Apulia, Basilicata, and Calabria. This is exactly what the model predicts.
The region as such becomes relevant with the transition to factory production, as its particular endowment of natural and man-made resources proves more or less attractive to mobile capital and labor; by 1911 Italy's more industrial regions were those in the upper Po valley, favored by water power and easy transportation, and its Ligurian outlet to the sea. The traditional system left its mark, in the survival elsewhere of luxury handicrafts, and for that matter continued in part to operate, as evidenced by the rapid growth of Latium, with the new national capital city of Rome. In 1871, symmetrically, Lombardy stands out as particularly and exceptionally modern, in a national economy still dominated by the traditional system. The decades from 1871 to 1911 thus seem to cover the central span of a drawn-out industrial revolution.
DISAGGREGATED PRODUCTION AND COMPARATIVE ADVANTAGE
The Regions' Industrial Structure
The regions' industrial structure is documented by the sector-specific estimates of production. Their relative strengths are illustrated by the sector-specific indices of relative industrialization, calculated as the ratio of the region's share of each sector's national product to the region's share of the male population over 15.40
The estimates of production and the (initial and final) corresponding indices appear in Appendix Tables 2 and 3. Interpreted as coefficients of specialization (see note 33), these indices measure the extent to which a region's economy was specialized in a particular sector. If the region's share of the sector's national value added is divided instead by the region's share of industrial value added (Table 1, panel 2), one measures the extent to which the region's industry was specialized in that sector. Imagine a region with one million workers, of whom only ten thousand were in industry, all of them in textiles, in a nation with two million workers in textiles, five million in all industry, and ten million overall; and assume, for simplicity, equal products per worker across the board. The present index would be (0.01/2)/(1/10)=0.05, far below one, and indicate that the region's economy was not at all specialized in textiles; the alternative measure would be (0.01/2)/(0.01/5)=2.5, far above one, and indicate that the region's industry (such as it was) was in fact highly specialized in textiles.
In general, at the present level of aggregation, the regional structures are very similar: what is relatively large (medium, small) here is relatively large (medium, small) there, and the interregional, intrasectoral differences typically pale beside their intraregional, intersectoral counterparts.41
This is obvious to the eye if the absolute figures in Appendix Table 2 are converted into percentages of the regional totals (Fenoaltea, “Crescita,” tables 5–20, here omitted for reasons of space). In 1871, for example, the standard deviations of the sectors' percentage shares range from 0.2 to 4.8 if calculated within sectors, across regions, and from 6.3 to 8.7 if calculated across sectors, within regions.
This similarity may of course be eroded upon finer disaggregation; such as it is, however, it is suggestive of limited specialization in a world of high transport costs.
42 The major differences appear in the mining sector, obviously dominated by natural endowments: its share is often negligible, but reaches 5–6 percent in Tuscany, 10–20 percent in Sicily, and 15–25 percent in Sardinia. The share of construction also varies, with a relatively high weight not so much in the regions with rapid population growth as in those with little other industry: for example in Basilicata and Calabria, as well as in Latium and Apulia (all between 18 and 22 percent in 1871, and again in 1911), and not in Liguria or Lombardy (15 percent in 1871, 11–12 percent in 1911). The weight of the utilities also appears to vary systematically, especially in 1911, with particularly low values (ca. 2 percent) in the deepest South and major islands, presumably because of a lack of hydroelectric resources and municipal services; before that the indices are relatively unstable, perhaps reflecting the geographic diffusion of municipal services, perhaps reflecting no more than the exceptional weakness of the underlying data.43
The 1911 census was the first to consider the utilities a sector in their own right. The 1871 and 1881 labor-force data refer to gas works alone, the 1901 data only to power and gas (and some other mineral-processing that belongs elsewhere).
Within the manufacturing group the regional patterns are very similar, especially in 1871. The foodstuffs industry is everywhere the largest of the sectors identified here, followed at a distance by engineering (in fact blacksmithing, engaged in the maintenance of agricultural tools), and then by the processing of (nonfood) vegetable and animal products. The regional indices for the food sector are in fact strikingly close to those for total manufacturing: food processing seems to follow other manufacturing in the residential centers of the upper classes, confirming the traditional pattern noted above. The textile industry, already well along the transition to factory production, is instead relatively unevenly distributed: it is for example larger than the engineering industry in Lombardy, and still close to it in the Marches and Campania, but barely a fifth its size in Latium, and under a tenth in Sardinia. The leather industry seems different in yet another way: production per capita seems almost uniform, as if consumption per capita were everywhere similar, and the leather industry (unlike the foodstuffs industry) produced for rural consumers as well as urban ones.
This interregional similarity is reduced over time as transportation improves and the industrial triangle develops. In 1911 an industrial structure similar to that of 1871, with the foodstuffs industry perceptibly the largest, survives in much of the South (Apulia, Basilicata, Calabria, Sicily, and Sardinia), and also in Emilia (which unlike the others displays a corresponding index above 1.0). In a number of other regions the foodstuffs industry, in relative decline, has been matched or nearly so by the engineering industry, then at a cyclical peak: thus Venetia, Tuscany, Umbria, Latium, and the Abruzzi, and also the Marches and Campania, where in relative terms the textile industry appears instead much reduced. The industrial triangle differs from the rest of Italy, and also internally. In Piedmont, the foodstuffs industry is then second to engineering, with textiles a close third; in Lombardy, the engineering and textile industries are both significantly larger than food processing; in Liguria the textile industry has remained small, but engineering alone is by then almost twice the size of food processing.
The striking feature of the industrial triangle is the broad diffusion of its comparative advantages (at least at the present level of aggregation): in 1911 of the 12 manufacturing indices those below unity are only four in Liguria, three in Piedmont, and none at all in Lombardy, whereas those above 1.3 are six in Piedmont, five in Liguria, and no fewer than nine in Lombardy. Tuscany and Campania appear in turn with indices for total manufacturing near the national norm, and similar numbers of sector-specific indices below 1.0 or above 1.3. These regions are followed, with declining indices for total manufacturing and typically no more than a single strong sector (with an index above 1.3), by Venetia and Emilia, and then the Marches, Umbria, Latium, and Apulia; the rear is brought up by the Abruzzi, Basilicata, Calabria, Sicily, and Sardinia, all with an index for total manufacturing around 0.5–0.6, and no fewer than 11 of the 12 sector-specific indices below 1.0.
The evolution of the sector-specific indices suggests that the success of the industrial triangle is tied to growing shares of growing sectors; in the South the sector-specific shares generally decline, and the few that rise refer as often as not to sectors that are themselves declining. But this is mere accounting, and not yet economics. In a closed economy, to be sure, sector-specific growth rates depend essentially on income elasticities (and of course on substitution effects, if relative costs change), and the more dynamic regions will be those with an advantage in the faster-growing sectors. In a small open economy, on the other hand, production is not constrained by domestic, or even world, consumption, and the more dynamic sectors may be such simply because they are located in the regions that are relatively more capable of development.
To take a specific example, consider the textile industry, largely concentrated in the North. Had Italy been a closed economy, a prohibition on Northern textile manufacturing would have shifted the industry to the South (with secondary adjustments, but almost certainly a net improvement in the South's industrial performance). But Italy was an open economy. At the national level the relative growth of the textile industry was tied to the evolution of external trade, as substantial net imports of textiles gave way to equally substantial net exports; and this may have happened because textile manufacturing could grow in the North. Had some prohibition prevented the development of the Northern textile industry, the counterfactual alternative need not be the development of the textile industry in the South (let alone one successfully producing for world markets); rather, industrial growth might still have occurred largely in the North, and simply shifted to some other export-oriented branch of manufacturing, with a continued national import balance in textiles. The evidence that the industrial triangle enjoyed a comparative advantage not in a few specific sectors, but practically throughout manufacturing, supports the latter hypothesis.
Tariff protection is in a sense the mirror-image of this hypothetical prohibition. The textile industry was in fact much the most important branch of manufacturing favored by the tariff hikes of 1878 and 1887; and there is evidence that it continued to take advantage of tariff protection, on better-quality stuff, even as it developed substantial exports of the coarser grades.44
Fenoaltea, “Growth of Italy's Cotton” and “Manchester.”
Had the North's comparative advantage in textiles been balanced by a disadvantage in other manufactures, one could indeed claim that the tariff favored the industries of the North over those of the South; but if, as it seems, the North held a
general advantage in manufacturing it would as easily have developed any other sector favored by protection, as indeed those favored by free trade.
45 Italian industry was clearly hampered by the protection of grain, which raised labor costs at international prices (Fenoaltea, “Politica doganale”). Absent the textile tariff alone, therefore, the counterfact suggested by the preceding analysis involves reduced textile production, and greater nontextile production, within the North; with free trade the hypothetical changes would have been in good measure within the Northern textile industry, with higher exports of coarse goods offsetting the reduced production of import-competing higher grades.
The concentration of industry in the North accelerated in rough concomitance with the increase in protection; but the causal link from the latter to the former is moot.
The Industrial Origins of Regional Disparities
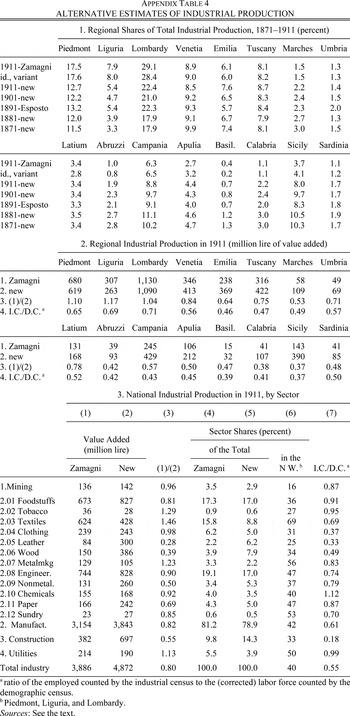
The upper panel of Table 4 presents the sums of the absolute deviations from 1.0 of the sector-specific regional indices in the four census years. These sums are themselves indices of regional disparities: if for a given sector each region has a share of production exactly in line with its share of the male population of working age all the local indices equal 1.0, and the sum of the deviations is zero. With perfect concentration 15 regional indices equal zero, so the sum of their deviations equals 15; the other index is equal to 100 percent divided by its region's percentage share of the male population, and therefore varies with the identity of that region. In 1911, for example, the limit values of the sum of the deviations equal 21.2, if the sector is entirely in Lombardy (the most populous region, with 13.9 percent of the males considered and a maximum local index of 7.2), and 90.9 if it is entirely in Basilicata (the least populous, with 1.3 percent of the males considered and a maximum local index of 76.9). The sum of the absolute deviations from 1.0 is thus an index of geographic concentration on the implicit assumption of uniform dispersion within each region.46
The fact that the upper limit of the index is not predefined may be perplexing, but it must be recognized as a virtue: it means that with perfect concentration in a single geographic unit the index continues to grow as the geographic disaggregation is increased and the relevant unit becomes smaller. The index would stop growing as one narrowed the geographic specification if the industry were, say, entirely Lombard, but uniformly dispersed within Lombardy itself; and this is at it should be.
Despite this limitation, the behavior of the sums of the absolute deviations is not without interest. Considering first the four major groups one notes that the lowest values always refer to construction, producer of immobile consumer durables and therefore closely tied to population itself, followed by manufacturing, tied then more than now to a direct contact between producers and consumers. The sums for the utilities are noticeably higher, especially in the early years when municipal services begin to appear in the more progressive cities; those for mining are highest of all, obviously because subsoil resources were relatively concentrated.
The sum related to manufacturing grows continually over time, presumably as transport improvements made for increasing specialization. The sums for the other major groups follow different paths. For the utilities, the decline in the sum in question between 1881 and 1911 seems due to the diffusion of municipal services. For construction, the sum seems to follow the Kuznets cycle, presumably because new construction was more concentrated, as well as more volatile, than maintenance.47
Total 1911-price value added in construction appears to have been 18 percent below the previous peak (1863) in 1871, at a new high just 1 percent above the previous peak (1874) in 1881, 24 percent below the previous peak (1886) in 1901, and at a new high (5 percent above the previous year's new high, and 57 percent above the 1886 peak) in 1911: Fenoaltea, “Notes,” table 2.
For mining, finally, the noticeable drop in the sum from 1901 to 1911 seems tied in part to the sulphur crisis that cut Sicily's share from over one-half to under one-third, and in part once again to the construction cycle, on the obvious assumption that low-grade construction materials were more widely distributed than ores.
Within the manufacturing group almost every sector-specific sum increases over time. The leather-goods industry is always the least concentrated, followed by foodstuffs and woodworking. In 1871 the engineering industry, dominated by blacksmithing, is barely more concentrated than leather; but with the growth of modern machinery-production this sector concentrates faster than any other, and by 1911 its sum is relatively high.
In 1871 the most concentrated sector is the tobacco-products industry, which appears at once anomalous, and characteristic of the traditional surplus-collecting economy. It is absent or nearly so in the peripheral regions of the former multi-regional states, as from the peripheral parts of the other regions: not of course for lack of consumers, but almost certainly because it generated conspicuous rents, and was tied to the administrative centers to improve monitoring. In 1871 the paper, sundry, metalmaking, and textile industries are also relatively concentrated; in 1911 the most concentrated are precisely these last two (with the former the leading sector in Liguria and Umbria, the latter the leading sector in Lombardy and Piedmont), followed by sundry manufacturing, paper, and tobacco (and, at a distance, engineering).
In the lower panel of Table 4 the sums presented as such in the upper panel are weighted by each sector's share of total national production (from the second panel of Appendix Table 1), so as to bring out each sector's contribution to overall industrial concentration. The weighted sums obtained for such highly concentrated but relatively tiny sectors as tobacco, metalmaking, and sundry manufacturing are of course relatively small; in 1871, indeed, the largest weighted sum is that for the foodstuffs industry, which was not highly concentrated but overwhelmingly large. Here too, however, economic causality involves more than mere accounting; if food-processing simply followed other manufacturing one must look elsewhere for the lead.
The textile sector appears particularly significant. Over time, the weighted sum for food-processing declines as that sector lags behind the others; the weighted sum for textiles grows, most markedly between 1881 and 1901, when thanks in part to the cyclical contraction of durables production it is far above that for any other sector. From 1901 to 1911 the cyclical upswing brings the weighted sum for engineering above that for textiles, which instead falls slightly; the other sectors are all far behind.
A final indicator can be obtained by comparing the weighted sum for manufacturing as a whole to the sum of the weighted sums for its component sectors.48
The comparison is within Table 4, panel 2: for example, in 1911 the weighted sum for manufacturing is 410, the sum of the weighted sums for its component sectors is (61+5+…+45+5).
If all the regions had identical structures, the regional indices would be identical across sectors and equal to that for total manufacturing; the weighted sum for all manufacturing would therefore coincide with the sum of the weighted sums for its various elements.
49 Because the weights are the sectors' shares of total national production, the weight attached to manufacturing as a whole is of course the sum of the weights attached to its components.
Different regions need not be equally involved in manufacturing; but their relative advantages would clearly apply to all manufacturing, and not to specific sectors.
Imagine instead a situation in which all regions are equally advantaged in total manufacturing, but with offsetting specializations in the different sectors. In this case, with only specific relative advantages but no general ones, the weighted sum for manufacturing as a whole is, by hypothesis, zero, whereas positive values are obtained for the sector-specific weighted sums, and so, therefore, for the sum of these sums.
The ratio of the sum of the sector-specific weighted sums to the weighted sum for all manufacturing thus equals one if comparative advantages in manufacturing are entirely general and not at all sector-specific, and grows without limit as one approaches the symmetric polar case in which such advantages are strictly sector-specific but not at all general. In the case at hand, the sum of the sector-specific weighted sums equals 288 in 1871, 338 in 1881, 449 in 1901, and 487 in 1911; its ratio to the weighted sum for manufacturing as a whole equals 1.25 in 1871, 1.26 in 1881, 1.23 in 1901, and 1.19 in 1911. Over its possible range from one to infinity this ratio is very close to one, and, apart from a slight dip after 1901, practically constant. Once again, therefore, the figures suggest that the more industrial regions enjoyed essentially general advantages.50
This result too is preliminary, of course, but it is relatively robust. If the sector-specific product per worker which the present figures assume constant were in fact systematically higher in the more industrial regions, it would obviously continue to hold; in fact, it would only be subverted if that product per worker were systematically lower in those regions, in all sectors (so the more industrial regions disappear) or at least in some (so their advantages are no longer general). For very recent evidence that among Italy's regions strong industrial growth was associated with a relative lack of specialization even in subsequent decades see Cainelli, Leoncini, and Montini, “Struttura.”
The source of these general advantages remains to be investigated.51
Italy's regional imbalances seem to be unusually severe (Cohen and Federico, Growth, p. 26). This may be because the disadvantages suffered by the lagging regions are rarely so general, or because they are frequently general but rarely so severe: absent the international comparisons that remain beyond the scope of this article it is impossible to tell.
In part, at least, one can attribute them to the natural environment: the year-round abundance of water (for power and more) thanks to the Alpine run-off, and the ease of transportation in the flat lands of the Po valley, clearly favored Cisalpine Gaul over the peninsula and islands to its south.
52 This bald statement is in the nature of a reduced form. A structural model would have to take into account the informational spillovers and feedbacks that reinforce these advantages, and may lead to specialization or the lack of it. Because a lack of specialization at the regional level is compatible both with specialization and with the lack of it at the local level, where these spillovers come into play, further research is required before much more can be said.
But that need not be all. In today's postindustrial global economy the North American region displays greater vitality and creativity than the West European region; and the relevant advantages seem not so much natural as institutional, as the legal and social framework of the one encourages, and of the other hinders, the enterprise of
homines novi. In post-Unification Italy the legal system was of course everywhere the same; but that need not have been true of the social system, and of the self-fulfilling expectations which it supported. The North's
general advantages may have had their roots here as well, for example if the “amoral familism” of the South were an obstacle not to traditional handicraft manufacturing, but to the more complex organizations required for factory production.
53 The quoted words are of course from Banfield, Moral Basis. For more recent analyses sensitive to these issues see A'Hearn, “Could Southern Italians?” and “Institutions,” and references therein.
If it were so these preliminary estimates would illustrate at once in post-Unification Italy the decline of the traditional “preindustrial” economy that tied handicraft production to the local recycling of the surplus, the rise of the properly “industrial” system that tied the growth of factory production to the regional endowment of natural resources, and at least the birth of the system that would become typical of “postindustrial” societies, where growth is tied in the first instance to the cultural and institutional environment.
Appendix 1: The Regional Production Estimates
SOURCES AND METHODS
The regional estimates are obtained by allocating national industrial output, in each of 15 sectors, in proportion to each region's share of the corresponding national labor force.
The census-year estimates of national output, by sector, are transcribed in Appendix Table 1, panel 1. These are excerpted from the time series presented in Fenoaltea, “Notes,” to which the reader is referred for further information. Appendix Table 1, panel 2 illustrates the varying composition of national industrial output; these figures are of interest in their own right, and enter subsequent calculations.
Appendix Table 1, panel 3 reports the sectoral labor-force figures computed from the census data.54
For the region-specific sectoral figures see Fenoaltea, “Crescita,” tables A.2–A.5.
As a rule, these are simple sums over the relevant census categories; because the industrial breakdown of the data is highly detailed, it is easy enough to transfer the relevant industries from one sector to another to match the classification of the output estimates.
55 For example, the 1911 census separately identified the sugar industry, but counted it among “chemicals” rather than “foodstuffs.” The subaggregation of the category-specific census data is fully documented in Fenoaltea, “Crescita.” The details of the present industrial classification are presented in Fenoaltea, “Valore aggiunto”; at the present level of aggregation it is, as noted, essentially standard.
The elementary census data are not corrected, because proportionate changes to the sector-wide data are as noted without effect, and the effect of narrower corrections is moot. At the present level of aggregation one would of course wish to over- and under-count the actual labor force of each sector's component industries in proportion to their product per worker;
ex ante there is no knowing whether a refinement of the census count for a specific industry reduces or increases the error in the final output estimates.
56 As noted, the early censuses often fail to separate the sales and production personnel of traditional small shops such as bakeries. So long as these complementary activities are carried out in fixed proportions—so that the actual labor force in production alone is overstated by a uniform percentage—the regional estimates of bread production are not distorted at all. Distortions creep in if one counts milling and baking together as “cereal processing,” and these two are not also, as they obviously need not be, in the same ratio from region to region; but the distortion then stems not from the systematic overstatement of the number of bakers but from the failure adequately to disaggregate by industry. The latter is a quite separate issue, discussed below; but extending the disaggregation of production is obviously more fruitful than reallocating the elementary census data.
Nor are Vitali's corrections to the census data taken into account: these were aimed at improving the figures' intertemporal comparability, which is here immaterial, and need not have improved them for the specific purpose at hand.
57 When working with imperfect estimates, moreover, the best protection against spurious interpretations is certain knowledge of their empirical content; and in the case at hand that knowledge seemed more easily obtained by reworking the census data from scratch than by digesting Vitali's volume.
The sole exception to the direct use of the census data concerns the figures for female textile workers, which are notoriously heterogeneous not only over time but across regions. Nationally, the number of female textile workers is much higher, and the number of housewives much lower, in 1881 than at other times. As has long been known, this apparent reclassification pertains mainly to the southern regions.58
See the discussion in Vitali, Aspetti, pp. 31–43. Vitali finally left the figures as the census has them, with a caution that many of these workers were strictly part-time.
The (region-specific) overcounting of female “textile workers” so manifest in 1881 is in fact also present, and evident from the regional figures if not from the national totals, in the other censuses as well.
59 Fenoaltea, “Crescita,” tables A.2–A.5.
The present labor-force figures for textiles alone accordingly apply a uniform correction across the four censuses, calculating the number of workers in each region as the sum of the reported males and a number of females capped at four for each male. This four-to-one figure reflects the ratio prevailing in Italy as a whole in 1911, when the attendant (national) distortion is minimal (and also in Lombardy, where the industry loomed largest, from 1881 on).
60 Zamagni, “Century,” pp. 37–42, reestimated textile employment in 1911 by inflating the industrial-census figures. Her aggregate estimate is only marginally below that obtained here, and the regional distributions too are very similar, especially if one allows for the regional bias in the industrial census itself (Appendix 2). Zamagni also estimated textile employment in 1881, albeit from a partial industrial survey taken some years before. These figures too appear to be regionally biased, and generally far too low; in some regions, they imply impossibly high rates of unemployment among male workers even on the assumption that the industry employed no females at all (ibid., p. 42; and Fenoaltea, “Crescita,” table A.3). The overriding correction, however, is to the inflated figures for female “textile workers,” and the regional distribution implied by her figures is much closer to that obtained here than either of these is to that implied by the census data.
Appendix Table 1, panel 4 transcribes the year- and sector-specific ratios of national output, by sector, to the corresponding national labor force. These are of course the 1911-price value-added-per-counted-worker weights that transform the labor force counts into estimates of production.61
For a discussion of these see Fenoaltea, “Crescita,” appendix A.
The production estimates by year, region, and sector are transcribed in Appendix Table 2. These are of course the primary result of the research presented here; they are tucked away in this Appendix only to conserve space.
Again to conserve space the illustration of each sector's percentage share of each region's production, and the illustration of each region's percentage share of each sector's national production, are simply omitted.62
These may be found in Fenoaltea, “Crescita,” tables 5–24.
reports the ratios of the latter percentages to each region's percentage of the male population over age 15 (
Table 2, panel 2).
63 Again for reasons of space Appendix Table 3 reports only the figures for 1871 and 1911; those for 1881 and 1901 appear in Fenoaltea, “Crescita,” tables 26–27.
These ratios are here interpreted as sectoral indices of relative industrialization analogous to the aggregate indices in
Table 3, and underlie the summary statistics presented in
Table 4.
AN EVALUATION
As noted, the present production estimates do not allow for the differences in product per counted worker that are at once intratemporal, interregional, and intrasectoral. This neglected variation may stem from three levels of interregional differences: in output per actually employed worker in the self-same activity; in the mix of activities within the broad sectors identified by the present analysis; and of course in actual employment, relative to the labor force counted by the census. On the face of things, one might expect that the more advanced regions were characterized by tighter labor markets, more capital-intensive industries, and more productive methods; if it were so, the present estimates would understate interregional differences in production (and to the extent that those differences grew over time, interregional differentiation, too). On each of these points, however, reflection suggests more cautious conclusions.64
Because the present estimates' putative understatement of regional differences would be greatest at the end of the period at hand, the following discussion pays particular attention to their likely bias in 1911.
Consider first the presumption that the present results are biased against the more industrialized regions because of the slippage between the labor force counted by the demographic census and actual employment. This bias is unlikely to be significant, if only because the labor force is dominated by the actually employed. The percentage of the labor force which was unemployed (or, symmetrically, employed but not counted) may vary by an order of magnitude; but the variations that matter here are in its complement to one, and these are inevitably small.65
If the unemployment rate varies by a factor of ten, from 10 percent to 1 percent, the employment rate varies by only 10 percent, from 0.90 to 0.99. Next to the correction for intersectoral differences in product per worker (Appendix Table 1, panel 4), this further correction is all but negligible.
More specific considerations suggest that that bias may be not just small but nonexistent. First of all, the sharing of (unskilled) industrial labor between industry and agriculture need not have been significantly lower in the industrially advanced areas. Even in the latter, the development of nonagricultural employment by no means smoothed out the seasonal variation in the marginal product of unskilled labor—in turn-of-the-century Lombardy, for example, peak agricultural wages were treble the off-season rate—and as far as one can tell from the 1911 industrial census the share of firms that worked year-round was substantially similar in the industrial triangle (81.2 percent) and in the rest of Italy (78.3 percent).66
Geisser and Magrini, Contribuzione, pp. 74–75; and Ministero di agricoltura, industria e commercio, Censimento degli opifici. Sharp seasonal variations in wages can specifically produce annual “wage” data that suggest highly segmented labor markets even if these are in fact perfectly integrated: see Fenoaltea, “Production,” appendix B.
Moreover, labor-sharing worked both ways: agriculture also shared its labor with industry, and the measured industrial labor force need not be an upper limit to actual employment. In the specific case of seasonal industries processing perishable goods right after the harvest, employment is drawn for a brief period from other sectors, and in the census these individuals presumably appear with their primary occupation.67
Even the industrial census misses this seasonal employment, save for the industries that happen to be active on the day; see the discussion (and the attendant corrections) in Fenoaltea and Bardini, “Valore aggiunto,” pp. 177, 185–90.
Significant processing of milk and meat also took place on-farm, by workers the census naturally attributed entirely to agriculture. The present regional production estimates are accordingly inexact to the extent that the omitted labor input varied as a proportion of the census labor force; as to the direction of the resulting bias all one can add at this point is that the industrial triangle produced a disproportionate share of Italy's milk, but little of its sugar-beet or tomato crop.
68 Federico, “Valore aggiunto,” pp. 4–9. In the case of milk products, the regional concentration of the industry may have been reinforced, or partly offset, by variations in the ratio of on-farm to off-farm production; but these have yet to be determined.
As far as regional unemployment and underemployment proper are concerned, too, long-term industrial performance is only one of the relevant factors. For unskilled labor in particular, overall regional growth matters more than industrial growth as such, and as noted one of the results thrown up by the present analysis is that the two are less closely related than one would have thought. Cyclical variations also matter, in two separate ways. First of all, and especially for skilled labor, the rate of unemployment is plausibly tied to the deviation of census-year production from the previous peak. In 1911, in particular, the industrial triangle stood out primarily for the development of its textile and engineering industries; but the engineering industry was then nearing the end of a long boom, and grew less than the other sectors combined, whereas textile production had been in a continuous slide since it peaked in 1908. Secondly, and more generally, the census-year benchmarks are naturally interpreted as indicators of long-term growth; from this perspective the fact that 1911 alone practically coincided with an investment-cycle peak distorts the long-term picture in favor of the leaders.69
The sector-specific and aggregate time series appear in Fenoaltea, “Notes.”
Consider next the possible variation in the mix of subsectors within the broad sectors identified by the present analysis. On this score, the output estimates' margin of error obviously depends on the level of disaggregation at which the present method is applied; with only 15 sectors, each of these is composed of a variety of subsectors, and these are often very different. The natural presumption is that the more advanced regions were the seat of the more capital-intensive subsectors, with a relatively high product per worker; and if it were so the estimates which neglect this difference would underestimate their relative performance.
In the context at hand, however, the evidence does not support that presumption. In 1911, when regional disparities were greatest, value added per worker varied from sector to sector by an order of magnitude; but the average of these figures obtained with the labor-force weights of the industrial triangle (1,194 lire) practically coincides with the national norm (1,164 lire).70
The national average is calculated with the corrected labor force (Appendix Table 1, panel 4). For the distribution of the labor force in the industrial triangle see Fenoaltea, “Crescita,” table A.5.
One reason is that the industrial triangle tended to produce more of everything, with an industrial structure which remained relatively similar to that prevailing elsewhere. The most significant exceptions were the industrial triangle's relative strength in engineering (47 percent of national output), and especially its dominance in textiles (69 percent of national output); and if in engineering product per worker was indeed relatively high, in textiles it was equally significantly low (
Appendix Table 1, panel 4).
The 1911 industrial census prompts similar conclusions. It contains no information on financial stocks or flows; but it naturally counted the employees of the covered establishments and measured power in use. The latter can be considered a broad proxy for capital; and as it turns out in the aggregate the industrial triangle contained 49 percent of total census employment, and the identical percentage of power in use.71
Cafagna, “Tempi,” p. 353; also Cafagna, “Industrial Revolution,” p. 323; and Zamagni, Industrializzazione, p. 191. In fact, this statistic is almost certainly biased in favor of the North: the census was taken in June, a month of high water for rivers fed by the Alpine snow-melt, and low water for (rain-fed) rivers elsewhere.
Clearly, the industrial triangle was
not particularly concentrated in the high-product sectors; the assumption that it was nonetheless concentrated in the high-product subsectors would be gratuitous.
72 The regional “VA/L” figures in Zamagni, Industrializzazione, pp. 194–95 suggesting a value added per worker systematically higher in the industrial triangle than in the South actually reflect a series of mutually reinforcing biases (see Appendix 2).
The subsectoral differences in product per worker, which the present estimates neglect, can of course bias the results on narrowly specific grounds even if not on general ones; but the considerations that can here be brought to bear are as preliminary as the estimates themselves. Within the engineering industry, for example, and whatever may have occurred elsewhere, one is certainly inclined to believe that capital-intensive machine-making was less widely diffused throughout Italy than labor-intensive blacksmithing; but the product per worker in these extreme subsectors seems to deviate from the sector average by no more than perhaps a fifth.73
The detailed value added estimates in Fenoaltea, “Valore aggiunto” and the related census-based labor-force figures yield subsector averages equal to 1.55 thousand lire per worker in “fabricated metal” and 2.15 in “heavy machinery,” against 1.77 for “engineering” as a whole. Zamagni, Industrializzazione, p. 69, reports regional averages for engineering firms varying from 1.68 to 3.42 thousand lire per worker, against a national average of 2.39; but these extreme values are based on at most one-tenth of an already tiny, unrepresentative sample of 98 firms. Adding in the rest of the 40,000 firms counted by the industrial census (not to mention those it missed: Appendix 2) would surely much dilute these differences.
Within the chemical industry, which included everything from the hand-squeezing of citrus peels for essential oils to electrochemicals with in-house hydroelectric power plants, the within-sector differences range up to three times that much; but these extreme cases were a small part of an already small sector, and neither of these exceptional industries was concentrated in the industrial triangle.
74 The citrus-based industries were of course located in the South, and the dedicated hydroelectric plants and related electrochemicals were located primarily in the central Apennines; together, they represented 7 percent of the industry. The estimated product per worker was some two-fifths above or below the sector average in the production of acids, matches, and pharmaceuticals; these represented another quarter of the industry.
Still wider margins appear in the case of the foodstuffs industry, in good measure for the reasons already noted.75
The output of the foodstuffs industry is relatively poorly established even at the national level: see Fenoaltea, “Notes” and “Production.”
The sector as a whole was among the least concentrated; but this was due overwhelmingly to the extreme diffusion of bread-making and the like, with a product per worker 30 percent below the sector average. The product per worker in milling and the like was instead a third
above that average, but the compensation is only partial, as milling employed half as many workers as bread-making, and it presumably was not, like bread-making, present everywhere. The sectors with the highest product per worker are predictably those that badly undercount the actual labor force: seasonal canning, sugar-extraction, and the like (50 percent above the sector average), and especially milk processing, performed largely on-farm (80 percent above the sector average). These two subsectors were similar in their total value added, and in their recorded labor force; and as noted their different geographic distribution suggests that (at least in terms of the broad distinction between the industrial triangle and the rest of Italy) the biases they introduce were largely offsetting.
Consider finally the possible interregional variation in output per employed worker within the same specific activity. The natural presumption, once again, is that such output was higher, because production was more capital-intensive, in the more advanced regions. But this is no more than a repetition of the argument encountered above, transported from the industries that make up a sector to the activities that make up an industry; the underlying assumption is one and the same, and the empirical objections to the former argument apply equally to the latter. As noted, the evidence suggests that the industrial triangle did not specialize in capital-intensive production: at least not overall, and not across sectors. There is no reason to believe that it nonetheless specialized in the capital-intensive industries within each sector, or, altogether similarly, in the capital-intensive techniques within any particular branch of production.
As a matter of logic, moreover, in an interregional context the relation between relative physical productivity and relative real product per worker is not one of simple identity. Assume for example that in the advanced region a unit of output is produced, with a value added of 50 lire, by a single unit of labor, with a wage of 25 lire. Let real value added be measured in units of labor, or in wage goods; with the unit of the latter chosen to correspond to the purchasing power of the unit wage, the production of this single unit of output corresponds in either case to the production of two units of real value added.76
On the meaning and measurement of real value added see Fenoaltea, “Real Value Added,” or, briefly, Fenoaltea, “Notes.”
Assume now that in the backward region labor productivity is lower, and staffing rates 50 percent higher. Assume further that the regions engage in trade, and that the backward region exports bulky commodities (foodstuffs, industrial raw materials) and imports manufactures; the local price of its exports is correspondingly lower than in the advanced region by the transport-cost margin (and the local price of its imports higher but by a much smaller margin, as these are a partial cargo on the backhaul). With real wage equivalence, the local money wage will be lower as the wage-good price level is lower: assume, for present purposes, 20 percent lower. Grant now that at local prices the value added per unit of output is instead 20 percent
higher than in the advanced region, precisely because the raw material is exported to the latter while the output is imported from it. The unit of output thus entails a value added of 60, corresponding to three units of labor (or of wage goods); with staffing rates at 1.5 units of labor per unit of output, each worker produces just two units of real value added—exactly, as it turns out, the figure obtained for the much more productive labor of the advanced region. Real-world figures are unlikely to be so serendipitous; what remains is the conclusion that the actual bias in the estimates of regional product bears no simple relation to the neglected differences in physical productivity, and need not even be in the expected direction.
To conclude, the precision of the present estimates is clearly limited; but the order-of-magnitude corrections to the labor-force data that reflect intersectoral differences in product per worker dominate the neglected intrasectoral differences, and the latter are in any case unlikely to work entirely at cross purposes to the former. On the admittedly self-serving assumption that the national sector product figures are not themselves a major source of error, the present estimates reveal the regions' relative progress significantly better than the labor-force figures themselves.
First impressions perhaps to the contrary, too, the present estimates do not appear heir to significant, systematic bias against the industrial leaders. Such a bias would in any case have no effect on the discovery that in 1871 only Lombardy was perceptibly more industrialized than Sicily; that overall regional growth was surprisingly weak in Piedmont, and surprisingly strong in Apulia and Sicily; that regional differentiation accelerated after 1881; that the industrial structure of the various regions was relatively similar, especially as one goes back in time; and that the advantages enjoyed by the industrial triangle were apparently general rather than narrowly sector-specific. From this perspective, at least, the arguments and hypotheses developed above appear robust.
Appendix 2: Alternative Estimates of Regional Industrial Production
Appendix Table 4, panel 1 reproduces the available estimates of the regional shares of total industrial production.
Esposto's figures refer to 1889–1893; they are here labeled “1891.” He obtained his regional production estimates from provincial surveys taken from 1885 to 1902; to convert the reported value-of-output figures to the desired value added estimates he used ratios derived from mid-century data for the United States.77
Esposto, “Italian Industrialization.” The figures transcribed here are drawn from his table 2.
Though his sources and methods are very different from those used here, the regional distribution which emerged from his calculations is relatively close to those yielded by the present estimates for 1881 and 1901. This broad agreement on the estimated regional shares of the total no doubt masks considerable differences in the underlying detail; but the overall congruence of the two distributions exceeds what one could have expected, and each set of estimates can take comfort in the other.
Zamagni's estimates for 1911 were obtained from a rich variety of sources, but much the most important was the industrial census taken in that year.78
Zamagni, Industrializzazione; Ministero di agricoltura, industria e commercio, Censimento degli opifici.
Her regional shares of all industry are reported on the first line of panel 1; the variant in the next line reports her estimates as calculated by Esposto, presumably with some adjustments to exclude the sectors not also covered by his own estimates.
79 Zamagni, Industrializzazione, p. 198 (table 58, cols. 3–4); and Esposto, “Italian Industrialization,” table 2. The excluded sectors are almost certainly construction, and probably the utilities as well; one notes that Zamagni calculated that construction represented one-quarter of industry in Latium, and nearly one-half of it in Basilicata.
Her figures differ from the present estimates much more than Esposto's do: the shares she attributes to the regions of the industrial triangle are perceptibly above those obtained here, and almost all the others are lower, with relative deviations that peak in the extreme South. To the extent that the present figures are homogeneous over time, their comparative agreement with Esposto's and disagreement with Zamagni's suggests that the differences between these two previous estimates reflect the differences in their sources and methods more than the differences in the reality they both sought to measure.
80 Esposto's direct comparison of the two thus seems not a little rash; but the present estimates confirm his broad assessment that Southern production declined in relative but not in absolute terms, and that the Northwest captured most of the growth in textiles, engineering, metalmaking, and chemicals.
Appendix Table 4, panels 2 and 3 explore the differences between Zamagni's estimates and the present ones.81
Her regional estimates in panel 2, line 1 are the sum of the two components (construction, other industry) reported in Zamagni, Industrializzazione, p. 198 (table 58, cols. 3–4). Her sectoral estimates in panel 3, column 1 are primarily those she reported on pp. 131 and 188–89, with complementary (disaggregated) figures taken from pp. 79, 115, 118, 131, and 198. Her estimate of value added in rubber (31 million lire), here included with chemicals, was obtained by subtracting paper from their reported sum.
One notes, first of all, that her estimate of national industrial produc-tion is 20 percent below the present author's (panel 3); her estimates of regional production are nonetheless higher than the present estimates for the three regions of the industrial triangle, and correspondingly much lower for the other regions, by margins that typically increase as one moves south (panel 2, line 3).
It is of course impossible to review her calculations in detail within the compass of a few pages, but a few general considerations may explain the pattern of her results.82
Zamagni's copious tables on the regional distribution of the various sectors report a number of relevant indicators, but not her final estimates of each sector's value added in each region; the exact reconstruction of her regional aggregates is difficult if not impossible.
In general, it would seem, her figures reflect the systematic regional bias of her principal source, aggravated by the distortions introduced by her ancillary sources.
The published industrial census includes an introduction that warrants careful reading. The industrial census was taken in conjunction with the contemporaneous demographic census, and relied on two sets of questionnaires. One was a specifically industrial questionnaire, sent to all separate shops employing more than one person; the other was the general demographic questionnaire, which was supposed to capture all one-man operations, and all industrial activity carried out at the householder's residence. In the event, the demographic questionnaire failed to do double duty, and the published data compiled only the partial results collected with the specialized questionnaire. The results were very partial indeed: the industrial census counted only 2.3 million industrial workers, against 4.3 million counted by the demographic census (or 4.2 million, eliminating bogus “textile workers”).
The industrial census thus missed an enormous number of small-scale, one-man operations, but not only those. To the bureaucratic mind, it would seem, the primary criterion was the orderly movement of paper: one questionnaire was to reach each residential address, the other each separate workshop that employed more than a single person, but in no case were both questionnaires to be delivered to the same address. The industrial census thus missed not only the “domestic activity” carried out within the artisan's house, but all production carried out at the same address as the master's residence. The proof of this pudding comes from the rubber industry in Milan: one looks in vain in the industrial census for the thousands of workers employed by the Pirelli works, because the Pirelli factory and Mr. Pirelli's residence were in fact at the same address.83
Fenoaltea, “Valore aggiunto,” p. 110.
There is no intrinsic, qualitative difference between the operations the industrial census covered, and those it missed: their average scale was surely different, but their distributions thoroughly overlap.
The industrial census did not count “employment” in the usual, comprehensive meaning of the term. First of all, as just noted, it missed even substantial factories. Second, it systematically excluded employment in one-man shops or workers' homes; but that labor is no less “industrial” than employment in larger groups or separate places. The national income accounts include that small-scale and domestic production for the market in industry, and nowhere else—and, one might add, rightly so: the large-scale factory is only one way to organize production, which prevails in some circumstances but not in others, and it is in no way ontologically superior (witness the workers who today supply the Benetton clothing firm, working at home as their “protoindustrial” forefathers did). Third, the discrepancy between the census totals vastly exceeds any conceivable unemployment. From 1901 to 1911 industrial production boomed; the industrial labor force increased 17.6 percent, against a mere 6.3 percent increase in the population aged 15–65; 18.2 percent of the population moved abroad, about a quarter of those permanently; and both money and real wages increased very substantially.84
Appendix Table 1; Istat, Sommario, pp. 39–40, 65; and Fenoaltea, “International Resource Flows,” p. 635, and “Production,” tables 5–6.
In 1911 the incidence of industrial unemployment was surely very minor.
The industrial census thus counted “employment” only as the membership lists of exclusive clubs in apartheid South Africa counted “whites”: the figures do exclude all persons of the other sort, but the excluded individuals were by no means confined there to “other races,” or here to “the unemployed” (or even, as noted, to “those not employed in factories”). Overall employment was surely far closer to the comprehensive labor-force figures in the demographic census than to the highly incomplete “employment” figures in the industrial census.
The relative coverage of the industrial census varies across regions (panel 2, line 4). In the industrial triangle, its overall coverage is 69 percent; elsewhere, because more individuals worked alone, or because more shops were attached to their owner's residence, or even because of lower compliance in returning the industrial questionnaire, that coverage is just 46 percent. The “industrial census” missed under 30 percent of the work force in Lombardy, over 60 percent in Basilicata, Calabria, and Sicily. The demographic census is of course imperfect (see Appendix 1), but apart from the occasional overstatement of female textile workers its regional biases are minor, and it seems far less regionally biased than the treacherously partial “industrial census.”
The relative coverage of the industrial census also varies across sectors (panel 3, col. 7).85
These figures are approximate, as the industrial census includes categories that straddle industries. These are here allocated as follows: 219, to foodstuffs; 225, to engineering; 238, to clothing; 242–243, to mining; 244, to wood; 245, to textiles; 246, to chemicals; 247, to paper; and 248, to construction.
Not surprisingly, that coverage seems correlated with the relative incidence of large-scale operations in fixed locations: it is practically complete in chemicals and the utilities, high in mining, food, tobacco, metals, and paper, lower but still well above average in textiles, engineering, nonmetallic mineral products, and sundry manufacturing, sharply below average in clothing, leather, and wood, and lowest of all in construction.
86 The coverage of the chemicals sector is brought over 100 percent by category 246, which seems to have used workers borrowed from the primary sector. Construction sites would naturally be missed by the directories from which the census-takers identified their addressees, and the problem persists in later censuses; there is no reason to imagine underemployment at the height of the construction boom, let alone an illegal “black economy” (Zamagni, “Century,” pp. 44–45).
On the other hand, that coverage seems essentially
not correlated with the share of each sector located in the industrial triangle (col. 6, calculated from
Appendix Tables 1 and
2), either as is or weighted by the sector's share of the total (col. 5, from
Appendix Table 1); in general, therefore, the higher coverage of particular regions does not seem due to the higher coverage of particular sectors (nor of course vice versa).
87 There may be individual exceptions: Sardinia's average coverage seems close to a weighted average of the ca. 40 percent that prevailed elsewhere in the Mezzogiorno, and the ca. 90 percent that characterized the mining sector.
This negative result is intriguing: a more detailed comparison of the two censuses cannot of course be pursued here, but if the differences in the regions' coverage could not at some point be traced back to differences in the composition of production the suspicion would grow that the underlying differences were not so much technical as social (residential patterns, levels of compliance).
Zamagni's regional estimates are obtained, like the present ones, by allocating sector-specific value added estimates across the relevant regions. In a small number of cases, where production was taxed or otherwise monitored (mining, sugar), her allocation follows the regional distribution of production revealed directly by the sources; but these are exceptions. The bulk of industrial production is allocated on the basis of the employment registered by the industrial census alone: Zamagni took it to be substantially complete, save only a tail of “domestic workers” that a strict definition of “industry” could as leif exclude, and the implications of its incomplete and regionally biased coverage were altogether overlooked.88
Zamagni, Industrializzazione, p. 195. There is a reference there to the introduction of corrections for interregional productivity differentials (despite her own evidence that production was not systematically more capital-intensive in the northwest than elsewhere, p. 191); these cannot be reconstructed as such (see note 82), but presumably favor the industrial triangle and thus exacerbate the already significant bias introduced by the census itself. On p. 233 the discrepancy between the demographic and industrial censuses is explicitly chalked up to “serious underemployment and work in the home”; as noted, neither provides an acceptable justification for her procedure.
The bias introduced in Zamagni's regional allocation of the sector estimates of value added seems to have been reinforced, in part by happenstance, by errors in the sector estimates themselves (panel 3, cols. 1–3). These estimates were derived, wherever possible, from contemporary evidence (or estimates) of the value of production, scaled by ratios of value added to value calculated from other censuses (preferentially the Italian census of the later 1930s); where that procedure could not be followed the estimates were derived from census employment figures.
Employment-based estimates of value added were calculated for the traditional, heavily artisanal industries: clothing, wood- and leather-working, and small-scale engineering. Here too, the industrial census was generally considered comprehensive, or nearly so: the workers counted only by the demographic census are taken into account, but evaluated with a very heavy discount, apparently on the assumption that they were underemployed or otherwise unproductive.89
Zamagni, Industrializzazione, pp. 115–18. Even in these cases, oddly, the regional distribution of the industry was then determined from the industrial census alone: ibid., pp. 119, 195 and passim.
Given the nature of the sources, however, that procedure seems vastly to have exaggerated the difference between the workers that appear in both censuses, and those that do not; and because the coverage of the industrial census was there particularly low, her sectoral estimates are too.
90 Panel 3, sectors 2.04–2.06. Her estimate for the clothing industry was however reinflated by an estimate of value added per worker, derived from the 1930s, that seems much too high given the preponderance of female labor in 1911; Zamagni, Industrializzazione, p. 118. The low estimate for construction has a different origin; it is returned to below.
A regional bias is introduced because these are precisely the significant manufacturing sectors in which the industrial triangle's share of total production was much lower than average (panel 3, col. 6).
Other estimates introduce a similar bias, through sheer bad luck. Zamagni did not examine the construction industry, but introduced it into her aggregate estimates by borrowing Istat's value added figure (and allocating it, as usual, on the basis of the industrial census alone). Construction was also a sector in which the industrial triangle produced far less than its overall average; Istat grossly underestimated the sector's value added, but only subsequent research would bring that out.91
Zamagni, Industrializzazione, p. 198; and Fenoaltea, “Construction.”
The textile industry is a mirror image of the preceding sectors: the sector was much the most overrepresented in the industrial triangle, and Zamagni's value added figure is her most grievous overestimate (panel 3, cols. 1–3 and 6). Zamagni's error here stems largely from her direct application of the ratio of value added to value observed in the 1930s, without considering the possible changes in the industry's cost structure. As has been pointed out elsewhere, however, those changes were significant: in the cotton industry because the Depression dramatically reduced the relative price of the raw material, and in the silk industry because the raw material had largely shifted from the expensive natural fiber to the cheap synthetic substitute.92
Fenoaltea, “Growth of Italy's Silk” and “Growth of Italy's Cotton.”
The interplay of these errors distorts the structure of production in a way which markedly inflates the share of the industrial triangle (panel 3, cols. 4–6). The most significant contrasts are between leather, wood, and construction on the one hand, and textiles on the other. The first three (where the industrial triangle's share of the national total was just a quarter to a third) account for just 16 percent of Zamagni's total, against over 28 percent with corrected figures; conversely, the share of textiles, which the triangle dominated with almost 70 percent of the sector total, is set by Zamagni at 16 percent of the total rather than 9 percent.93
Metalmaking and engineering also contribute to the exaggeration of the industrial triangle's total output, but much less markedly.
Zamagni's figures thus assume that the sectors in which the industrial triangle was relatively weak were no more than equivalent, together, to the sector which it utterly dominated, whereas the former were actually over three times as large.
94 Zamagni, Industrializzazione, pp. 194–95 presents estimates of regional disparities which contain yet another source of bias. Perhaps because she is there aiming at family incomes, her estimates of regional value added in col. 1 (for industry excluding construction: p. 198) are converted to value added per worker (col. 2) on the basis of the demographic-census labor-force data rather than the industrial-census employment data. What exactly those data are is not indicated; her national estimates in the last row imply a labor force of 3.49 million people, whereas the direct sum over the census categories she supposedly includes (pp. 224–25) yields a total of 3.67 million (the discrepancy does not match up to either extreme age group: not ages 10–15, of whom there are too many, nor ages 65+, of whom there are too few). Her lowest “VA/L” figures appear predictably in the South, with a minimum of 293 lire in Calabria, far below the national norm of 1,005. The ratio of these figures (0.29) is algebraically equivalent to the ratio of the region's share of national value added to its share of the labor force, which her figures place at 1.03 and 3.52 percent, respectively. As indicated in Appendix Table 4, panels 2 and 3, the industrial census covered 41 percent of Calabria's labor force, and 55 percent of Italy's; on this score alone the region's share of national value added should be revised upward by a factor of (0.55/0.41)=1.34. Moreover, Calabria was then the principal locus of the remaining overcounted (female) “textile workers.” Eliminating these from the regional and national labor force (on the basis of the present estimates, similar as noted to those later developed by Zamagni herself), Calabria's total labor force falls from 0.128 million to 0.083 million, whereas the national figure falls from 3.67 million to 3.60. The corrected regional share of the labor force is thus 2.31 percent, or 66 percent of Zamagni's 3.52 percent. Together, these corrections raise Zamagni's ratio of “VA/L” in Calabria from 0.29 to 0.59 of the national norm. The further correction to allow for the regional biases implicit in Zamagni's sectoral estimates is too tedious to be attempted here; but if it were similar in size to each of the preceding two it would go a long way toward closing the gap with respect to the 0.93 ratio implied by the present estimates (which include construction; Table 1 and Fenoaltea, “Crescita,” table A.5), and leave only a small residual to be traced to her intrasectoral adjustments to value added per worker.
Zamagni's early work on regional industrial production in 1911 was a notable, pioneering piece of research; but her estimates clearly inflate the industrial triangle's share of the national total. The present estimates correct hers for the undercounting by the industrial census everywhere but especially in the South, for the particular undervaluation of the sectors in which the industrial triangle was relatively weak, and for the dramatic overvaluation of the sector which it dominated.