


1. Introduction
The ability to understand and predict the wall-shear stress in wall-bounded turbulence is pursued in aerodynamic/hydrodynamic design of modern aircraft and ships, among many engineering applications. The wall-shear stress can be decomposed into mean and fluctuating components, i.e. 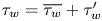 $\tau _w=\overline {\tau _w}+\tau _w'$. Although many studies have focused on the properties of the mean wall-shear stress, such as its Reynolds number dependence (Nagib, Chauhan & Monkewitz Reference Nagib, Chauhan and Monkewitz2007; Chauhan, Monkewitz & Nagib Reference Chauhan, Monkewitz and Nagib2009; Schlatter & Örlü Reference Schlatter and Örlü2010), its physical-informed decomposition and connection with the statistical quantities across the wall layer (Fukagata, Iwamoto & Kasagi Reference Fukagata, Iwamoto and Kasagi2002; Renard & Deck Reference Renard and Deck2016; Yoon et al. Reference Yoon, Ahn, Hwang and Sung2016; Modesti et al. Reference Modesti, Pirozzoli, Orlandi and Grasso2018; Fan, Cheng & Li Reference Fan, Cheng and Li2019a; Fan, Li & Pirozzoli Reference Fan, Li and Pirozzoli2019b; Li et al. Reference Li, Fan, Modesti and Cheng2019) and active/passive control approaches (Gose et al. Reference Gose, Golovin, Boban, Mabry, Tuteja, Perlin and Ceccio2018; Yao, Chen & Hussain Reference Yao, Chen and Hussain2018; Li & Liu Reference Li and Liu2019; Yao & Hussain Reference Yao and Hussain2019), to date, very few works have investigated the features of wall-shear stress fluctuations and their associated dynamics. Despite this lack of analysis, wall-shear stress fluctuations are of importance for noise radiation, structural vibration, drag generation and wall heat transfer, among others (Choudhari & Khorrami Reference Choudhari and Khorrami2007; Diaz-Daniel, Laizet & Vassilicos Reference Diaz-Daniel, Laizet and Vassilicos2017; Zhang et al. Reference Zhang, Chen, Wang and Wang2017; Bae et al. Reference Bae, Lozano-Durán, Bose and Moin2018).
First laboratory experiments were incapable of measuring the instantaneous wall-shear stress with enough accuracy to produce meaningful signals. Researchers reported that the intensity of the wall-shear stress fluctuations were not sensitive to the Reynolds number within the measurement uncertainties (Eckelmann Reference Eckelmann1974; Chambers, Murphy & McEligot Reference Chambers, Murphy and McEligot1983; Madavan, Deutsch & Merkle Reference Madavan, Deutsch and Merkle1985; Karlsson & Johansson Reference Karlsson and Johansson1986; Alfredsson et al. Reference Alfredsson, Johansson, Haritonidis and Eckelmann1988). For instance, Alfredsson et al. (Reference Alfredsson, Johansson, Haritonidis and Eckelmann1988) suggested that the root mean squared value of streamwise wall-shear stress fluctuations follows 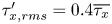 $\tau _{x,rms}'=0.4 \overline {\tau _{x}}$, where
 $\overline {\tau _x}$ is the mean component of the streamwise wall-shear stress. However, recent studies using both direct numerical simulations (DNS) and experiments have shown that
 $\tau _{x,rms}'$ is actually sensitive to changes in the Reynolds number (Fischer, Jovanović & Durst Reference Fischer, Jovanović and Durst2001; Abe, Kawamura & Choi Reference Abe, Kawamura and Choi2004; Hu, Morfey & Sandham Reference Hu, Morfey and Sandham2006; Große & Schröder Reference Große and Schröder2009; Schlatter & Örlü Reference Schlatter and Örlü2010; Örlü & Schlatter Reference Örlü and Schlatter2011; Yang & Lozano-Durán Reference Yang and Lozano-Durán2017). Schlatter & Örlü (Reference Schlatter and Örlü2010) proposed an empirical correlation to predict the dependence of
 $\tau _{x,rms}'$ on the friction Reynolds number, i.e.
 $\tau _{x,rms}'/ \overline {\tau _{x}} = 0.298 + 0.018\ln (Re_{\tau })$, where
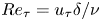 $Re_\tau =u_{\tau }\delta /\nu$,
 $u_{\tau }$ is the friction velocity,
 $\nu$ is the kinematic viscosity and
 $\delta$ is the boundary-layer thickness (or channel half-height). The Reynolds number dependence of
 $\tau _{x,rms}'$ suggests that large-scale energy-containing motions populating the logarithmic and outer regions in high-Reynolds-number wall turbulence have non-negligible influences on the near-wall dynamics and, hence, on the wall friction (Abe et al. Reference Abe, Kawamura and Choi2004; Örlü & Schlatter Reference Örlü and Schlatter2011; de Giovanetti, Hwang & Choi Reference de Giovanetti, Hwang and Choi2016; Renard & Deck Reference Renard and Deck2016; Baidya et al. Reference Baidya, Baars, Zimmerman, Samie, Hearst, Dogan, Mascotelli, Zheng, Bellani and Talamelli2019; Fan et al. Reference Fan, Cheng and Li2019a,Reference Fan, Li and Pirozzolib).
The characteristics of organized turbulent motions in the logarithmic and outer regions and their interactions with the near-wall dynamics have been the focus of multiple studies. Large-scale motions (LSM) and very large-scale motions (VLSM) have been identified in high-Reynolds-number pipes (Kim Reference Kim1999; Wu, Baltzer & Adrian Reference Wu, Baltzer and Adrian2012), channels (Del Álamo et al. Reference Del Álamo, Jiménez, Zandonade and Moser2004, Reference Del Álamo, Jiménez, Zandonade and Moser2006; Lozano-Durán & Jiménez Reference Lozano-Durán and Jiménez2014a) and zero-pressure-gradient turbulent boundary layers (Wark & Nagib Reference Wark and Nagib1991; Sillero, Jiménez & Moser Reference Sillero, Jiménez and Moser2013). Further studies also revealed that these energy-containing motions exert a pronounced influence on the near-wall turbulent intensities (Abe et al. Reference Abe, Kawamura and Choi2004; Hutchins & Marusic Reference Hutchins and Marusic2007; Mathis, Hutchins & Marusic Reference Mathis, Hutchins and Marusic2009; Marusic, Mathis & Hutchins Reference Marusic, Mathis and Hutchins2010; Ganapathisubramani et al. Reference Ganapathisubramani, Hutchins, Monty, Chung and Marusic2012; Mathis et al. Reference Mathis, Marusic, Chernyshenko and Hutchins2013; Hu & Zheng Reference Hu and Zheng2018; Agostini & Leschziner Reference Agostini and Leschziner2019b) in the form of superposition and modulation of the near-wall flow velocities. The former refers to the footprint of large-scale fluctuations on the near-wall turbulence, while the latter is the intensity amplification or attenuation of near-wall small-scale structures by the outer motions. Mathis et al. (Reference Mathis, Marusic, Chernyshenko and Hutchins2013) modelled the integrated effects of superposition and modulation in the wall-shear stress as
 \begin{equation} \tau'^+_{w}(y^+)=\tau'^*_w(y^+)\left\{ 1+\beta_u u_{OL}^+(y_O^+) \right\}+\alpha_u u_{OL}^+(y_O^+), \end{equation}
where  $\tau '^+_w$ is the wall-shear stress fluctuations scaled by viscous units,
 $y^+$ is the wall-normal height scaled by viscous units,
 $\tau '^*_w$ is the near-wall universal signal without the outer influences,
 $u_{OL}^+$ denotes the large-scale streamwise turbulent intensities at the centre of the logarithmic region
 $y_O^+$, and
 $\alpha _u$,
 $\beta _u$ are the superposition and modulation coefficients, respectively. Mathis et al. (Reference Mathis, Marusic, Chernyshenko and Hutchins2013) emphasized that the superposition and modulation in (1.1) are essential for the generation of wall-shear stress fluctuations. The modulation model has also been successful in predicting near-wall velocity fluctuations by using fluid properties in the outer region for the velocity fluctuations (Marusic et al. Reference Marusic, Mathis and Hutchins2010). Note that in (1.1), positive and negative values of
 $u_{OL}^+$ have equally weighted contributions to the near-wall fluctuations. However, the presence of nonlinear interactions and energy transfer between inner and outer scales suggests that this expression might not capture fully the generation of wall stress. Agostini & Leschziner (Reference Agostini and Leschziner2016a,Reference Agostini and Leschzinerb, Reference Agostini and Leschziner2018, Reference Agostini and Leschziner2019a) stated that the modulation of near-wall streamwise velocity fluctuations by outer LSM is exceedingly asymmetric, i.e. the amplification caused by positive outer LSM is much stronger than the attenuation caused by negative ones. Recently, Howland & Yang (Reference Howland and Yang2018) argued that the amplification and attenuation of the near-wall turbulence by LSM might follow different mechanisms. Moreover, Kawata & Alfredsson (Reference Kawata and Alfredsson2018) and Cho, Hwang & Choi (Reference Cho, Hwang and Choi2018) observed inverse energy transfer from small-scale motions to LSM in the vicinity of the wall. Therefore, two indispensable factors should be considered to investigate the mechanism of the near-wall turbulence, i.e. the scale and sign of the motions involved, which is focus of the present study.
The attached-eddy hypothesis provides a conceptual model describing the multiscale nature of fluid motions in wall-bounded turbulence, which was first proposed by Townsend (Reference Townsend1976). In the model, it is conjectured that the logarithmic layer is populated by a collection of randomly distributed energy-containing motions (or eddies) with their roots attached to the ‘wall’ (the near-wall region). Based on Townsend's attached-eddy model, the turbulent intensities can be predicted as
 \begin{gather} \overline{u^{'2}}^{+}=B_{1}-A_{1}\ln(y/\delta), \end{gather}
 \begin{gather}\overline{w^{'2}}^{+}=B_{2}-A_{2}\ln(y/\delta), \end{gather}
 \begin{gather}\overline{v^{'2}}^{+}=B_{3}, \end{gather}
where  $u'$,
 $v'$ and
 $w'$ are the streamwise, wall-normal and spanwise velocity fluctuations, respectively, and
 $A_i$ (
 $i=1,2$) and
 $B_j$ (
 $j=1,2,3$) are constants. This model has been extended and developed by Perry & Chong (Reference Perry and Chong1982), Perry, Henbest & Chong (Reference Perry, Henbest and Chong1986), Perry & Marusic (Reference Perry and Marusic1995), Marusic (Reference Marusic2001), Meneveau & Marusic (Reference Meneveau and Marusic2013), Woodcock & Marusic (Reference Woodcock and Marusic2015) and Mouri (Reference Mouri2017), to name a few, where other works have complemented the original picture proposed by Townsend (Mizuno & Jiménez Reference Mizuno and Jiménez2011; Davidson, Nickels & Krogstad Reference Davidson, Nickels and Krogstad2006; Dong et al. Reference Dong, Lozano-Durán, Sekimoto and Jiménez2017; Lozano-Durán & Bae Reference Lozano-Durán and Bae2019; Hu, Yang & Zheng Reference Hu, Yang and Zheng2020). For more details, the reader is referred to a recent review work by Marusic & Monty (Reference Marusic and Monty2019). Many observations favour the existence of the wall-attached eddies, such as the logarithmic increase of the near-wall streamwise velocity fluctuations with the Reynolds number (Marusic & Kunkel Reference Marusic and Kunkel2003; Hoyas & Jiménez Reference Hoyas and Jiménez2006), the emergence of
 $k_x^{-1}$ (
 $k_x$ is the streamwise wavenumber) region in the spectra of streamwise velocity (Nickels et al. Reference Nickels, Marusic, Hafez and Chong2005), and the linear growth of spanwise integral length of the energy-containing motions with the distance to the wall (Tomkins & Adrian Reference Tomkins and Adrian2002; Del Álamo et al. Reference Del Álamo, Jiménez, Zandonade and Moser2004; Hoyas & Jiménez Reference Hoyas and Jiménez2006; Lozano-Durán, Flores & Jiménez Reference Lozano-Durán, Flores and Jiménez2012; Lee & Moser Reference Lee and Moser2015; Cheng et al. Reference Cheng, Li, Lozano-Durán and Liu2019).
Recently, Diaz-Daniel et al. (Reference Diaz-Daniel, Laizet and Vassilicos2017) proposed a generalized attached-eddy model to describe the generation of wall-shear stress fluctuations and investigated the linkage between the filtered wall-shear stress fluctuations and the second-order structure functions of velocity fluctuations at a given wall-normal location. Yang & Lozano-Durán (Reference Yang and Lozano-Durán2017) reported that the generation of wall-shear stress fluctuations can be interpreted as a momentum cascade across wall-attached eddies of different scales. Pan & Kwon (Reference Pan and Kwon2018) found that the conditionally averaged velocities in the proximity of the positive and negative extremes of friction events in the turbulent boundary layer exhibit disparate patterns, implying different mechanisms between the extremes with the structures populating above the wall. Baidya et al. (Reference Baidya, Baars, Zimmerman, Samie, Hearst, Dogan, Mascotelli, Zheng, Bellani and Talamelli2019) measured the instantaneous wall-shear stress in high-Reynolds-number pipes and boundary layers and found that the energy-containing motions are stochastically coherent with skin-friction events. In the present work, we aim to analyse the structure of the wall-shear stress fluctuations and to assess the relationship between the skin-friction events with the wall-attached eddies. Special emphasis is placed on the length scale and sign of the flow motions contributing to the wall-shear stress generation.
The paper is organized as follows. In §§ 2 and 3, the DNS database and the method for structure identification are introduced. In § 4, the statistical properties of wall-shear stress structures, including geometrical characteristics, spatial distribution, population density, fluctuating intensity and correlations with outer streamwise velocity motions are investigated. Finally, concluding remarks are summarized in § 5.
2. DNS database
The DNS database used in the present study has been extensively validated by Jiménez and coworkers (Del Álamo & Jiménez Reference Del Álamo and Jiménez2003; Del Álamo et al. Reference Del Álamo, Jiménez, Zandonade and Moser2004; Hoyas & Jiménez Reference Hoyas and Jiménez2006; Lozano-Durán et al. Reference Lozano-Durán, Flores and Jiménez2012; Lozano-Durán & Jiménez Reference Lozano-Durán and Jiménez2014b). Three cases at  $Re_\tau =545$, 934 and 2009 are selected and named as
 $Re550$,
 $Re950$ and
 $Re2000$, respectively. The DNS database was originally built in Del Álamo & Jiménez (Reference Del Álamo and Jiménez2003), Del Álamo et al. (Reference Del Álamo, Jiménez, Zandonade and Moser2004) and Hoyas & Jiménez (Reference Hoyas and Jiménez2006). Details of the parameter settings are listed in table 1. Hereafter,
 $x$,
 $y$ and
 $z$ stand for the streamwise, wall-normal and spanwise directions, respectively. The computational domains in table 1 are large enough to resolve the LSM and VLSM (Guala, Hommema & Adrian Reference Guala, Hommema and Adrian2006; Hutchins & Marusic Reference Hutchins and Marusic2007; Hwang Reference Hwang2015).
Parameters of the DNS. Here,  $L_x$,
 $L_y$ and
 $L_z$ are the sizes of the computational domain in the streamwise, wall-normal and spanwise direction, respectively. Here,
 ${\rm \Delta} x^+$ and
 ${\rm \Delta} z^+$ denote the streamwise and spanwise grid resolutions, respectively, in inner units. Here,
 ${\rm \Delta} y_{min}^+$ and
 ${\rm \Delta} y_{max}^+$ are the finest and coarsest resolution in the wall-normal direction, respectively. Here,
 $N_F$ is the number of flow fields used to accumulate statistics.

In this study, we focus on the streamwise wall-shear stress fluctuations,  $\tau _{x}'$. The root mean squared value of
 $\tau _{x}'$ is normalized by its mean component (
 $\overline {\tau _{x}}$) and expressed as
 \begin{equation} \tau_{x,rms}^+=\frac{\tau_{x,rms}'}{\overline{\tau_{w}}}. \end{equation}
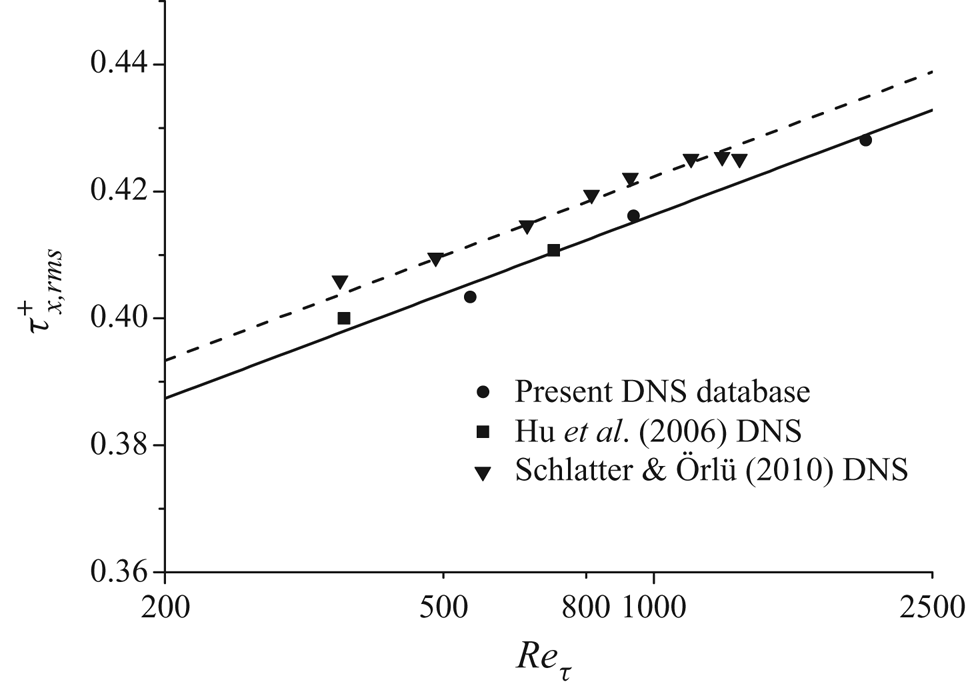
The variations of  $\tau _{x,rms}^+$ as a function of
 $Re_\tau$ are shown in figure 1. Previous estimations of
 $\tau _{x,rms}^+$ using DNS of channel flows (Hu et al. Reference Hu, Morfey and Sandham2006) and DNS of zero-pressure-gradient turbulent boundary layers (Schlatter & Örlü Reference Schlatter and Örlü2010) are also included in the plot for comparison. The results show that
 $\tau _{x,rms}^+$ increases with
 $Re_\tau$, implying that the LSM have an influence on the skin-friction events (Örlü & Schlatter Reference Örlü and Schlatter2011; Mathis et al. Reference Mathis, Marusic, Chernyshenko and Hutchins2013). In our present results, the Reynolds number dependence of
 $\tau _{x,rms}^+$ is well fitted by the empirical formula,
 $\tau _{x,rms}^{+}= 0.292 + 0.018\ln (Re_{\tau })$. The data of Hu et al. (Reference Hu, Morfey and Sandham2006) also collapse with our empirical formula, which is similar to the estimation given by Schlatter & Örlü (Reference Schlatter and Örlü2010) for turbulent boundary layers.
Variations of  $\tau _{x,rms}^+$ as a function of
 $Re_\tau$. The solid line is the empirical formula defined by
 $\tau _{x,rms}^+=0.292+0.018 \ln (Re_\tau )$ for channel flows. The dashed line is the empirical formula defined by
 $\tau_{x,rms}^+=0.298+0.018 \ln({\rm Re}_\tau)$ for zero-pressure-gradient turbulent boundary layers (Schlatter & Örlü Reference Schlatter and Örlü2010).

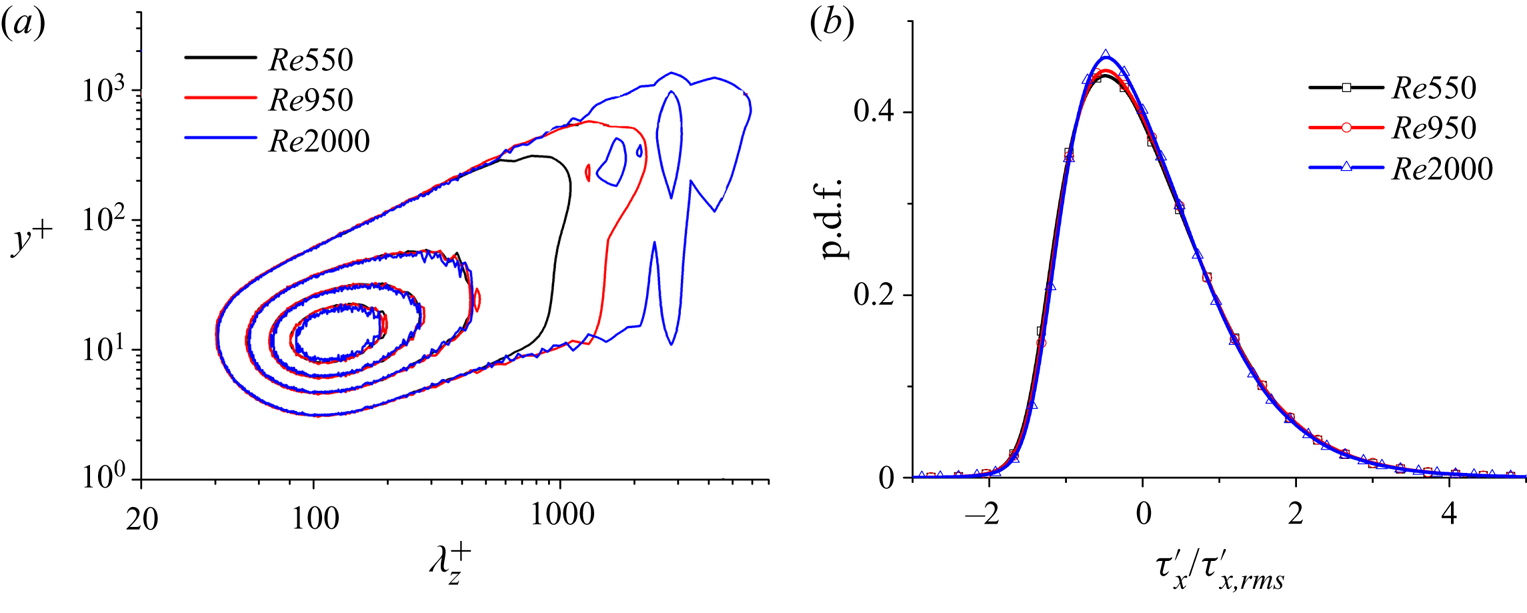
Figure 2(a) shows the spanwise premultiplied spectra of the streamwise velocity fluctuations. It can be seen that the spectra span from  $\lambda _z^+ \approx O(10)$ to
 $\lambda _z \approx O(h)$, where
 $\lambda _z$ denotes the spanwise wavelength. The small scales of the spectra in the near-wall region (
 $y^+\leq 100$) scale well in viscous units. As the Reynolds number increases, the footprint of the LSM penetrates deep into the near-wall region and become apparent at large wavelengths, suggesting that LSM may affect the generation of the skin-friction events. Figure 2(b) shows the p.d.f.s of normalized streamwise wall-shear fluctuation (
 $\tau _{x}'/\tau _{x,rms}'$). The p.d.f.s are asymmetric in shape and positively skewed. This outcome highlights that the high- and low-speed skin-friction events are organized in fundamentally different manners, which will be investigated in the following sections.
(a) The spanwise premultiplied spectra of the streamwise velocity fluctuations. Contour lines are 0.2, 0.4, 0.6 and 0.8 of the maximum. (b) The probability density functions (p.d.f.s) of normalized streamwise wall-shear fluctuations ( $\tau _{x}'/\tau _{x,rms}'$).

3. Structure identification method
We follow a clustering methodology to identify the structure of regions of intense  $\tau _x'$. The method has been used to identify three-dimensional turbulent structures in previous studies (Moisy & Jiménez Reference Moisy and Jiménez2004; Del Álamo et al. Reference Del Álamo, Jiménez, Zandonade and Moser2006; Lozano-Durán et al. Reference Lozano-Durán, Flores and Jiménez2012; Lozano-Durán & Jiménez Reference Lozano-Durán and Jiménez2014a; Dong et al. Reference Dong, Lozano-Durán, Sekimoto and Jiménez2017; Hwang & Sung Reference Hwang and Sung2018, Reference Hwang and Sung2019; Osawa & Jiménez Reference Osawa and Jiménez2018; Cardesa et al. Reference Cardesa, Monty, Soria and Chong2019). We adapt the methodology to compute two-dimensional structures in order to analyse the fields of
 $\tau _x'$. A brief description of the approach is given as follows.
(i) The grid points at the wall satisfying
 \begin{equation} \tau_{x}' < -\alpha \tau_{x,rms}' \end{equation}
or
 \begin{equation} \tau_{x}' > \alpha \tau_{x,rms}' \end{equation}
are marked, where  $\alpha$ is a positive threshold value. Criteria (3.1) and (3.2) extract negative and positive intense skin-friction events, respectively.
(ii) The grid points marked in step (i) which are contiguous in space are connected into individual structures using the four orthogonal neighbours connectivity rule (Rosenfeld & Pfaltz Reference Rosenfeld and Pfaltz1966).
(iii) The spatially connected regions in step (ii) are defined as  $\tau _x'$ structures. The bounding rectangle aligned with the Cartesian grid of each individual structure has length
 $l_x$ and width
 $l_z$, which are chosen as the characteristic length scales of the structures.
Hereafter, we denote the structures satisfying (3.1) and (3.2) as  $NF_s$ and
 $PF_s$, respectively. Only structures with an area larger than
 $30 \times 30$ viscous units are taken into consideration to avoid artefact due to the limited grid resolution of the DNS database (Del Álamo et al. Reference Del Álamo, Jiménez, Zandonade and Moser2006; Lozano-Durán et al. Reference Lozano-Durán, Flores and Jiménez2012). As in previous work, we follow the percolation theory to determine the value of
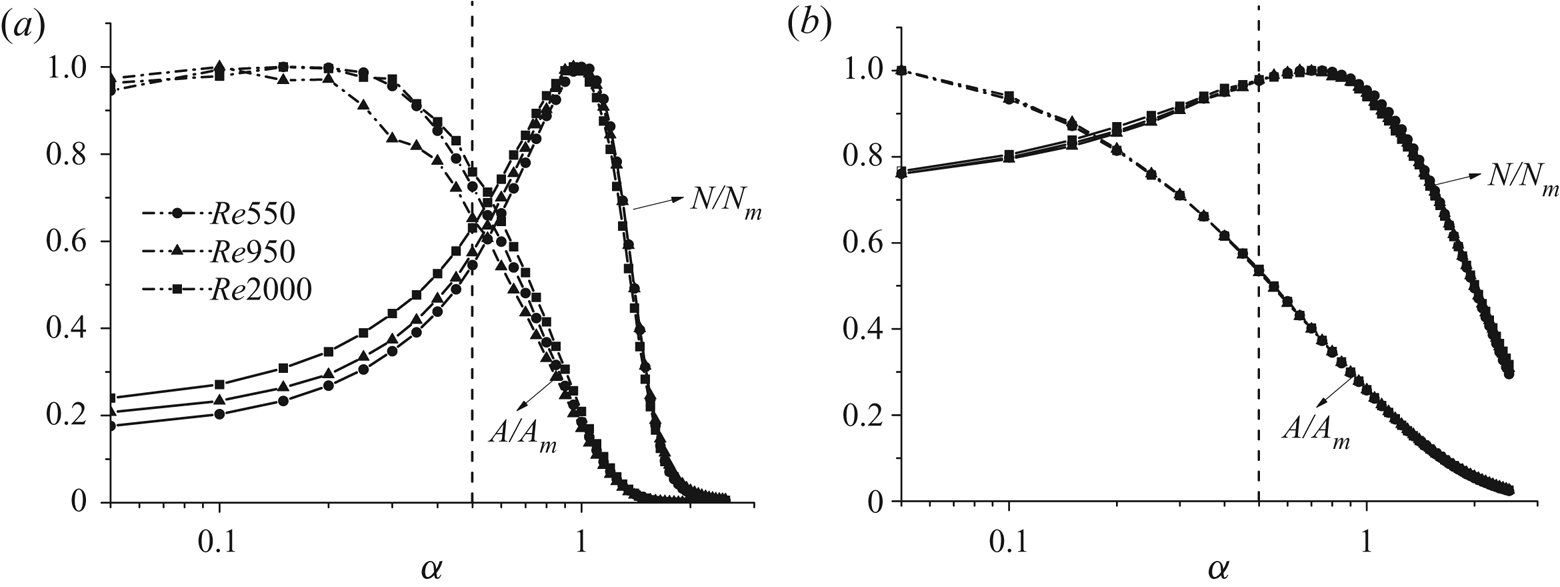
 $\alpha$ (Moisy & Jiménez Reference Moisy and Jiménez2004; Del Álamo et al. Reference Del Álamo, Jiménez, Zandonade and Moser2006; Lozano-Durán et al. Reference Lozano-Durán, Flores and Jiménez2012; Lozano-Durán & Jiménez Reference Lozano-Durán and Jiménez2014a; Dong et al. Reference Dong, Lozano-Durán, Sekimoto and Jiménez2017; Hwang & Sung Reference Hwang and Sung2018, Reference Hwang and Sung2019; Osawa & Jiménez Reference Osawa and Jiménez2018; Cheng et al. Reference Cheng, Li, Lozano-Durán and Liu2020). Figure 3 shows the percolation diagram for
 $NF_s$ and
 $PF_s$, when
 $\alpha$ varies from 0.05 to 2.5. Dash-dotted lines represent the area fractions (
 $A/A_m$) of the structures, where
 $A=\sum (l_x l_z)$ is the sum of all the individual areas of the structures for a given
 $\alpha$, and
 $A_m$ is the maximum
 $A$ over
 $0.05 \leq \alpha \leq 2.5$. Solid lines represent the number fraction (
 $N/N_m$), where
 $N$ is the total number of the structures identified for a given
 $\alpha$ and
 $N_m$ is the maximum
 $N$ over
 $0.05 \leq \alpha \leq 2.5$.
Percolation diagrams for the structure identification, (a)  $NF_s$ and (b)
 $PF_s$. Solid- and dash-dotted lines represent the number fraction (
 $N/N_m$) and the area fraction (
 $A/A_m$) of the identified structures, respectively. The vertical dashed lines are
 $\alpha =0.5$.

We take figure 3(a) as an example. When  $\alpha <0.2$,
 $A/A_m\approx 1$, most grid points extracted in step (i) are connected into a single structure. Percolation transition occurs in the range of
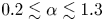 $0.2\lesssim \alpha \lesssim 1.3$, where
 $A/A_m$ decreases gradually with increasing
 $\alpha$. When
 $\alpha >1.3$, the identification process yields fragmentary structures corresponding to very strong friction regions. The variations of
 $N/N_m$ are different. When
 $\alpha <1.3$,
 $N/N_m$ increases with
 $\alpha$ as new structures appear. The number of identified structures attains the maximum at
 $\alpha \approx 1.3$. Similar features can be found in the percolation diagram of
 $PF_s$, as shown in figure 3(b). According to the percolation transition shown in figure 3, we choose
 $\alpha =0.5$ (vertical lines in figure 3). Nonetheless, the results discussed in the remainder of the paper are qualitatively similar for values of
 $\alpha$ in the range of
 $0.4\le \alpha \le 0.7$ (see the Appendix).
With  $\alpha =0.5$, the total number, area and area fraction of the structures (
 $NF_s$ and
 $PF_s$) are summarized in table 2. The area fraction is defined by
 $A_f=A/(N_FA_w)$, where
 $A_w=2L_x \times L_z$ represents the total area of the upper and lower walls and
 $N_F$ is the number of flow fields considered in the analysis. The results from table 2 reveal that the number of
 $PF_s$ is larger than
 $NF_s$, but the area of
 $PF_s$ is smaller than
 $NF_s$, regardless of the Reynolds number. This result establishes the first difference between
 $PF_s$ and
 $NF_s$, which will be studied in detail in the following section.
The total number and area of the identified structures. Here,  $N_{PF}$ and
 $N_{NF}$ are the total number of
 $PF_s$ and
 $NF_s$, respectively. Here,
 $A_{PF}$ and
 $A_{NF}$ are the total area of
 $PF_s$ and
 $NF_s$, respectively. Here,
 $A_{f,PF}$ and
 $A_{f,NF}$ are the area fraction of
 $PF_s$ and
 $NF_s$, respectively.

4. Results and discussion
In this section, we dissect the statistical properties of the  $\tau _x'$ structures, namely, the geometrical characteristics, spatial distribution, population density, fluctuating intensity and correlations with outer motions. Particular attention is paid to the asymmetries between
 $PF_s$ and
 $NF_s$ and their relationship with the wall-attached eddies.
4.1. Geometrical properties of the structures
The geometrical properties of the structures are characterized by the two length scales,  $l_x^+$ and
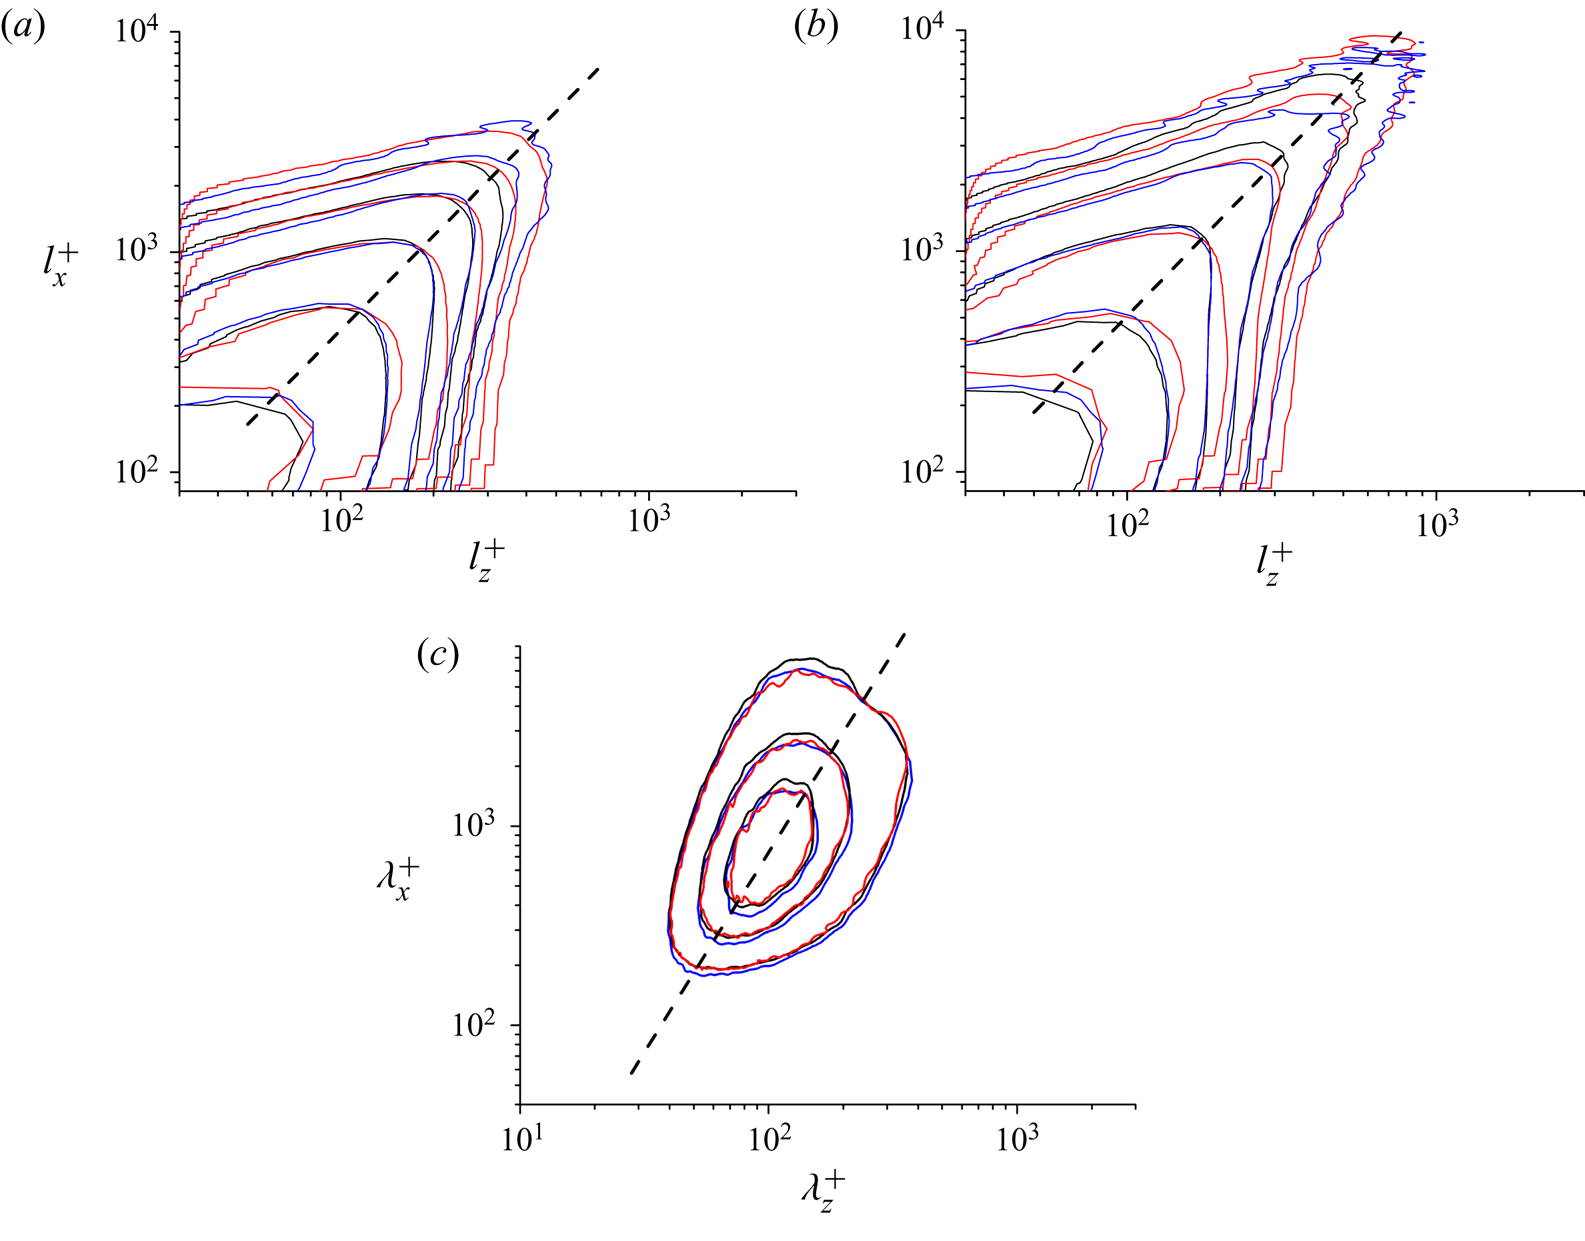
 $l_z^+$, which are normalized by viscous units. Figures 4(a) and 4(b) show the joint p.d.f.s of
 $l_x^+$ and
 $l_z^+$ for
 $PF_s$ and
 $NF_s$, respectively. The joint p.d.f.s cover a wide range of
 $l_x^+$ and
 $l_z^+$, which implies that the skin-friction events are multiscale and the result of the collective effect of motions with different length scales (de Giovanetti et al. Reference de Giovanetti, Hwang and Choi2016; Yang & Lozano-Durán Reference Yang and Lozano-Durán2017; Cho et al. Reference Cho, Hwang and Choi2018; Agostini & Leschziner Reference Agostini and Leschziner2019a; Baidya et al. Reference Baidya, Baars, Zimmerman, Samie, Hearst, Dogan, Mascotelli, Zheng, Bellani and Talamelli2019; Cheng et al. Reference Cheng, Li, Lozano-Durán and Liu2019). The mode of the joint p.d.f.s for
 $PF_s$ and
 $NF_s$ follows approximately
 \begin{equation} l_x^+=0.64(l_z^{+})^{1.44} \end{equation}
for  $l_z^+\geq 100$. For reference, figure 4(c) shows the two-dimensional spectra of
 $u'$ in the viscous region. The streamwise wavelength (
 $\lambda _x^+$) and the spanwise wavelength (
 $\lambda _z^+$) follows
 $\lambda _x^+ \propto (\lambda _z^+)^2$, which coincides with the power law between
 $\lambda _x^+$ and
 $\lambda _z^+$ of the
 $u'$ spectra in the logarithmic region reported by Del Álamo et al. (Reference Del Álamo, Jiménez, Zandonade and Moser2004). One possible explanation for the nonlinear relationship between
 $\lambda _x^+$ and
 $\lambda _z^+$ (or
 $l_x^+$ and
 $l_z^+$) is the meandering nature of the near-wall
 $u'$ structures. At low Reynolds numbers, Jiménez, Del Álamo & Flores (Reference Jiménez, Del Álamo and Flores2004) observed a power law relationship between
 $\lambda _x^+$ and
 $\lambda _z^+$ for near-wall streaky structures when taking their meandering nature into account. Some recent studies have reported a linear relationship between
 $\lambda _x^+$ and
 $\lambda _z^+$ at very large Reynolds number. Chandran et al. (Reference Chandran, Baidya, Monty and Marusic2017) investigated the two-dimensional spectra of
 $u'$ in a turbulent boundary layer at
 $Re_\tau =26\,000$, and found a linear relationship of
 $\lambda _x^+\propto \lambda _z^+$. Therefore,
 $l_x^+$ and
 $l_z^+$ of the
 $\tau _x'$ structures might also follow a linear relationship at sufficiently high Reynolds numbers.
(a,b) Joint p.d.f.s of  $l_z^+$ and
 $l_x^+$ for
 $PF_s$ (a) and
 $NF_s$ (b). The dashed straight lines in panel (a) and panel (b) denote
 $l_x^+=0.64(l_z^{+})^{1.44}$. All contour levels of the p.d.f.s are logarithmically distributed. (c) Two-dimensional premultiplied spectra of
 $u'$ in the viscous region. The dashed straight lines in panel (c) denote
 $\lambda _x^+ \propto (\lambda _z^+)^{2}$. Contour lines are 0.25, 0.5 and 0.75 of the maximum. For all figures, black lines denote
 $Re550$, red lines denote
 $Re950$ and blue lines denote
 $Re2000$.

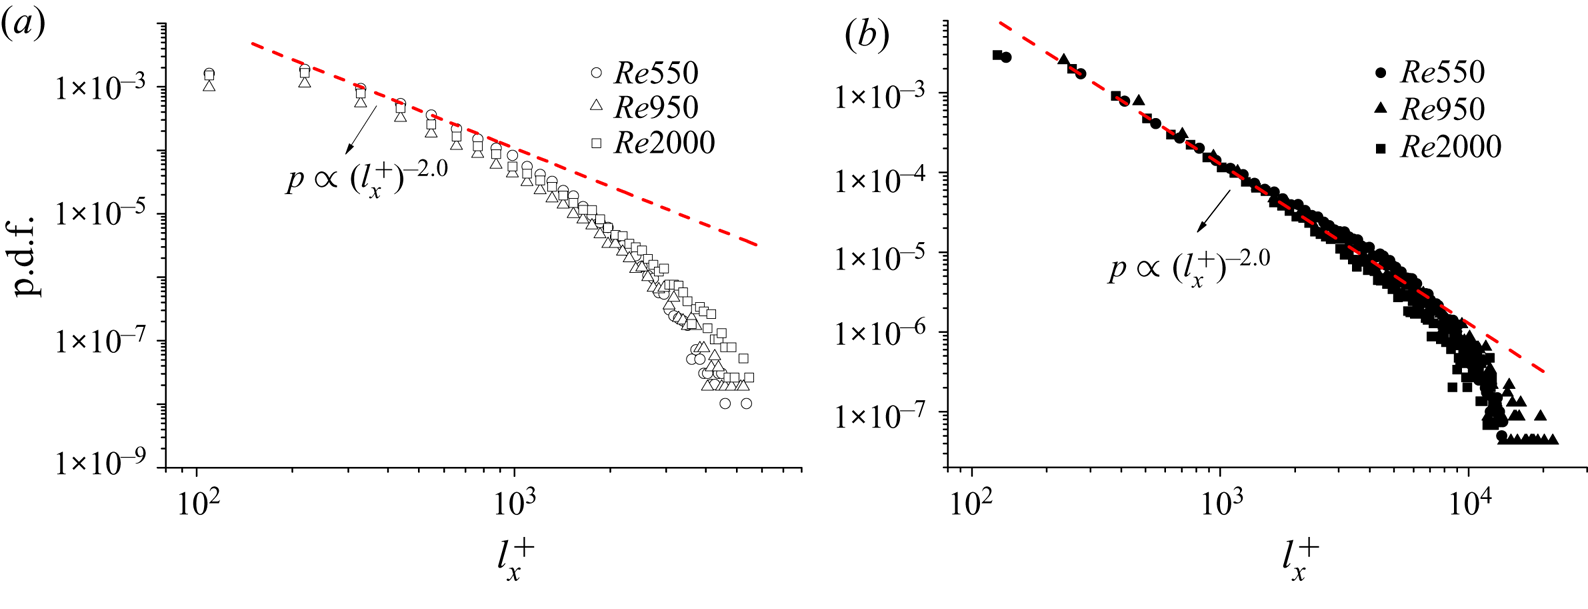
Under the attached-eddy model framework (Townsend Reference Townsend1976; Perry & Chong Reference Perry and Chong1982) and assuming that wall-attached eddies are space filling, Srinath et al. (Reference Srinath, Vassilicos, Cuvier, Laval, Stanislas and Foucaut2018) and Solak & Laval (Reference Solak and Laval2018) pointed out that the p.d.f. of  $l_x^+$ should obey
 $p \propto (l_x^+)^{-2}$. The marginal p.d.f.s of
 $l_x^+$ for
 $\tau _x'$ structures is shown in figure 5. It can be seen that asymmetrical features are exhibited between
 $PF_s$ and
 $NF_s$. For
 $NF_s$, the p.d.f.s of
 $l_x^+$ approximately follow
 $p\propto (l_x^+)^{-2}$, which is consistent with the prediction of Srinath et al. (Reference Srinath, Vassilicos, Cuvier, Laval, Stanislas and Foucaut2018) and Solak & Laval (Reference Solak and Laval2018); whereas for
 $PF_s$, the relation is less accurate. This result suggests that
 $NF_s$ may be the direct outcome of the space-filling wall-attached eddies, which will be analysed in detail in §4.5.
Marginal p.d.f.s of  $l_x^+$ for
 $PF_s$ (a) and
 $NF_s$ (b). The red dashed lines in figures represent
 $p\propto (l_x^+)^{-2.0}$.

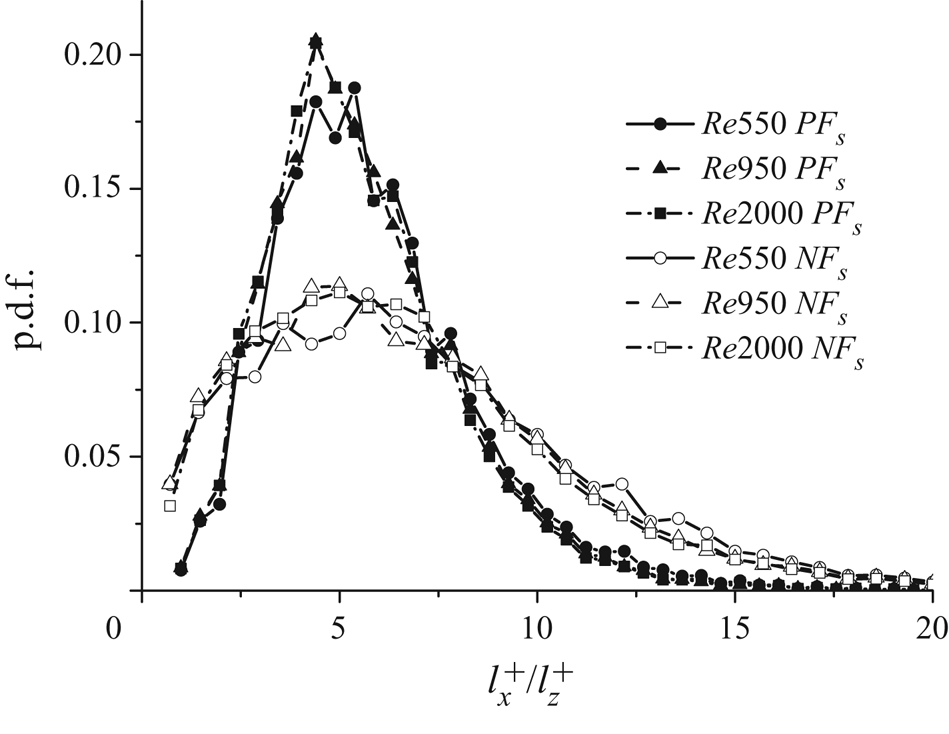
The marginal p.d.f.s of aspect ratio  $l_x^+/l_z^+$ are shown in figure 6. The p.d.f.s of
 $PF_s$ and
 $NF_s$ differ in shape, but they are insensitive to the Reynolds number. The p.d.f. profiles of
 $NF_s$ are flatter than those of
 $PF_s$, suggesting that
 $l_x^+/l_z^+$ of
 $NF_s$ is more uniformly distributed. The p.d.f.s reach their maxima at
 $l_x^+/l_z^+\approx 5$, regardless of the Reynolds number and the sign of the
 $\tau _x'$ structure.
Marginal p.d.f.s of  $l_x^+/l_z^+$ for the structures.

4.2. Spatial distribution of the structures
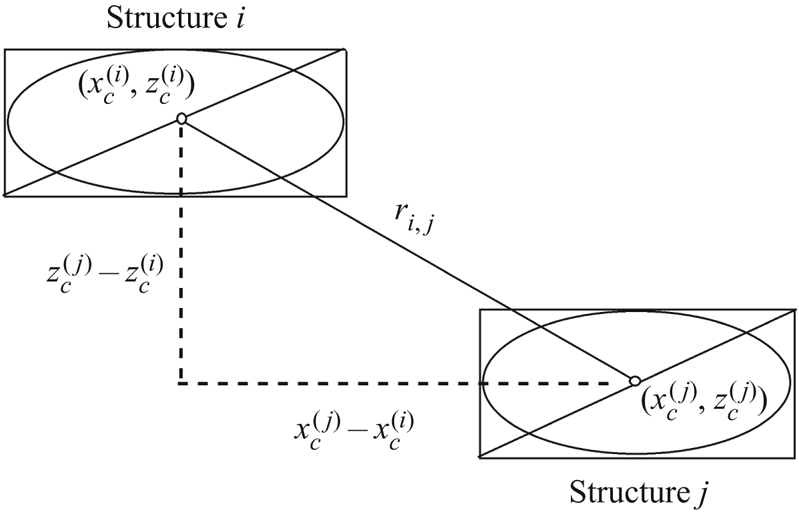
We investigate next the spatial distribution of  $\tau _x'$ structures. Let us consider two structures, labelled as
 $i$ and
 $j$. Figure 7 provides a schematic of the two structures. Their relative separation in the streamwise and spanwise direction are defined as
 \begin{equation} \delta_x=\frac{x_c^{(j)}-x_c^{(i)}}{d^{(i,j)}}\quad \textrm{and}\quad \delta_z=\frac{z_c^{(j)}-z_c^{(i)}}{d^{(i,j)}}, \end{equation}
respectively, where ( $x_c$,
 $z_c$) is the centre of the bounding rectangle belonging to the structure
 $i$ or
 $j$, and
 $d^{(i,j)}$ is the mean diagonal of the two rectangles. The absolute distance of the two structures is defined as
 \begin{equation} r_{i,j}=\sqrt{(x_c^{(j)}-x_c^{(i)})^2+(z_c^{(j)}-z_c^{(i)})^2}. \end{equation}
The schematic of the distance between two  $\tau _{x}'$ structures.

Following the works of Lozano-Durán et al. (Reference Lozano-Durán, Flores and Jiménez2012), Dong et al. (Reference Dong, Lozano-Durán, Sekimoto and Jiménez2017) and Osawa & Jiménez (Reference Osawa and Jiménez2018), we only consider structures with  $1/2\le l_z^{(j)}/l_z^{(i)} \le 2$, i.e. the structures sharing similar spanwise size.
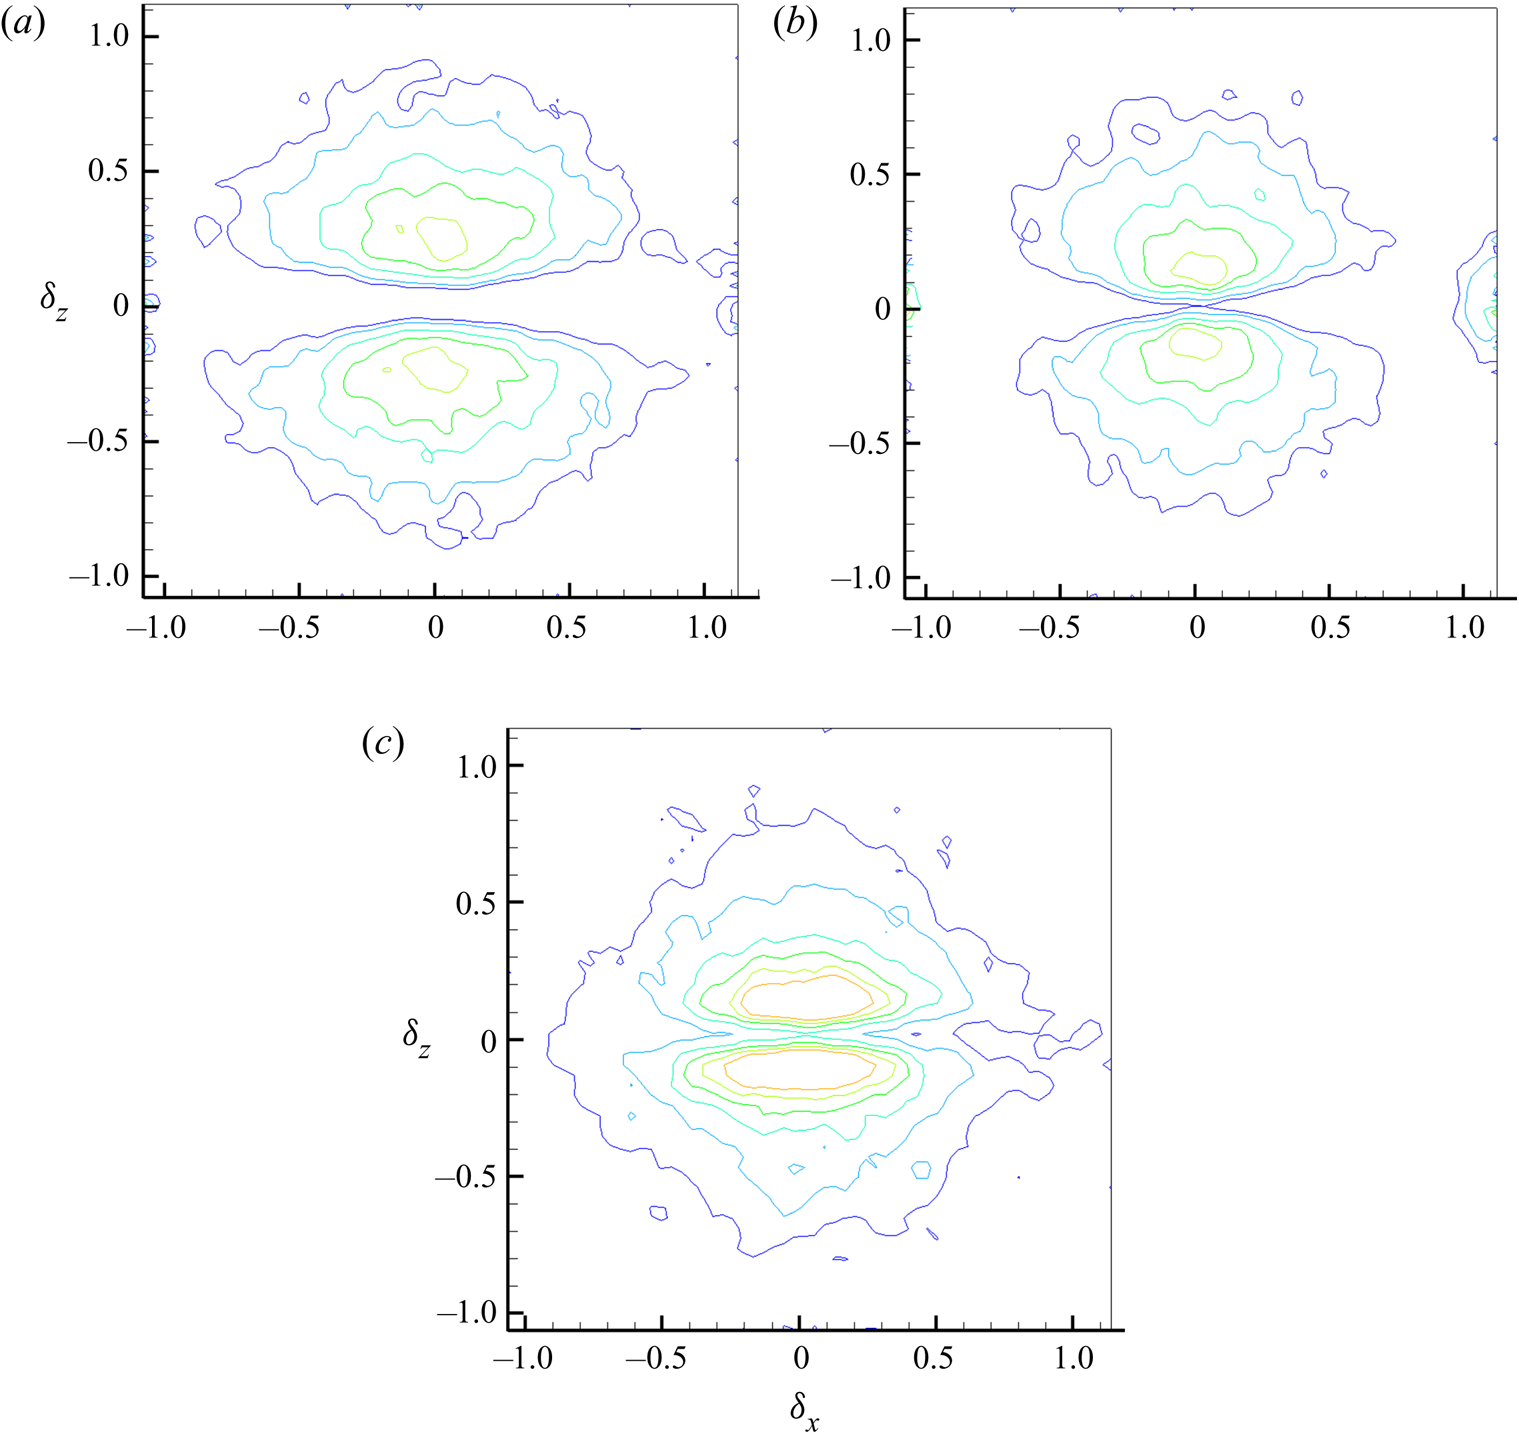
Figure 8 shows the joint p.d.f.s of  $\delta _x$ and
 $\delta _z$ for
 $Re950$. Similar results are obtained for the other two cases, which are not shown here for brevity. Figure 8 shows that structures tend to be organized side by side along the spanwise direction, while the low probabilities around
 $\delta _z \thickapprox 0$ indicates that the structures do not overlap along the spanwise direction.
Joint p.d.f.s of the relative spacings in  $Re950$. (a) The closest
 $PF_s$ relative to a
 $PF_s$, (b) the closest
 $NF_s$ relative to a
 $NF_s$ and (c) the closest
 $PF_s$ relative to a
 $NF_s$.

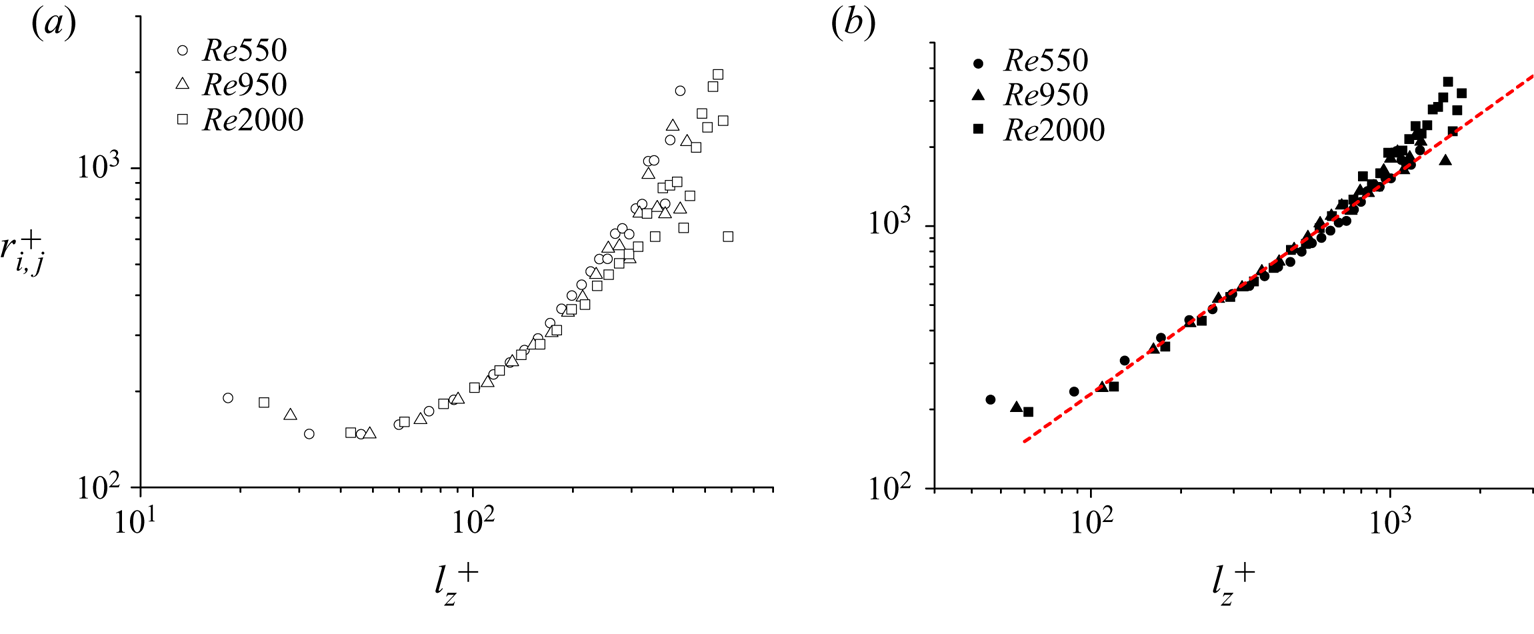
Figure 9 displays the variations of  $r_{i,j}^+$ as a function of
 $l_z^+$. For
 $l_z^+>100$,
 $NF_s$ follow the approximately the power law relationship
 $r_{i,j}^+\approx 5.3(l_z^+)^{0.8}$, regardless of the Reynolds number, whereas a similar trend is absent for
 $PF_s$.
Variations of the absolute distance ( $r_{i,j}^+$) as a function of
 $l_z^+$. (a)
 $PF_s$ and (b)
 $NF_s$. The red dashed lines in panel (b) denotes
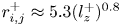 $r_{i,j}^+\approx 5.3(l_z^+)^{0.8}$.

4.3. Scale-dependent properties of the structures
In this section we investigate the properties of the  $\tau _x'$ structures conditioned on
 $l_z^+$, including the population density, intensity of
 $\tau _x'$ and marginal p.d.f.s of
 $\tau _x'$ at several selected
 $l_z^+$.
The scale-dependent population density is defined as
 \begin{equation} n_d(l_z^+)=\frac{N_i(l_z^+)}{N_F A_w^+}, \end{equation}
where  $N_i(l_z^+)$ is the number of the structures with a given
 $l_z^+$,
 $N_F$ is the number of flow fields used to accumulate statistics and
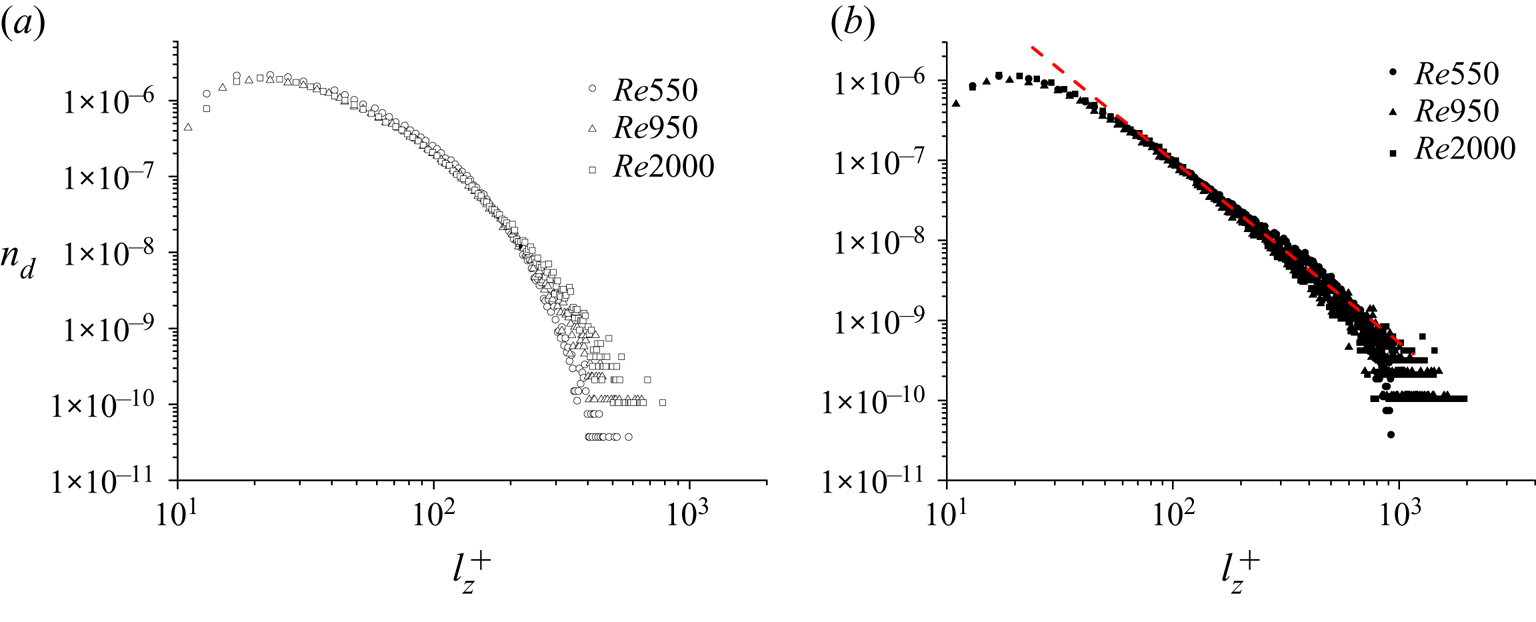
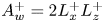 $A_w^+ = 2 L_x^+ L_z^+$. Figure 10 shows the distribution of
 $n_d$ as a function of
 $l_z^+$ for all cases. It can be seen that, for
 $NF_s$,
 $n_d$ decays logarithmically with
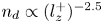 $n_d \propto (l_z^+)^{-2.5}$ when
 $l_z^+> 100$; whereas a constant power-law decaying rate is less defined for
 $PF_s$. The latter suggests that
 $PF_s$ and
 $NF_s$ are distributed in different manners.
Variations of the population density ( $n_d$) as a function of
 $l_z^+$. (a)
 $PF_s$ and (b)
 $NF_s$. The red dashed line in panel (b) denotes
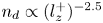 $n_d \propto (l_z^+)^{-2.5}$.

The scale-dependent intensity of  $\tau _x'$ is expressed as
 \begin{equation} I_{\tau_{x}'}^+(l_z^+)=\sqrt{\frac{1}{N_{\tau}}\sum_{i=1}^{N_{\tau}}\left[ \frac{\tau_{i,x}'(l_z^+)}{\tau_{x,rms}'}\right]^2 }, \end{equation}
to the structures with a given  $l_z^+$, and
 $\tau _{i,x}'(l_z^+)$ denotes the instantaneous streamwise wall-shear stress at the
 $i$th grid point. In this manner,
 $I_{\tau _{x}'}^+(l_z^+)$ represents the intensity of the streamwise wall-shear fluctuations carried by the structures with spanwise size
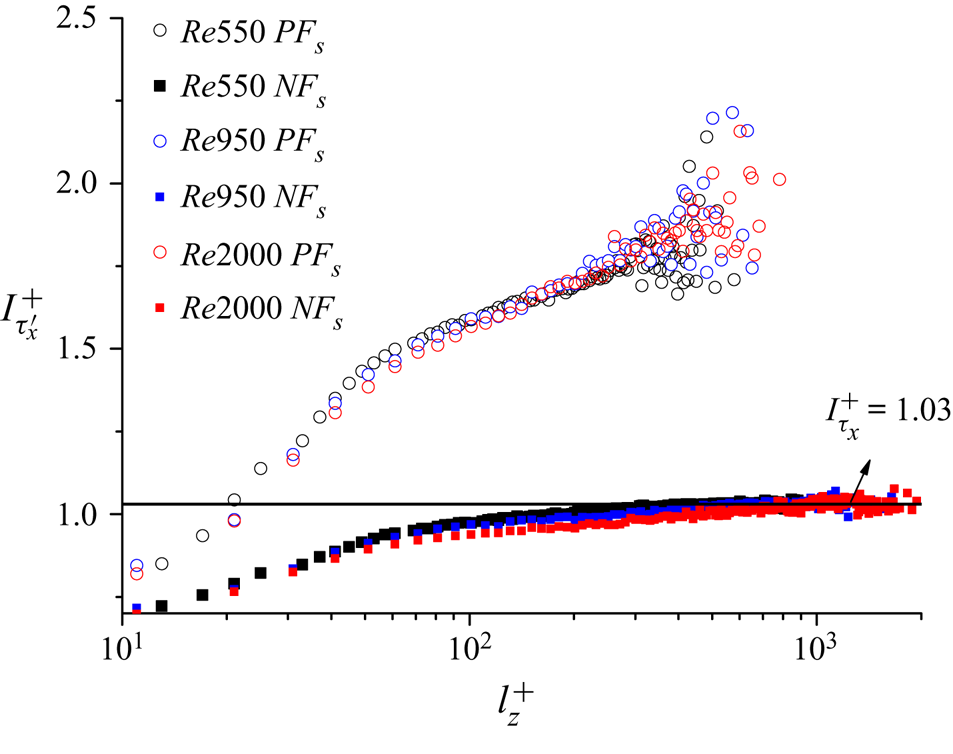
 $l_z^+$. Figure 11 shows the variations of
 $I_{\tau _{x}'}^+$ as a function of
 $l_z^+$. For both
 $PF_s$ and
 $NF_s$,
 $I_{\tau _{x}'}^+$ collapses well, showing the independence of
 $I_{\tau _{x}'}^+$ on the friction Reynolds number. For all cases, the expected values of
 $I_{\tau _{x}'}^+$ are higher for
 $PF_s$ than for
 $NF_s$, but the former rarely attain size larger than
 $l_z^+\approx 300$.
Variations of  $I_{\tau _{x}'}^+$ carried by
 $PF_s$ and
 $NF_s$ as a function of
 $l_z^+$.

This asymmetrical feature suggest that large-scale outer motions affect mainly the negative skin-friction events. The phenomenon is reminiscent of the asymmetric modulation of near-wall streamwise velocity fluctuations by positive and negative outer large-scale motions (Agostini & Leschziner Reference Agostini and Leschziner2016a,Reference Agostini and Leschzinerb, Reference Agostini and Leschziner2018, Reference Agostini and Leschziner2019a). It also implies that the symmetric modelling of positive and negative wall-attached structures by Baidya et al. (Reference Baidya, Baars, Zimmerman, Samie, Hearst, Dogan, Mascotelli, Zheng, Bellani and Talamelli2019) for the  $u'$ spectrum might be improved by accounting for the flow asymmetries.
Another interesting feature revealed by figure 11 is that as  $l_z^+$ increases, the intensity
 $I_{\tau _{x}'}^+$ of
 $NF_s$ converges to a constant value, i.e.
 $I_{\tau _{x}'}^+\approx 1.03$, which suggests that the intensities of large-scale
 $NF_s$ are independent of
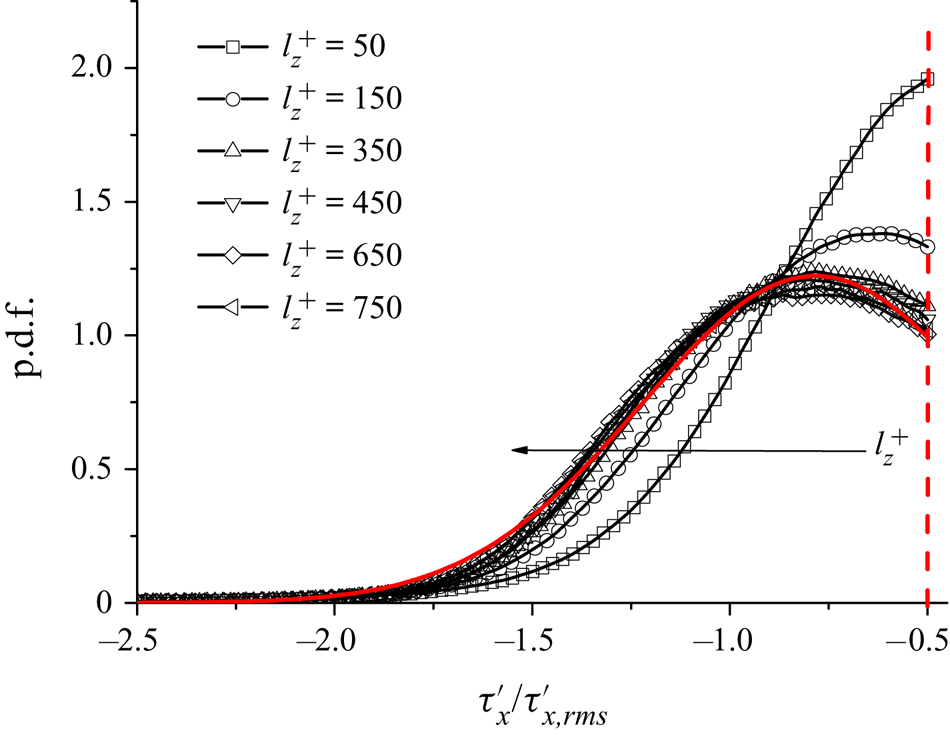
 $l_z^+$. The marginal p.d.f.s of
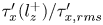 $\tau _{x}'(l_z^+)/\tau _{x,rms}'$ for
 $NF_s$ at several selected
 $l_z^+$ is shown in figure 12 for case
 $Re950$. Similar trends are observed in the other two cases (not shown). As
 $l_z^+$ increases, the p.d.f.s gradually converge to a normal distribution, which is well described by the Gaussian function,
 \begin{equation} p(\zeta)\big|_{l_z^+}= a^{{-(\zeta-b)^2}/{2c^2}}, \end{equation}
where the fitting constants are  $a=1.223$,
 $b=-0.784$ and
 $c=0.44$, and
 $\zeta$ stands for the abscissa in figure 12. The fitting curve is linked to the constant value of
 $I_{\tau _{x}'}^+$ in figure 11. The definition of
 $I_{\tau _{x}'}^+$ in (4.5) can be rewritten as
 \begin{equation} I_{\tau_{x}'}^+(l_z^+)= \sqrt{\int_{-\infty}^{-\alpha} \zeta^2 p(\zeta)\big|_{l_z^+}\,\textrm{d}\zeta}. \end{equation}
The marginal p.d.f.s of  $\tau _{x}'/\tau _{x,rms}'$ for
 $NF_s$ at several selected
 $l_z^+$ by using the case of
 $Re950$. The red curve denotes a fitting curve by Gaussian function. The vertical dashed line denotes
 $\tau _{x}' = -0.5 \tau _{x,rms}'$.

Substitution of (4.6) into (4.7) yields
 \begin{equation} I_{\tau_{x}'}^+(l_z^+)\approx 1.027, \end{equation}
which is consistent with the constant value ( $I_{\tau _{x}'}^+\approx 1.03$) shown in figure 11.
The constant value of  $I_{\tau _{x}'}^+$ for large-scale
 $NF_s$ can be speculated and explained by the properties of the large-scale structures in the near-wall region. Hwang (Reference Hwang2016) reported that large-scale
 $u'$ motions should scale with the inner units in the vicinity of the wall due to viscous effects, which is supported by the measurements of the high-Reynolds-number turbulent boundary layers (Samie et al. Reference Samie, Marusic, Hutchins, Fu, Fan, Hultmark and Smits2018). Cho et al. (Reference Cho, Hwang and Choi2018) further pointed out that this inner scaling is related to the balance between the turbulent transport and dissipation at large scale in the near-wall region. The readers are referred to Hwang (Reference Hwang2016) and Cho et al. (Reference Cho, Hwang and Choi2018) for more details.
To further investigate the observation of 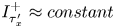 $I_{\tau _{x}'}^+\approx constant$, we compute two-dimensional structures of
 $u'$ at a given
 $y$-location using the clustering methodology. The negative near-wall
 $u'$ structures in the wall-parallel plane are identified following the same approach described in § 3. We have checked that the threshold within
 $0.4 \le \alpha \le 0.7$ has no impact on the conclusions below. Similarly to the definition of
 $I_{\tau _{x}'}^+$ in (4.5), we introduce a scale-dependent streamwise turbulence intensity as
 \begin{equation} I_{u'}^+(l_z^+,y^+)=\sqrt{\frac{1}{N_u}\sum_{i=1}^{N_u}\left[ \frac{u_i'(l_z^+,y^+)}{u_{\tau}} \right]^2 }, \end{equation}
where  $N_u$ is the total number of the grid points belonging to the negative
 $u'$ structures with a conditional
 $l_z^+$ at
 $y^+$, and
 $u_i'(l_z^+,y^+)$ denotes the negative streamwise velocity fluctuations carried by the
 $i$th connected grid point. Analogous to
 $I_{\tau _{x}'}^+$,
 $I_{u'}^+(l_z^+,y^+)$ characterizes the intensity of the streamwise velocity fluctuations of the negative
 $u'$ structures for a given
 $l_z^+$ at
 $y^+$.
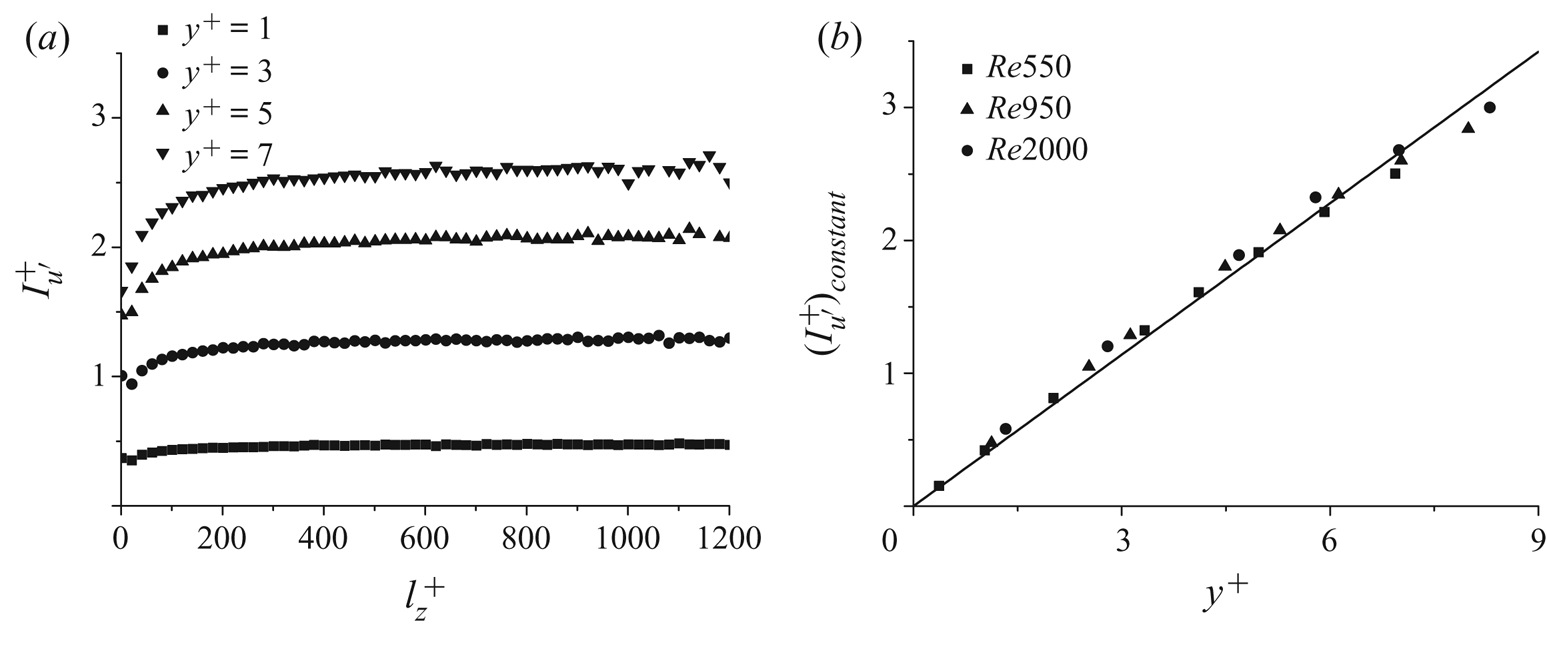
Figure 13(a) displays the variations of  $I_{u'}^+$ as a function of
 $l_z^+$ at several near-wall locations for
 $Re950$. Similar trends are observed for the other two cases (not shown here). It can be seen in figure 13(a) that as
 $l_z^+$ increases,
 $I_{u'}^+$ tends to be constant with
 $y^+\le 7$. The constant value of
 $I_{u'}^+$ (denoted by
 $(I_{u'}^+)_{constant}$) increases with
 $y^+$. Figure 13(b) displays the variation of
 $(I_{u'}^+)_{constant}$ as a function of
 $y^+$ for all cases. A linear relationship between
 $(I_{u'}^+)_{constant}$ and
 $y^+$ holds for the three Reynolds numbers considered,
 \begin{equation} (I_{u'}^+)_{constant}\approx C y^+, \end{equation}
where  $C$ is a constant. The results support the dimensional analysis in Cho et al. (Reference Cho, Hwang and Choi2018); LSM of
 $u'$ in the vicinity of the wall tend to follow inner scaling. According to (4.10), we can assume that the streamwise velocity within the large-scale structures of negative
 $u'$ follow the relationship
 \begin{equation} \frac{u'\big|_{l_z^+}}{u_{\tau}}\approx -C y^+. \end{equation}
(a) Variations of  $I_{u'}^+$ at several selected
 $y^+$ in
 $Re950$. (b) The convergent values of
 $I_{u'}^+$ (
 $(I_{u'}^+)_{constant}$) with respective to
 $y^+$ and the black solid line denotes
 $(I_{u'}^+)_{constant}=0.38y^+$.

Additionally, the streamwise wall-shear fluctuations are given by
 \begin{equation} \tau_x' =\mu \frac{\partial {u'}}{\partial y}, \end{equation}
and substituting (4.11) into (4.12) yield
 \begin{equation} \frac{|\tau_x'|_{NF_s}}{\rho u_\tau^2} \approx C, \end{equation}
which indicates that the magnitude of streamwise wall-shear fluctuations carried by large-scale  $NF_s$ is independent of
 $l_z^+$ and tends to be a constant value, consistent with figure 11.
4.4. Correlation between  $\tau _x'$ structures and outer motions

It is known that the energy-containing motions populating the logarithmic and outer regions leave a ‘footprint’ on the wall surface (Hutchins et al. Reference Hutchins, Monty, Ganapathisubramani, Ng and Marusic2011; Mathis et al. Reference Mathis, Marusic, Chernyshenko and Hutchins2013; Agostini & Leschziner Reference Agostini and Leschziner2019a). Investigating the fluid patterns in the proximity of the wall-shear events can shed light on the generation mechanism of the  $\tau _x'$ structures. To this end, we calculate the correlation between the
 $\tau _{x}'$ structures and the energy-containing motions populating the logarithmic and outer regions by
 \begin{equation} R(r_x,y,r_z)\lvert_{l_z}= \frac{E\left[\tau_{x}'(x_0,0,z_0)\lvert_{l_z}u'(x_0+r_x,y,z_0+r_z)\right]}{\sigma_{\tau_{x}'}\sigma_{u'}}, \end{equation}
where  $E$ is the expected value,
 $(x_0,0,z_0)$ is the reference point,
 $(r_x,y,r_z)$ represents spatial differences in the streamwise, wall-normal and spanwise direction, respectively, and
 $\sigma _{\tau _{x}'}$ and
 $\sigma _{u'}$ are the standard deviation of
 $\tau _{x}'$ and
 $u'$, respectively.
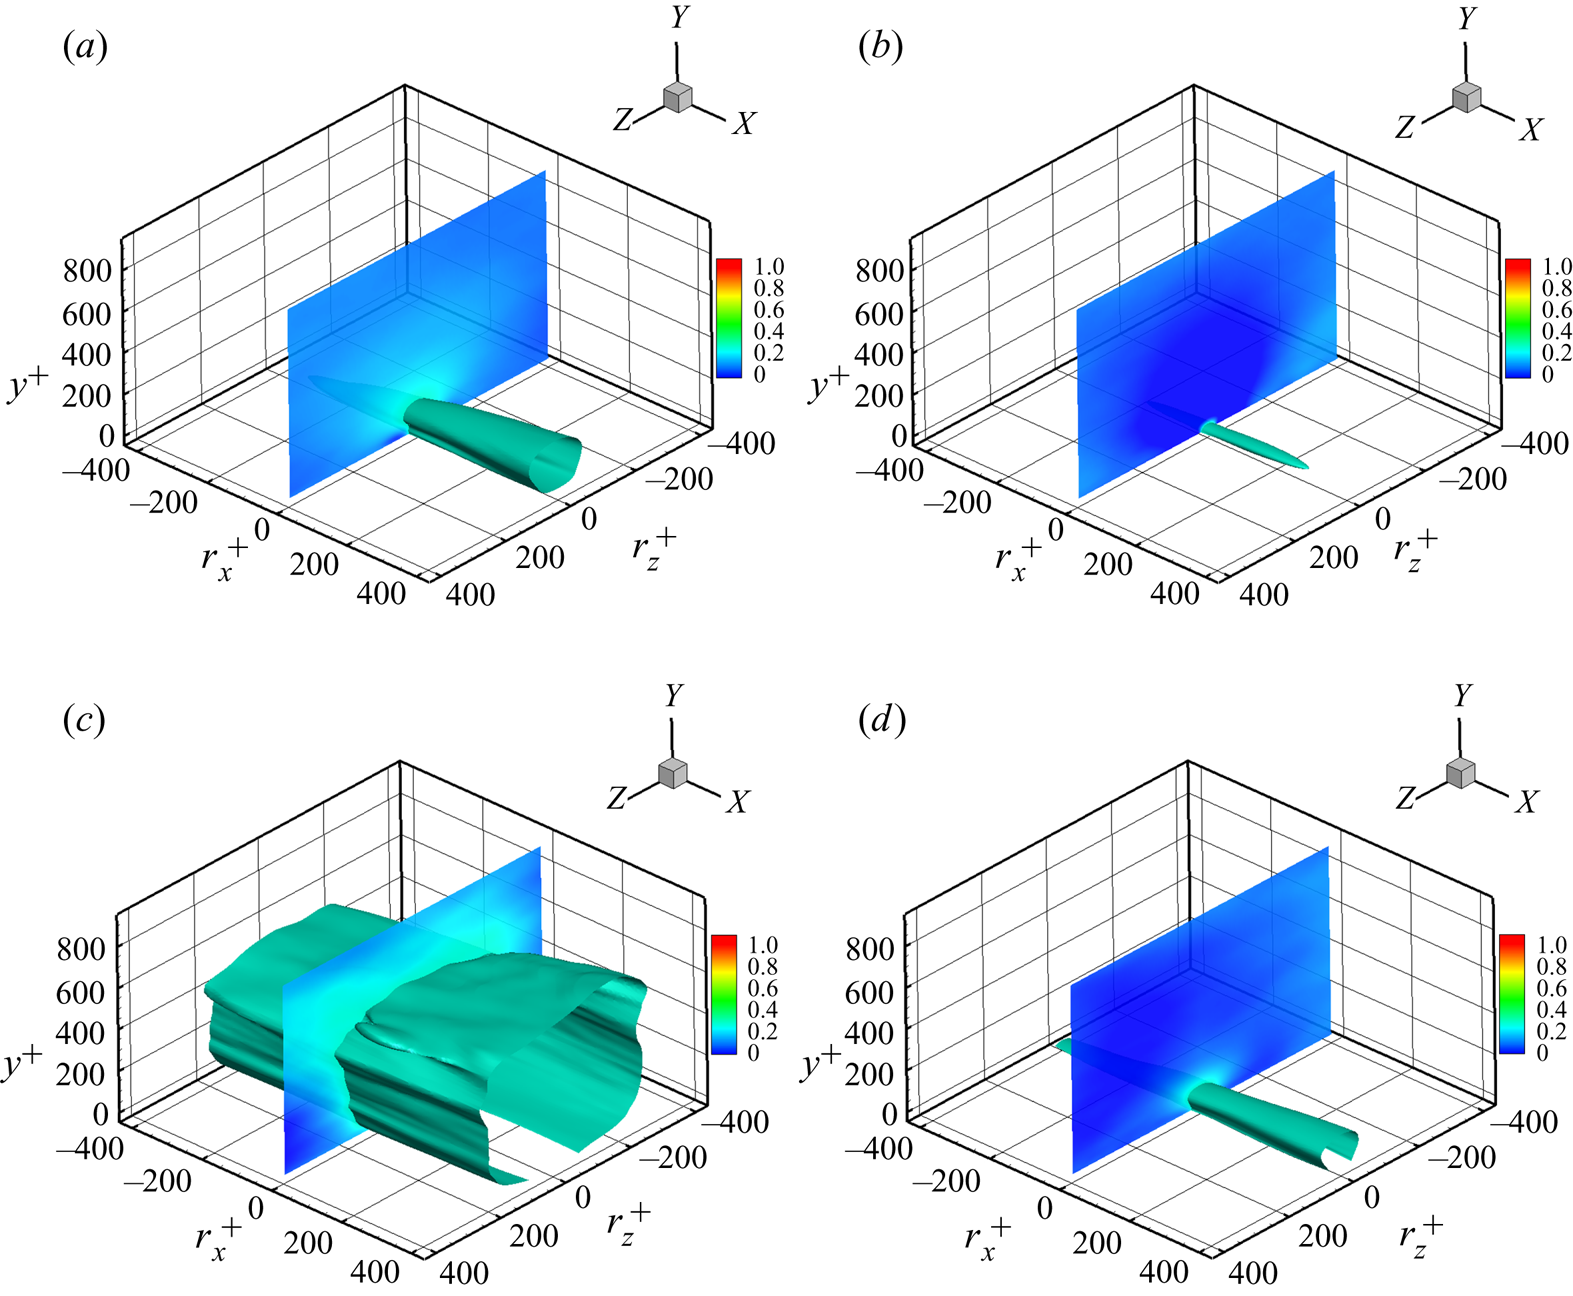
Figure 14 shows the isosurfaces of  $R=0.2$ for
 $PF_s$ and
 $NF_s$ with
 $l_z^+=100$ and 300 for case of
 $Re950$. It is apparent that well-organized streaky structures emerge in the proximity of
 $\tau _{x'}$ structures. The streaks associated with
 $PF_s$ are wider and longer than those associated with
 $NF_s$. This feature is robust for varying
 $R$,
 $l_z^+$ and the Reynolds number. If we set both
 $r_x^+$ and
 $r_z^+$ in (4.14) to zero, then
 $R(0,y^+,0)$ (denoted as
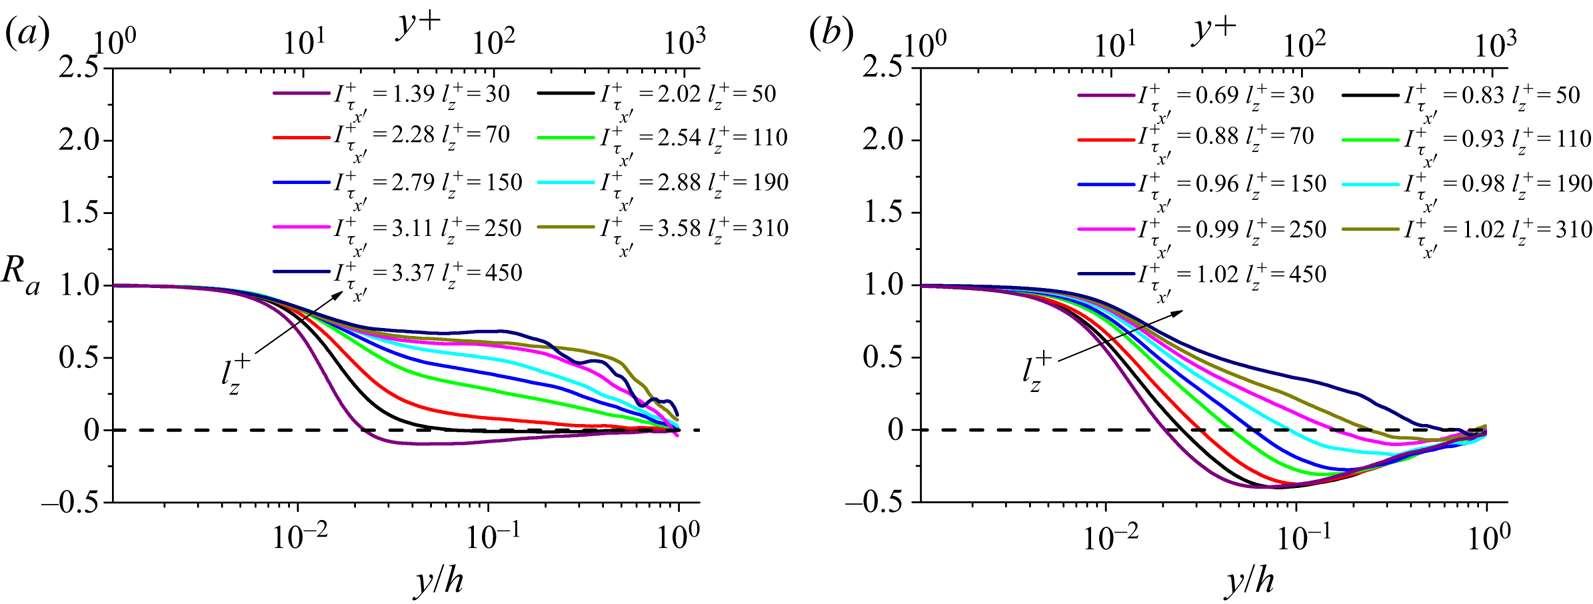
 $R_a(y^+)$ hereafter) represents the conditional correlation just above the target structures. The variations of
 $R_a(y^+)$ as a function of
 $y^+$ and
 $y/h$ are shown in figure 15. The large-scale
 $\tau _{x}'$ structures (both
 $PF_s$ and
 $NF_s$) are significantly correlated with
 $u'$ above the wall. For
 $PF_s$,
 $R_a$ remains positive across the whole channel height when
 $l_z^+>50$; whereas for
 $NF_s$,
 $R_a$ remains positive until the wall-normal distance
 $y_c^+$, which increases with
 $l_z^+$.
(a,b) Isosurfaces of  $R=0.2$ for
 $PF_s$ (a) and
 $NF_s$ (b) with
 $l_z^+=100$ in
 $Re950$. (c,d) Isosurfaces of
 $R=0.2$ for
 $PF_s$ (c) and
 $NF_s$ (d) with
 $l_z^+=300$ in
 $Re950$. The colour contours at
 $r_x^+=0$ exhibit the plane-cut correlations.

Variations of  $R_a(y^+)$ as a function of
 $y^+$ and
 $y/h$ for
 $PF_s$ (a) and
 $NF_s$ (b) in
 $Re950$.

The asymmetry between the correlations of  $PF_s$ and
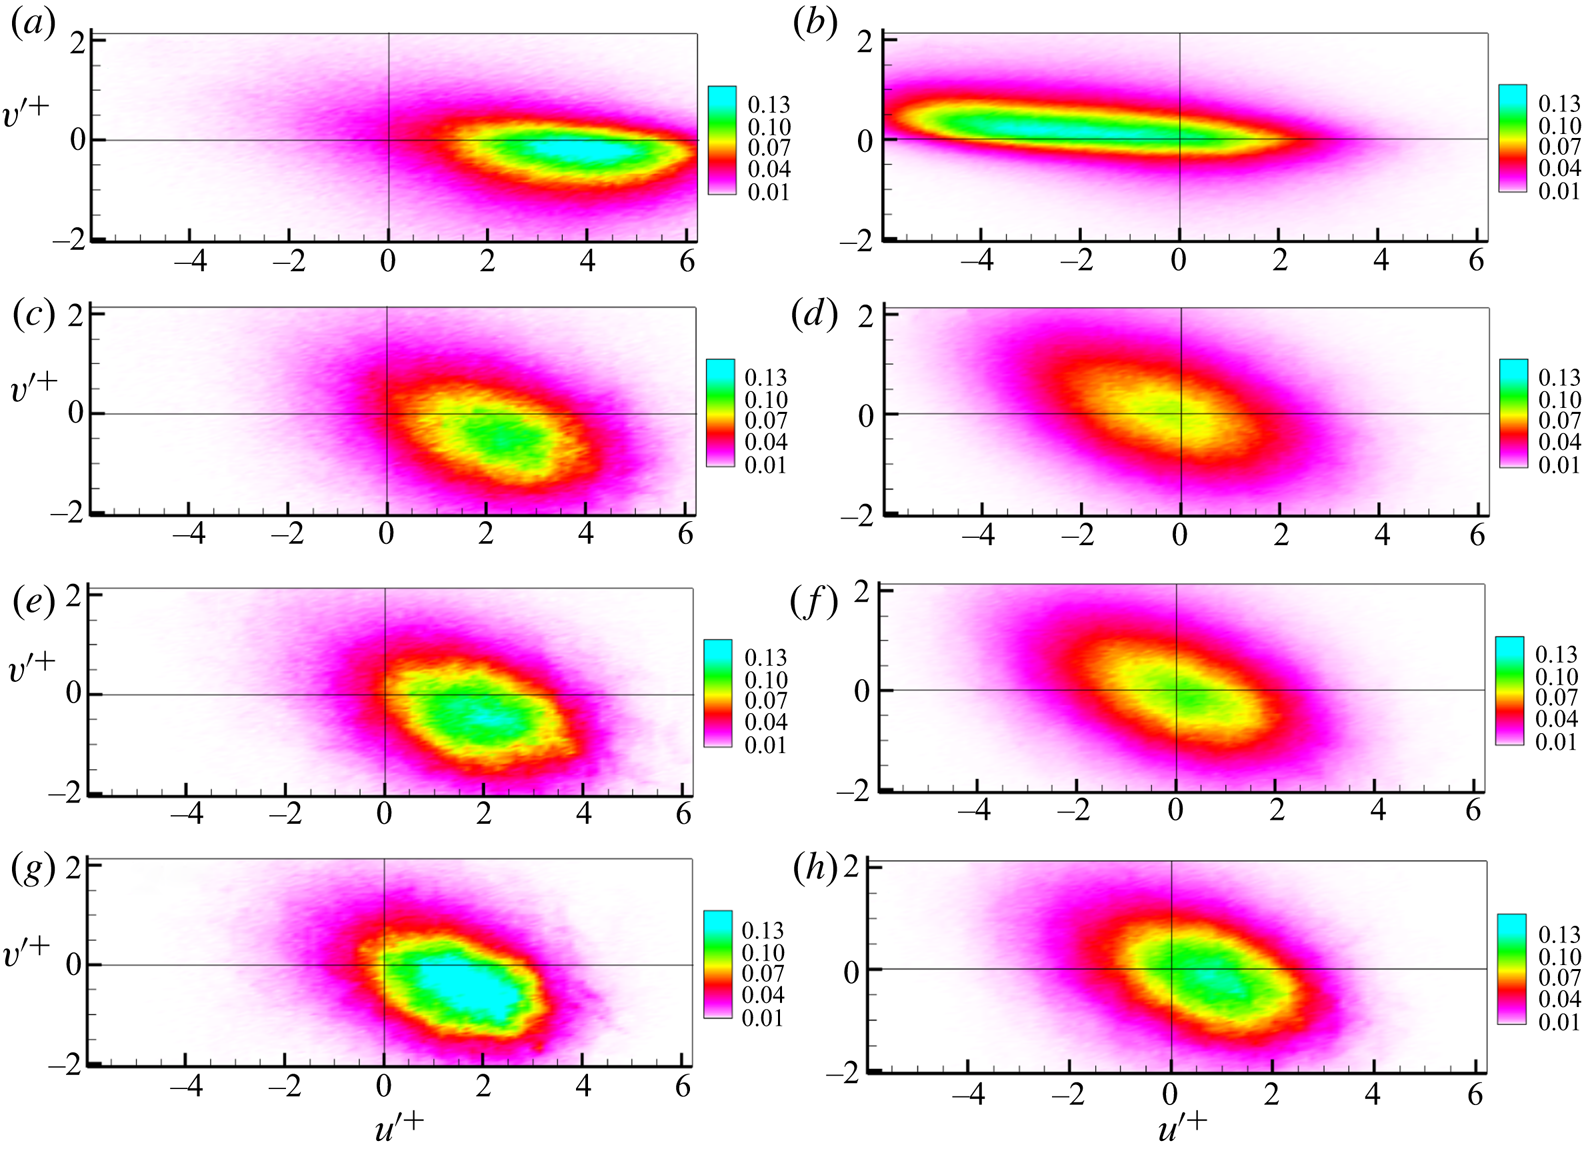
 $NF_s$ can be interpreted from the perspective of the quadrant decomposition (Wallace Reference Wallace2016). The joint p.d.f.s of
 $u'^+$ and
 $v'^+$ just above
 $PF_s$ and
 $NF_s$ with
 $l_z^+=310$ are displayed in figure 16. It can be seen that at all wall-normal positions,
 $PF_s$ are mainly associated with the sweep events (
 $u'^+>0$,
 $v'^+<0$), whereas
 $NF_s$ are strongly correlated with the ejection events (
 $u'^+<0$,
 $v'^+>0$) in the near-wall region (
 $y^+\leq 150$). This observation is in line with the profiles of
 $R_a(y^+)$ shown in figure 15. In this sense, it is reasonable to hypothesize that
 $PF_s$ are generated by strong sweeps, while
 $NF_s$ mainly arise from the ejections, consistent with the asymmetry between sweeps and ejections.
Joint p.d.f.s of  $u'^+$ and
 $v'^+$ at several
 $y^+$, conditioned on
 $PF_s$ (a,c,e,g) and
 $NF_s$ (b,d,f ,h) with
 $l_z^+=310$ in
 $Re950$.
 $(a,b) \ y^{+} = 20, \ (c,d) \ y^{+} = 80, \ (e,\,f) \ y^{+} = 150 \ {\rm and} \ (g,h) \ y^{+} = 250.$

Next, we pay attention to the signature of Townsend's attached eddies. The logarithmic decay of the second-order moment of  $u'$ is considered to be one of the most compelling indicators in favour of the attached-eddy model (Marusic et al. Reference Marusic, Monty, Hultmark and Smits2013; Meneveau & Marusic Reference Meneveau and Marusic2013). Inspired by this observation, the streamwise turbulence intensity conditioned on the
 $\tau _{x}'$ structures is calculated by
 \begin{equation} \overline{u_{c}^{'2}}^{+}(y^+,l_z^+) =\frac{1}{N_{\tau}}\sum_{i=1}^{N_{\tau}}\left[ \frac{u_i'(x_0,y^+,z_0)\lvert_{l_z^+}}{u_{\tau}} \right]^2, \end{equation}
where 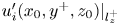 $u_i'(x_0,y^+,z_0)\lvert _{l_z^+}$ is the streamwise velocity fluctuation just above the
 $\tau _x'$ structures, with a spanwise length of
 $l_z^+$.
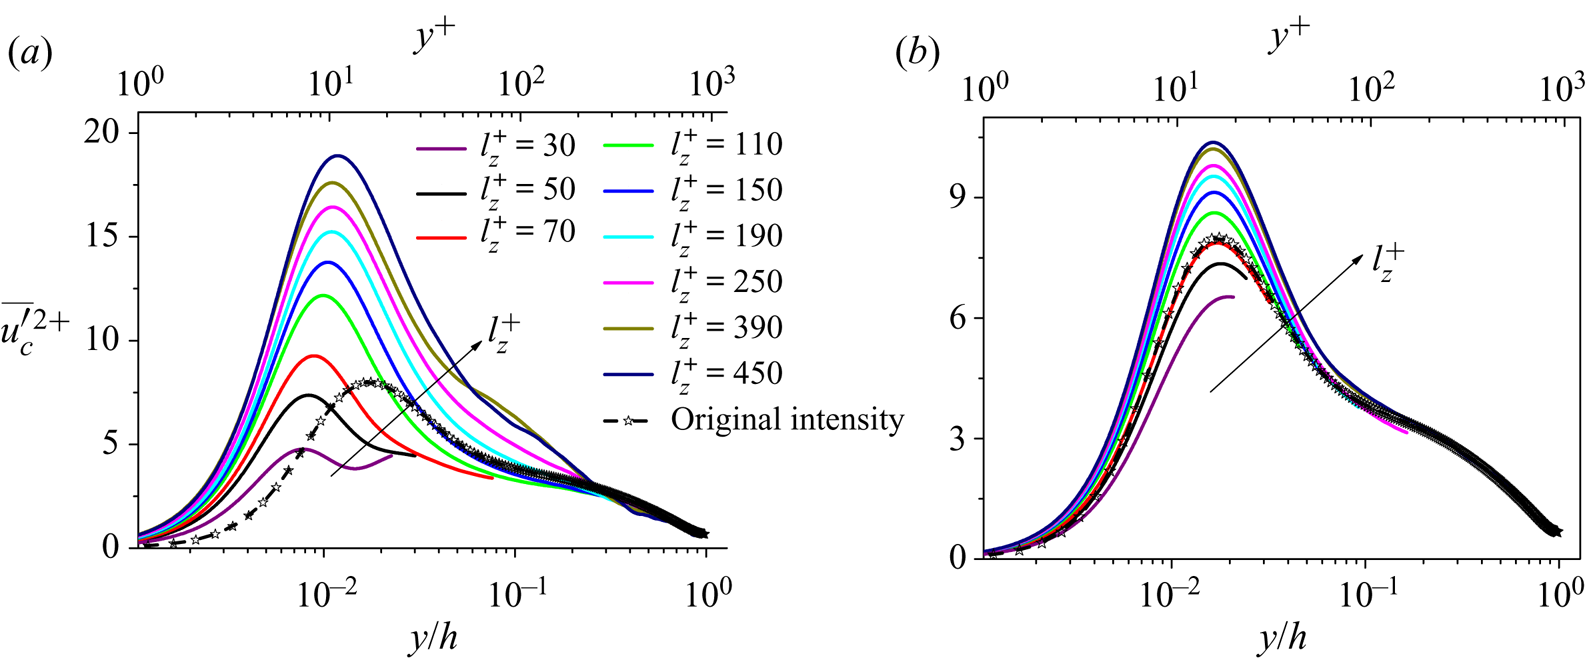
Figure 17 shows the variations of  $\overline {u_{c}^{'2}}^{+}$ as a function of
 $y^+$ and
 $y/h$ for the structures with several selected
 $l_z^+$. The streamwise turbulence intensities of the full channel (
 $\overline {u^{'2}}^{+}$) are also plotted for comparison. Note that the profiles of
 $\overline {u_{c}^{'2}}^{+}$ are truncated at
 $y_c^+$. A remarkable finding is that
 $\overline {u_{c}^{'2}}^{+}$ decays logarithmically for
 $NF_s$ similarly to
 $\overline {u^{'2}}^{+}$, but the same trend is not so observed for
 $PF_s$.
Wall-normal variations of  $\overline {u_{c}^{'2+}}$ for
 $PF_s$ (a) and
 $NF_s$ (b) in
 $Re950$ for selected
 $l_z^+$. The profile of
 $\overline {u^{'2+}}$ is included for comparison.

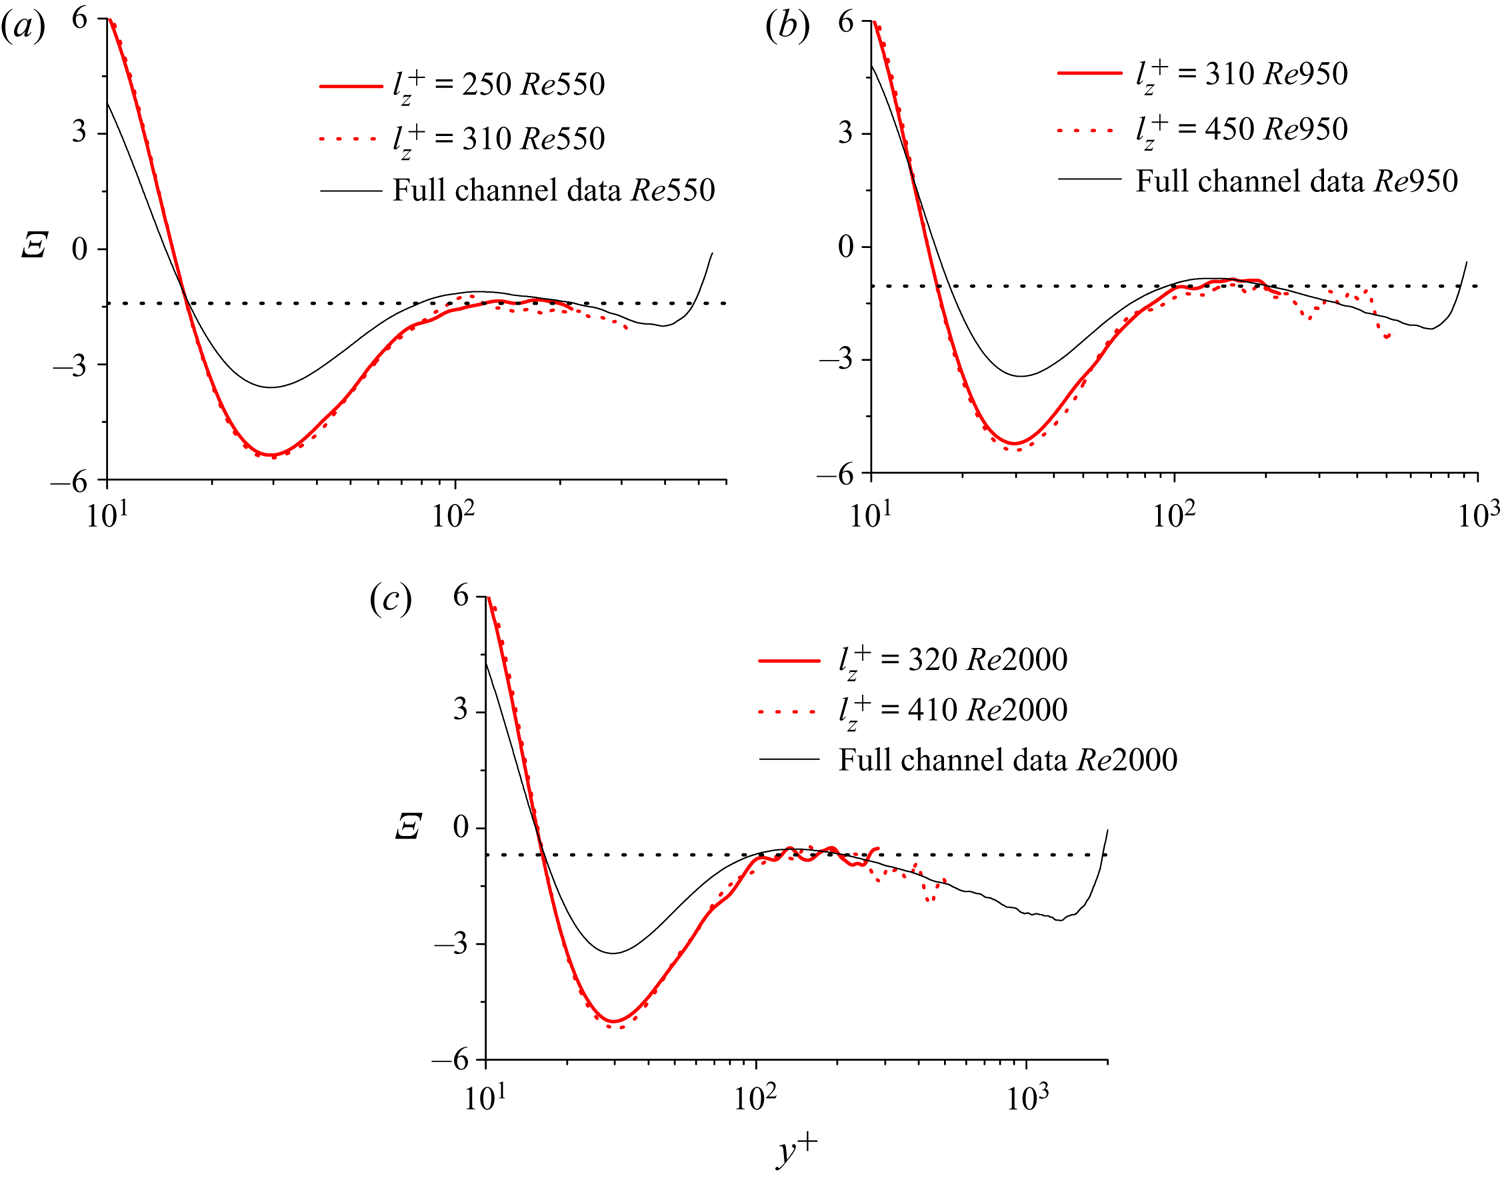
To quantify the logarithmic decaying of  $\overline {u_{c}^{'2}}^{+}$, we define the indicator function,
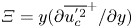 $\varXi =y(\partial \overline {u_{c}^{'2}}^{+} /{\partial y})$. Figure 18 shows the values of
 $\varXi$ as a function of
 $y^+$ for
 $NF_s$. The value of
 $\varXi$ calculated for
 $\overline {u^{'2}}^{+}$ is also included. Compared with the
 $\varXi$ for the full channel data, slightly better defined plateaus are observed for
 $NF_s$ in the range of
 $100\leq y^+\leq 0.2h^+$, which spans the conventional logarithmic region (Jiménez Reference Jiménez2018; Baars & Marusic Reference Baars and Marusic2020b). The wrinkles in figure 18 may be caused by a lack of DNS samples. The observation is striking, since the logarithmic decay of streamwise turbulence intensity has been only observed at much higher Reynolds numbers (Marusic & Kunkel Reference Marusic and Kunkel2003; Jiménez & Hoyas Reference Jiménez and Hoyas2008; Marusic et al. Reference Marusic, Monty, Hultmark and Smits2013; Lee & Moser Reference Lee and Moser2015; Yamamoto & Tsuji Reference Yamamoto and Tsuji2018). For example, Hultmark et al. (Reference Hultmark, Vallikivi, Bailey and Smits2012) reported a logarithmic decay in turbulent pipe flows at
 $Re_\tau \geq 20\,000$, and Yamamoto & Tsuji (Reference Yamamoto and Tsuji2018) showed the logarithmic decay in the DNS of turbulent channel flows at
 $Re_\tau =8000$. Our observations at lower Reynolds numbers underlines the fact that the large-scale
 $NF_s$ identified in the present study have active connection with the attached eddies populating the logarithmic region. The results are also consistent with Cheng et al. (Reference Cheng, Li, Lozano-Durán and Liu2020), who showed that Townsend's wall-attached eddies are present in wall turbulence at Reynolds numbers that are traditionally considered low.
Wall-normal variations of the indicator function  $\varXi$ for
 $NF_s$ in (a)
 $Re550$, (b)
 $Re950$ and (c)
 $Re2000$.

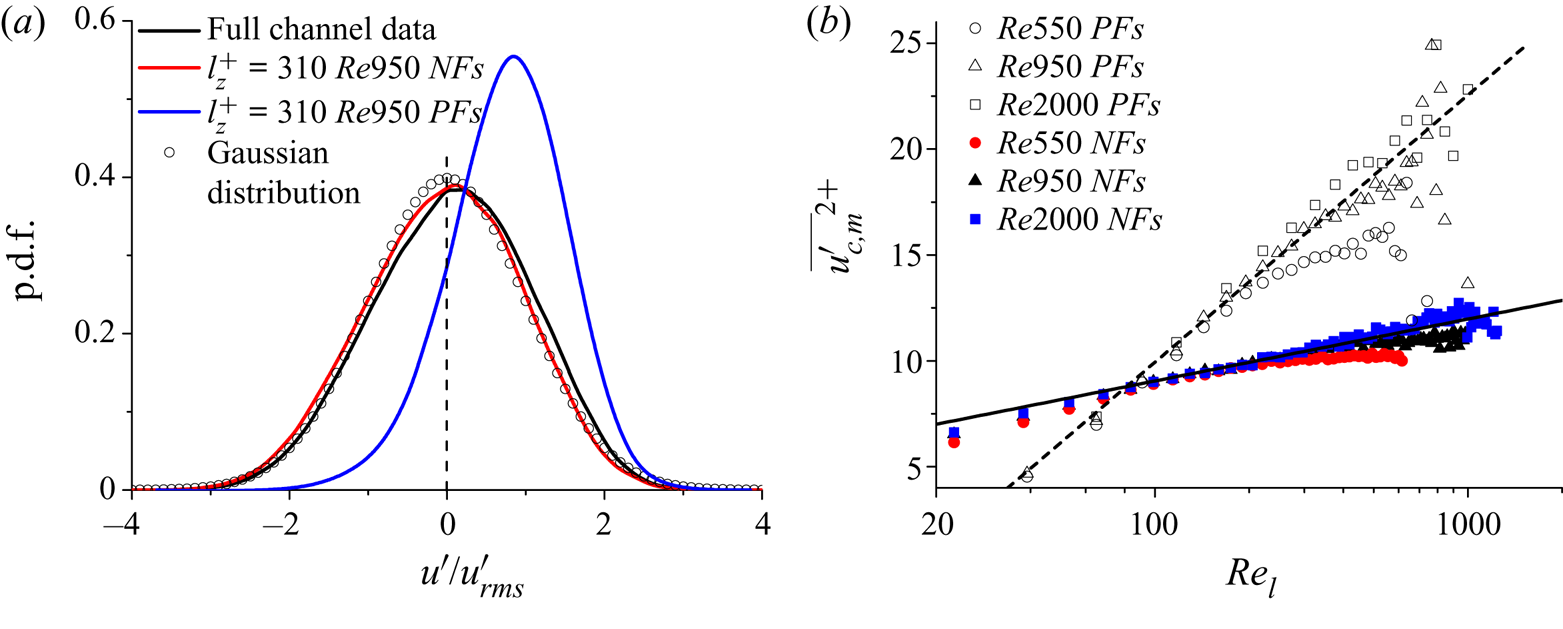
To further assess the flow properties above the  $\tau _x'$ structures, the marginal p.d.f.s of
 $u'$ at
 $y^+=150$ above
 $PF_s$ and
 $NF_s$ with
 $l_z^+=310$ are compared with the p.d.f.s for the full channel data in figure 19(a). The individual root mean square of
 $u'$ is used for normalization. It should be noted this wall-normal position is below
 $y_c^+$ and located in the logarithmic region. The p.d.f. of
 $u'$ above
 $NF_s$ is highly symmetric and follows a Gaussian distribution as that for
 $u'$ for the full channel; whereas the p.d.f. of
 $u'$ above
 $PF_s$ is highly skewed. Similar results are found in the other two Reynolds numbers, which are not shown here for brevity. Bearing in mind that
 $u'$ should exhibit a Gaussian distribution in the logarithmic region according to the attached-eddy model (Meneveau & Marusic Reference Meneveau and Marusic2013; Marusic & Monty Reference Marusic and Monty2019), our results suggest again that
 $NF_s$ are linked to wall-attached eddies, whereas
 $PF_s$ are not.
(a) The marginal p.d.f.s of  $u'/u'_{rms}$ at
 $y^+=150$ conditioned on
 $PF_s$ and
 $NF_s$ with
 $l_z^+=310$ for
 $Re950$, comparing with the p.d.f. of the full channel data. (b) Variations of the inner peaks
 $\overline {u_{c,m}^{'2}}^{+}$ as a function of
 $l_z^+$ for
 $NF_s$. The solid and dashed lines denote
 $\overline {u_{c,m}^{'2}}^{+} \propto 1.27 \ln (Re_l)$ and
 $\overline {u_{c,m}^{'2}}^{+} \propto 5.48 \ln (Re_l)$, respectively.

Another consequence of the attached-eddy model is the increase of the inner peaks of the second-order moment of  $u'$ as
 $\ln (Re_{\tau })$, which has been validated in previous numerical and experimental studies (Marusic & Kunkel Reference Marusic and Kunkel2003; Hoyas & Jiménez Reference Hoyas and Jiménez2006; Meneveau & Marusic Reference Meneveau and Marusic2013; Lee & Moser Reference Lee and Moser2015). By assuming that the inner peaks of the streamwise turbulence intensities are the outcome of the wall-attached eddies residing in the logarithmic region, Meneveau & Marusic (Reference Meneveau and Marusic2013) found that the magnitude of the peaks can be predicted as
 \begin{equation} \overline{u_m^{'2}}^{+}\sim A_1\ln Re_{\tau}, \end{equation}
where  $A_1$ is the constant in the eddy intensity function in (1.2a). Here, we define a scale-based Reynolds number as
 \begin{equation} Re_{l}=\frac{l_z\overline{u_{\tau,c}}(l_z)}{\nu}, \end{equation}
where  $\overline {u_{\tau ,c}}(l_z)$ is the mean friction velocity carried by the structure with a given
 $l_z$, defined by
 \begin{equation} \overline{u_{\tau,c}}(l_z)=\frac{1}{N_{\tau}}\sum_{i=1}^{N_{\tau}} u_{\tau,i}\lvert_{l_z}, \end{equation}
where  $u_{\tau ,i}\lvert _{l_z}$ denotes the instantaneous friction velocity at the
 $i$th grid point belonging to the structures with a given
 $l_z$. In this regard,
 $Re_l$ can be interpreted as a local Reynolds number.
Figure 19(b) aids the examination of the growth rate of the inner peaks  $\overline {u_{c,m}^{'2}}^{\,+}$ for
 $PF_s$ and
 $NF_s$. The value of
 $\overline {u_{c,m}^{'2}}^{+}$ for
 $NF_s$ grows logarithmically with
 $\ln (Re_l)$ with a slope of
 $1.27$, in the regions of
 $100\le Re_l \le 200$ for
 $Re550$,
 $100\le Re_l \le 400$ for
 $Re950$ and
 $100\le Re_l \le 700$ for
 $Re2000$. The growth rate of 1.27 is in agreement with the value of
 $A_1$ in the eddy intensity function (1.2a), as reported in a collection of studies
 $A_1\simeq 1.25\text {--}1.26$ (Hultmark et al. Reference Hultmark, Vallikivi, Bailey and Smits2012; Marusic et al. Reference Marusic, Monty, Hultmark and Smits2013; Sillero et al. Reference Sillero, Jiménez and Moser2013; Lozano-Durán & Jiménez Reference Lozano-Durán and Jiménez2014a; Marusic, Baars & Hutchins Reference Marusic, Baars and Hutchins2017). For
 $PF_s$, the peaks increase with
 $\ln (Re_l)$ with a growth rate of 5.48 for all cases, which is significantly larger than that of
 $NF_s$ and far from the usual value for
 $A_1$ discussed above.
Recently, Hwang (Reference Hwang2015) reported that a single attached eddy is composed of two distinct elements. One is a streak carrying streamwise velocity fluctuations and some spanwise velocity fluctuations, another is the short and tall vortical structure containing all the velocity fluctuating components. The scenario is consistent with a series of previous studies (Adrian, Meinhart & Tomkins Reference Adrian, Meinhart and Tomkins2000; Del Álamo et al. Reference Del Álamo, Jiménez, Zandonade and Moser2006; Lozano-Durán et al. Reference Lozano-Durán, Flores and Jiménez2012). Seen in this context, it is not difficult to find that the footprint of the streak is the near-wall inactive part of the attached eddy as it does not carry the Reynolds stress. In addition, the long streaks are typically represented as the low-momentum regions (Kim Reference Kim1999; Adrian et al. Reference Adrian, Meinhart and Tomkins2000; Hwang Reference Hwang2015; Lee, Sung & Adrian Reference Lee, Sung and Adrian2019). Taking these observations, it would be reasonable to view the  $NF_s$ as the footprints of the attached eddies populating the logarithmic region, which has been demonstrated from several perspectives in the present study. Finally, we conjecture that the formation of
 $PF_s$ is caused by the sweep of vortical structures, probably including the second element of a single attached eddy and the ‘hairpin vortex packet’, a conceptual structure proposed to depict the LSM (Hutchins, Hambleton & Marusic Reference Hutchins, Hambleton and Marusic2005; Adrian Reference Adrian2007; Lee et al. Reference Lee, Sung and Adrian2019). There are three reasons: (i) the correlation of
 $PF_s$ in figure 14 reaches a higher wall-normal location than that of
 $NF_s$ with a given
 $l_z^+$, which is consistent with the spatial image of a single attached-eddy in the study of Hwang (Reference Hwang2015) and the spatial location of LSM; (ii) the correlations of large-scale
 $PF_s$ in figures 14(c) and 15(a) could be characterized by outer scales, which behave similarly to the scales of LSM (Tomkins & Adrian Reference Tomkins and Adrian2002; Adrian Reference Adrian2007; Baars & Marusic Reference Baars and Marusic2020a); and (iii) figure 16 suggests that
 $PF_s$ are mainly associated with the sweep events far from the wall.
5. Concluding remarks
In the present study, we have utilized a two-dimensional clustering methodology to identify the structures of streamwise wall-shear stress fluctuations ( $\tau _x'$). The structures are classified into positive and negative families, denoted by
 $PF_s$ and
 $NF_s$, respectively, according to their sign. The key findings are summarized below.
(a) The
$PF_s$ and $NF_s$ exhibit several asymmetries: (i) $PF_s$ tend to be more fragmented while $NF_s$ are organized in larger scales with approximately constant intensities with respect to their spanwise length scales ($l_z^+$); (ii) the population densities of $PF_s$ and $NF_s$ decay logarithmically as a function of $l_z^+$, and the former decay faster; (iii) $PF_s$ are predominantly correlated with the sweep events in the up-wall region, whereas $NF_s$ are strongly impacted by the ejection events; and (iv) the correlations between $PF_s$ and their surrounding streamwise velocities are wider and longer than those associated with $NF_s$.(b) The attached eddies populating the logarithmic region are found to be actively connected with large-scale
$NF_s$. The evidence is (i) the p.d.f.s of their lengths ($l_x^+$) follow the prediction of the attached-eddy model, i.e. $p \propto (l_x^+)^{-2}$; (ii) the streamwise turbulence intensities conditioned on the large-scale $NF_s$ obey a logarithmic wall-normal decay; (iii) the inner peaks increase logarithmically with the local Reynolds numbers at a model-predicted growth rate; and (iv) the streamwise velocity fluctuations conditioned on the large-scale $NF_s$ tend to follow the Gaussian distribution in the logarithmic region.


Finally, the existing theories in the framework of attached-eddy model do not account for the asymmetrical features between  $PF_s$ and
 $NF_s$ (Woodcock & Marusic Reference Woodcock and Marusic2015; Yang & Lozano-Durán Reference Yang and Lozano-Durán2017). In this regard, the results in the present study may aid the future development of more accurate modelling approaches.
Acknowledgements
This work was funded by the National Natural Science Foundation of China (under the grant no. 11772194 and 91952302) and the Coturb programme of the European Research Council, and performed in part during the fourth Madrid Turbulence Workshop at UPM. We would like to thank M. Atzori and R. Vinuesa for their insightful comments on the preliminary version of this manuscript.
Declaration of interests
The authors report no conflict of interest.
Appendix. Sensitivity to the threshold $\alpha$

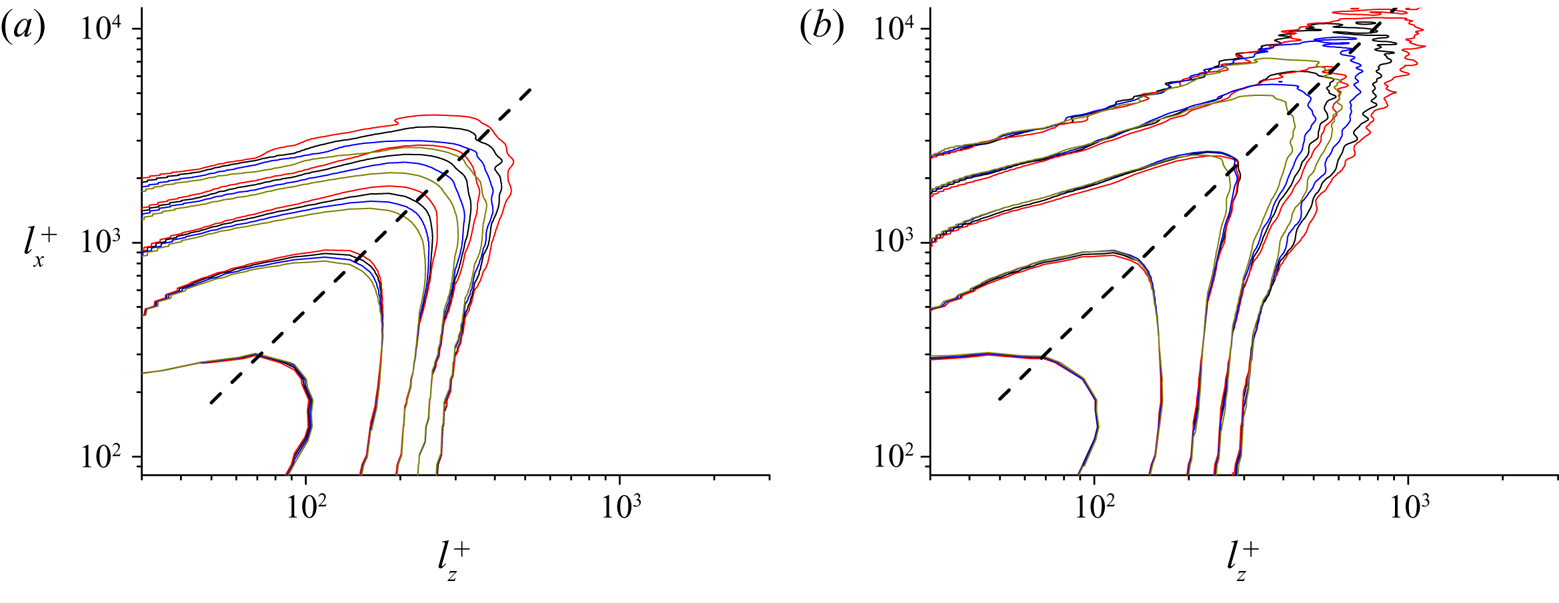
The influences of the threshold  $\alpha$ in (3.1) and (3.2) are examined. Figures 20(a) and 20(b) show the effect of threshold on the joint p.d.f.s of
 $l_x^+$ and
 $l_z^+$ for
 $Re950$. The p.d.f.s are well-organized along
 $l_x^+=0.64(l_z^{+})^{1.44}$, suggesting that the relation between
 $l_x^+$ and
 $l_z^+$ of the
 $\tau _{x}'$ structures does not alter when varying
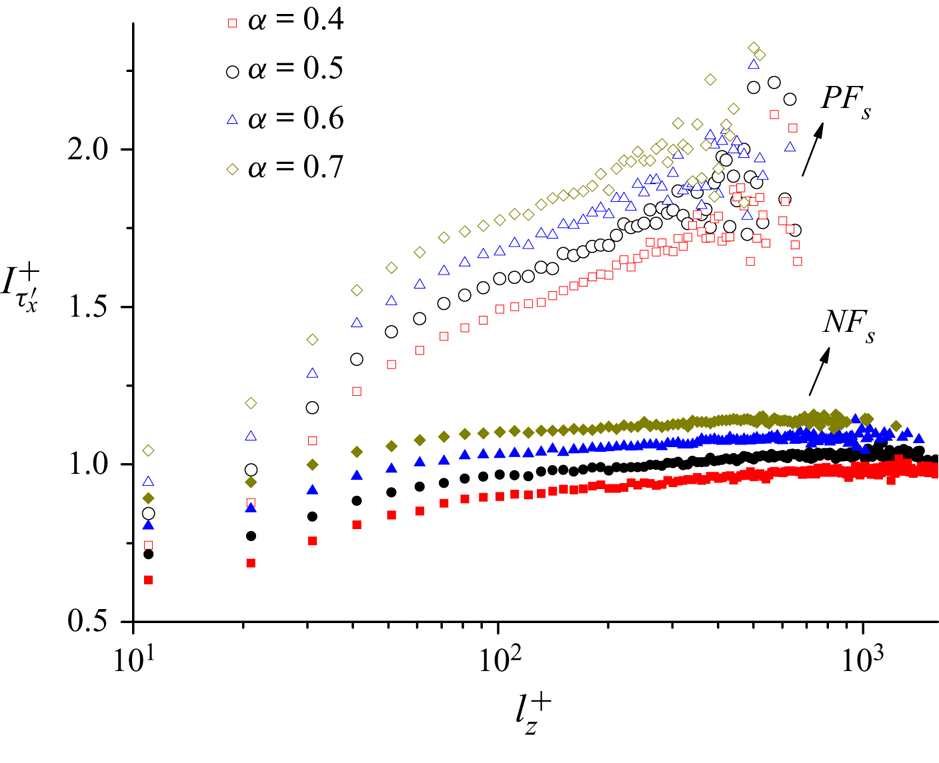
 $\alpha$ from 0.4 to 0.7. Figure 21 illustrates the threshold effect on the wall-shear fluctuations carried by
 $PF_s$ and
 $NF_s$ for
 $Re950$. For a fixed
 $\alpha$, the fluctuating intensity of
 $PF_s$ is pronouncedly larger than that of
 $NF_s$ at a given
 $l_z^+$, and the fluctuating intensity of
 $NF_s$ converges to constant values at large
 $l_z^+$.
Joint p.d.f.s of  $l_z^+$ and
 $l_x^+$ for
 $PF_s$ (a) and
 $NF_s$ (b). Red lines,
 $\alpha =0.4$; black lines,
 $\alpha =0.5$; blue lines,
 $\alpha =0.6$; and brown lines,
 $\alpha =0.7$. The dashed straight lines in panel (a) and panel (b) denote
 $l_x^+=0.64(l_z^{+})^{1.44}$. All contour levels of the p.d.f.s are logarithmically distributed.

Variations of the intensity of streamwise wall-shear fluctuations ( $I_{\tau _{x}'}^+$) carried by
 $PF_s$ and
 $NF_s$ as a function of
 $l_z^+$ over
 $0.4 \leq \alpha \leq 0.7$ for
 $Re950$.

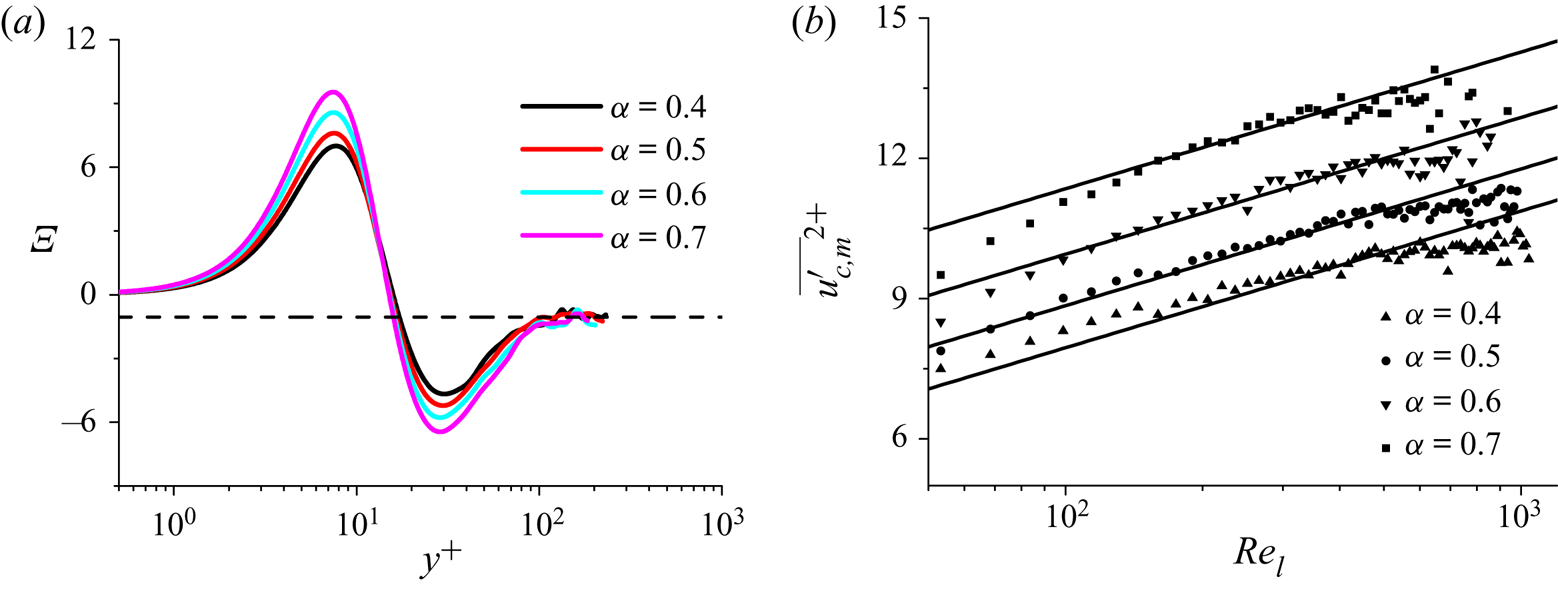
Next, we investigate the influence of  $\alpha$ on the conditional velocities. The indicator function
 $\varXi$ for
 $NF_s$ with
 $l_z^+=310$ over
 $0.4 \leq \alpha \leq 0.7$ for
 $Re950$ is displayed in figure 22(a). These profiles are truncated at
 $y_c^+$. As seen, the logarithmic decaying in the range of
 $100\le y^+ \le 0.2h^+$ is not changed with different
 $\alpha$. Figure 22(b) shows the variations of the inner peaks
 $\overline {u_{c,m}^{'2}}^{+}$ as a function of
 $Re_{l}$ with different
 $\alpha$. Although the profiles shift upward with the increase of
 $\alpha$, the constant growth rate of 1.27 is still observed in
 $150\le Re_{l} \le 500$.
(a) Wall-normal variations of the indicator function  $\varXi$ for
 $NF_s$ with
 $l_z^+=310$ over
 $0.4 \leq \alpha \leq 0.7$ for
 $Re950$. (b) Variations of the inner peaks
 $\overline {u_{c,m}^{'2}}^{+}$ as a function of
 $l_z^+$ over
 $0.4 \leq \alpha \leq 0.7$ for
 $Re950$. The black solid lines indicate
 $\overline {u_{c,m}^{'2}}^{+} \sim 1.27 \ln (Re_{l})$.