INTRODUCTION
The blue crab Callinectes sapidus Rathbun, 1896 has a broad but disjunct distribution along the western Atlantic coast of North and South America, ranging from Barnstable County (Massachusetts, USA) to Trinidad and Tobago, and from Rio de Janeiro (Brazil) to Buenos Aires Province (Argentina) (Santos, Reference Santos2007). Species of the genus Callinectes are economically important in many eastern regions of North America, particularly in Chesapeake Bay (Sharov et al., Reference Sharov, Vølstad, Davis, Davis, Lipcius and Montane2003).
Populations of C. sapidus have been widely studied in North America, including studies on stock status, stock enhancement, and the effect of size selective fishing (e.g. Hines, Reference Hines2003; Miller & Smith, Reference Miller and Smith2003; Carver et al., Reference Carver, Wolcott, Wolcott and Hines2005; Aguilar et al., Reference Aguilar, Johnson, Hines, Kramer and Goodison2008). Stock assessments require information on three processes that regulate the population dynamics of any species: reproduction, growth and mortality. The rates of each of these processes are age-dependent and quantification of them is the core of population dynamic studies. Lipofuscin age pigment accumulation reflects physiological ageing, and when validated, the accumulation of this age pigment can be used for age determination. Quantification of in situ neurolipofuscin has proved to be a useful tool for understanding the population dynamics of commercially important crustaceans (Sheehy et al., Reference Sheehy, Bannister, Wickins and Shelton1999; Fonseca & Sheehy, Reference Fonseca and Sheehy2007; Sheehy & Prior, Reference Sheehy and Prior2008).
Accumulation of extracted lipofuscin has been reported for eyestalks of C. sapidus (Puckett et al., Reference Puckett, Secor and Ju2008). The accumulation of in situ neurolipofuscin has been already demonstrated in either the eyestalk or in the supra-oesophageal ganglion (‘brain’) of several decapod species (Belchier et al., Reference Belchier, Edsman, Sheehy and Shelton1998; Sheehy et al., Reference Sheehy, Caputi, Chubb and Belchier1998, Reference Sheehy, Bannister, Wickins and Shelton1999; Fonseca et al., Reference Fonseca, Parise and Barutot2005a), but no information is available for C. sapidus. Moreover, there is little information regarding possible differences in neurolipofuscin accumulation between eyestalk and brain tissues in a species, and possible bilateral differences in neurolipofuscin loading has only been assessed in eyestalks of lobsters and crayfish (Sheehy, Reference Sheehy2002a; Fonseca et al., Reference Fonseca, Sheehy and Shelton2003; Maxwell et al., Reference Maxwell, Matthews, Sheehy, Bertelsen and Derby2007). Individual variation in lipofuscin accumulation (e.g. bilateral differences) is an important issue in age determination studies, and it has to be considered when quantifying individual lipofuscin loading. For instance, a significant natural asymmetry in antennal damage has been hypothesized to explain laterally asymmetrical accumulation of neurolipofuscin in the supra-oesophageal ganglion of clawed lobsters (Sheehy & Shelton, Reference Sheehy and Shelton2001).
This study reports, for the first time, data regarding in situ neurolipofuscin accumulation in the eyestalk and in the brain of C. sapidus. Bilateral differences in neurolipofuscin accumulation between right and left medulla terminalis cell cluster A–MT-A–(eyestalk), between right and left olfactory lobe cell cluster 10–OLCM-10–(brain), and between MT-A and OLCM-10 were assessed. Results of the present investigation provide a starting point for detailed studies on the population dynamics of this crab using the microscopic-based neurolipofuscin quantification approach as a tool for age determination of C. sapidus.
MATERIALS AND METHODS
Sampling
Blue crabs were sampled in the estuarine region of the Lagoa dos Patos Lagoon. In February 2007, a haphazard sample (N = 60) of the catch of an overnight fishing was taken to the laboratory. In the laboratory, all crabs were measured (carapace width (CW) at the base of lateral spines) and sexed.
Neurolipofuscin analysis
Crabs caught were cryoanaesthetized in iced water for 10 minutes prior to excision of the eyestalks and a region containing the brain (supra-oesophageal ganglion; see procedure described in Fonseca et al., Reference Fonseca, Parise and Barutot2005a). Removed tissue was fixed in 10% formaldehyde. After 48 hours in the fixative, brain and eyestalks were dissected out from surrounding tissues and carapace, and dehydrated and embedded following an established protocol: ethanol series (70%, 85%, 95%, 100% and 1 hour each); 100% ethanol: 100% xylene (1:1) (1 hour); xylene (1 hour); 1st infiltration in 58°C melting point wax at 60°C (45 minutes); and 2nd infiltration in 58°C melting point wax at 60°C (45 minutes). Sectioning was performed using a rotatory microtome set at 6 μm section thickness. The supra-oesophageal ganglion was orientated to permit horizontal sectioning, while the eyestalk ganglionic mass was set for transverse sectioning. The deutocerebrum region (midbrain) of the supra-oesophageal ganglion has a pair of olfactory lobes (OL) which lie on each side of the brain. Each lobe has a large cell mass called cluster 10 (OLCM-10), which is connected to OL by neurites. Only sections containing the OL, AT, and OLCM-10 were utilized for quantification of neurolipofuscin. Eyestalks have four distinct ganglia. The most proximal is the medulla terminalis. Adjacent to one of the neuropiles of medulla terminalis is the hemiellipsoid body (HB), which is associated with cell mass cluster A (MT-A) by axon tracts. Neurolipofuscin was quantified in this cell mass, only in sections containing MT-A, AT, and HB. Unstained sections were observed (100 X oil objective) using an Olympus BX-50 microscope with epifluorescence attachment (BX-FLA) set at green (514 nm) excitation filter. Images were acquired using a CCD camera, and saved as grey scale files. For each section, the region with the most conspicuous neurolipofuscin accumulation was selected and an image was acquired (Sheehy, Reference Sheehy2002a). From 10–15 sections were acquired per sample. The estimation of neurolipofuscin loading (area fraction %) for each section was obtained from the ratio between the number of pixels occupied by lipofuscin granules and total number of pixels of the image (areas without tissue excluded from this total). This image analysis was performed using GNU Image Manipulation Program (GIMP), in which a variable grey scale threshold level (Sheehy, Reference Sheehy2002a) was applied to select pixels with the brightest values which represent lipofuscin granules. Neurolipofuscin quantity was expressed as percentage volume (% vol.) using a geometric weighted average of the area fractions (Sheehy et al., Reference Sheehy, Caputi, Chubb and Belchier1998).
Data analyses
Pearson correlation was estimated between neurolipofuscin in right and left MT-A, and between right and left OLCM-10. Pearson correlation was also estimated between average neurolipofuscin in MT-A and OLCM-10. Significance of correlation coefficient was tested assuming one-tailed hypothesis (r > 0), as a positive correlation between variables tested was biologically more reasonable. A paired t-test was utilized to compare neurolipofuscin quantity between left and right sides. Regression analysis was performed between CW and neurolipofuscin % vol. Data were log-transformed when they were not normally distributed. All results are expressed as mean±standard error. Significance level of 5% was adopted.
RESULTS
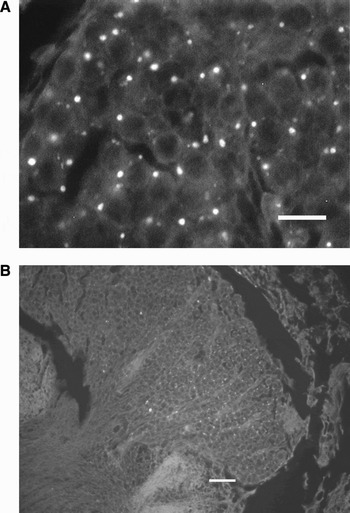
Neurolipofuscin granules were found in several cell clusters of the brain and eyestalk. Neurolipofuscin granules consisted of intracellular cytoplasmic deposits (Figure 1A, B), and they had yellow autofluorescence emission when excited by blue light.
Autofluorescent neurolipofuscin granules in the cytoplasm of globuli neurones in (A) cell cluster A of the medulla terminalis–MT-A–; and (B) in the olfactory lobe cell mass 10–OLCM-10–of Callinectes sapidus (unstained 6 μm wax sections). Scale bars: (A) 10 μm, (B) 20 μm.

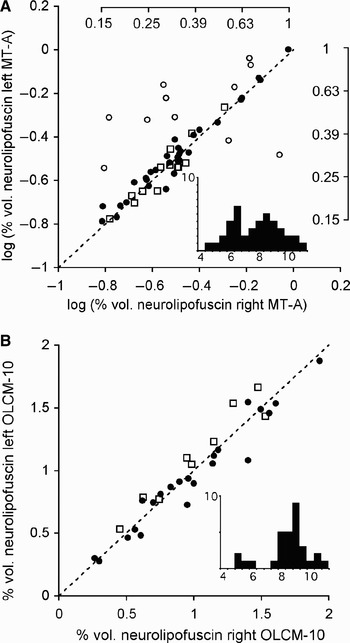
Neurolipofuscin loading was estimated in the eyestalks of 55 crabs. There was no difference in neurolipofuscin amount between the left and right MT-A (P = 0.07, tcalc = 1.86 < tcrit = 2.04), and they were significantly correlated (r = 0.77, P < 0.001) (log-transformed data) (Figure 2A). However, inspection of this scatterplot suggested the occurrence of outliers. Using an outlier detection approach (Hadi method built in Systat) (Hadi, Reference Hadi1994), 11 samples could be selected as outliers (open circles in Figure 2A). The resulting subset of data (N = 44; 12 females and 32 males) also showed no bilateral difference (P = 0.22, tcalc = 1.24 < tcrit = 2.02), and expectedly the correlation observed was stronger (r = 0.97, P < 0.001).
(A) Correlation between % vol. neurolipofuscin in the left and right MT-A (log-transformed data); and (B) correlation between % vol. neurolipofuscin in the left and right OLCM-10. Dashed line represents a perfect correlation, r = 1. Top and right axes shown in (A) represent the raw scale. •, males; ○, outliers (males); □, females. In both figures, insets show histogram of frequency of carapace widths of crabs (y-axis = number of crabs, x-axis = carapace width of crabs in cm).

In brains, neurolipofuscin was quantified in the halves of 32 crabs (9 females and 23 males), and data were normally distributed (P = 0.37). No significant difference was found between left and right sides (P = 0.73, tcalc = 0.34 < tcrit = 2.04) and they were significantly correlated (r = 0.95, P < 0.001) (Figure 2B). No outliers were found.
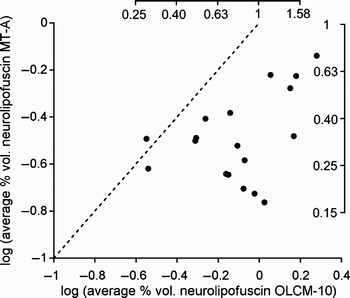
When neurolipofuscin accumulation was compared between MT-A and OLCM-10 (log-transformed data), these variables were significantly correlated (r = 0.42, P = 0.04) (Figure 3). Average neurolipofuscin accumulation was significantly smaller in MT-A (0.353±0.038% vol.) than in OLCM-10 (0.896±0.105% vol.) (P < 0.0001, tcalc = 4.84 > tcrit = 2.08).
Correlation between average % vol. neurolipofuscin in MT-A and OLCM-10 (log-transformed data). Top and right axes show a raw scale. Dashed line represents a perfect correlation, r = 1.

Size-range of crabs caught varied from 4.0 to 10.5 cm CW. Size explained significantly (P = 0.004) only 23% of the variation of neurolipofuscin loading in the brain (OLCM-10) (Figure 4A). For eyestalk data, no significant relationship was found (r2 = 0.08, P = 0.06) between size and neurolipofuscin content in MT-A (Figure 4B). Both regressions were fitted on log-transformed data.
(A) Regression between average % vol. neurolipofuscin in OLCM-10 and carapace width–CW–(log-transformed data); and (B) regression between average % vol. neurolipofuscin in MT-A and carapace width–CW (in cm)–(log-transformed data). Top and right axes show the raw scale.

DISCUSSION
Results indicate that both eyestalk and brain of C. sapidus accumulate quantifiable amounts of in situ neurolipofuscin. Carapace width and neurolipofuscin content were either weakly or not significantly related. This agrees with other studies on crustaceans which did not find size to be a significant predictor of neurolipofuscin quantity or age (Sheehy et al., Reference Sheehy, Bannister, Wickins and Shelton1999; Fonseca & Sheehy, Reference Fonseca and Sheehy2007). Neurolipofuscin has proved to be a better indicator of age than size in other species where known-age animals have been sampled (Fonseca & Sheehy, Reference Fonseca and Sheehy2007). However, data of the present investigation should be interpreted cautiously. The limited size-range of crabs examined (7–10 cm CW, particularly for OLCM-10 due to loss of samples) may preclude a definitive statement regarding the relationship between neurolipofuscin loading and CW in C. sapidus.
High correlations were found between neurolipofuscin contents in left and right sides of eyestalks and brains. The correlation estimated for eyestalks (r = 0.95) is comparable to those estimated for European lobsters (Homarus gammarus, r = 0.93) (Sheehy, Reference Sheehy2002a), signal crayfish (Pacifastacus leniusculus, r = 0.82) (Fonseca et al., Reference Fonseca, Sheehy and Shelton2003), Caribbean spiny lobsters (Panulirus argus, r = 0.85) (Maxwell et al., Reference Maxwell, Matthews, Sheehy, Bertelsen and Derby2007) and edible crabs (Cancer pagurus, r=0.96) (Sheehy & Prior, Reference Sheehy and Prior2008). The maximum % volume of neurolipofuscin in eyestalks (0.72%) is much lower than those reported for much longer-lived cold-temperate European lobsters and edible crabs. However, it is worth noting that the largest crab with eyestalk analysed in the present investigation (10.5 cm) is smaller than the largest, and potentially older, C. sapidus found at Lagoa dos Patos (~16 cm). Therefore, it is expected that 0.72% vol. is not the maximum amount of neurolipofuscin which can be accumulated in eyestalks of C. sapidus.
No outliers were found in the bilateral comparison of OLCM-10 data. The high correlation observed between right and left OLCM-10 is meaningful because it has been suggested elsewhere (Sheehy & Shelton, Reference Sheehy and Shelton2001) that eyestalks should be preferred because bilateral differences in neurolipofuscin accumulation are more likely to be observed in brains. It has been hypothesized that a significant natural asymmetry in antennal damage, which has been found in wild lobsters, could result in laterally asymmetrical accumulation of neurolipofuscin in the OLCM-10 (Sheehy & Shelton, Reference Sheehy and Shelton2001). In the present investigation, no noticeable antennal damage was found in the crabs caught. Based on the present study, it seems unlikely that there are significant bilateral differences in the accumulation of neurolipofuscin in C. sapidus caught in the wild.
The presence of outliers could represent a higher natural variability in neurolipofuscin accumulation in MT-A than in OLCM-10. However, with hindsight, the greater bilateral variability observed in MT-A data (11 outliers of 55 pairs analysed) can be explained by observation errors in image capture. The records kept in the laboratory book clearly show that nine of the outliers (i.e. 18 samples) had their images acquired within the first 30 samples analysed. Brain samples were processed after eyestalk samples. It is likely that early eyestalk data are less precise than later eyestalk data due to the learning process. Therefore, a possible higher natural variability in neurolipofuscin accumulation in MT-A, which has never been reported in other crustaceans, is unlikely.
Although fewer females were caught, it is clear in Figure 2 that data from females fitted very well the regression for data of both sexes. As the rate of neurolipofuscin accumulation is not subjected to sex differences in arthropods (Sheehy, Reference Sheehy2002b; Fonseca et al., Reference Fonseca, Brancato, Prior, Shelton and Sheehy2005b), there was no a priori reason to expect bilateral differences related to the sex.
The amount of neurolipofuscin in the OLCM-10 was typically higher than in the MT-A. Reasons for the higher accumulation rate in the OLCM-10 are unknown. Neurones from OLCM-10 project their axons bilaterally to the hemiellipsoid bodies in the medula terminalis, while interneurones from MT-A promote connections locally (Sullivan & Beltz, Reference Sullivan and Beltz2001). It could be hypothesized that interneurones which compose MT-A would have a lower metabolic rate than projection neurones from OLCM-10. This would result in slower lipofuscinogenesis in MT-A than in OLCM-10. Slower lipofuscinogenesis has been proposed as a mechanism to explain the reduction in neurolipofuscin accumulation in signal crayfish after unilateral eyestalk ablation (Fonseca et al., Reference Fonseca, Sheehy and Shelton2003), as there is a positive correlation between rates of lipofuscin accumulation and metabolic rate (Sohal, Reference Sohal1981; Sheehy et al., Reference Sheehy, Greenwood and Fielder1995). Alternatively, mechanisms of lipofuscin removal could be more developed in neurones from MT-A than from OLCM-10, such as exocytosis and blood transport (Fonseca et al., Reference Fonseca, Sheehy, Blackman, Shelton and Prior2005c).
ACKNOWLEDGEMENTS
The study was supported by the Brazilian Government, through the National Council for Scientific and Technological Development (CNPq), and by the Secretary of Science and Technology of the State of the Rio Grande do Sul, Brazil.