

Introduction
Due to the increased melting season in the arctic regions (Polyak and others Reference Polyak, Alley, Andrews, Brigham-Grette, Cronin, Darby, Dyke, Frizpatrick, Funder, Holland, Jennings, Miller, O'Regan, Savelle, Sereze, John, White and Wolff2010), especially in the seas surrounding Greenland, there has been increased interest in utilising these waterways, both as an efficient transport route and an attractive leisure destination. However, the waters around Greenland are ill understood, which most recently was evident during the summer of 2007, where the Danish cruise ship, M/S Quest, carrying 54 passengers ran aground while trying to navigate close to some of the Greenlandic inlets (DaMSA 2008 a).
Greenland, and the waters surrounding it, are a part of the Kingdom of Denmark. Thus it is the Danish Maritime Safety Administration (DaMSA), which has executive jurisdiction with regards to supervision and surveillance of ship traffic in Danish waters. This task is impeded by the immense size of Greenland. One of the only feasible solutions to obtain decent coverage of the Greenlandic coastline is to perform remote sensing of ship traffic from space. A first step towards this will be to listen for ship based AIS signals from space.
AIS is a data exchange protocol standardised by the International Telecommunication Union (ITU), and ships carrying an AIS transponder broadcast at regular intervals dynamic information about the ship, for example position, speed, heading, etc. as well as static information such as MMSI number, destination port, cargo type, etc. The AIS transponder also receives AIS broadcast from other ships and can therefore be used as an addition to conventional radar systems, thereby improving safety at sea. The International Maritime Organization (IMO) only requires ships above 300 gross tonnes and commercial passenger ships to carry and operate a class A AIS transponder. Thus AIS cannot be regarded as a full replacement for visible and radar observations.
Authorities around the world use AIS information retrieved from land based stations to monitor coastal ship traffic, as an additional information source for search and rescue missions as well as for Vessel Traffic Service (VTS) systems in heavily traffic loaded areas like a the Great Belt bridge area in Denmark (DaMSA 2008b).
However, the perspectives, in being able to receive AIS information from ships around the globe, are vast. One of the main economical and environmental benefits is, that shipping companies will be able to track their ships and cargo around the world in near real time. The availability of this information will allow shipping companies to optimise their shipping routes, and also allow for a better planning of the terminal loading and landing operations. Another benefit, which would come with the increased surveillance of ships at sea would be increased safety at sea. Since ships continuously broadcast their position through AIS, then, in the case of an accident at sea, it will immediately be possible to identify the last known position of the ship and send the rescuers towards this location. An extension of this could be to monitor continuously a given ship, and if the reception of AIS messages from the ship should cease, then this could be an indication of a situation onboard the ship, for example an engine failure, capsizing, piracy, etc. This would then in turn be used to request assistance from nearby ships. It is furthermore planned, that future Search and Rescue Transponders (SART) should be capable of transmitting AIS messages. Finally, the geopolitical aspect of being able to monitor ship traffic in sovereign waters is an important aspect. If combined with space based imagery this will provide a very strong tool for detecting hostile ships from space. An example of this would be for example hostile war ships, pirates or terrorists, which would have turned their AIS transponders off in order to avoid detection. On a satellite image maybe 50 ships would be detected, and from the AIS data 48 would be identified, leaving two suspicious ships left for the authorities to check.
In order to release the full potential of these new utilisation areas will however require that it is feasible to detect ships from space with a sufficiently high detection rate, and that the system will be updated sufficiently often. The latter is solvable by launching more satellites and the first is what will be addressed in detail in the remainder of this paper.
An AIS transponder has a communication range limited by the curvature of the earth, which yields a range of approximately 50-60 km depending on the antenna position. The communication is carried out on two reserved maritime VHF channels around 162 MHz. Two different transponder types are available, class A and class B. The ships that are not required to carry an AIS transponder have the opportunity of using a smaller and cheaper AIS transponder, the class B transponder. These only transmits with a power of 2 W, compared to the class A transponders, which transmit at 12 W. Furthermore, class A transponders have higher transmission priority, meaning, that a class B transponder will not transmit if there are many class A transponders transmitting at the same time.
AIS use a SO-TDMA (Self Organizing Time Division Multiple Access) scheme to share the time on the two channels which is used to avoid/reduce message collisions with better throughput and stability as a result. The message reporting interval for AIS information is independently controlled by each AIS transponder based on the ships’ conditions for example the speed and the rate of turn and the transponder class. Detailed technical characteristics of the AIS standard can be found in the ITU-R standard 1371-2 (ITU 2006b).
Satellite-based AIS monitoring is a promising technology to overcome the coverage limitation experienced by ground stations. However, a number of technical issues need to be addressed. The most important being an increased collision probability of AIS messages and the low signal level due to the large distance between ships and satellite. The SO-TDMA scheme used in AIS minimises collisions among messages sent by different ships that are within communication range of each other. An AIS receiver carried by a satellite however, can see many more ships, that is it has a large field of view (FOV), covering many SO-TDMA zones leading to potential collisions of non-synchronised messages. This paper focuses on the severity of collision probabilities when receiving AIS messages from space.
Previous work in this area has been presented in (Cervera and Ginesi Reference Cervera and Ginesi2008), (Cervera and others Reference Cervera, Ginesi and Eckstein2010), however their results were only based on analytical work and simulations. Currently the Canadian company, ComDev, has received AIS data successfully around South Africa and is planning to launch further satellites in 2010–2011. Among the planed satellites to monitor AIS from space is also AISSat-1 from Norway, which was launched in July 2010 (Amos Reference Amos2010).
Furthermore ESA plans on using The International Space Station (ISS) for receiving AIS, but so far only an antenna design of modest size has been completed and installed (ESA, 2009).
A typical low earth orbit (LEO) satellite with a low gain antenna experiences a FOV of ~2500 km in radius. With the stratospheric balloon, the experiment achieved a FOV of ~550 km. This is still a significantly larger FOV than on ground, even though the FOV is not that of a LEO satellite. A stratospheric balloon test is an excellent opportunity to test an AIS receivers with an extended FOV and to evaluate signal strength and collision effects as a preliminary step in the construction of the final satellite receiver.
In order to collect test data, a satellite prototype of AAUSAT3 have been developed. AAUSAT3 is the third student satellite from Aalborg University and is based on the cubesat standard (Munakata Reference Munakata2009). Everything from project management, development, production and operations of the satellite project is carried out by students. The final goal of AAUSAT3 is to investigate the possibilities of receiving AIS messages around Greenland using a LEO satellite.
The satellite prototype was tested on a stratospheric balloon flight in October 2009 as part the BEXUS (Balloon Experiments for University Students) programme, jointly sponsored by the European Space Agency, the German Aerospace Center and the Swedish National Space Board, which allows European students to test scientific experiments in high altitude conditions.
Method
This section describes the modeling of AIS transmission behaviour with an extended FOV, using the data received from the stratospheric balloon flight. The balloon used in the experiment reached a float height of 24 km for more than 2 hours. With a half-wave dipole mounted on the balloon the FOV was gradually increased from 50 km to 550 km in radius during the balloons ascent phase. The two AIS receivers developed for the prototype of the AAUSAT3 that were flown on the balloon delivered data for this analysis. One AIS receiver, referred in the following as AIS1 was developed as a hardware receiver based on an all-in-one radio transceiver, the Analog Devices ADF7021. The transceiver demodulates the radio signals from one of the two AIS channels to a 9.6 kbaud data stream which is transferred via a Serial Peripheral Interface-bus (SPI) to a Micro Controller Unit (MCU) which takes care of the final data processing. AIS messages that are detected are stored on permanent memory, both with correct and incorrect checksums (Andersen and others Reference Andersen, Pedersen, Rasmussen and Laursen2009). AIS-1 is running in real-time which means all demodulation, checksum checking and storing is done in real-time.
The second AIS receiver, referred to as AIS2 is designed as a Software Defined Radio (SDR). Using a hardware down converter based on the Analog Devices ADF7020 family, the 200 kHz wide frequency spectrum around 162 MHz is converted down to a 200 kHz Intermediate Frequency (IF), which contains both AIS channels. The IF is simultaneously sampled using an analog to digital converter with 1 MSPS on both the In-phase and Quadrature components. Blocks of 2.175 s are sampled and stored in files of 16 MB each (Jessen and others Reference Jessen, Ledet-Pedersen and Mortensen2009). All the used hardware has been designed and produced locally at the university for the AAUSAT3 satellite.
For reference purposes, DaMSA were able to provide reference data from multiple ground stations in the same time interval and covering the area that the balloon covered. These reference data are also included in the analysis. The following data analysis has been divided into the following 4 steps:
1. Preliminary data analysis and comparison
2. Interpolating message transmissions and estimating loss rates
3. Modeling message transmission and collision rates
4. Including the influence of TDMA Zones
Preliminary data analysis and comparison
The first step is a preliminary analysis of the balloon flight data, that is the data received from the AIS1 and AIS2 receivers. The DaMSA provided reference data from the flight period and this is included in the analysis. The number of AIS messages is extracted and the unique MMSI numbers in both reference data and AIS1 data are compared. The data from AIS2 is analysed by taking all the 2 s samples and calculating the average channel use.
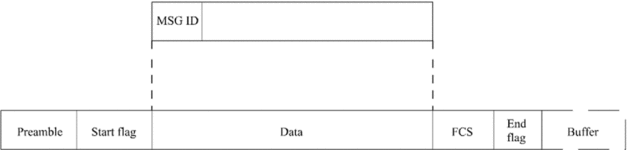
An after flight processing decoder has been implemented in MATLAB, which reads and decodes the raw data from AIS1. The AIS protocol use HDLC to encapsulate messages. This is illustrated in Fig. 1. The data field has different content, depending on the message ID (MSG ID). The AIS standard contains in total 27 different message IDs (ITU 2006b: 93–97). The messages differ in size from 1 to 5 timeslots. The prototype of AIS1 was capable of receiving AIS messages with a size of one timeslot, which covers all important navigation messages.
AIS data encapsulation based on HDLC (ITU, 2006 a, p. 32).
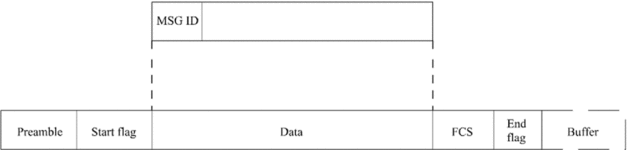
A message ID 1 message is a position report from a Class A transponder, where 168 bits of data describes the ships MMSI number, speed over ground, course over ground, position and a communication state together with other position related information. For example the ship's longitude is a 28 bit signed integer, placed between bit 60 and 90, describing the longitude in 1/10000 minutes. Here is a value between ±180 deg valid, and the default value +181 is indicating no position available. The MATLAB script used in the off-line analyses, reads the first 6 bits of the data field, which is the message ID. Depending on the message ID the rest of the data is decoded and stored for further analysis.
The TDMA zone sizes were estimated by analysing the number of ships within reach of each ship. This information is included in 3/8 of the AIS position records (ITU 2006 a: 34). This data is divided into the data from ships and ground stations, and used to estimate the average number of transponders inside a TDMA zone.
Interpolating message transmissions and estimating loss rates
The AIS1 receiver assigns a sequence number to each received AIS message. In order to create an interpolation of the AIS messages it is necessary to estimate the right timestamp of the messages received, however, an AIS message from a ship only contains information about the Coordinated Universal Time (UTC) second, so it is necessary to estimate the remaining information, that is hour and minute of each AIS message received. These estimates are based on AIS messages from ground stations, since they contain the UTC hour, minute and second.
In order to interpolate the data, the following procedure is executed for each ship:
1. Find the next message from the given ship.
2. Estimate the condition of the given ship.
3. Calculate the number of missed messages between two received messages, assuming a fixed reporting interval from the current ship based on its state.
This interpolated data is used to estimate the loss rate per ship and averaging over all detected ships. This furthermore allows for the average transmission rate to be estimated.
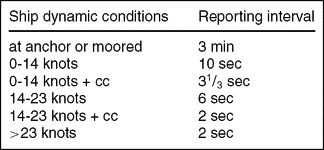
The reporting interval, assuming only dynamic information from Class A transponders, is shown in Table 1, from (ITU 2006a). Ground stations reporting interval are fixed at 10 s.
Class A transponder reporting intervals for dynamic information. cc = changing course.

Modeling message transmission and collision rates
In order to find an analytical expression for the probability of collisions, certain assumptions are made: The ships are assumed to transmit with a uniform distribution, based on an average transmit rate, according to Table 1. If only one message is transmitted in a timeslot, it is assumed to be successfully received. If more than one message is transmitted in a timeslot, they are assumed to collide and to be lost.
At first, a timeslot-based approach is taken, in which the different probabilities of different events in a timeslot is calculated. The three events in a timeslot are: A) an empty timeslot, B) one message transmitted or C) message collision. Under the listed assumptions, the number of messages transmitted in a timeslot can be calculated using the binomial distribution (Ross Reference Ross2004):

where k is the number of messages in a timeslot, n is the number of ships within FOV and p is the probability of one ship transmitting in a timeslot. The variable p can be calculated using the average ship transmission rate in FOV, divided by the number of timeslots in a minute. Equation 1 is used to model the behaviour of one channel.
A message-based approach is taken in order to investigate the probability of losing a message, given that it is transmitted. The probability of sending a message successfully, PTxok, is assumed to be the same as the probability that no other ships are transmitting in the same timeslot:

Another parameter, probability to detect a ship during a certain observation time, is of interest. The probability of detecting a ship is the probability of receiving at least one message from the given ship within a predefined time interval:

where t is the time observed in minutes, and tr is the transmission rate of the observed ship in pck/minute.
The influence of TDMA zones
The SO-TDMA protocol ensures that the transmissions of messages from ships located in one SO-TDMA zone are carried out without any collisions. This can be modeled by dividing the ships into zones. The binomial distribution is still used, but with a different parameters:

where k is the number of messages in a timeslot, m is the number of zones within FOV, pz is the probability of one ship, within a given zone, transmitting in a timeslot. The probability pz can be calculate using the average transmit rate multiplied with the number of ships in a zone, and dividing with the number of timeslots.
Calculating PTxok_z taking into account SO-TDMA zones we can use the following formula:

The values for transmission rate and the size of zones are found from the collected data, and are used in the model.
Results
The balloon flight data was captured in northern Scandinavia on 11 October 2009, from Esrange Space Centre in Northern Sweden, from where the flight took place. The flight was carried out from 9:23 to 13:16 UTC and the float period, in which the height was ~24 km, was more than 2 hours. This section shows the results of the analysis, according to the methodology described in the previous section.
Preliminary data analysis and comparison
Firstly, the channel utilisation is estimated based on AIS2 data from the float period. The average is observed to be reasonably fixed at:

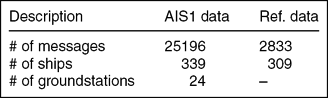
This channel usage is quite high compared to ground based monitoring, however the AIS channel is not overloaded, and there is spare capacity on the channels. Table 2 identifies the number of messages received by AIS1. This shows that AIS1 received on average almost 70 AIS messages per MMSI, while the reference data from DaMSA on average contained 9 AIS messages per ship.
The reference data and decoded AIS1 data.
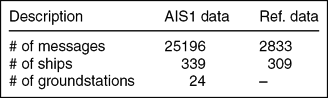
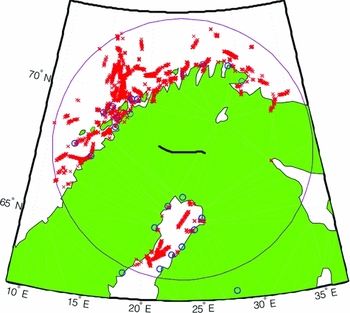
Fig. 2 illustrates the area around the balloon flight. The line in the centre of the figure illustrates the balloon trajectory. Line of sight is indicated by a circle of 550 km radius. AIS1 data is shown using circles to illustrate ground stations and crosses indicating ships. Here the theoretical FOV, limited by line of sight is a good fit. Two ground stations were observed outside the expected 550 km, which can be justified by a high positioned antenna at the ground stations.
Balloon flight trajectory, AIS1 data and FOV.

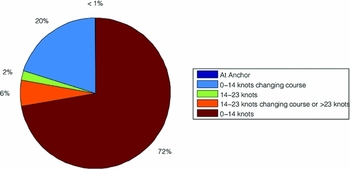
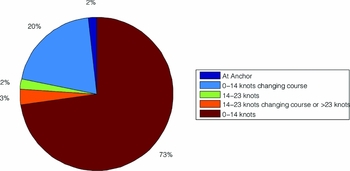
The AIS messages received by AIS1 from the ship during the balloon flight were divided into the different dynamic stages, as defined in the AIS standard, and this is shown on Fig. 3. It shows that the most common dynamic condition is sailing at a speed up to 14 knots, dictating a reporting interval of 10 s. The second highest number of AIS messages is from ships, within the same speed interval, but changing their course at the same time, giving a reporting interval of 31/ 3 s. It is noticed, that very few packets were received from ships at anchor as expected, which is due to the low reporting interval of 3 minutes.
Ships dynamic condition in the AIS1 received data.

Comparison of unique ships detected by AIS1 and in the DaMSA reference data from the ground stations, shows that 151 ships were in both data sets. 158 ships were detected only by the ground stations, and 188 ships were only detected by AIS1. The 158 ships detected by the ground stations, but not by AIS1, can partially be explained by 20 ships outside FOV. 4 ships had Class B transponders and 14 with Class A transponders were moored. It should also be stressed, that the AIS1 receiver only listens to one of the two AIS SO-TDMA radio frequencies, and since the two channels are equal, there is a 50% chance, that a given ship is transmitting on a given channel. The data provided by DaMSAs did not include whether the AIS data were received from Class A or B transponders. However there is a clear indication that not all ships within FOV were detected by AIS1. Furthermore, one should note that the presented values cannot be used to estimate the detection rate, since the reference data did not only come from the FOV during the flight, nor did it cover the complete FOV of the balloon.
The ships detected by AIS1 that were not in the reference data, were mostly outside the range of the ground stations. Other ships that were only detected by AIS1 were because the reference data did not cover the far north of Norway and the Finnish coastline. However, AIS1 did detect ships within the area of the reference data, which was not detected by the nearby ground stations. This also supports the claim that the landscape causes issues (mountainous terrain) both for the ground stations and AIS1.
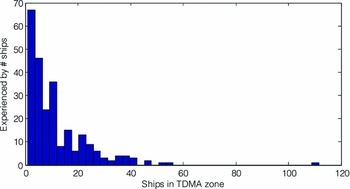
The histogram in Fig. 4 illustrates the number of ships within reach in 3/ 8 of the AIS messages. The average number of ships within reach of a ship is found to be 12, and 21 for ground stations. The histogram shows that there are a large number of ships, with very few ships within range. This can be the case for ships sailing on the open sea.
Number of ships within range of each ship.

Interpolating transmissions and estimating loss rates
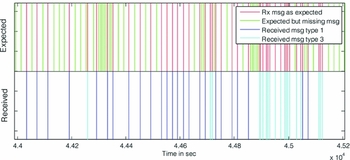
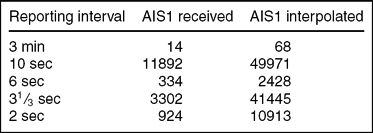
The data interpolation is based on the AIS1 data received during the float period. The interpolation of ship data from AIS1 extended the data set from ~17000 to ~106000 AIS packets. A segment of the data interpolation done on the AIS messages received from one ship is shown in Fig. 5. The bottom part shows the received messages, and the top part shows the received messages augmented with the expected, but not received messages.
A segment of the interpolation done on the data received from the MMSI: 212390000. The fig contains 20 minutes of received data, which is indicated in the lower part. The upper part is augmented with the interpolated data.

The message reception rate is estimated, using the received and interpolated AIS1 data:

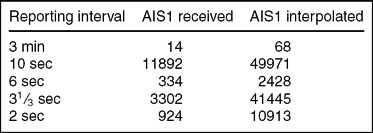
where Rsuccess is the number of received messages and Rmissed is the number of messages missed, estimated by the interpolation. Table 3 identifies the number of messages interpolated divided into the AIS reporting intervals. The estimated time an average ship is in the different reporting intervals is calculated and shown in Fig. 6. Comparison of the two pie plots, Fig. 3 and Fig. 6, shows that the interpolation resembles the received data. The main difference is the percentage at anchor. This is because the time between each message is larger than the other dynamic conditions.
Number of messages divided into the reporting intervals before and after the interpolation.
The AIS1 data interpolated and divided into the AIS standards dynamic conditions, showing the average time spend by a ship in these.

During the balloon flight the average reporting interval was observed to be:
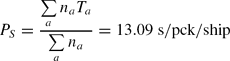
where na is the number of interpolated messages in state a and Ta is the reporting interval. The sums are taken varying index a that represents a state in Table 3. Since the transmission of AIS messages are done equally on both AIS channels, the AIS message transmission rate is equal to AISTXrate = Ps/2 = 6.55 s/pck/ship. The measured average reporting interval of 6.55 s is not far from the 6 s assumed in similar studies (Cervera and Ginesi Reference Cervera and Ginesi2008).
Verification of interpolation method on a shore-based station
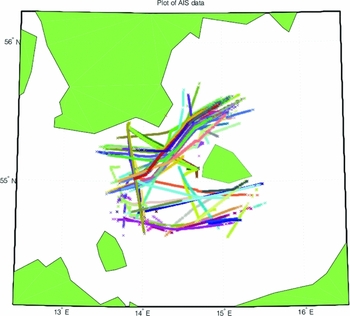
To verify the interpolation method further data has been gathered. Figure 7 illustrates the data from one AIS station placed in Rønne Harbour on the Danish island of Bornholm. The FOV is around 50 km in radius, and data from 13:00 to 22:30 is used from 12 November 2009. 154 unique MMSI were detected, and the average reception percentage was 50.5%, which is expectable for a ground-based station.
Test data from shore-based station, having approximately 50 km radius FOV.

Modeling transmission and collision rate
The values estimated from the measured data for the average reporting interval and the number of ships per zone is used as the input parameters for the equations presented above.
By using data from AIS2, the channel utilisation was calculated to be around 33% (equation 6). From Fig. 8, using the probability of a free channel being 0.67, a number of 195 ships within FOV is obtained. In the collected data there were registered messages from a larger number of ships, 336 in total. This can indicate that not all lost messages were lost due to collisions; some messages could be lost due to too low signal, that is too long distance.
Probability for (A) none, (B) one and (C) > 1 simultaneous transmissions in one slot, as a function of transponders within FOV.

Using equation (2), the probability for a transmission being successful is calculated, for 195 ships within FOV, to be 0.68. And with 336 ships within FOV (corresponding to AIS1 detected Class A transponders and ground stations), the probability for a transmission being successful is 0.51.
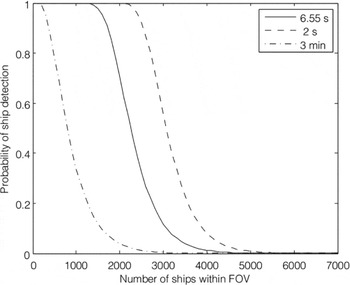
As the main objective of this study is to evaluate the possibilities of detecting a ship from a satellite, it is more interesting to see if it is possible to detect a given ship during the period of time when the satellite is over the ship. For a low earth orbiting satellite this is ~10 min (Wertz and Larson, Reference Wertz and Larson2002). Fig. 9 presents the probability of detecting a ship during a limited period of time of 10 min. using the model. The detection of a ship that is moored or at anchor (3 min transmission rate) is less likely than is the case for a moving ship. This is due to the high difference in the reporting interval from 3 min for a moored ship to 2 s for a fast and course changing ship.
Probability of detecting a ship during 10 min when using different reporting intervals.

Influence of TDMA zones
To show the difference between the ship based and the zone based model, the probability of detecting a ship is calculated using both models (see Fig. 10). The figure shows that the difference when using the ship based model (equation 1) or the zone based model (equation 4) is minimal, especially in rarely frequented waters, like the ones experienced during the balloon flight.
Probability of detecting a ship with and without zones.

Conclusion
In this paper the problems about monitoring the arctic waters around Greenland have been described along with a proposed solution consisting of monitoring the ship traffic in the area from space.
To evaluate the feasibility of this approach, a stratospheric ballon experiment was flown in the autumn of 2009 carrying two different AAUSAT3 AIS receiver prototypes. The data obtained was subsequently analysed in order to evaluate the feasibility of detecting AIS signals from ships using a LEO satellite.
Since the reference data and received data do not cover exactly the same area, the detected percentage does not directly indicate the receiver performance. Some ships have been missed by AIS1, and not by ground stations, and vice versa. This indicates that the landscape, with mountainous terrain as in Norway makes the data set non-ideal for comparison.
The interpolation method proved to be working properly on the received messages and estimated the number of in-between transmissions. Of the interpolated data 16% was actually received, indicating a loss rate of 0.84.
The theoretical collision probability was found to be between 0.32 and 0.49. The difference between the loss rate and the collision probability is too significant to be neglected. This could partly be explained by low SNR causing message errors. Also the previous mentioned landscape has influenced in the line-of-sight and the different experienced transponder qualities. The interpolation method does not only apply to the balloon experiment, but can also be used in a experiment where data from multiple ground stations is used to estimate the traffic, which then could be used for modeling collision probability in the given area.
The model for estimation the received data rate was use on data provided by DaMSA. The data provided contained all messages received by one ground station in seven and a half hour. By using the interpolation method it was estimated that 50.5% was actually received by the ground station (section 3.3). This shows, that it is not possible to go near a 100% reception rate, even under good conditions. Furthermore, the link budget and collisions due to propagation delay should also be taken into account in the theoretical calculations.
Even though a reception rate of 16% or lower might seem too low, then it is important to compare it with the satellites FOV, in which it will be for about 10 min, during which, a fast moving ship would have transmitted 300 AIS messages.
This paper concludes, that the most important parameter, when receiving AIS with extended FOV, is the number of ships within FOV. Hence, an AIS receiving satellites antenna should be designed to limit the FOV, depending on the expected number of ships in the region of interest, and the required probability of ship detection. According to this study a FOV with 1200-1500 ships is the maximum preferred with a dipole antenna. In order to limit the FOV other antenna designs could be considered if needed. A helical antenna, with the length chosen to increase the gain and reduce the FOV to an acceptable size, would for instance be advisable if heavy trafficked areas, such as the English Channel, were to be monitored. One important aspect of the problem with monitoring ship traffic from space in highly congested areas is, that these congested areas are always very near the coast, thus the land based AIS monitoring system will be able to provide ample coverage in these regions.
This leads to two very important conclusion to be drawn: The first one being, that in order to have a truly global high quality coverage of AIS monitoring, space based and land based systems needs to be fused together in order to gain the best of both systems. By doing so, the AIS data foundation would be sufficient to realize the perspectives of better shipping economy and increased safety and security, as outlined in the introduction.
Secondly, it is found, that it is feasible to cover the open seas with a micro to nano size satellite with a relative simple antenna design, such as a dipole, helical or patch array antenna. This in turn means, that it will be possible to establish a constellation of such small satellites to monitor the global ship traffic around the clock through a relative modest investment.
For future development of the AIS system, it is recommended to reduce the AIS channels load to improve space-based monitoring in areas with heavily trafficked waters. One way to do this is to reduce the transmission interval and/or making the AIS messages shorter. This does however require a update of all transceivers, which will take time. Hence, for special ships of interest, a solution could be to add a third channel using 40–60 seconds transmission interval, shorter messages and added forward error correction. In that way, ships with special tracking needs could improve satellite reception probability immediately, without depending on other ships to upgrade their AIS.
Acknowledgments
The AAUSAT3 project is jointly sponsored by Aalborg University and the Danish Maritime Safety Administration, who is responsible for the safety in the seas around Denmark, Greenland and the Faroe Islands. A special thanks goes to all other sponsors of the project, in particular the C.W. Obel Foundation. We would also like to thank the REXUS/BEXUS program for accepting the AAUSAT3 project for the 2009 BEXUS flight. The development of AAUSAT3 has gained tremendous advancement due to the participation in BEXUS.