1 Introduction
Many aquatic animals efficiently propel themselves by oscillating their bodies and caudal fins in unsteady motions. During self-propelled locomotion, swimmers reach a cruising condition where there is a balance between the time-averaged thrust, generated mainly by their caudal fins, and the time-averaged drag incurred by their bodies (Saadat et al. Reference Saadat, Fish, Domel, Di Santo, Lauder and Haj-Hariri2017). By following this idea, numerous studies (Chopra Reference Chopra1976; Read, Hover & Triantafyllou Reference Read, Hover and Triantafyllou2003; Dong et al. Reference Dong, Mittal, Bozkurttas and Najjar2005) have investigated the performance of heaving and pitching propulsors in isolation instead of the combined body and propulsor of other studies (Lighthill Reference Lighthill1960). For example, Garrick’s theory (Garrick Reference Garrick1936) extends the small-amplitude theory of Theodorsen (Reference Theodorsen1935) to calculate the thrust production and power consumption of pitching and heaving two-dimensional airfoils. Later, this theory was extended to large-amplitude oscillations (Scherer Reference Scherer1968) and to three dimensions with a particular focus on the lunate tail of aquatic animals (Lighthill Reference Lighthill1970; Chopra Reference Chopra1976; Chopra & Kambe Reference Chopra and Kambe1977). Cheng & Murillo (Reference Cheng and Murillo1984), for example, developed an asymptotic analysis for high-aspect-ratio surfaces oscillating at low frequencies, where the influence of wake vorticity was captured by generalizing classical lifting line theory (Prandtl Reference Prandtl1920). Karpouzian, Spedding & Cheng (Reference Karpouzian, Spedding and Cheng1990) improved upon this asymptotic theory for lunate tails. While these studies have provided great insights, the identification of the flow mechanisms that lead to the scaling of the thrust and power of swimmers has been elusive for cases with propulsors ranging from low to high aspect ratios, motions ranging from small to large amplitudes and with nonlinearly deforming wakes.
While these previous studies provide exact unsteady theoretical solutions within the framework of their assumptions, other studies have sought more broadly applicable semi-empirical models of force production. For example, the dynamics of falling cards was modelled by considering the circulatory, added mass and viscous forces acting on them (Pesavento & Wang Reference Pesavento and Wang2004; Andersen, Pesavento & Wang Reference Andersen, Pesavento and Wang2005). This highlighted the importance of the quasi-steady rotational lift force first discussed by Munk (Reference Munk1925) and also present in later unsteady theory (Theodorsen Reference Theodorsen1935; Garrick Reference Garrick1936; McCune & Tavares Reference McCune and Tavares1993). In fact, this lift force proportional to the angular rate of an airfoil, described as virtual camber (Babinsky et al.
Reference Babinsky, Stevens, Jones, Bernal and Ol2016), is of prime importance in insect flight (Wang, Birch & Dickinson Reference Wang, Birch and Dickinson2004). Later, the quasi-steady force model proposed for falling cards was recast as a model for the force production of flapping wings (Berman & Wang Reference Berman and Wang2007). Others extended this quasi-steady model with an additional dynamic stall model in order to optimize the energy extraction potential from a flapping wing device (Bryant, Gomez & Garcia Reference Bryant, Gomez and Garcia2013) and for flapping wing flight (Gomez, Bryant & Garcia Reference Gomez, Bryant and Garcia2014). Similarly, the circulatory forces in the quasi-steady falling card force model have been corrected for aspect ratio variations by accounting for the influence of the trailing vortex system (Wang et al.
Reference Wang, Hu, Xu and Wu2013). Numerous other quasi-steady models have been proposed for flapping flight (Traub Reference Traub2004; Ansari, Żbikowski & Knowles Reference Ansari, Żbikowski and Knowles2006; Wang, Goosen & Van Keulen Reference Wang, Goosen and Van Keulen2016; Han, Chang & Han Reference Han, Chang and Han2017; Moriche, Flores & García-Villalba Reference Moriche, Flores and García-Villalba2017; Wang, Goosen & van Keulen Reference Wang, Goosen and van Keulen2017). Although most of these models incorporate added mass effects, they are described as quasi-steady models since they generally do not incorporate wake-induced effects. As such, these models work well for reduced frequencies of
 $k=fc/U<0.2$
, where
 $f$
is the flapping frequency,
 $c$
is the chord length and
 $U$
is the free-stream speed. However, oscillatory swimming is characterized by reduced frequencies of the order of
 $k=O(1)$
(Webb Reference Webb2002) where wake-induced effects and trailing-edge vortex shedding significantly impact the force production.
Several studies have focused on the development of force models or scaling laws for the thrust and efficiency of aquatic animals, where quasi-steady analyses do not suffice. Triantafyllou, Triantafyllou & Grosenbaugh (Reference Triantafyllou, Triantafyllou and Grosenbaugh1993) established the importance of the Strouhal number for aquatic animal propulsion, which has been adopted in most subsequent works as the main parameter of interest (Quinn, Lauder & Smits Reference Quinn, Lauder and Smits2014a ). Green & Smits (Reference Green and Smits2008) characterized the thrust production of low-aspect-ratio rectangular pitching panels by deriving a scaling relation that links the Strouhal number, aspect ratio and amplitude of motion. They considered an approach inspired by Prandtl’s lifting line theory to account for the effects of aspect ratio on the pressure coefficient (Green & Smits Reference Green and Smits2008). In contrast, Dewey et al. (Reference Dewey, Boschitsch, Moored, Stone and Smits2013) and Quinn et al. (Reference Quinn, Moored, Dewey and Smits2014b ) scaled the thrust forces of pitching panels with the added mass forces. By considering both circulatory and added mass forces, Floryan et al. (Reference Floryan, Van Buren, Rowley and Smits2017) presented scaling laws for the thrust and power of heaving or pitching two-dimensional foils. Similarly, Moored & Quinn (Reference Moored and Quinn2018) developed scaling laws by considering circulatory forces, added mass forces and wake-induced nonlinearities that are not accounted for in classical linear theory. Both Floryan et al. (Reference Floryan, Van Buren, Rowley and Smits2017) and Moored & Quinn (Reference Moored and Quinn2018) showed that not only the Strouhal number, but also the reduced frequency are important for capturing the scaling of the force production and power consumption of oscillating hydrofoils.
Here, we extend the scaling relations of Moored & Quinn (Reference Moored and Quinn2018) from two to three dimensions by varying the aspect ratio of pitching propulsors. Our new scaling relations are then verified through simulations and experiments. We show that the core two-dimensional scaling relations presented in Moored & Quinn (Reference Moored and Quinn2018) can be modified by combining classical scalings from aerodynamic and hydrodynamic theory of the added mass and effects of upwash/downwash, and by accounting for the elliptical shape of trailing-edge vortices. The scaling relations developed in this study offer a guide to speeding up the design of bio-inspired vehicles, and they provide insight into the flow physics that drive thrust production, power consumption and efficient swimming. Importantly, the scaling laws offer a physical rationale for the origins of force production and power consumption.
The paper is organized in the following manner. Section 2 describes the problem formulation and variable ranges for the current study. Section 3 describes the numerical and experimental methods employed. Section 4 describes the previously derived two-dimensional scaling laws and the newly developed three-dimensional corrections. Section 5 presents numerical and experimental validation of the scaling laws. Finally, § 6 describes the limitations and possible extensions of the scaling laws.
2 Problem formulation
2.1 Idealized three-dimensional swimmer
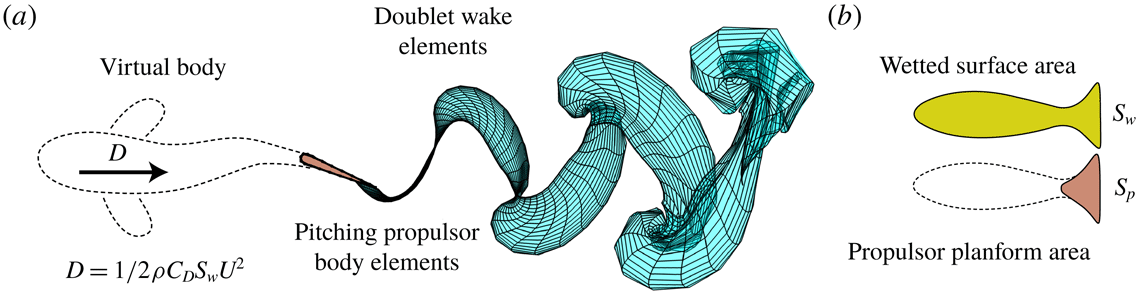
Self-propelled simulations are performed on an idealized swimmer that is a combination of a virtual body and a three-dimensional propulsor (figure 1
a). The propulsor is represented by a rectangular-planform propulsor that is pitching about its leading edge. The virtual body is not present in the computational domain, but its presence is represented as a drag force,
 $D$
, acting on the propulsor. To determine the drag force, we used a classic high-Reynolds-number drag law, where drag is proportional to the square of the swimming speed
 $U$
:
 $$\begin{eqnarray}D=1/2\unicode[STIX]{x1D70C}C_{D}\,S_{w}U^{2},\end{eqnarray}$$
where
 $\unicode[STIX]{x1D70C}$
is the fluid density,
 $C_{D}$
is the drag coefficient and
 $S_{w}$
represents the total wetted surface area of a swimmer (figure 1
b).
(a) Illustration of an idealized pitching three-dimensional swimmer as a combination of a virtual body and propulsor. The doublet wake elements model vorticity shed from the trailing edge of the propulsor. (b) Representation of the wetted surface area and propulsor planform area.

2.2 Input parameters
In self-propelled swimming, the time-averaged thrust and drag of a swimmer are balanced when the swimmer is at a cycle-averaged steady state. The drag coefficient of the body and the wetted area to propulsor planform area ratio,
 $S_{wp}=S_{w}/S_{p}$
, both affect how thrust and drag are balanced on a swimmer and their combination is represented by the Lighthill number
 $$\begin{eqnarray}Li=C_{D}\,S_{wp}.\end{eqnarray}$$
The Lighthill number represents the propulsor loading during self-propelled swimming and is analogous to the wing loading of birds and aircraft. When
 $Li$
is high there is high propulsor loading and vice versa. Given constant kinematics and propulsor geometries, high-
 $Li$
swimmers will swim slower than low-
 $Li$
swimmers. In the current study, the Lighthill number is varied from 0.05 to 0.15, which covers a range typical of animal locomotion (Eloy Reference Eloy2013).
The non-dimensional mass of the swimmer, defined as body mass divided by added mass,
 $m^{\ast }\equiv m/\unicode[STIX]{x1D70C}S_{p}c$
, was chosen as 1. In this equation,
 $\unicode[STIX]{x1D70C}$
and
 $c$
correspond to the density of water and the chord length of the foil, respectively. Moored & Quinn (Reference Moored and Quinn2018) previously showed that the self-propelled performance of a swimmer was found to be nearly independent of its non-dimensional mass as long as
 $m^{\ast }\geqslant 1$
. By using the lower bound of this range, the simulations then reach their cycle-averaged steady-state solution with the smallest amount of simulation time. The simulated propulsor has a chord length of
 $c=0.1$
m and a NACA 0012 cross-section in accordance with previous work (Moored & Quinn Reference Moored and Quinn2018). Its planform area is defined as
 $S_{p}=sc$
, where
 $s$
is the span length of the propulsor. The aspect ratio for the rectangular propulsor is defined as
 $\def\AR{A\mkern-8muR}\AR =s/c$
, which varies from 1 to 1000 in the current study, where the highest aspect ratio represents an effectively two-dimensional propulsor.
The propulsor’s kinematic motion is characterized as sinusoidal pitching about the leading edge where the pitching angle is described by
 $\unicode[STIX]{x1D703}(t)=\unicode[STIX]{x1D703}_{0}\sin (2\unicode[STIX]{x03C0}ft)$
, where
 $f$
is pitching frequency,
 $\unicode[STIX]{x1D703}_{0}$
is pitching amplitude and
 $t$
is time. The pitching amplitude co-varies with the peak-to-peak amplitude, which can be specified as a non-dimensional amplitude-to-chord ratio:
 $$\begin{eqnarray}A^{\ast }=A/c.\end{eqnarray}$$
Then the pitching amplitude can be written as
 $$\begin{eqnarray}\unicode[STIX]{x1D703}_{0}=\sin ^{-1}(A^{\ast }/2).\end{eqnarray}$$
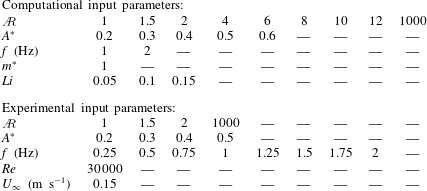
All of the input parameters used in the current study are reported in table 1. The frequency, amplitude and aspect ratio ranges are chosen to produce a dataset that covers the Strouhal number, reduced frequency and aspect ratio ranges that are typical of biological and bio-inspired propulsion (Sambilay Jr Reference Sambilay1990; Saadat et al.
Reference Saadat, Fish, Domel, Di Santo, Lauder and Haj-Hariri2017). Moreover, the Reynolds number of the experiments is
 $Re=30\,000$
and the simulations are effectively at an infinite Reynolds number.
Input parameters used in the present study.

2.3 Output parameters
To examine bulk swimming performance, we time-averaged output parameters over an oscillation cycle, as indicated with an overline (
 $\overline{\cdot }$
). All mean quantities are taken after a swimmer has reached steady-state swimming, defined as the time when the net thrust coefficient is
 $C_{T,net}\leqslant 10^{-5}$
, where
 $C_{T,net}=(\overline{T}-\overline{D})/(1/2\unicode[STIX]{x1D70C}S_{p}\overline{U}^{2})$
and
 $T$
is the thrust force, calculated by integrating of the pressure forces projected in the
 $-x$
direction. Once the mean swimming speed is determined, the reduced frequency and the Strouhal number are defined as
 $$\begin{eqnarray}k=\frac{fc}{\overline{U}},\quad St=\frac{fA}{\overline{U}}.\end{eqnarray}$$
In self-propelled swimming, these two variables become outputs since the swimming speed is unknown a priori. Furthermore, the time-averaged thrust and power coefficients non-dimensionalized by the added mass forces and added mass power from small-amplitude theory (Garrick Reference Garrick1936) are defined as
 $$\begin{eqnarray}C_{T}=\frac{\overline{T}}{\unicode[STIX]{x1D70C}S_{p}f^{2}A^{2}},\quad C_{P}=\frac{\overline{P}}{\unicode[STIX]{x1D70C}S_{p}f^{2}A^{2}\overline{U}}.\end{eqnarray}$$
Here, the power is calculated as the negative inner product of the force vector and velocity vector of each boundary element. The mean thrust and power may also be non-dimensionalized by the dynamic pressure:
 $$\begin{eqnarray}C_{T,dyn}=\frac{\overline{T}}{1/2\unicode[STIX]{x1D70C}S_{p}\overline{U}^{2}},\quad C_{P,dyn}=\frac{\overline{P}}{1/2\unicode[STIX]{x1D70C}S_{p}\overline{U}^{3}}.\end{eqnarray}$$
The two normalizations are related by simple transformations:
 $C_{T,dyn}=C_{T}\,(2\,St^{2})$
and
 $C_{P,dyn}=C_{P}\,(2\,St^{2})$
.
3 Methods
3.1 Numerical methods
To model the forces acting on self-propelled pitching propulsors, we used an unsteady three-dimensional boundary element method. We assume potential flow, that is, irrotational, incompressible and inviscid flow governed by Laplace’s equation. There is a general solution to the governing equation, so the problem is reduced to finding a distribution of doublet and source elements on the propulsor’s surface and wake that satisfy the boundary conditions. An internal Dirichlet boundary condition is imposed in order to enforce the no-flux condition on the surface of the propulsor at each time step. The far-field boundary condition, which is that flow perturbations must decay with distance from the propulsor, is implicitly satisfied by the elementary solutions of the doublet and source elements. The propulsor and wake surface are discretized by a finite number of quadrilateral boundary elements. Each element on the body surface has an associated collocation point located at the element’s centre, just inside the body where the Dirichlet condition is enforced. An explicit Kutta condition is enforced at the trailing edge, and at each time step a wake doublet element is shed with a strength that satisfies Kelvin’s circulation theorem. The wake elements are advected with the local velocity field by applying the desingularized Biot–Savart law (Krasny Reference Krasny1986) leading to wake deformation and roll up. The tangential perturbation velocity over the body is found by a local differentiation of the perturbation potential. The unsteady Bernoulli equation is then used to calculate the pressure field acting on the body. Finally, the self-propelled body dynamics is calculated when the streamwise translational degree of freedom is unconstrained. The body velocity and position are determined at the current time step through forward differencing and the trapezoidal rule, respectively:
 $$\begin{eqnarray}\displaystyle & \displaystyle U_{0}^{n+1}=U_{0}^{n}+\frac{F_{x}^{n}}{M}\unicode[STIX]{x0394}t, & \displaystyle\end{eqnarray}$$
 $$\begin{eqnarray}\displaystyle & \displaystyle x_{b}^{n+1}=x_{b}^{n}+{\textstyle \frac{1}{2}}(U_{0}^{n+1}+U_{0}^{n})\unicode[STIX]{x0394}t, & \displaystyle\end{eqnarray}$$
where
 $F_{x}^{n}$
is the net force acting on the foil in the streamwise direction at the
 $n\text{th}$
time step,
 $x_{b}$
is the body position of the foil and
 $\unicode[STIX]{x0394}t$
is the time step. Validations of the current self-propelled boundary element method can be found in appendix A for time-averaged power and velocity. More details and validations of the three-dimensional unsteady boundary element method can be found in Moored (Reference Moored2018). Further validations and applications of the solver can be found in Quinn et al. (Reference Quinn, Moored, Dewey and Smits2014b
), Fish et al. (Reference Fish, Schreiber, Moored, Liu, Dong and Bart-Smith2016) and Akoz & Moored (Reference Akoz and Moored2018).
3.2 Experimental methods
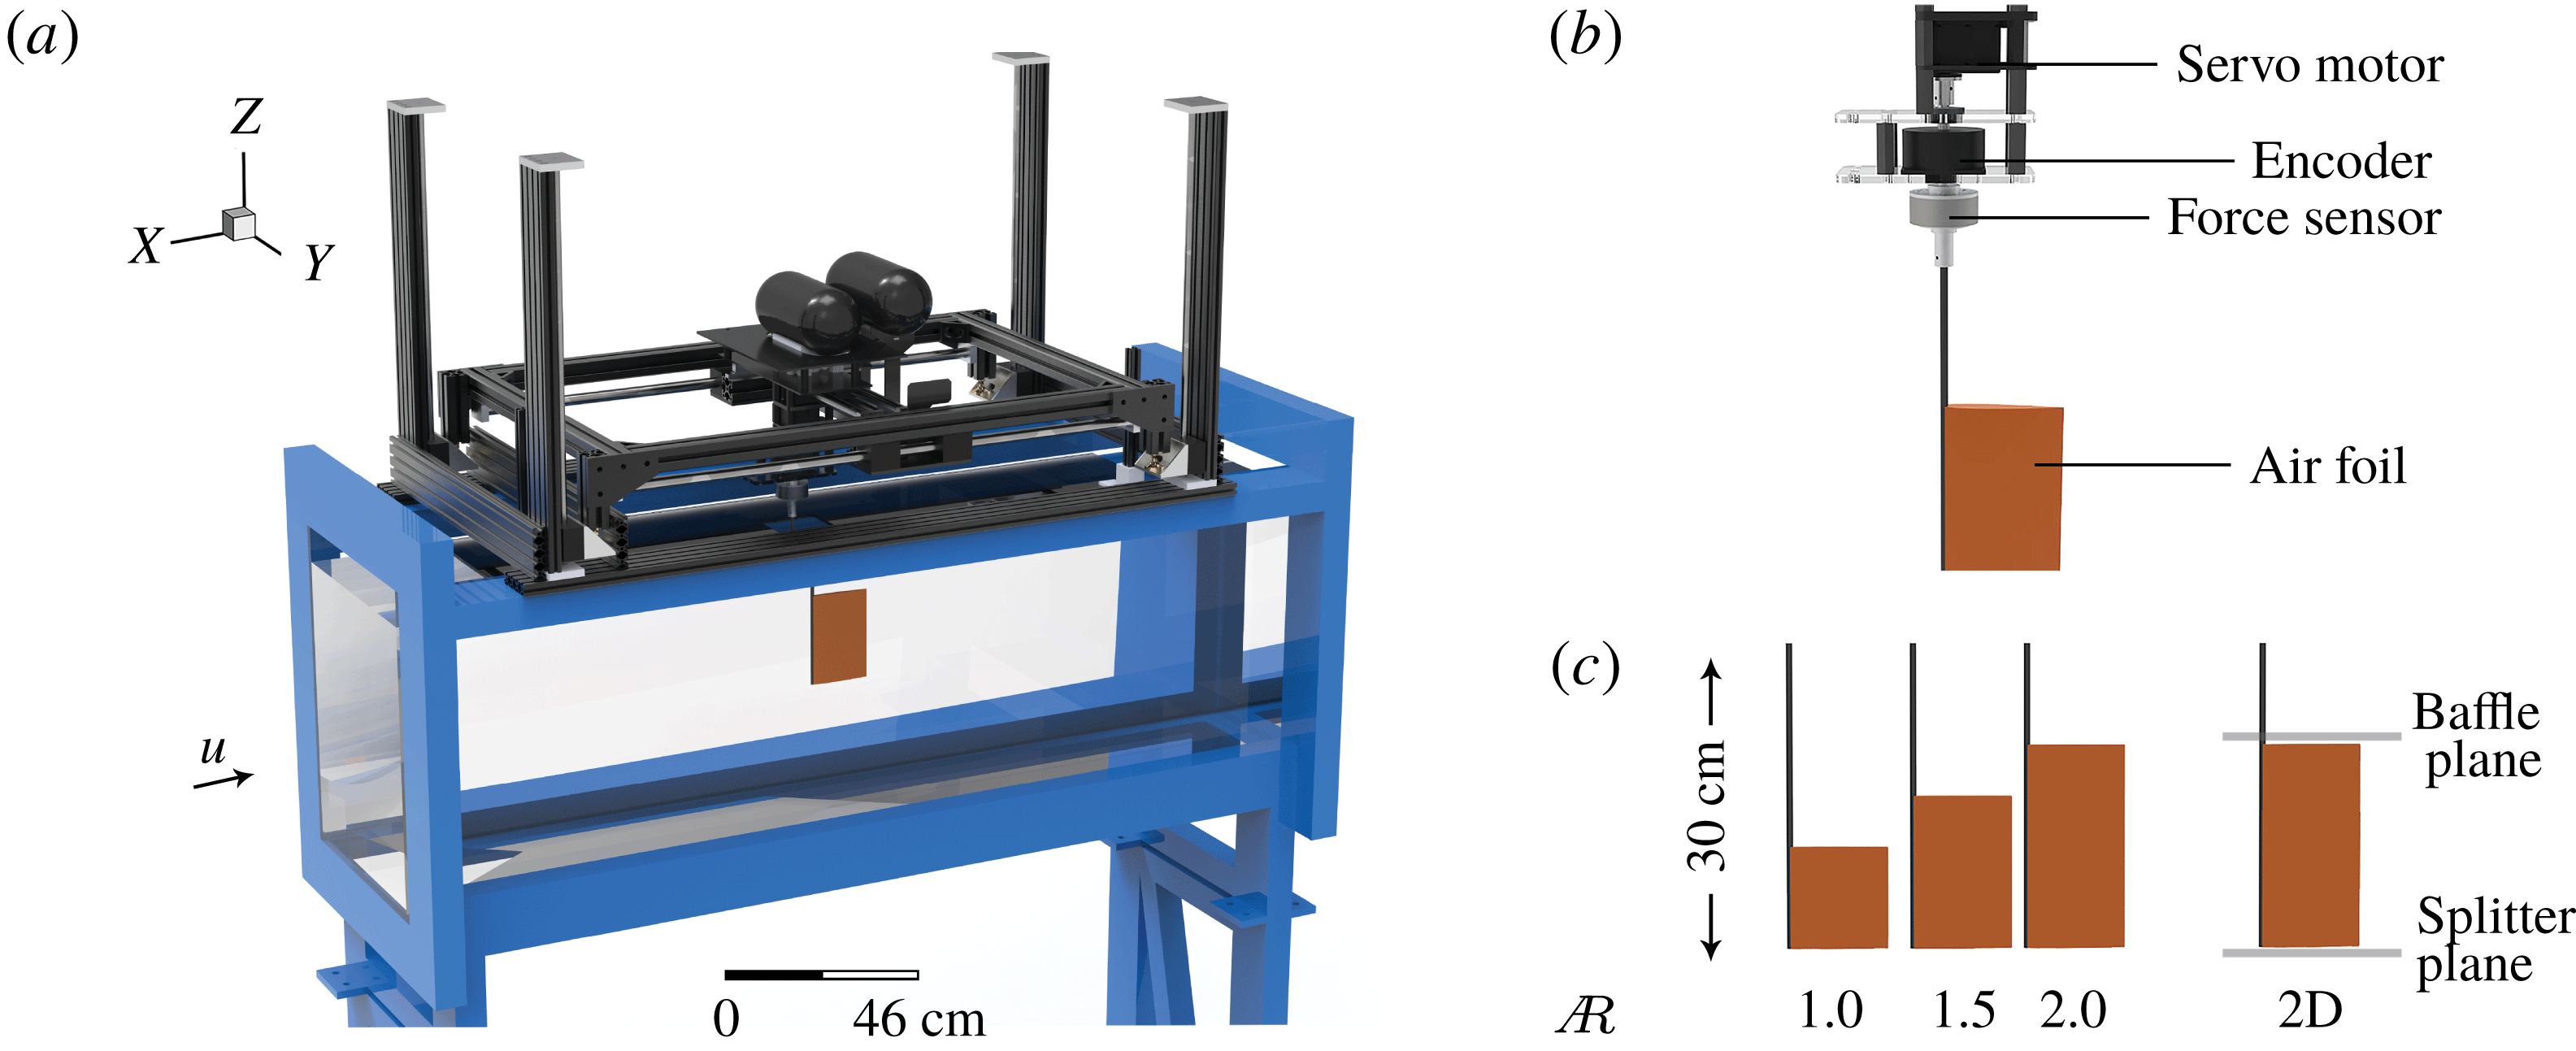
To complement the simulations, we measured the forces on rigid pitching airfoils suspended in a closed-loop water channel (figure 2
a; Rolling Hills 1520; test section: 380 mm wide, 450 mm deep, 1520 mm long). An acrylic baffle was installed at the free surface to minimize surface waves. For all tests, the free-steam speed,
 $U$
, was
 $150~\text{mm}~\text{s}^{-1}$
with fluctuations less than 1.0 %. We tested three NACA 0012 airfoils with the same chord (100 mm) and three different spans: 100, 150 and 200 mm (aspect ratio
 $\def\AR{A\mkern-8muR}\AR =1.0$
, 1.5 or 2.0). The drive rod was made of carbon fibre and the airfoil was 3D-printed (Dimension 1200es) with acrylonitrile–butadiene–styrene. We also used the 200 mm span airfoil to create a two-dimensional control case
 $(\def\AR{A\mkern-8muR}\AR=\infty )$
by installing a horizontal splitter plate at the base of the airfoil (figure 2
a). In the two-dimensional case, the gap between the airfoil tips and the baffle/splitter plate was less than 5 mm. The airfoils were actuated with harmonic pitching motions by a digital servo motor (Dynamixel MX-64). As with the simulations, the pitch angle was prescribed to be
 $\unicode[STIX]{x1D703}=\unicode[STIX]{x1D703}_{0}\sin (2\unicode[STIX]{x03C0}ft)$
. We varied the pitch frequency from 0.25 to 2.0 Hz in increments of 0.25 Hz and the non-dimensional peak-to-peak amplitude from 0.2 to 0.5 in intervals of 0.1.
We extracted the thrust and efficiency of the airfoils over a range of motions using angle and force/torque measurements. We measured pitch angle
 $\unicode[STIX]{x1D703}$
with an absolute encoder (US Digital A2K 4096 CPR0) and forces/torques with a six-axis load cell (ATI MINI 40) – both of which were installed along the drive rod of the airfoil (figure 2
b). The measured pitch angles and forces/torques were synchronized by a custom circuit, then transmitted (ATI Wireless F/T) to a control PC (Omen 870), where they were recorded by a custom LabVIEW script (LabVIEW 2017). For each trial, data were averaged over 20 pitching cycles, with 10 cycles added on either end to provide a warm-up and cool-down period. Each trial was conducted five times. The resolutions of the force/torque sensor were sufficient to resolve differences between the trials: force resolution was
 $\pm 0.01$
N in the lateral (
 $y$
) and streamwise (
 $x$
) directions and
 $\pm 0.02$
N in the vertical (
 $z$
) direction, and torque resolution was
 $\pm 0.25$
N mm about the
 $x$
axis,
 $y$
axis and
 $z$
axis. To measure the force transmitted from the airfoil to the water, we subtracted forces measured in air (channel drained) from forces measured in water (channel filled) for all trials. We transformed the resulting forces from force sensor coordinates into water channel coordinates to get net thrust (
 $T$
) and lift (
 $L$
). Subtracting forces in air produced a small effect that was most pronounced at large frequencies: when
 $f=2$
Hz and
 $\def\AR{A\mkern-8muR}\AR =2$
, the procedure resulted in
 ${\leqslant}7\,\%$
decreases in
 $T$
and
 ${\leqslant}2\,\%$
decreases in
 $L$
. The power transmitted to the fluid by the airfoil is
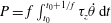 $P=f\int _{t_{0}}^{t_{0}+1/f}\unicode[STIX]{x1D70F}_{z}\dot{\unicode[STIX]{x1D703}}\,\text{d}t$
, where
 $\unicode[STIX]{x1D70F}_{z}$
is
 $z$
-axis torque and
 $\dot{\unicode[STIX]{x1D703}}$
is pitching velocity. Coordinate transformations, phase-averaging and power calculations were performed with Matlab R2018a.
Experimental set-up. (a) The test apparatus was mounted on the top of the water channel. (b) A servo motor actuated the airfoil using a drive rod. (c) Four different aspect ratios (
 $\def\AR{A\mkern-8muR}\AR$
) were tested.

3.3 Propulsor performance
The combination of the computational input parameters (table 1) leads to 270 three-dimensional, self-propelled simulations with a reduced frequency range of
 $0.27\leqslant k\leqslant 1.35$
and a Strouhal number range of
 $0.1\leqslant St\leqslant 0.32$
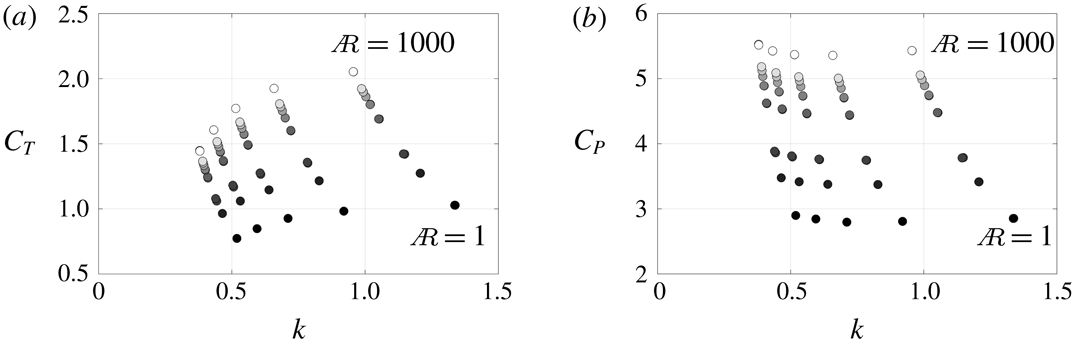
. From these simulations the thrust and power coefficients as defined in (2.6) are calculated. Figure 3 presents the thrust and power coefficients as functions of the reduced frequency for
 $Li=0.15$
. For a fixed aspect ratio, the thrust coefficient increases with the reduced frequency until an asymptotic value is reached at around
 $k=1$
. For a fixed reduced frequency, the thrust increases monotonically with aspect ratio, which has been observed previously (Buchholz & Smits Reference Buchholz and Smits2008; Green & Smits Reference Green and Smits2008). Like the thrust coefficient, the power coefficient generally increases with aspect ratio at a fixed reduced frequency. For a fixed aspect ratio, the power is relatively insensitive to changes in the reduced frequency, though it shows a slight minimum at around
 $k=0.75$
. Additionally, the other Lighthill number cases show the same trends.
Coefficient of (a) thrust and (b) power as a function of reduced frequency from the self-propelled simulations for
 $Li=0.15$
. The marker colours going from black to white indicate the
 $\def\AR{A\mkern-8muR}\AR$
from low to high values, respectively, over the range
 $1\leqslant \def\AR{A\mkern-8muR}\AR\leqslant 1000$
.

It is clear that the thrust and power of pitching wings vary widely with aspect ratio. This variation motivates corrections to the two-dimensional core scaling model developed in Moored & Quinn (Reference Moored and Quinn2018) that account for variations in aspect ratio.
4 Scaling laws
4.1 Previous two-dimensional scaling relations
Moored & Quinn (Reference Moored and Quinn2018) introduced scaling relations for the performance of two-dimensional, self-propelled pitching hydrofoils. They considered both the added mass and circulatory forces from classical linear theory (Garrick Reference Garrick1936) and developed a new scaling model by introducing additional nonlinear terms that are not accounted for in linear theory. For instance, the thrust coefficient defined in (2.6) is proposed to be proportional to the superposition of three terms:
 $$\begin{eqnarray}\left.\begin{array}{@{}rcl@{}}C_{T}\ & =\ & c_{1}+c_{2}\unicode[STIX]{x1D719}_{2}+c_{3}\unicode[STIX]{x1D719}_{3},\\ \text{with:}~\unicode[STIX]{x1D719}_{2}\ & =\ & \displaystyle \left[\frac{3F}{2}+\frac{F}{\unicode[STIX]{x03C0}^{2}k^{2}}-\frac{G}{2\unicode[STIX]{x03C0}k}-(F^{2}+G^{2})\left(\frac{1}{\unicode[STIX]{x03C0}^{2}k^{2}}+\frac{9}{4}\right)\right],\\ \unicode[STIX]{x1D719}_{3}\ & =\ & A^{\ast },\end{array}\right\}\end{eqnarray}$$
where
 $c_{1}$
,
 $c_{2}$
and
 $c_{3}$
are constants, which are determined via regression over the entire numerical dataset by minimizing the squared residuals, and
 $F$
and
 $G$
are the real and imaginary components of Theodorsen’s lift deficiency function, respectively (Theodorsen Reference Theodorsen1935). The first and second terms represented by
 $c_{1}$
and
 $c_{2}\unicode[STIX]{x1D719}_{2}$
are the added mass and circulatory streamwise forces, respectively, from linear theory while the third term represented by
 $c_{3}\unicode[STIX]{x1D719}_{3}$
is not accounted for in linear theory. The third term corresponds to the form drag induced by the effects of vortex shedding at the trailing edge and it is proportional to the time-varying projected frontal area that occurs during large-amplitude pitching oscillations.
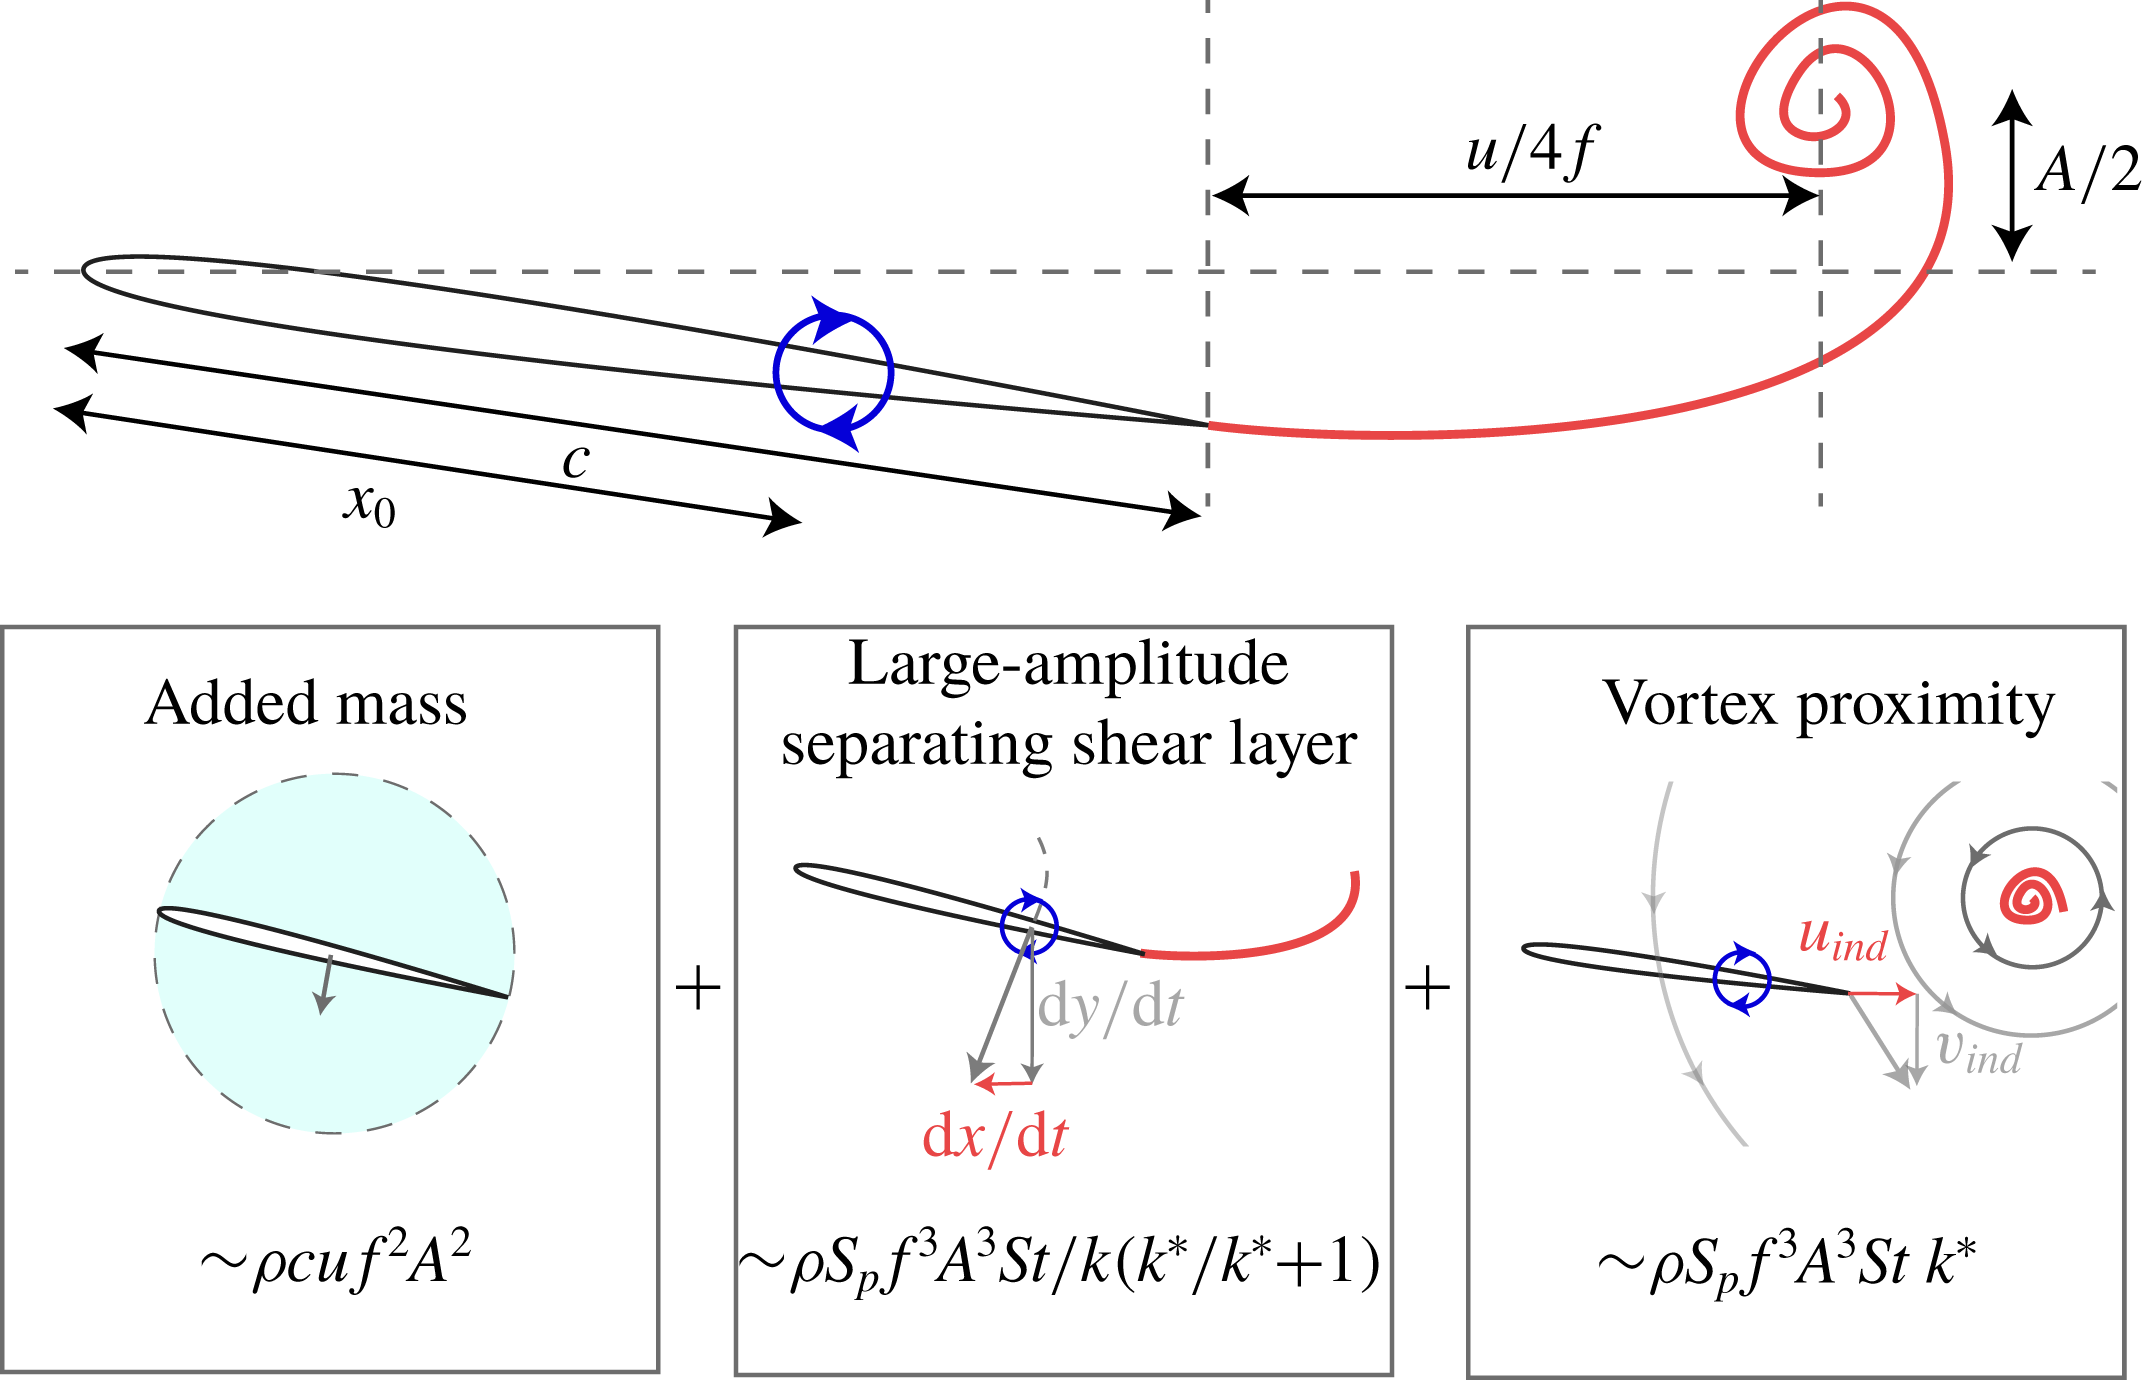
Schematic showing the components of the two-dimensional power scaling relation developed in Moored & Quinn (Reference Moored and Quinn2018).

Moored & Quinn (Reference Moored and Quinn2018) also proposed that the power coefficient defined in (2.6) is a linear combination of three power terms denoted graphically in figure 4 and mathematically as
 $$\begin{eqnarray}\left.\begin{array}{@{}rcl@{}}C_{P}\ & =\ & c_{4}+c_{5}\unicode[STIX]{x1D719}_{5}+c_{6}\unicode[STIX]{x1D719}_{6},\\ \text{with:}~\unicode[STIX]{x1D719}_{5}\ & =\ & \displaystyle \frac{St^{2}}{k}\left(\frac{k^{\ast }}{k^{\ast }+1}\right),\\ \unicode[STIX]{x1D719}_{6}\ & =\ & St^{2}k^{\ast },\end{array}\right\}\end{eqnarray}$$
where
 $c_{4}$
,
 $c_{5}$
and
 $c_{6}$
are arbitrary constants and
 $k^{\ast }=k/(1+4\,St^{2})$
. The first term (
 $c_{4}$
) is the added mass power from linear theory. The second term (
 $c_{5}\unicode[STIX]{x1D719}_{5}$
) is a power term that is not present in linear theory and develops from the
 $x$
-component of velocity of a pitching propulsor, which is neglected in linear theory due to a small-amplitude assumption. For large-amplitude motions this velocity does not disappear, leading to an additional velocity component on the bound vorticity of the propulsor and creating an additional contribution to the generalized Kutta–Joukowski force also known as the vortex force (Saffman Reference Saffman1992). The third term (
 $c_{6}\unicode[STIX]{x1D719}_{6}$
) is also a power term that is absent in linear theory and develops during large-amplitude motions when the trailing-edge vortices are no longer planar as assumed in the theory. As a result, the proximity of the trailing-edge vortices induces a streamwise velocity over the foil and an additional contribution to the vortex force. In short, the second and third terms are described as the large-amplitude separating shear layer and vortex proximity power terms, respectively, and both terms are circulatory in nature. For more details of the development of the two-dimensional scaling relations, see Moored & Quinn (Reference Moored and Quinn2018).
4.2 Three-dimensional scaling laws
To scale the thrust and power of unsteady three-dimensional pitching propulsors, we hypothesize that the two-dimensional core scaling model will need to be modified in three ways: (1) the added mass forces must account for the added mass of a finite-span wing, (2) the circulatory forces must account for the downwash/upwash effects from the tip vortex system of the propulsor and (3) the nonlinear wake terms must account for the elliptical topology of shedding trailing-edge vortices when calculating their induced velocity. Here, we consider these modifications to extend the scaling relations to three-dimensional flows with propulsors of varying aspect ratio.
4.2.1 Added mass and circulatory modifications
In general, the added mass of an oscillating propulsor is the product of the fluid density, the planform area and a characteristic length scale of the projected area, which is commonly the chord length for two-dimensional foils. On the other hand, a characteristic added mass for arbitrary three-dimensional bodies needs to be defined by two principal dimensions in the projected area. For a rectangular propulsor, these principal dimensions are the span,
 $s$
, and chord,
 $c$
, of the propulsor and an empirical approximation of the added mass can be written as
 $M_{add}^{3D}\propto \unicode[STIX]{x1D70C}s^{2}c^{2}/(s+c)$
(Brennen Reference Brennen1982). This can be rearranged in terms of the aspect ratio noting that
 $\def\AR{A\mkern-8muR}\AR =s/c$
for a rectangular wing and
 $M_{add}^{2D}\propto \unicode[STIX]{x1D70C}sc^{2}$
such that
 $M_{add}^{3D}\propto M_{add}^{2D}\,[\def\AR{A\mkern-8muR}\AR/(\def\AR{A\mkern-8muR}\AR+1)]$
. The added mass thrust and power are both proportional to the added mass of the propulsor, so we expect them to scale with the same aspect ratio modification as the added mass itself.
A finite-span pitching wing will shed a series of vortex rings into its wake (Buchholz & Smits Reference Buchholz and Smits2008; Green & Smits Reference Green and Smits2008; King, Kumar & Green Reference King, Kumar and Green2018), which will lead to time-varying upwash and downwash over the wing due to trailing-edge and tip vortices. Classical unsteady linear theory (Garrick Reference Garrick1936) does not account for the upwash or downwash from the tip vortices, but Prandtl’s finite wing theory does, at least in steady flows (Prandtl Reference Prandtl1920). We hypothesize that tip vortices would also modify the effective angle of attack of an unsteady pitching wing, and therefore that Prandtl’s finite wing theory could offer a modification for the unsteady circulatory forces. Following finite wing theory for elliptical wings, the three-dimensional lift coefficient,
 $C_{L}^{3D}$
, and consequently the circulatory power, should be proportional to
 $C_{L}^{3D}\propto C_{L}^{2D}[\def\AR{A\mkern-8muR}\AR/(\def\AR{A\mkern-8muR}\AR+2)]$
, where
 $C_{L}^{2D}$
is the lift coefficient from a two-dimensional foil. Since the circulatory thrust forces of a pitching wing are the projection of this lift force in the streamwise direction, we also expect the circulatory thrust forces to scale as
 $C_{T}^{3D}\propto C_{T}^{2D}[\def\AR{A\mkern-8muR}\AR/(\def\AR{A\mkern-8muR}\AR+2)]$
. Given that an unsteady propulsor sheds tip vortices of alternating sign, one might expect that the circulatory correction would be dependent upon the reduced frequency; however, it was determined that a steady-flow scaling was sufficient as shown in § 5.
4.2.2 Modification of two-dimensional scaling laws
These classical corrections from aerodynamic and hydrodynamic theory can be applied to the circulatory and added mass terms of the two-dimensional core scaling model as follows:
 $$\begin{eqnarray}\displaystyle & \displaystyle C_{T}=c_{1}\left(\frac{\def\AR{A\mkern-8muR}\AR}{\def\AR{A\mkern-8muR}\AR+1}\right)+c_{2}\unicode[STIX]{x1D719}_{2}\left(\frac{\def\AR{A\mkern-8muR}\AR}{\def\AR{A\mkern-8muR}\AR+2}\right)+c_{3}\unicode[STIX]{x1D719}_{3}, & \displaystyle\end{eqnarray}$$
 $$\begin{eqnarray}\displaystyle & \displaystyle C_{P}=c_{4}\left(\frac{\def\AR{A\mkern-8muR}\AR}{\def\AR{A\mkern-8muR}\AR+1}\right)+c_{5}\unicode[STIX]{x1D719}_{5}\left(\frac{\def\AR{A\mkern-8muR}\AR}{\def\AR{A\mkern-8muR}\AR+2}\right)+c_{6}\unicode[STIX]{x1D719}_{6}\left(\frac{\def\AR{A\mkern-8muR}\AR}{\def\AR{A\mkern-8muR}\AR+2}\right). & \displaystyle\end{eqnarray}$$
Here, the
 $c_{1}$
and
 $c_{4}$
terms represent added mass forces, so they were modified with the added mass correction (
 $[\def\AR{A\mkern-8muR}\AR/(\def\AR{A\mkern-8muR}\AR+1)]$
). In contrast, the
 $c_{2}$
,
 $c_{5}$
and
 $c_{6}$
terms represent circulatory forces, so they were modified with the circulatory correction (
 $[\def\AR{A\mkern-8muR}\AR/(\def\AR{A\mkern-8muR}\AR+2)]$
). The
 $c_{3}$
term represents form drag and is therefore unmodified; it represents neither circulatory nor added mass forces. Dividing by the added mass correction reveals a more compact form of the three-dimensional scaling:
 $$\begin{eqnarray}\left.\begin{array}{@{}rcl@{}}C_{T}^{\ast }\ & =\ & c_{1}+c_{2}\unicode[STIX]{x1D719}_{2}^{\ast }+c_{3}\unicode[STIX]{x1D719}_{3}^{\ast },\\ \text{where:}~C_{T}^{\ast }\ & =\ & \displaystyle C_{T}\left(\frac{\def\AR{A\mkern-8muR}\AR+1}{\def\AR{A\mkern-8muR}\AR}\right),\quad \unicode[STIX]{x1D719}_{2}^{\ast }=\unicode[STIX]{x1D719}_{2}\left(\frac{\def\AR{A\mkern-8muR}\AR+1}{\def\AR{A\mkern-8muR}\AR+2}\right),\quad \unicode[STIX]{x1D719}_{3}^{\ast }=\unicode[STIX]{x1D719}_{3}\left(\frac{\def\AR{A\mkern-8muR}\AR+1}{\def\AR{A\mkern-8muR}\AR}\right)\!;\end{array}\right\}\quad\end{eqnarray}$$
 $$\begin{eqnarray}\left.\begin{array}{@{}rcl@{}}C_{P}^{\ast }\ & =\ & c_{4}+c_{5}\unicode[STIX]{x1D719}_{5}^{\prime }+c_{6}\unicode[STIX]{x1D719}_{6}^{\prime },\\ \text{where:}~C_{P}^{\ast }\ & =\ & \displaystyle C_{P}\left(\frac{\def\AR{A\mkern-8muR}\AR+1}{\def\AR{A\mkern-8muR}\AR}\right),\quad \unicode[STIX]{x1D719}_{5}^{\prime }=\unicode[STIX]{x1D719}_{5}\left(\frac{\def\AR{A\mkern-8muR}\AR+1}{\def\AR{A\mkern-8muR}\AR+2}\right),\quad \unicode[STIX]{x1D719}_{6}^{\prime }=\unicode[STIX]{x1D719}_{6}\left(\frac{\def\AR{A\mkern-8muR}\AR+1}{\def\AR{A\mkern-8muR}\AR+2}\right)\!.\end{array}\right\}\quad\end{eqnarray}$$
The adjusted scalings now model the three-dimensional propulsor added mass and the downwash and upwash imposed by the wake, but they do not factor in the topology of the shedding vortex system. To account for this three-dimensionality, we propose a further refinement based on the known elliptical shape of vortex rings in the wake, which we introduce in the next section.
4.2.3 Elliptical vortex ring modifications
The
 $c_{5}$
and
 $c_{6}$
terms in the power scaling relation can be further modified to fully account for three-dimensionality. Referring to the development of these terms in Moored & Quinn (Reference Moored and Quinn2018), they rely on balancing the cross-stream component of the velocity induced at the trailing edge by a shedding trailing-edge vortex and the cross-stream component of the velocity induced by the bound vortex with circulation
 $\unicode[STIX]{x1D6E4}_{b}$
. This enforces the Kutta condition at the trailing edge and determines a scaling for the additional bound circulation,
 $\unicode[STIX]{x1D6E4}_{1}=\unicode[STIX]{x1D6E4}_{b}-\unicode[STIX]{x1D6E4}_{0}$
, where
 $\unicode[STIX]{x1D6E4}_{0}$
is the bound circulation from the quasi-steady motion of the wing alone, while the additional bound circulation is the bound circulation induced by the influence of the wake. Moreover, the additional bound circulation is important to the scaling of both the
 $c_{5}$
and
 $c_{6}$
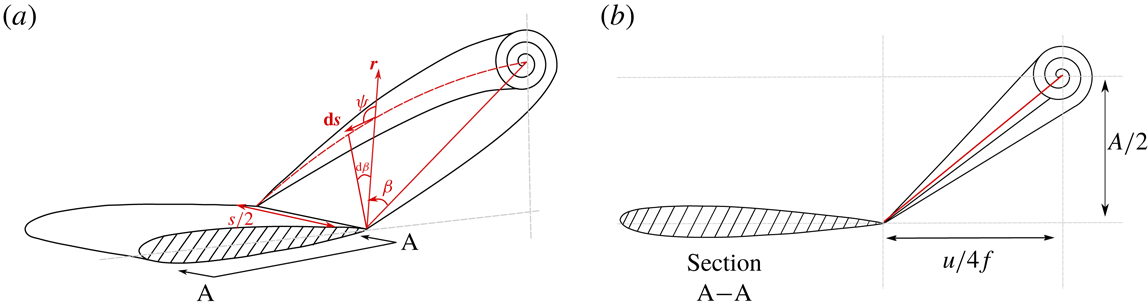
terms. The two-dimensional scaling model assumes that the shedding trailing-edge vortex is two-dimensional, that is, it is a line vortex that extends to infinity. In a three-dimensional flow, the shedding vortex is essentially half of a full vortex ring and is elliptical in shape (figure 5), where the major axis of the ellipse is the span length of the propulsor. The elliptical topology of shedding trailing-edge vortices has been observed in experimental (Von Ellenrieder, Parker & Soria Reference Von Ellenrieder, Parker and Soria2003; Buchholz & Smits Reference Buchholz and Smits2006) and numerical (Zhu et al.
Reference Zhu, Wolfgang, Yue and Triantafyllou2002; Blondeaux et al.
Reference Blondeaux, Fornarelli, Guglielmini, Triantafyllou and Verzicco2005; Dong, Mittal & Najjar Reference Dong, Mittal and Najjar2006) studies of oscillating finite-span wings and hydrofoils as well as in biological studies (Drucker & Lauder Reference Drucker and Lauder1999). This difference in the topology of the shedding trailing-edge vortex between two and three dimensions alters the magnitude of the induced velocity at the trailing edge.
Sectional cut A–A is at the symmetry plane of the wing. (a) Cross-sectional view of elliptical vortex ring shedding behind a rectangular propulsor. (b) Side view of elliptical vortex ring that shows the distance from the vortex core to the trailing edge at the midspan of the propulsor.

By calculating the velocity induced at the trailing edge of the propulsor midspan by the shedding half-ellipse trailing-edge vortex (see appendix A for details), a new scaling relation for the additional bound circulation is
 $$\begin{eqnarray}\unicode[STIX]{x1D6E4}_{1}\propto c^{2}\dot{\unicode[STIX]{x1D703}}\left(\frac{\unicode[STIX]{x1D6FE}k^{\ast }}{1+\unicode[STIX]{x1D6FE}k^{\ast }}\right),\quad \text{where:}~\unicode[STIX]{x1D6FE}=\frac{1}{2}\left[E(m_{2})+\frac{E(m_{1})}{\def\AR{A\mkern-8muR}\AR\sqrt{4kk^{\ast }}}\right].\end{eqnarray}$$
Here,
 $m_{1}$
and
 $m_{2}$
are elliptic moduli where
 $m_{1}=\sqrt{1-4\def\AR{A\mkern-8muR}\AR^{2}kk^{\ast }}$
and
 $m_{2}=\sqrt{1-1/(4\def\AR{A\mkern-8muR}\AR^{2}kk^{\ast })}$
,
 $E$
is the complete elliptic integral of the second kind and
 $\dot{\unicode[STIX]{x1D703}}$
is the pitching rate of the propulsor. Additionally, the vortex proximity term not only uses the additional bound circulation, but also the streamwise component of the velocity induced at the trailing edge by a shedding trailing-edge vortex. For a shedding half-ellipse vortex, this induced velocity scales as
 $u_{ind}\propto c^{2}\dot{\unicode[STIX]{x1D703}}fSt\unicode[STIX]{x1D6FE}/[U(1+4\,St^{2})]$
. Consequently, the modified power scaling for the separating shear layer term,
 $c_{5}\unicode[STIX]{x1D719}_{5}^{\ast }$
, and the vortex proximity term,
 $c_{6}\unicode[STIX]{x1D719}_{6}^{\ast }$
, will be
 $$\begin{eqnarray}\unicode[STIX]{x1D719}_{5}^{\ast }=\frac{St^{2}}{k}\left(\frac{\unicode[STIX]{x1D6FE}k^{\ast }}{1+\unicode[STIX]{x1D6FE}k^{\ast }}\right)\left(\frac{\def\AR{A\mkern-8muR}\AR +1}{\def\AR{A\mkern-8muR}\AR +2}\right)\quad \text{and}\quad \unicode[STIX]{x1D719}_{6}^{\ast }=St^{2}k^{\ast }\unicode[STIX]{x1D6FE}\left(\frac{\def\AR{A\mkern-8muR}\AR +1}{\def\AR{A\mkern-8muR}\AR +2}\right).\end{eqnarray}$$
Now, the full three-dimensional power scaling relation becomes
 $$\begin{eqnarray}C_{P}^{\ast }=c_{4}+c_{5}\unicode[STIX]{x1D719}_{5}^{\ast }+c_{6}\unicode[STIX]{x1D719}_{6}^{\ast }\end{eqnarray}$$
in its compact form.
The scaling relations can also be written in terms of the thrust and power coefficients normalized by dynamic pressure as
 $$\begin{eqnarray}\displaystyle & C_{T,dyn}^{\ast }=(c_{1}+c_{2}\unicode[STIX]{x1D719}_{2}^{\ast }+c_{3}\unicode[STIX]{x1D719}_{3}^{\ast })2\,St^{2}, & \displaystyle\end{eqnarray}$$
 $$\begin{eqnarray}\displaystyle & C_{P,dyn}^{\ast }=(c_{4}+c_{5}\unicode[STIX]{x1D719}_{5}^{\ast }+c_{6}\unicode[STIX]{x1D719}_{6}^{\ast })2\,St^{2}, & \displaystyle\end{eqnarray}$$
where
 $C_{T,dyn}^{\ast }=C_{T,dyn}[(\def\AR{A\mkern-8muR}\AR+1)/\def\AR{A\mkern-8muR}\AR]$
and
 $C_{P,dyn}^{\ast }=C_{P,dyn}[(\def\AR{A\mkern-8muR}\AR+1)/\def\AR{A\mkern-8muR}\AR]$
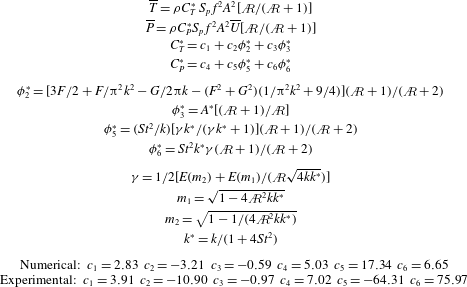
. Note that the three-dimensional modifications applied to the two-dimensional core scaling model did not introduce any new terms. A summary of the scaling relations is provided in table 2.
Summary of scaling relations with coefficients that are numerically and experimentally determined.
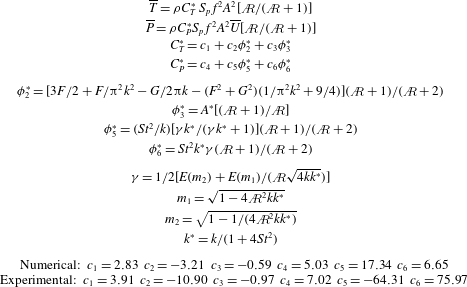
5 Validation of three-dimensional scaling relations
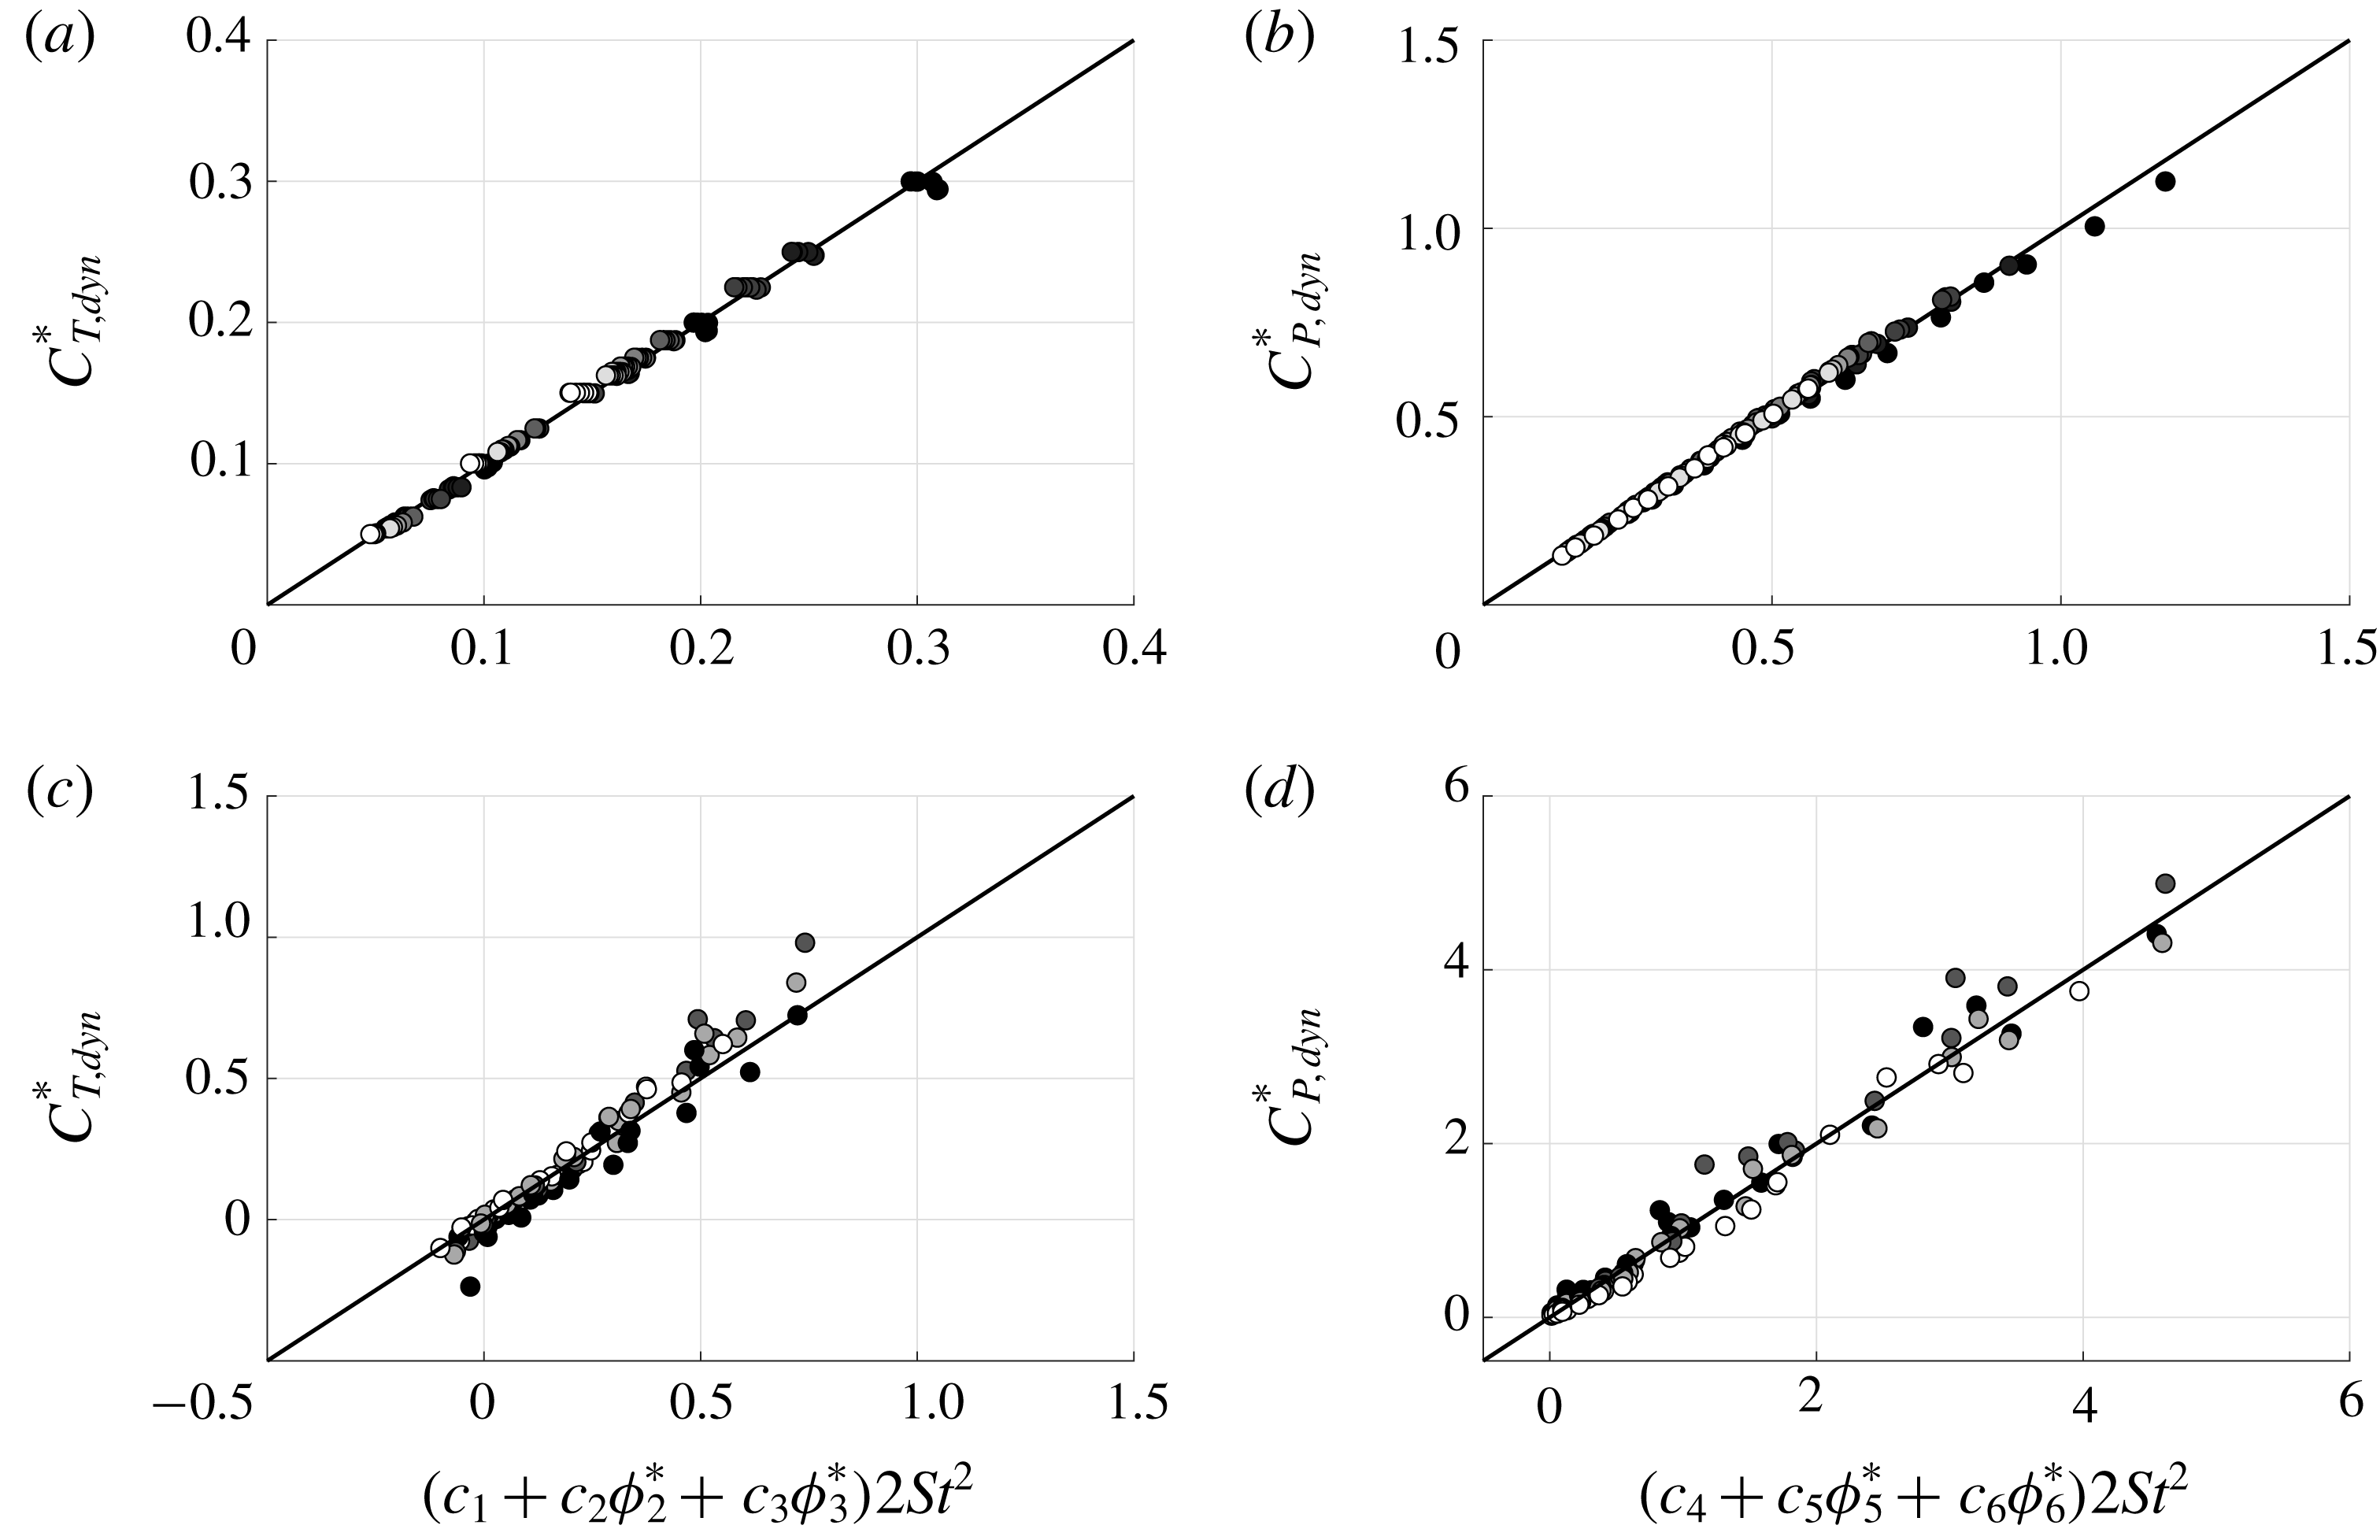
Figure 6 presents numerical and experimental data for the modified dynamic pressure-based thrust and power coefficients. Both coefficients are graphed against the scaling relations proposed in (4.10) and (4.11). Note that the experimental measurements are acquired at fixed-velocity conditions and they have a reduced frequency range of
 $0.16\leqslant k\leqslant 1.33$
and a Strouhal number range of
 $0.03\leqslant St\leqslant 0.45$
. When either the numerical or experimental data are graphed against the scaling relations, the data can be seen to collapse well to a line of slope one for both the thrust and power. In fact, the numerical data are within
 $\pm 5\,\%$
of the scaling predictions while the experimental data are within
 $\pm 24\,\%$
of the scaling predictions based on their deviation from the reference lines. For comparison, the previous two-dimensional numerical data (Moored & Quinn Reference Moored and Quinn2018) had a broader range of variables and predicted the thrust and power to within
 $\pm 6.5\,\%$
and
 $\pm 5.6\,\%$
for their full-scale thrust and power, respectively, which is quite similar to the current study. As expected the experimental data collapse is not as good as the numerical collapse, presumably due to viscous effects that are not accounted for in the numerical solutions nor the scaling relations. Regardless, the collapse of the data to a line of slope one confirms that the newly proposed three-dimensional scaling relations capture the dominant flow physics for self-propelled or fixed-velocity pitching wings across a wide range of
 $k$
,
 $St$
and
 $\def\AR{A\mkern-8muR}\AR$
. Moreover, an alternative geometric approach to assessing the collapse of data to three-dimensional planes can be used to show that the collapse of data is independent of the values of the constants
 $c_{1}$
–
 $c_{6}$
(see appendix C). However, the coefficients are necessary to produce a predictive scaling model, and they are determined via regression by minimizing the squared residuals over the numerical or experimental data. In fact, each dataset has different coefficients that best fit the data (table 2). This suggests that the coefficients depend on Reynolds number, which differs between the experiments (
 $Re=30\,000$
) and the simulations (
 $Re$
effectively infinite). Moreover, the
 $c_{5}$
coefficient switches sign in the experimental data, meaning it represents power extraction, whereas the other coefficients represent power consumption. This is likely due to a viscosity-driven phase shift between the lift term scaled by
 $c_{5}$
and the velocity of the hydrofoil that is not captured in the inviscid numerics. In contrast, the added mass thrust and power terms are positive in both experiments and simulations, as expected based on physical grounds.
Dynamic pressure-based thrust and power coefficients plotted as functions of their proposed scaling relations. (a,b) Numerical data with the coefficients
 $c_{1}=2.83$
,
 $c_{2}=-3.214$
,
 $c_{3}=-0.5904$
,
 $c_{4}=5.033$
,
 $c_{5}=17.34$
and
 $c_{6}=6.645$
. (c,d) Experimental data with the coefficients
 $c_{1}=3.908$
,
 $c_{2}=-10.9$
,
 $c_{3}=-0.9746$
,
 $c_{4}=7.024$
,
 $c_{5}=-64.31$
and
 $c_{6}=75.97$
.

We can determine the importance of each scaling modification by considering their effects in isolation. If only the three-dimensional added mass correction is used in the scaling relations, the numerical data are within
 $\pm 40\,\%$
and
 $\pm 25\,\%$
of the thrust and power predictions, respectively, while the experimental data are within
 $\pm 50\,\%$
and
 $\pm 45\,\%$
of the thrust and power predictions, respectively. If the added mass and circulatory corrections are used, the numerical data are within
 $\pm 5\,\%$
and
 $\pm 15\,\%$
for the thrust and power predictions, respectively, while the experimental data are within
 $\pm 35\,\%$
of both scaling predictions. Finally, when all three corrections are used, then the best agreement is recovered where the numerical data are within
 $\pm 5\,\%$
of both predictions while the experimental data are within
 $\pm 24\,\%$
of both predictions, as stated previously. This deeper analysis shows that by applying only the added mass and circulatory corrections, a majority of the relevant flow physics can be captured, but further refinement is possible by considering the elliptical topology of the shedding trailing-edge vortices.
6 Model limitations
The current study presents an extension to the two-dimensional scaling laws presented in Moored & Quinn (Reference Moored and Quinn2018) by accounting for variations in the aspect ratio of propulsors. The developed model is unsteady in nature in that it accounts for added mass and wake-induced effects. The model is comprised of terms from classical linear theory, terms introduced to account for the nonlinearities of large-amplitude motions and deforming wakes and, importantly, circulatory and added mass corrections to account for upwash/downwash, changes in added mass with aspect ratio and the elliptical topology of shedding vortices. The scaling laws have shown good collapse for a wide range of parameters. The pitching amplitude is varied in the range
 $5.7^{\circ }\leqslant \unicode[STIX]{x1D703}_{0}\leqslant 17.5^{\circ }$
, which is beyond the limits of small-amplitude motion. In previous work the two-dimensional version of the scaling laws was shown to collapse data for pitch amplitudes up to
 $22^{\circ }$
(Moored & Quinn Reference Moored and Quinn2018). Even though the linear theory terms are formulated for small angles, the nonlinear terms are not, and it is expected that the scaling laws will be valid until large pitch angles as long as leading-edge separation is minimal. However, ongoing work suggests that leading-edge separation may be accounted for in the form of a drag term since it is developed from the low pressure of the shedding vortex street acting on the projected frontal area of the foil. In the current study the reduced frequency varies in the range
 $0.16\leqslant k\leqslant 1.33$
, the Strouhal number in the range
 $0.03\leqslant St\leqslant 0.45$
and the aspect ratio in the range
 $1\leqslant \def\AR{A\mkern-8muR}\AR\leqslant 1000$
, covering a wide range of the typical values for biological propulsion. Currently, the three-dimensional scaling laws do not account for combined heaving and pitching motions, planform and cross-section shape variations besides changes in the aspect ratio, flexibility, intermittent motions or changes in the pitching axis. However, all of these limitations in the scaling laws are currently being addressed.
7 Conclusion
In this work novel scaling laws of the thrust production and power consumption of pitching bio-propulsors are developed by extending the two-dimensional core scaling model presented in Moored & Quinn (Reference Moored and Quinn2018) to account for three-dimensionality in the form of aspect ratio variations. This is accomplished by considering the added mass of a finite-span propulsor, the upwash/downwash effects on a propulsor from its trailing vortex system and the influence of elliptical vortex rings shed at the trailing edge. Both self-propelled numerical simulations and fixed-velocity experimental measurements confirm that the proposed scalings can be used to predict thrust and power. The established scaling relationships elucidate the dominant flow physics behind the force production and energetics of pitching bio-propulsors and can be used to accelerate the design of bio-inspired devices.
Acknowledgements
This work was supported by the Office of Naval Research under Program Director Dr R. Brizzolara on MURI grant no. N00014-08-1-0642 and BAA grant number N00014-18-1-2537, as well as by the National Science Foundation under Program Director Dr R. Joslin in Fluid Dynamics within CBET on NSF award no. 1653181.
Appendix A. Validation
A.1 Numerical validation
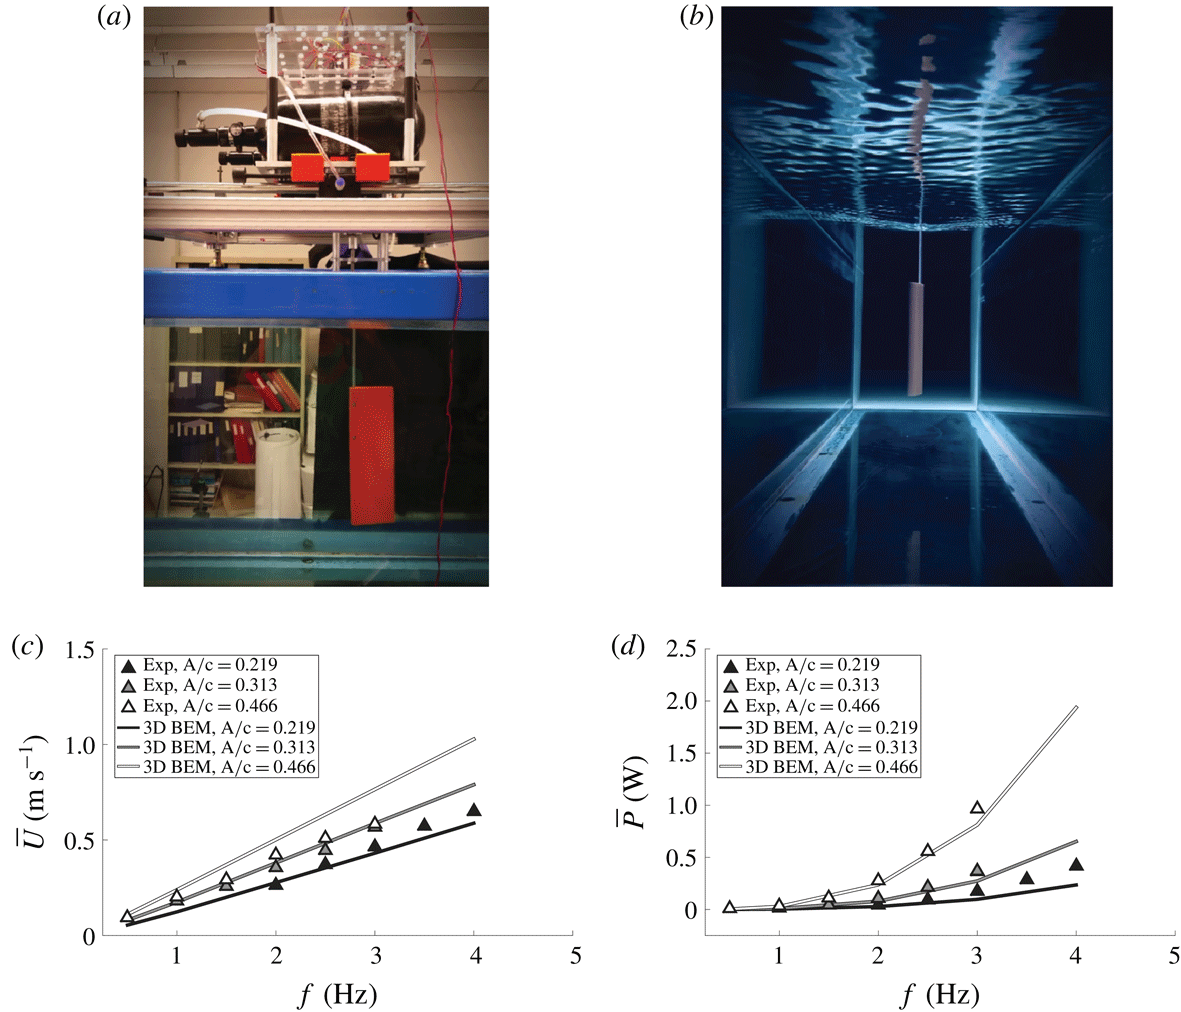
In order to validate the accuracy of the self-propelled boundary element method simulations, self-propelled experiments were performed in the same closed-loop water channel as the fixed-velocity experiments (figure 2
a; Rolling Hills 1520; test section: 380 mm wide, 450 mm deep, 1520 mm long). Figure 7(a,b) shows the experimental apparatus, which consists of a NACA 0012 rectangular wing with an aspect ratio of two submerged in the centre of the tunnel and pitched sinusoidally about its leading edge by a digital servo motor (Dynamixel MX-64). The experiments were performed over a range of frequencies
 $0.5\leqslant f\leqslant 4$
Hz and with three non-dimensional amplitudes of
 $A^{\ast }=0.219$
, 0.313 and 0.466. The wing and actuation mechanism are mounted onto frictionless air bushings (Newway air bearings) that float on
 $0.75^{\prime \prime }$
stainless steel rails oriented in the streamwise direction. The velocity of the water tunnel is tuned until the wing is neither moving upstream nor downstream over several flapping cycles. The tunnel velocity then represents the self-propelled swimming speed for a given set of kinematic parameters. The pitching moment and the time-varying pitch angle were measured directly from the internal voltage and current sensors (used with a calibration curve to determine torque) as well as the position sensors of the Dynamixel MX-64 servo motor.
(a,b) Self-propelled experimental apparatus. Time-averaged (c) swimming speed and (d) power as functions of pitching frequency. Numerical boundary element method solutions are denoted with solid lines while experimental measurements are denoted by triangle markers. The line and marker colour, changing from black to white, corresponds to different amplitudes of motion going from the lowest to highest values, respectively.

Numerically, a rectangular wing of
 $\def\AR{A\mkern-8muR}\AR =2$
with a NACA 0012 profile and pitching about its leading edge was simulated in self-propelled swimming as described in § 3. One difference between this validation and the simulations for the main portion of the current study is that a boundary layer solver is used to calculate the drag on the wing instead of an imposed drag force from a virtual body. The viscous boundary layer solver uses the outer potential flow to calculate the skin friction drag using a von Kármán momentum integral approach. The coupled boundary layer solver is extensively detailed and validated in previous work (Moored Reference Moored2018). The drag associated with an actuating rod is estimated by using the drag coefficient–Reynolds number relationship for cylinders in uniform flow to impose an additional drag force beyond the skin friction of the wing in the simulations (Munson, Young & Okiishi Reference Munson, Young and Okiishi1990). The top and the bottom surfaces of the propulsor are discretized into 20 spanwise and 40 chordwise elements for a total of 3200 body elements. The computation is discretized into 50 time steps per oscillation cycle and run for a total of 20 cycles. All of the doublet wake elements are lumped into a set of elements once they have advected far enough downstream to change the forces by less than 1 % in order to restrict the growth of the problem size in time.
Figure 7(c,d) presents the time-averaged swimming speed and power as functions of the frequency. The colours of the lines and markers represent the amplitude of motion with the smallest to the largest amplitudes mapped from black to white, respectively. The solid lines represent the numerical solutions, while the triangle markers represent the experiments. As the frequency of motion increases, the swimming speed and power consumption both increase as expected. The simulations show excellent agreement with the experiments for the self-propelled swimming speed using the two lowest amplitudes. At the highest amplitude of motion the simulations modestly overpredict the swimming speed. This discrepancy is likely occurring due to leading-edge separation in the experiments, which is not modelled in the simulations and is well known to occur for high pitch amplitudes (Das, Shukla & Govardhan Reference Das, Shukla and Govardhan2016). The simulations show excellent agreement with the experiments for the power consumption over all of the amplitudes examined. The simulations only slightly underpredict the power at the highest frequencies. Overall, the experiments act as a further validation of the boundary element method simulations presented in this work.
A.2 Experimental validation
We validated the accuracy of our set-up by comparing our force/torque data to data from a previous study in a similarly sized closed-loop water channel at Princeton University (Floryan et al.
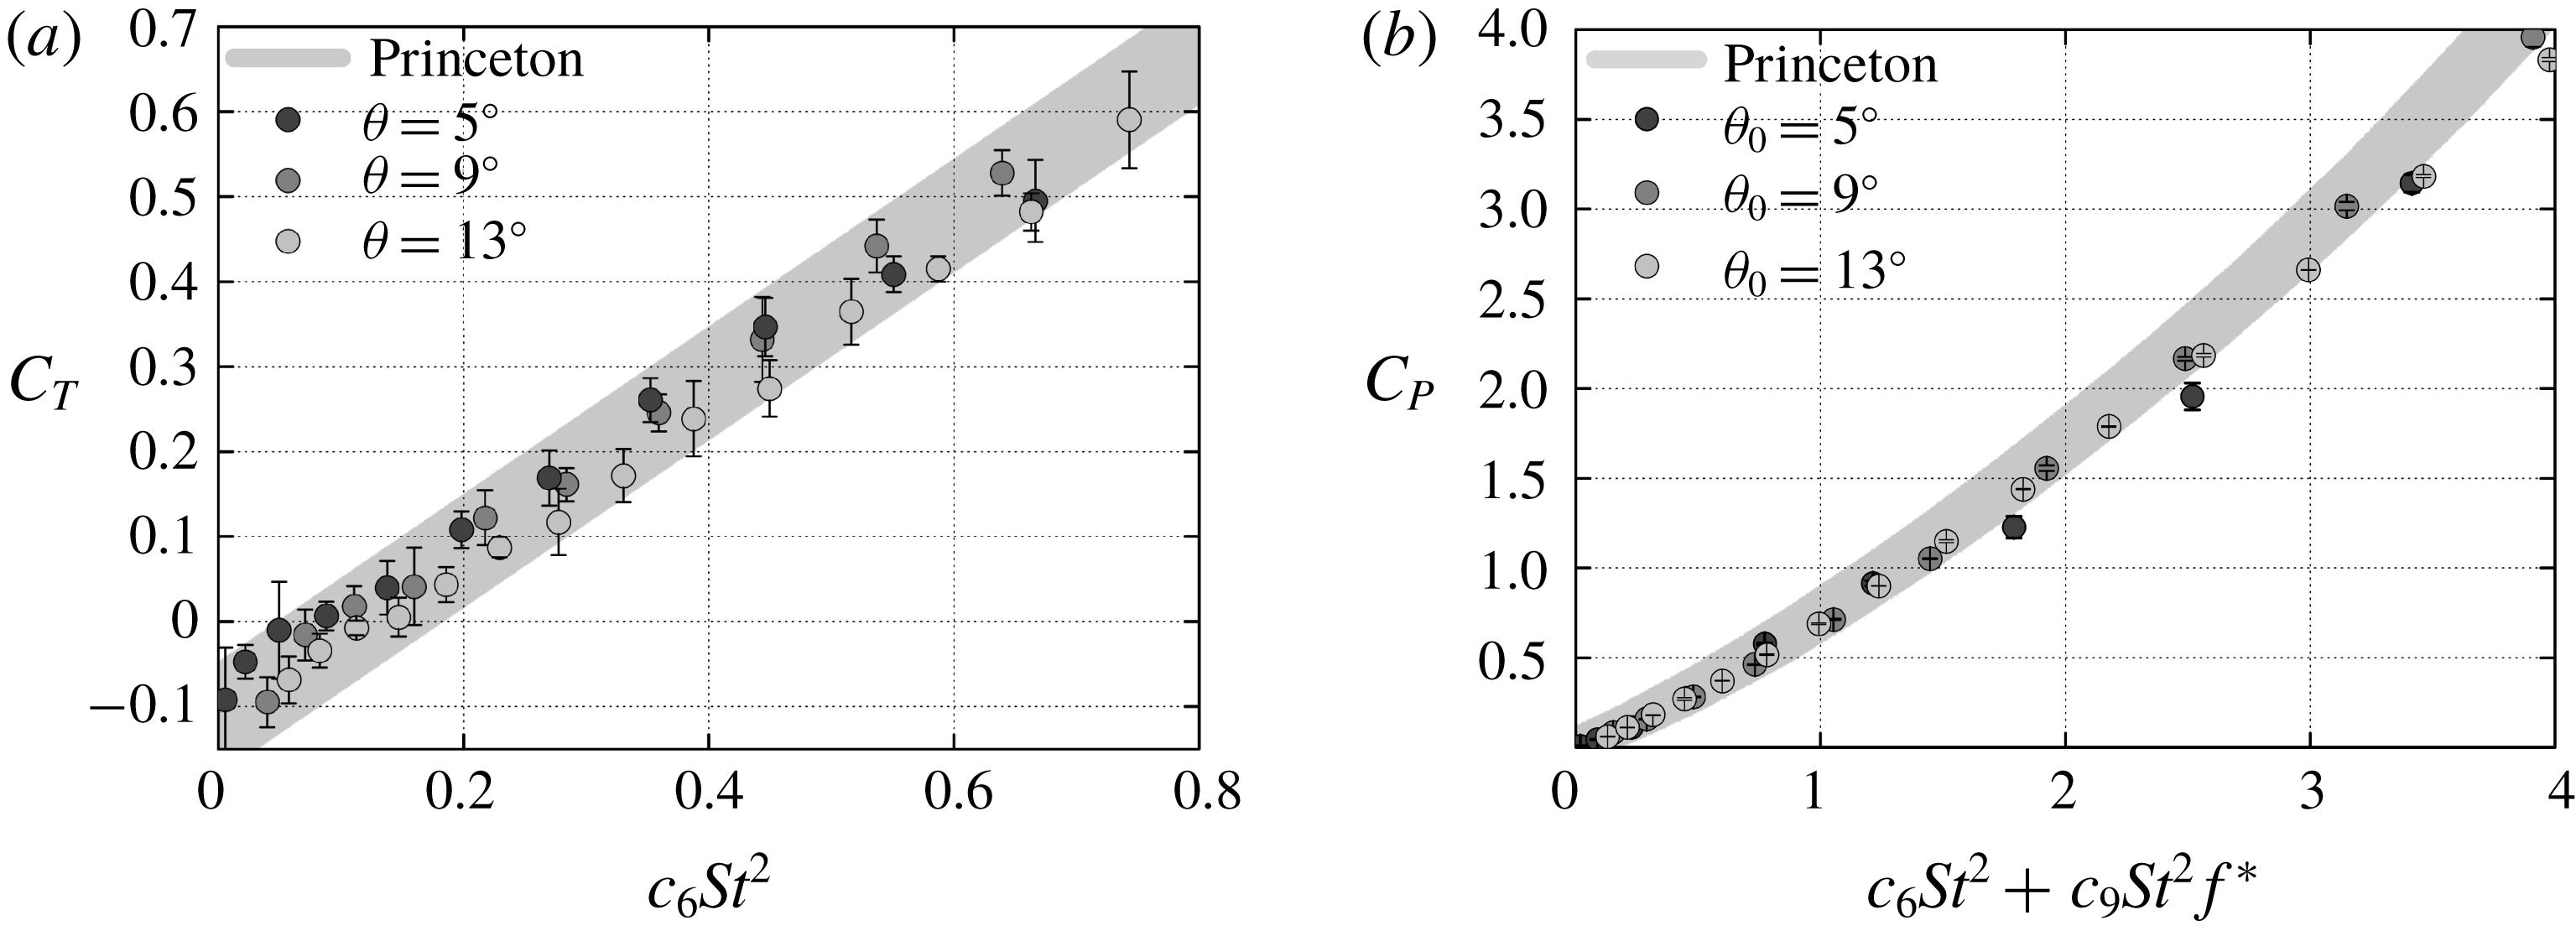
Reference Floryan, Van Buren, Rowley and Smits2017). As in our study, the previous study measured forces and torques on rigid pitching airfoils. Our measured time-averaged thrust and power coefficients agree very well with the published values (figure 8
a). To make a fair comparison, we matched all possible experimental conditions. First, we recreated a rigid airfoil with the same geometry: a teardrop cross-section, an 80 mm chord, a maximum thickness of 8 mm and an aspect ratio of 3.5 (Floryan et al.
Reference Floryan, Van Buren, Rowley and Smits2017). To minimize differences in vibrational noise, we used the same distance between the bottom of the force sensor and the top edge of the airfoil (2.5 cm). We used a horizontal splitter plate to match the depth of the Princeton channel (300 mm) and used the same free-stream velocity,
 $60~\text{mm}~\text{s}^{-1}$
(a chord-based Reynolds number of 4780). We recreated three of the reported pitch amplitudes,
 $\unicode[STIX]{x1D703}_{0}=5^{\circ }$
,
 $9^{\circ }$
and
 $13^{\circ }$
, over a range of frequencies. Each individual trial was performed 7 times with 30 total cycles: 5 cycles for a warm-up period, 20 cycles for data acquisition and 5 cycles for a cooling period. To increase the signal-to-noise ratio at low frequencies (
 $f<0.5$
Hz), we applied a second-order Butterworth filter (
 $6f$
cutoff frequency) to all instantaneous force and position data. The only difference between set-ups was that the airfoil of the previous study was a single piece of anodized aluminium, whereas ours was 3D-printed (Dimension 1200es) with acrylonitrile–butadiene–styrene and fixed to a carbon-fibre drive rod. To be consistent with the previous study, we did not remove inertial forces by subtracting forces in air from forces in water. Given the lower frequencies used for our validation, we do not expect this difference to significantly affect our comparison, though it may explain the slight discrepancy between the two studies in the power reported at higher frequencies (figure 8
b).
Validating thrust/power data. (a) The measured thrust coefficient agrees with published values. Thrust coefficient is defined as
 $C_{T}\equiv T/0.5\unicode[STIX]{x1D70C}au^{2}$
, where
 $\unicode[STIX]{x1D70C}$
is water density and
 $a$
is airfoil area (twice the span times chord). Frequency is scaled as it was in the previous study (Floryan et al.
Reference Floryan, Van Buren, Rowley and Smits2017) to facilitate comparisons: the Strouhal number is defined as
 $St\equiv fA^{\ast }c/u$
and the scaling constant
 $c_{6}=2.55$
. Error bars show
 $\pm 1$
standard deviation, and the shaded band shows an envelope circumscribing the published values (Floryan et al.
Reference Floryan, Van Buren, Rowley and Smits2017). (b) The measured power coefficient also agrees with published values, particularly at lower frequencies. The reduced frequency is defined as
 $f^{\ast }=2\unicode[STIX]{x03C0}fc/u$
, where
 $c$
is chord length, and the scaling constant
 $c_{9}=4.89$
.

Appendix B. Induced velocity from a half-ellipse-shaped vortex
The induced velocity at the midspan trailing edge of a wing from a half-ellipse-shaped shedding vortex ring is a function of the radius of the ellipse,
 $r$
, and the eccentric anomaly,
 $\unicode[STIX]{x1D6FD}$
(figure 5). The Biot–Savart law provides a general description of the differential induced velocity field produced by a differential segment of a vortex, while the total velocity will be the integration of this influence along the length of the vortex as
 $$\begin{eqnarray}\boldsymbol{V}_{\boldsymbol{i}\boldsymbol{n}\boldsymbol{d}}=\frac{\unicode[STIX]{x1D6E4}}{4\unicode[STIX]{x03C0}}\int _{0}^{\unicode[STIX]{x03C0}}\frac{\mathbf{d}\boldsymbol{s}\times \boldsymbol{r}}{|r|^{3}},\quad \text{where:}~\boldsymbol{r}(\unicode[STIX]{x1D6FD})=\frac{(s/2)\boldsymbol{r}_{\boldsymbol{s}}}{\sqrt{(s/2)^{2}\sin ^{2}\unicode[STIX]{x1D6FD}+r_{s}^{2}\cos ^{2}\unicode[STIX]{x1D6FD}}}.\end{eqnarray}$$
Here
 $\unicode[STIX]{x1D6E4}$
is the vortex circulation,
 $\mathbf{d}\boldsymbol{s}$
is a vector describing the length and orientation of a differential segment of a vortex,
 $\boldsymbol{r}$
is a vector from the midspan trailing edge to
 $\mathbf{d}\boldsymbol{s}$
,
 $s$
is the span length and
 $\boldsymbol{r}_{\boldsymbol{s}}$
is the
 $\boldsymbol{r}$
vector at the symmetry plane of the wing, which is defined as
 $\boldsymbol{r}_{\boldsymbol{s}}=U/(4f)\mathbf{i}+A/2\,\boldsymbol{j}$
, as shown in figure 5. The cross product between
 $\mathbf{d}\boldsymbol{s}$
and
 $\boldsymbol{r}$
can be written as
 $$\begin{eqnarray}\mathbf{d}\boldsymbol{s}\times \boldsymbol{r}=|\text{d}s|\,|r|\sin \unicode[STIX]{x1D713},\end{eqnarray}$$
where
 $\unicode[STIX]{x1D713}$
is the angle between the vectors
 $\mathbf{d}\boldsymbol{s}$
and
 $\boldsymbol{r}$
and
 $\sin \unicode[STIX]{x1D713}$
will be
 $$\begin{eqnarray}\sin \unicode[STIX]{x1D713}=|r|\frac{\text{d}\unicode[STIX]{x1D6FD}}{\text{d}s}.\end{eqnarray}$$
By substituting (B 2) and (B 3) into (B 1), the magnitude of the induced velocity becomes
 $$\begin{eqnarray}|V_{ind}|=\frac{\unicode[STIX]{x1D6E4}}{4\unicode[STIX]{x03C0}}\int _{0}^{\unicode[STIX]{x03C0}}\frac{\text{d}\unicode[STIX]{x1D6FD}}{(s/2)|r_{s}|}\sqrt{(s/2)^{2}\sin ^{2}\unicode[STIX]{x1D6FD}+r_{s}^{2}\cos ^{2}\unicode[STIX]{x1D6FD}}.\end{eqnarray}$$
Equation (B 4) is an elliptic integral of the second kind with the solution
 $$\begin{eqnarray}|V_{ind}|=\frac{\unicode[STIX]{x1D6E4}}{4\unicode[STIX]{x03C0}}\frac{(s/2)E(m_{2})+|r_{s}|E(m_{1})}{(s/2)|r_{s}|}.\end{eqnarray}$$
Here
 $E$
is the complete elliptical integral of the second kind and
 $m_{1}$
and
 $m_{2}$
are the elliptic moduli defined as
 $$\begin{eqnarray}m_{1}=\sqrt{1-\frac{(s/2)^{2}}{r_{s}^{2}}}\quad \text{and}\quad m_{2}=\sqrt{1-\frac{r_{s}^{2}}{(s/2)^{2}}}.\end{eqnarray}$$
Equations (B 5) and (B 6) can be rewritten as
 $$\begin{eqnarray}|V_{ind}|=\frac{\unicode[STIX]{x1D6E4}}{4\unicode[STIX]{x03C0}}\left(\frac{\def\AR{A\mkern-8muR}\ARcE(m_{2})+2|r_{s}|E(m_{1})}{\def\AR{A\mkern-8muR}\ARc|r_{s}|}\right)\quad \text{and}\quad |r_{s}|=\sqrt{\left(\frac{A}{2}\right)^{2}+\left(\frac{U}{4f}\right)^{2}},\end{eqnarray}$$
 $$\begin{eqnarray}m_{1}=\sqrt{1-4\def\AR{A\mkern-8muR}\AR^{2}kk^{\ast }}\quad \text{and}\quad m_{2}=\sqrt{1-1/(4\def\AR{A\mkern-8muR}\AR^{2}kk^{\ast })}.\end{eqnarray}$$
The direction of the induced velocity is mutually perpendicular to the direction of
 $\boldsymbol{r}_{\boldsymbol{s}}$
and the spanwise direction.
Appendix C. Alternative geometric assessment of data collapse
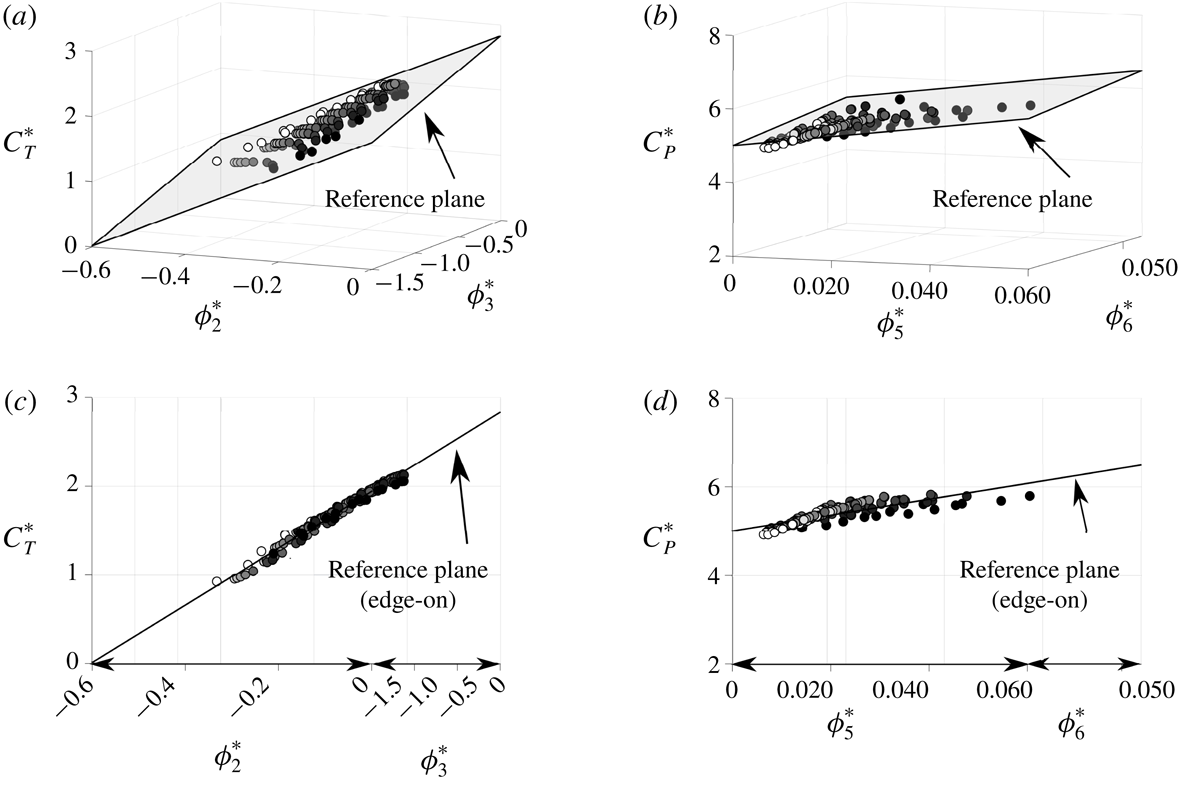
The thrust and power scaling relations stated in (4.5) and (4.6), respectively, represent flat planes in three dimensions. If the relations are accurate, then
 $C_{T}^{\ast }$
graphed as a function of
 $\unicode[STIX]{x1D719}_{2}^{\ast }$
and
 $\unicode[STIX]{x1D719}_{3}^{\ast }$
should collapse to a flat plane. Similarly,
 $C_{P}^{\ast }$
graphed as a function of
 $\unicode[STIX]{x1D719}_{5}^{\ast }$
and
 $\unicode[STIX]{x1D719}_{6}^{\ast }$
should also collapse to a flat plane. Figure 9(a,b) presents
 $C_{T}^{\ast }$
and
 $C_{P}^{\ast }$
plotted as functions of their scaling terms. By rotating the orientation of the data about the
 $C_{T}^{\ast }$
and
 $C_{P}^{\ast }$
axes such that the data are viewed ‘edge-on’ (figure 9
c,d), it becomes clear that there is an excellent collapse of the data to flat planes. In fact, the scaling laws are accurate to within
 $\pm 5\,\%$
of their full-scale value based on the deviation of the data from the reference planes. The collapse occurs over wide ranges of
 $k$
,
 $St$
and
 $\def\AR{A\mkern-8muR}\AR$
, and is independent of the values of the constants
 $c_{1}$
–
 $c_{6}$
. Moreover, the scaling relations can be used as predictive relations once the values of the constants are determined.
(a,b) Three-dimensional graphs of the thrust and power coefficients as functions of their scaling terms. (c,d) Three-dimensional thrust and power coefficient graphs oriented edge-on with a reference plane. The marker colours indicate the aspect ratio values varying in the range
 $1\leqslant \def\AR{A\mkern-8muR}\AR\leqslant 1000$
with a gradient of colour from black to white, respectively.

Using this geometric approach to show the collapse of experimental data is problematic. The issue is that the uncertainties in the measurements at low frequencies and low amplitudes are amplified when the thrust and power are normalized by
 $f^{2}A^{2}$
, which can lead to a misinterpretation of the collapse. Thus, assessing the collapse of experimental data with the proposed scaling relations is best accomplished when the thrust and power are normalized by dynamic pressure as presented in the main body of this study. However, since this three-dimensional geometric approach is equivalent to the approach in the main body, it can be concluded that the collapse of the data does not depend on the values of the constants
 $c_{1}$
–
 $c_{6}$
.