INTRODUCTION
Carrots (Daucus carota L., Apiaceae) are cultivated worldwide, with Asia accounting for 0·38 of global production. India produces 350 000 metric tonnes of carrots annually from an area of 24 000 ha with 14·6 t/ha productivity (FAO 2004). It forms an important component of the human diet owing to its unique flavouring, textural, medicinal, fibre and nutritional characteristics. The carrot is classified by the International Board for Plant Genetic Resources in priority group 4 (IBPGR 1981). Based on physiology and reproductive biology, the carrot is categorized as either tropical or temperate. Tropical carrots have purple and red coloured roots, pubescent leaves and are quick to reproduce (i.e. are early bolting), while temperate carrots have orange coloured roots, less pubescent leaves and late or no bolting until prolonged exposure to low temperature.
Carrot genotypes are available in distinct colours, viz., dark red, red, orange, yellow, purple and black. The major pigments, e.g. alpha and beta-carotene in orange, lycopene in red, lutein in yellow and anthocynin in purple and black carrots, have a significant role in nutrition and carotenoids are known to have an anti-cancerous genetic effect (Simon Reference Simon1996). The genetic background and nutritional information, such as improved flavours and more diverse pigments, are of immense importance for the vegetable industry and consumers (Simon Reference Simon2000). In the early 18th century, carrots were the first allogamous vegetable to undergo intensive selection breeding (Stein & Nothnagel Reference Stein and Nothnagel1995). Over the last two centuries, open-pollinated carrot varieties have been bred by mass selection and pedigree selection methods. The development of hybrid varieties, which improve upon the low yield potential and lack of homogeneity of open-pollinated varieties, is the aim of carrot-breeding programmes. Precise characterization of the available genetic diversity is essential for the development of inbred lines with good combining ability.
Genetic characterization of temperate carrot diversity has successfully demonstrated that molecular markers are potential tools for assessing the genetic variability of germplasm at the varietal or the population levels. Testing of genotypes for distinctiveness and uniformity is essential for varietal registration as well as for gene bank management. Twenty seven morphological markers have previously been used for genotypes and varietal characterization (UPOV 1976). Although biochemical markers comprised of isozymes and protein are used to study genetic variation in wild and cultivated carrots (St Pierre & Bayer Reference St Pierre and Bayer1991; Lallemand & Briand Reference Lallemand and Briand1995; Vivek & Simon Reference Vivek and Simon1998), these may be biased and influenced by the environmental and developmental stages of the plant. Random amplification of polymorphic DNA (RAPD; Grzebelus et al. Reference Grzebelus, Szklarczyk and Michalik1997; Schultz et al. Reference Schultz, Westphal and Wricke1997), amplified fragment length polymorphism (AFLP; Vivek & Simon Reference Vivek and Simon1999; Le Clerc et al. Reference Le Clerc, Briard and Peltier2001) and inter simple sequence repeat (ISSR; Briard et al. Reference Briard, Le Clerc, Mausset and Veret2001) markers have also been used for genetic analysis, but only a few reports have been published on the comparison of three or four molecular marker systems for the analysis of inter- and intra-varietal variation of the population and closely related genotypes of temperate carrot breeding lines (Briard et al. Reference Briard, Le Clerc, Mausset and Veret2001; Grzebelus et al. Reference Grzebelus, Baranski, Jagosz, Michalik and Simon2001).
However, to the knowledge of the authors there is no report on molecular characterization of tropical carrot breeding lines. Here, the use of new marker systems like universal rice primers (URPs) and expressed sequence tags (ESTs)-derived SSR markers in the characterization of genetic variability in tropical carrot germplasm are reported for the first time. URPs were developed from a repetitive DNA fragment, pKRD, from a genomic library of weedy rice that was grown in Korea (Kang et al. Reference Kang, Park, Go and Eun2002). The pKRD fragments were distributed on five chromosomes, with copy numbers ranging from 1500 to 4500 depending on rice species. Repetitive sequences have been used effectively to generate polymerase chain reaction (PCR) primers for fingerprinting genomes of plants, animals and microbes (Kang et al. Reference Kang, Park, Go and Eun2002; Dikshit et al. Reference Dikshit, Jhang, Singh, Koundal, Bansal, Chandra, Tickoo and Sharma2007).
The objectives of the present study were (i) to analyse genetic variability in intra- and inter-varietal populations of new tropical carrot genotypes using ISSR, URPs, RAPD and EST-derived simple sequence repeat (SSR) markers and (ii) to compare the utility of different marker systems in genetic characterization of carrot genotypes.
MATERIALS AND METHODS
Plant material
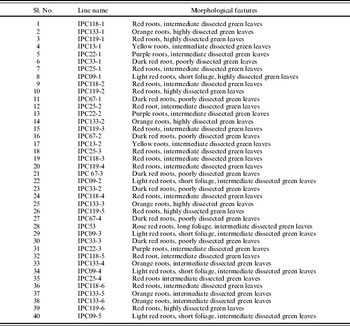
Forty elite indigenous genotypes of D. carota, with different root characteristics (i.e. colour and shape) were used in the present study. These lines were developed at the Division of Vegetable Sciences, Indian Agricultural Research Institute, New Delhi, India, from selfing and massing of 10 stocks (local landraces) collected from different agro-ecological regions of the North Indian Plains (Table 1).
Description of morphological features of tropical carrot genotypes used in the study

IPC, Indraprastha Carrot.
Molecular analysis
The genomic DNA was isolated from 5 to 6 young, healthy leaves of 90-day-old plants using the cetyltrimethyl ammonium bromide (CTAB) method (Doyle & Doyle Reference Doyle and Doyle1987). Young leaf tissue (5 g) was ground in liquid nitrogen using a pre-chilled mortar and pestle. Leaf tissue powder was transferred to a polypropylene tube containing 25 ml pre-warmed DNA extraction buffer (50 mM Tris-HCl, 150 mM NaCl, 100 mM EDTA, 10 mg/g CTAB and 2 μl β-mercaptoethanol). The tubes were incubated at 65°C for 30 min with occasional gentle swirling. Chloroform:isoamyl alcohol (24:1,v/v) (two-thirds the volume of the sample) was added, mixed and centrifuged at 10 000 rpm. Isopropanol (1/10, v/v) was added to the supernatant, mixed and kept at −20°C for 15–25 min and then centrifuged at 10 000 rpm for 10 min at 4°C (Sorvall, Rotor RC 5B Plus). The DNA pellet was rinsed with 70 ml/l ethanol for 10–15 min and then dried at room temperature overnight. The dried pellet was dissolved in 100 μl Tris-EDTA (TE) buffer (pH 8·0). For purification of DNA, RNAse treatment was given as described by Murray & Thompson (Reference Murray and Thompson1980). The quality and quantity of purified DNA were estimated by running 2 μl of each DNA sample on 8 mg/g agarose gel along with uncut lambda DNA (30 and 60 ng) to adjust final concentration of the template to 20–25 ng/μl for use in PCR analysis.
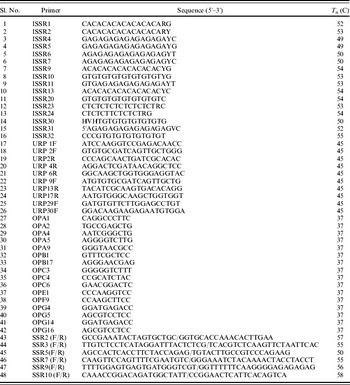
Sixteen ISSR, 10 URPs, 16 RAPD and 6 SSR markers were used in the present study. These were selected from an initial screening of 32 ISSR, 50 RAPD, 14 URPs and 10 SSR markers producing consistent bands with a few genotypes of carrot (Appendix Table 1). The URPs were originally derived from the repeat elements of weedy rice by Kang et al. (Reference Kang, Park, Go and Eun2002) and were synthesized by Operon Biotechnologies Inc., Alabama, USA. Sixteen RAPD primers (from the Kits OPA, OPB, OPC, OPE, OPF and OPG) were obtained from Operon Biotechnologies Inc., Alabama, USA. Ten new SSR markers were designed from the ESTs and unigene sequences downloaded from the NCBI database (www.ncbi.nlm.nih.gov) out of which six markers, which produced consistent banding patterns, were used in the present study. For ISSR, RAPD, URPs and SSR analyses, PCR amplifications were carried out in a total volume of 25 μl containing 25–30 ng of genomic DNA. The PCR reaction mixture consisted of PCR buffer (0·01 g/l gelatin, 2 mM Tris-HCl, pH 8·4; 5 mM KCl, 1·5 mM MgCl2), 10 mM dNTPs, 0·2 unit Taq DNA polymerase and 0·2 μM primer. All the PCR reaction components were obtained from Bangalore Genei Pvt. Ltd. Bangalore, India. The amplification was performed by using thermal cycler (T-Gradient Biometra, GmBh, Germany). For ISSR, URPs and RAPD markers, PCR temperature profiles were as follows: initial DNA denaturation at 94°C for 5 min, followed by 40 PCR cycles at 94°C for 1 min, annealing temperature specific to each primer (1 min), amplification at 72°C for 2 min and a final cycle at 72°C for 7 min. For SSR markers, PCRs were performed with initial DNA denaturation at 94°C for 5 min followed by 35 cycles at 94°C for 1 min, annealing temperature specific to each primer (for 1 min), amplification at 72°C for 2 min and final extension at 72°C for 7 min. The annealing temperatures of all the primers are given in Appendix Table 1. All the amplified PCR products obtained from ISSR, RAPD and URP markers were resolved by electrophoresis on 0·014 g/l agarose gel and SSR markers at 0·035 g/l metaphor agarose (Rockland, New York, USA) gel for 3 h in 0·5 M TBE buffer, stained with ethidium bromide and the photographs were taken by using Gel Documentation System (Alpha Innotech Corporation, California, USA).
Data analysis
DNA bands obtained with all the markers were scored visually for the presence (1) and absence (0) of bands for all 40 genotypes. The proportion of alleles that were shared between any two of the genotypes, averaged over loci, was used as the measure of similarity for all marker types on the basis of the Jaccard similarity coefficient (Nei et al. Reference Nei1973). Sequential agglomerative hierarchal nested (SAHN) clustering was performed on the similarity matrix using the related Jaccard and Dice coefficients and the unweighted paired group method with arithmetic averages (UPGMA). The utility of a marker for detecting genetic variation was estimated as reported by Powell et al. (Reference Powell, Morgante, Andre, Hanafey, Vogel, Tingey and Rafalski1996). It includes: (a) expected heterozygosity (Hn) by calculating sum of the squares of allele frequencies, Hn=1−Σp i2, where p i is the allele frequency for the ith allele (Nei Reference Nei1973), (b) arithmetic mean heterozygosity (H av), calculated as H av=ΣHn/n, where n is the number of markers (loci) analysed, (c) effective multiplex ratio (EMR=n pβ), which is the product of the number of polymorphic loci (n p) in the germplasm analysed and the fraction of markers that were polymorphic (β) and finally (d) marker index (MI) which is the product of expected heterozygosity (H av) and EMR. The resolving power (R p) of each marker system was also calculated as R p=ΣI b, where I b (band informativeness) takes the value: 1−[2×(0·5–p)], p being the proportion of genotypes of different carrot lines containing that band (Prevost & Wilkinson Reference Prevost and Wilkinson1999). The matrix of similarity coefficient was subjected to eigenvector analysis to extract the first three most informative principal component analysis (PCA). The correspondence between the ISSR-, RAPD-, URP- and SSR-based similarity coefficient matrices was tested based on correlation analysis, and the matrix correspondence test was performed using the MXCOMP module (Mantel Reference Mantel1967). The data analysis was thus done by using different modules of NTSYS version 2.1 software (Rohlf Reference Rohlf2000).
RESULTS
Characterization of genetic variation
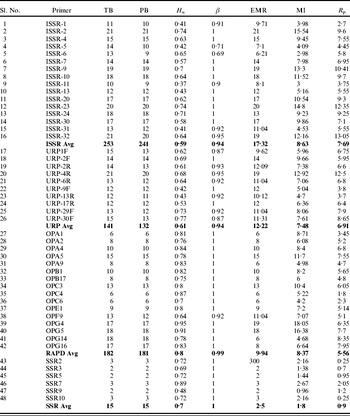
Genetic variation was detected among 40 genotypes of tropical D. carota germplasm lines by four marker systems using 16 ISSR, 10 URPs, 16 RAPD and 6 SSR markers (Table 2). These 48 markers amplified a total of 591 bands, of which 569 were polymorphic. The amplified product length ranged from 200 to 3500 bp for ISSR, RAPD and URP markers, while for SSR product size ranged from 100 to 300 bp. The maximum number of bands (21) amplified was achieved by ISSR02, ISSR32 and URP4R markers and minimum number of bands (2) using SSR3, SSR5 and SSR9 markers. The 16 ISSR markers amplified a total of 253 bands, of which 241 were polymorphic with an average of 15·1 polymorphic bands per primer. Ten URP markers amplified 132 polymorphic bands out of a total of 141 bands. Sixteen RAPD markers generated 181 polymorphic bands out of a total of 182 with an average of 11·3 polymorphic bands per primer. However, 15 polymorphic bands were obtained with six SSR markers. Out of 48 markers used in the present study, maximum alleles (21) were amplified by ISSR02 followed by ISSR32 and URP4R (Table 2).
Comparative analysis of ISSR, URP, RAPD and SSR markers assayed on tropical carrot genotypes

TB, total number of bands amplified; PB, polymorphic bands; Hn, expected heterozygosity; β, proportion of polymorphic bands; EMR, effective multiplex ratio; R p, resolving power; MI, marker index.
Comparison of different marker systems
For comparison of the four marker systems used in the present study, expected heterozygosity (Hn) for each marker and average heterozygosity for each marker system were calculated. Loci found to be monomorphic in the set of 40 genotypes were excluded from this analysis but included in the calculation of EMR and MI as described in the Materials and Methods section. Expected heterozygosity varied from 0·41 to 0·95 in different marker systems (Table 2). Out of 48 markers used in the present study, 0·71 were very effective in detecting polymorphic loci (β=1). The EMR ranged from 2 to 21 in all the markers. Pooled information of all the bands generated by a marker, i.e. its resolution power R p, ranged from 0·25 to 13·05, whereas the MIs assay varied from 0·96 to 18·04 (Table 2). The highest levels of polymorphism (H av) were detected with RAPD (0·80) and lowest (0·59) with ISSR marker systems.
Fraction of polymorphic loci was highest for SSR markers (1·0), followed by RAPD, URP and ISSR marker systems (Table 2). The ISSR markers showed a distinctive nature because the MI for these markers was of a higher magnitude (8·63) than for any other markers used in the present study. This was mainly due to a very high EMR component (EMR=17·39). The mean expected heterozygosity, however, was lower in ISSR than in the other three marker systems examined. MIs were lowest (1·80) for the SSR marker system. The resolution power (R p) ranged from 0·9 to 7·69. The markers found to be most informative with regard to the number of genotypes identified are listed in Table 2.
Genetic relationships between and within Daucus genotypes
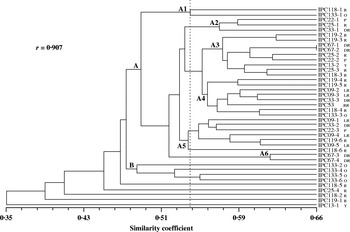
Genetic relationships between the genotypes were determined on the basis of the Jaccard's pairwise similarity coefficient, which classified 40 genotypes into two major groups. The combined data set of 591 DNA bands obtained by four marker systems was analysed with UPGMA and a dendrogram was constructed (Fig. 1). At 0·45 genetic similarity coefficient, all 40 genotypes can be classified broadly into two main groups. Group A consisted of 0·8 of the genotypes and was further divided into six subgroups (subgroups A1–A6) at 0·55 genetic similarity coefficient (Fig. 1).
Dendrogram obtained by UPGMA analysis of combined data of ISSR, RAPD, URP and SSR markers from 40 genotypes of carrot. Correlation coefficient r, calculated by Mantel test represents the goodness of fit of the dendrogram. Genotypes numbers and root colour are given at the termini of branches as R=red, RR=rose red, LR=light red, DR=dark red, P=purple, O=orange, Y=yellow.

Group A contained 0·84 of the rose red, light red, red and dark red carrot genotypes. It was also found that deep red and red-coloured roots showed a tendency to share the same clusters within subgroups A4, A5 and A6. The orange-coloured genotypes clustered in group B. However, four genotypes (IPC25-4, IPC118-2, IPC119-1 and IPC13-1) did not share any of the groups.
PCA
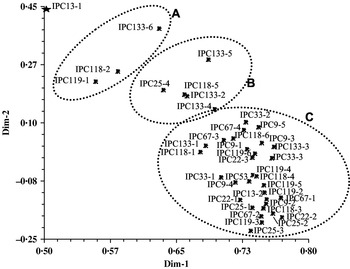
The PCA of 40 tropical carrot genotypes explained 0·55 of the variation by first three components. PC1 explained 0·50 of the variation, but could not separate all the genotypes. These broad groups could be further resolved by four-principal components that explained 0·90 of the variation of the data. Overall, three distinct clusters were obtained by the PCA (Fig. 2). Among all the genotypes, IPC13-1 remained very diverse from the three distinct clusters as revealed by PC1 and PC2, accounting for 0·53 of the genetic variation. Cluster I consisted of lines IPC118-2, IPC119-1 and IPC133-6. Cluster II includes the genotypes IPC133-2, IPC133-4, IPC133-5, IPC118-5 and IPC25-4. The remaining 31 lines (0·78 of them) were grouped into one cluster and could not be resolved further using PCA.
Two-dimensional plot of genetic diversity among the 40 carrot genotypes as revealed by the PCA based on combined data obtained from ISSR, RAPD, URP and SSR markers.

Correlation between genetic similarities derived from four marker systems
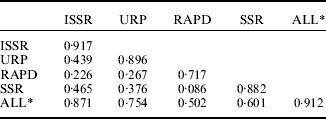
The genetic similarities among different genotypes obtained from the individual marker system were also analysed to find out the grouping behaviour of lines with each marker (data not shown). The maximum genetic similarity coefficient (0·79) between any two genotypes was detected by the SSR marker system, which was closely followed by the URP (0·78) and ISSR (0·71) markers. However, the RAPD marker system showed the lowest (0·54) similarity coefficient. The Mantel test was carried out on all four individual marker systems to obtain the Mantel test statistic, z, which measures the degree of relationship between two matrices. The cophenetic product–moment correlation r was calculated for the genetic similarities among the same combinations of the genotypes used in the present study (ISSR r=0·917; URP r=0·896, RAPD r=0·717 and SSR r=0·882; Table 3). The combined analysis of all four marker systems showed high cophenetic correlation value (r=0·912). All the clusters were supported by reasonably high r values (>0·8), indicating a good fit of the data for diversity analysis. Similarly, the result of the Mantel test showed a positive correlation between the individual marker systems as well as to the combined data set (Table 3).
Mantel statistic for comparison of similarity matrices derived from ISSR, RAPD, URP and SSR markers

* Combined analysis of all the markers.
DISCUSSION
The population structure and measures of genetic diversity for any plant species can be estimated by knowing the evolutionary history of the plant population, choice of marker system and the number of loci needed to truly represent variation in the genome. The estimation of genetic relationships among accessions is important for choice of breeding material and for design of experimental crosses. A better estimate of similarities between the related genotypes of the plant population can be made by using those DNA markers that provide genome-wide coverage (Powell et al. Reference Powell, Morgante, Andre, Hanafey, Vogel, Tingey and Rafalski1996; Dillmann et al. Reference Dillmann, Bar-Hen, Guerin, Charcosset and Murigneux1997). The utility of a given marker system is a balance between the level of polymorphism detected (information content) and the extent to which an assay can identify multiple polymorphism.
In the present study, four marker systems (ISSR, URP, RAPD and SSR) were compared to characterize the genetic diversity of 40 selected elite genotypes of outbreeding subtropical carrot breeding lines. It was evident from the results that no single marker produced a unique banding pattern for any of the genotypes. However, based on the combined banding pattern obtained from 48 markers, all 40 genotypes could be characterized.
It was found that ISSR markers generated the largest number of polymorphic amplicons per assay, as shown by their high EMR, MI and resolving power. This supports the fact that the ISSR markers were most effective in resolving the polymorphism content in 40 genotypes of D. carota. In ISSR, (GT)n motifs were most polymorphic and abundant, followed by (CA)n and (GA)n, with (AG)n [A1] the least polymorphic motifs. The proportion of polymorphism was comparable for ISSR and URP markers. Briard et al. (Reference Briard, Le Clerc, Mausset and Veret2001), while studying nine open-pollinated temperate carrot populations and four inbred lines with three ISSR markers, also observed a similar average (15·06) of polymorphic bands. The ISSR and URP marker systems were found to be equally good in the detection of polymorphism and efficient in distinguishing 40 genotypes. As far as number of genotypes differentiated per assay is concerned, ISSR showed the maximum discriminatory power, followed by URP, RAPD and SSR. High levels of intra-varietal heterogeneity were also observed in temperate carrots using isozyme (St Pierre & Bayer Reference St Pierre and Bayer1991; Lallemand & Briand Reference Lallemand and Briand1995), RAPD (Grzebelus et al. Reference Grzebelus, Szklarczyk and Michalik1997; Briard et al. Reference Briard, Le Clerc, Mausset and Veret2001), microsatellite (Niemann et al. Reference Niemann, Westphal and Wricke1997) and AFLP (Nakajima et al. Reference Nakajima, Oeda and Yamamoto1998; Le Clerc et al. Reference Le Clerc, Briard and Peltier2001) markers. A high MI for the ISSR assay was obtained in the present study, which might be because of its high EMR rather than high polymorphism. URP markers were also demonstrated to be equally efficient in polymorphism detection. There is no report, as yet, on the use of URP markers (Kang et al. Reference Kang, Park, Go and Eun2002) for evaluation of carrot genetic divergence. Hence, the present study uses a new marker system (URP) for molecular analysis of subtropical D. carota genotypes for the first time. These URP markers are considered more specific to RAPD because their primer length is 20 nucleotides and they have a high annealing temperature. These have been proved to be better DNA markers for diversity analysis across genomes (Kang et al. Reference Kang, Park, Go and Eun2002). In earlier reports, SSR markers were found to be most potent in molecular characterization of temperate carrot breeding lines (Vivek & Simon Reference Vivek and Simon1998, Reference Vivek and Simon1999; Grzebelus et al. Reference Grzebelus, Baranski, Jagosz, Michalik and Simon2001; Le Clerc et al. Reference Le Clerc, Briard and Peltier2001; Santos & Simon Reference Santos Carlos and Simon2002).
In the present study, a new set of SSR markers mined in silico from 235 non-redundant ESTs and genomic sequences available in the GenBank has been reported. Out of these 44 newly designed SSRs markers, 10 SSRs with di-mer motifs were selected for the present study. Of these, six SSRs amplified scorable and reproducible bands. Three SSR markers (SSR2[(TG)12], SSR7[(CT)17] and SSR10[(AC)10]) detected three alleles each, indicating more variability for these loci in the carrot genome as compared to SSR3[(CT)9], SSR5[(AT)12] and SSR9[(GA)8] loci. This multi-allelic nature of EST-derived SSRs was also observed by Briard et al. (Reference Briard, Le Clerc, Mausset and Veret2001) in the case of intra-varietal analysis of temperate carrots. Since the ESTs are gene signatures, these SSRs may serve as gene-specific markers. In the present study, the SSRs demonstrated a higher proportion of polymorphism compared to the other three marker systems.
The present results reveal a very high and non-structured molecular diversity in these open-pollinated breeding lines as evident from the dendrogram and PCA topology. This is also supported by the conclusion of Bradeen et al. (Reference Bradeen, Bach, Briard, Le Clerc, Grzebelus, Senalik and Simon2002), who investigated 124 D. carota accessions using different marker systems. The groups formed by the carrot breeding lines using UPGMA were not specific to their root colour, except for the lines with orange-coloured roots. In most of the groups, lines with dark red roots shared clusters with red-coloured lines. This might be due to the fact that red (ppEeyyIi) and dark red (ppEEyyii) breeding lines shared a dominant E allele, which acts as red colour enhancer (Bhagchandani & Choudhary Reference Bhagchandani and Choudhary1970). Hence, pigment colour, which is a quantitative trait (Simon et al. Reference Simon, Rubatzky, Bassett, Strandberg and White1997) and controlled by a pair of dominant and recessive genes, might have affected the grouping patterns of the breeding lines. The genetic analysis of carrot root colour type showed that the homozygous dominant gene P imparts a purple colour to carrot roots (Bhagchandani & Choudhary Reference Bhagchandani and Choudhary1970). The breeding lines belonging to the orange-coloured IPC133 line formed a separate and distinct cluster (Group B) comprising 0·67 of its genotypes. These breeding lines may have a genetic composition of O-R-, O-Rr and oorr, since the dominant orange allele and dominant red allele are epistatic (Uniel & Gabelman Reference Uniel and Gabelman1972).
PCA is one of the multivariate approaches of grouping genotypes based on the similarity coefficient or variance–covariance values of the component traits. While the cluster analysis provides higher resolution among closely related populations, the PCA is expected to be more informative about differentiation among major groups. In the present study, three distinct clusters were obtained by PCA suggesting high genetic variation in the 40 carrot genotypes. Breeding carrot varieties with high levels of uniformity is limited by genetic factors, i.e. heterozygosity and inbreeding depression, which originate from the breeding methods used for open-pollinated varieties (Macko & Grzebelus Reference Macko and Grzebelus2008). This analysis could be of great use to breeders for selection of diverse breeding lines in their breeding programmes.
To assess the structure of carrots or any outbreeding plant populations, generally co-dominant markers are more informative. The co-dominant marker sets, such as microsatellites, that adequately cover the entire genome provide a more precise estimate of genetic relationships. When dominant markers are the only available option it is recommended to use two to three marker systems to have a consensus of information on the genetic structure of the outbreeding population, as followed in the present study. Nevertheless, in plant species where little or no sequence information is available, the URP markers and ISSRs markers described in the present paper will be of potential use and the present study, carried out on tropical carrots, is a significant validation of the same. These markers had previously been validated for inter- and intra-specific variability in various crops such as rice (Kang et al. Reference Kang, Park, Go and Eun2002) and Vigna (Dikshit et al. Reference Dikshit, Jhang, Singh, Koundal, Bansal, Chandra, Tickoo and Sharma2007).
The comparison of dendrograms obtained using different marker systems (data not shown), lead to the conclusion that in order to take advantage of different sources of polymorphism and to obtain more reliable information on genetic relationships of the material studied, different marker systems and statistical methods should be used simultaneously to estimate genetic diversity. However, numerous studies concerning genetic similarity are based only on a single marker system, which may not lead to definite conclusions.
Characterization and assessment of diversity among these carrot genotypes would be of great significance for designing breeding strategies, both for the qualitative and quantitative traits. Use of these genotypes in hybridization will contribute significantly to increasing the variability, which could serve as a potential source for breeding improved cultivars. The present study demonstrated for the first time that URPs derived from weedy rice could successfully assess genetic diversity in tropical carrots, which could be more valuable random markers because of their high specificity. In addition, an entirely new set of microsatellite markers, based on EST sequences, have been developed and utilized successfully. These markers have high specificity compared to others, hence would be more efficient in genetic analysis and mapping of useful genes in tropical carrots. Cross transferability of these new set of EST-derived SSR markers from D. carota can be explored in other Daucus species or related genera of Daucinae such as Cuminum cyminum (cumin) and Thapsia garganica for comparative mapping of conserved genes.
APPENDIX
List of primers used in this study with their sequences, and their optimized annealing temperature (Ta)