

INTRODUCTION
Theories of American mass incarceration concur in citing perceived threats of rising crime and civil unrest during the late 1960s and 1970s as the initiating causes of the prison boom that began in the early 1980s (Beckett Reference Beckett1997; Garland Reference Garland1990, Reference Garland2001a, Reference Garlandb; Gottschalk 2011; Wacquant Reference Wacquant1999, Reference Wacquant2009; Western Reference Western2006). Yet these theories have difficulty explaining the longevity of the boom into and beyond the 1980s, as civil unrest became less threatening, and crime rates stabilized and then declined.
We elaborate a political economy perspective on mass incarceration in California, circa 1960–2010. The core political and economic elements of this perspective included “law and order” Republicans supplemented by key Democrats who advanced debt instruments—first government obligation bonds (GOBs) and then lease revenue bonds (LRBs)—to defer and externalize costs of building prisons in rural inland localities that were receiving increasing numbers of minority migrants from California’s coastal cities. Among these factors, we argue that the innovative use of LRBs was the essential element that enlarged and extended the funding of California prison construction by an order of magnitude that made this expansion a prison boom.
We offer our theoretical perspective and historical analysis in counterpoint to the approach of Ruth Gilmore’s (Reference Gilmore2007) monograph, Golden Gulag, which combined old and new ideas about political economy in describing and explaining the prison boom in California. The agricultural recession of the 1980s was the essential element in Gilmore’s approach. Before further elaborating our own perspective, we summarize Gilmore’s influential contribution.
The Political Economy of Agriculture and the California Prison Boom
Gilmore resurrected the causal attention given by Rusche and Kirchheimer’s (Reference Rusche and Kirchheimer1939) depression era prison research to the threats posed by unemployed workers. Gilmore located this excess labor within a larger model (Gilmore Reference Gilmore2007) of late twentieth-century California that included “surpluses” (p. 58) in the state’s finances (created by public debt), land (resulting from an agricultural recession), population (made threatening by joblessness), and state capacity (that rebalanced power relations by building prisons).
Gilmore’s model assigned exogenous causal importance to a recession in California’s agricultural economy. She theorized that this recession devalued farmland as well as farm labor and led agricultural elites to press the state to buy farmland for prisons. She called this a “prison fix” to the problems of surplus land resulting from California’s agricultural recession in the 1980s (Chapter 3). She noted the role of LRBs in financing prison construction and presented a case study of the building of a prison near Corcoran, a town in the San Joaquin Valley’s Kings County, as the foundation for her key chapter on “Crime, Croplands, and Capitalism.” She saw this prison as exemplifying the way state correctional budgets were used to “fix” the recessionary pressures that were “relentlessly surplusing significant segments of labor and land” (p. 129).
Gilmore indicated that the root of the surplus land and labor was farmers taking acreage out of production in response to drought and debt. Thus idle land and mechanization exacerbated unemployment in Corcoran. The California Department of Corrections and Rehabilitation (CDCR) promised a new prison would bring jobs to Corcoran and Kings County, but Gilmore finds that this was not the case. A State Assemblyman, Jim Costa, known for capitalizing on the cleavages of Central Valley wedge issues, worked to place several prisons in Kings County and then co-sponsored the “three strikes” law that disproportionately helped fill these prisons with minority offenders (Gilmore Reference Gilmore2007; Page Reference Page2011).
The statistics Gilmore presents for Kings County assist her argument, but broader patterns across the state do not. In Kings County, cropland in production decreased significantly between 1982 and 1992, from 613,693 to 519,526 acres. Unemployment also increased from 9.4% to 12.9%; however, broader data and comparisons challenge this picture. During this period, farmers were taking cropland out of production all over California. John Hart (Reference Hart2001) notes that in California and elsewhere, “Most of the loss of cropland was in marginal agricultural counties with soils of low inherent fertility and topography unsuited to modern farm machinery” (p. 525).
In the narrow period of greatest concern, between 1982 and 1987, and in contrast with Gilmore’s thesis, we calculated that cropland decreased 5.3% in counties where prisons were constructed, compared to 9.8% in counties without prison construction. Los Angeles County actually lost the most cropland. In the longer interval between 1978 and 1997, cropland decreased 3.9% in counties where prisons were constructed, versus 5.6% in other counties. Comparisons of shorter and longer periods confirm that the agricultural recession was shorter lived than the prison boom (Hart Reference Hart2003).
Financial Entrepreneurship and the Political Economy of the California Prison Boom
Our political economy perspective emphasizes the entrepreneurial Republican development of lease revenue bonds during a period of race-linked population changes in twentieth-century California. The entrepreneurial use of LRBs boosted returns on capital to local and national financial institutions in a newly emerging era of slowing American economic growth (Piketty Reference Piketty2014). The repurposing of LRBs to fund prison construction had several economic and political features that explained their appeal and adoption. First, LRBs allowed counties to dramatically expand as well as defer and externalize the costs of local prison construction, with the state assuming responsibility for issuing and monitoring these debt instruments. Second, LRBs allowed politicians to bypass super-majority legislative support and statewide voter approval required for general obligation bonds. The features of LRB financing were uniquely suited to prison construction in California’s less populated inland counties.
Rural central and southern California counties experienced rapid population growth in the 1980s, including a notable influx of minority residents. These new residents were relocating from California’s large coastal cities and were seeking lower cost housing and better schools. They resettled in the rural Republican-dominated counties of central California and the “Inland Empire” that received legislative appropriations for prison construction in the 1980s and 1990s. Although we argue that the essential sustaining force driving California’s surging prison construction was the innovation and entrepreneurship of lease revenue bonds, the funding appropriations for the resulting new prisons were not randomly distributed across the counties of California. We argue that a Republican parochial inclination to punish combined with high visibility locations of the racial demographic transition during the last decades of the twentieth century played significant roles in the selection of California counties for appropriations to fund prison construction.
James Liebman and Peter Clarke (2011) write that the parochial politics of the death penalty, and by implication mass incarceration, are a punitive expression of localism resulting from changes provoking community feelings of insecurity, instability, and discontinuity. More specifically, they argue that fear of crime and anxiety about spillover effects from “outside” (p. 270) minorities drive the punitive inclinations of parochialism. They explicitly cite Republican Party affiliation and concerns about increased minority group populations as fostering punitive parochialism.
Liebman and Clarke explain that, “the boundaries of the immediate community represent a bulwark against outside influences that threaten to dilute or entirely dissolve the community’s cohesion, and parochialism compels a spirited defense of those frontiers” (p. 269). From this perspective, the politics of the Republican Party’s preoccupations with encroaching minority populations were elements of a parochialism that outweighed local sources of resistance to the construction of prisons.
Thus Liebman and Clarke observe that parochial state politics tend to favor both pro-punishment and anti-tax policies. They note the tendency of parochial states to encourage punitive responses to perceived criminal threats, while resisting the collection of taxes to support police, prosecutors, investigators, courts, or prisons. Liebman and Clarke’s insight is that the death penalty solved this problem for local politicians because state and federal governments paid for the capital trials and executions. The use of bonds for state prison construction similarly contributed to resolving this contradiction by deferring and externalizing costs of imprisonment. Thus we follow Liebman and Clarke in arguing that innovative and entrepreneurial leveraging of funds by the state was important because it addressed the tension of wanting to punish offenders without taxing the local community to do so.
This innovation and entrepreneurship had its roots in the expanded role of private investment firms in financing the growth of public institutions—including schools, parks, sewer systems, road networks, hospitals, and eventually prisons. Investment firms were drawn to prison construction as they sought to further increase returns to capital associated with financing the infrastructure of post-World War II population growth. The post-War baby boom spurred the growing need for public services. As the children of this era transitioned from childhood through adolescence to adulthood, they passed through an array of public institutions, which eventually included prisons. There may have been less enthusiasm for building prisons—compared to hospitals, roads, and schools—but by the 1980s, the era of prison construction was launched.
Some of the consequences of the growing role of private capital in public finance were well anticipated and beneficial, while other consequences were less well understood and detrimental. Robert Merton (Reference Merton1936) classically distinguished between present and future path dependent consequences following from the “imperious immediacy of interest” (p. 901): when intensely pursued short-term goals of an action or policy are pursued in ignorance of longer term unintended consequences.
This imperious immediacy of interest was expressed in the desires of private financial institutions for new returns to capital via the funding of prison construction. There was little appreciation of the long-term operating costs—much less social costs that included the highly disproportionate incarceration of visible minorities—of creating a massive prison system (Hagan Reference Hagan2010). Republican political entrepreneurs and their Democratic allies saw the near term benefits of marrying investment interests with rural, parochial inclinations to punish—especially if this could be done without increases in local taxes. However, since prisons were less popular than schools, hospitals, and other public amenities, this funding required some significant innovations.
Thus initial public enthusiasm for prisons to contain growing numbers of inmates waned as the effects of the baby boom and a crack epidemic stabilized and then slowed in the 1980s and 1990s. Statewide voter support required for issuance of general obligation bonds to build new prisons correspondingly declined. Yet the parochial political inclination to punish remained palpable and apparent, and the desire of the financial institutions to sustain and increase returns on investment in prison debt persisted. We offer an historical account of how financial investment made the prison boom possible in California, and at the end of this paper we suggest the national implications of the California experience.
The Importance of Within-State Variation
A new appreciation of within-state variation in penal practices has occurred as a result of David Garland’s (Reference Garland2010) monograph on the U.S. death penalty. Garland asked why the United States stood out among developed nations in retaining capital punishment. His answer was that “[i]n the United States, the power to punish is controlled by local democratic processes” (p. 15).
Sarah Lawrence and Jeremy Travis (2004) reported that only 13% of U.S. counties housed a penal institution in 1979, but that 31% of American counties had a jail or prison by 2000, including the majority of California counties. The obvious questions are how and why this happened. Journalist Eric Schlosser (Reference Schlosser1998) argued, in a widely cited Atlantic Monthly article, that state prisons were subsidized enterprises akin to the military industrial complex. Schlosser highlighted the within-state economic transfers involved in housing poor urban Black offenders in prisons located in rural White communities.
John Eason (Reference Eason2008) conducted the most comprehensive county-level analyses of U.S. prisons. He found prisons proliferating across U.S. counties, but he did not find support for Schlosser’s assertion that prisons were disproportionately located in White counties. To the contrary, Eason found prisons were located in disproportionately African American and Hispanic counties—especially in southern states. However, Michele Hoyman and Micah Weinberg (2006) found the siting of prisons in North Carolina counties was not related to African American population. Further research is needed on this topic.
A Mixed Methods Approach
Our analysis is based primarily on qualitative material from the California State Archives, state politicians' oral histories, and more than thirty interviews with eleven key informants. The latter interviews began with a high ranking member of the State Senate Appropriations Committee, which played a central role in funding state prison construction. This key informant provided introductions to five long-term employees in the Legislative Analyst’s Office who we interviewed about the issuance of general obligation bonds and the emergence of lease revenue bonds in the 1980s and 1990s. These interviews yielded five further contacts in the California Department of Corrections and Rehabilitation (CDCR), whom we interviewed about the processes leading to the siting of prisons in local communities. The eleven informants were interviewed from two to five times each in an iterative process that incrementally informed and revised our historical account. A brief quantitative coda to our paper based on data coded from the Legislative Analyst’s Office uses a proportional hazard approach to model the counties and years in which site-based appropriations were made for prison construction across California.
ENTREPRENEURIAL PAROCHIALISM AND THE REPUBLICAN PARTY
The origins of mass imprisonment in California notably included the elections of Ronald Reagan as governor and George Deukmejian as state senator. Two years after a racial rebellion against policing in South Central Los Angeles, Reagan and Deukmejian sponsored legislation increasing sentences for crimes inflicting “great bodily harm” (Barker Reference Barker2009, p. 62). While this “enhanced” prospective punishments, it did not immediately escalate imprisonment, as Reagan continued to use parole to limit prison terms. This was an early symbolic stage of the parochial ideological shift away from rehabilitation.
This shift was slowed by the Watergate scandal and the elections of President Jimmy Carter and Governor Jerry Brown. Brown sustained a rhetorical emphasis on punishment by passing Reagan’s 1976 Determinate Sentencing Act and sentencing enhancements, but again there was no escalation of imprisonment. However, Brown’s Legal Affairs Secretary, Anthony Kline (Reference Kline1991), saw change coming: “… there were some legislators—George Deukmejian, who was then a state senator … who wanted longer prison terms” (pp. 28–29).
It was under Republican Governor Deukmejian that the prison population began to explode by orders of magnitude: doubling between 1982 and 1988, and again by 1995. African Americans were more than a third of prison inmates but less than 10% of the state population, while Latinos also constituted about a third of the inmate population. Reagan and Deukmejian initially spoke in cautious race neutral terms about a “morality gap” and a decline in “common decency” (see Barker Reference Barker2009, p. 62). When Deukmejian ran for Governor, the parochial role of race became more explicit. Crime became a key wedge issue mobilizing voters around racial cleavages in the California electorate.
Deukmejian partnered with former county sheriff Senator Robert Presley to get more prisons built. Presley was a conservative Democrat who frequently allied with Republican legislators and Governor Deukmejian (Presley 2001–2002). He was elected in 1974 and as a former sheriff symbolized the rising importance of penality. Determinate sentencing was the opening, with Presley lamenting that, “Reagan had been governor and because it was indeterminate, he never built any prisons” (p. 14).
Presley (2003) formed a coalition around Deukmejian’s Republican leadership, recalling that “we formed … a crime caucus” and acknowledging Deukmejian’s key role: “he was very serious and hard-nosed about crime. He wanted to not only put all these criminals in prison but he wanted to keep them there, and that’s why he wanted us to embark on this prison building effort that we did in the ‘80s” (p. 60). Presley created and chaired a new Joint Committee on Prison Construction to institutionalize this effort. He then chaired the Joint Prison Committee and the powerful Senate Appropriations Committee, making Presley the key ally of Governor Deukmejian.
Presley also worked closely with the Prison Authority, the CDCR, and the powerful California Corrections and Peace Officers Association (CCPOA) (Page Reference Page2011). Presley (2003) proudly read in his oral history interview from several plaques these organizations gave him: “To Senator Robert Presley, the Godfather of California Corrections;” “For the Indomitable Interest in Support of California Prison Issues;” “Senator Robert Presley, Who Had the Vision to See the Need For More Prisons Early and the Determination and Skill to Get Them Authorized and Funded” (p. 62). He personally sponsored six prison bills. Although his links to the CCPOA union became controversial, Presley (2003) was unrepentant: “their objectives … and mine are the same: build some prisons; put these folks in prison” (p. 127). Presley ultimately passed legislation for a memorial—located in front of the entrance to the State Capitol building—to more than a thousand deceased and individually named CCPOA members.
Immediately after the Determinate Sentencing Act passed, Presley introduced a bill that lengthened prison terms: “I think we took forty-three major felonies and sex crimes and enhanced those sentences across the board” (p. 50). Still Presley felt blocked, “When we did this shifting from the indeterminate to determinate and then we enhanced those penalties, anybody with any brains at all could see … we’re going to need more prisons” (p. 53). Yet Jerry Brown did not get the prisons built: “Brown would put in his budget every year $100 million for prison construction …. We’d go back and give the money … to do some planning …. I always said: ‘We had great plans but no prisons’” (pp. 53–54).
Deukmejian was elected attorney general in 1978. Parochial concerns about public safety and prison construction continued as his signature issues when he campaigned next for governor against the first African American mayor of Los Angeles, Tom Bradley. Deukmejian cited Bradley’s disagreements with the L.A. police about shootings of Black suspects to identify him as “anti-police” and “soft on crime” (Sonenshein Reference Sonenshein1993, p. 159). If voters elected Bradley, the police threatened mass resignations.
The racially freighted irony of Deukmejian’s political career is that his 1982 election as governor is often remembered as a footnote to the “the Bradley effect” (Payne and Ratzan,1986, Chapter 16 ). While election-day polls projected Bradley to win, Deukmejian was elected. Pollsters blamed voters for refusing to reveal their true intentions: to vote against Bradley because he was African American. Deukmejian had to fire a top campaign official for using this logic to forecast his victory (Payne Reference Payne1988). The controversy reflected the racial tension involved in Deukmejian’s governorship.
In this same election year, a now predominately Republican electorate passed a ballot initiative for a Victims’ Bill of Rights and the legislature authorized six new prisons, including the first state prison for a large California city. The prison was to be sited in downtown Los Angeles, in a Latino neighborhood near the South Central African American neighborhood where conflict with the police was occurring. This prison became an important symbolic issue linking crime and race for Deukmejian’s entire two terms as governor, with Senator Presley leading the Republican-dominated crime coalition. The entrepreneurial dominance of this punishment regime had emerged with the election of George Deukmejian in 1982 and was sustained until 1999 by the subsequent election of Pete Wilson on a similarly “tough-on-crime” platform.
THE FINANCIAL LEVERAGING OF PRISON CONSTRUCTION
As noted, although Governor Brown annually allocated funds for prison construction, Senator Presley was unable by the late 1970s to get this money appropriated for anything more than planning. When voters passed the Proposition 13 “tax revolt” in 1978, Presley (2001-2002, p. 117) further lamented, “the state’s surplus money all went back to cities and counties and school districts.” Presley and Deukmejian wanted more state funds directed to prison construction.
Presley now joined with Deukmejian in advancing general obligation bonds (GOBs) for prison construction. This was an important step in building prisons without immediate onerous tax increases. Barker (Reference Barker2009) notes that the resulting prison ballot initiatives were only one of a barrage of these initiatives in the 1970s and 80s. The bonds deferred and externalized the costs of the retributive punishment desired by punitive voters. Washington (Reference Washington2006) found that voter support for prison bonds in 1986 correlated with Deukmejian’s “tough on crime” reelection campaign against Los Angeles Mayor Tom Bradley, with racially motivated oppositional voting of Whites on both issues. Prison bond ballot initiatives were wedge issues that mobilized voters along the racial cleavages of the California electorate.
Presley and Deukmejian’s strategy was to get the legislature to pass bills authorizing ballot initiatives that placed prison GOBs before an expected majority of “tough on crime” voters: “That’s when we started building prisons with bonds …. Every election cycle—we’d have a bond issue on prison bonds…. It wouldn’t take much effort because the mentality of folks…, they’d see these prison bond issues [as the way] to build prisons…., but I think the first one may have failed in ’90….” (Presley 2001–2002, p. 118). The New Prison Construction Bond Act of 1981 asked California voters for the first time to pass a $495 million dollar GOB ballot initiative.
General obligation bonds are issued with the “full faith and credit” of the state as Guarantor, which is a major reason they require voter approval (Legislative Analyst’s Office 1993, p. 1–19). But voter approval initially was not a problem. During his interview, deputy secretary Craig Brown, who was a key ally in the corrections bureaucracy, recalled his excitement:
Deukmejian was all about public safety – he wanted to build prisons, put people in them, and keep them there …. His Chief of Staff was available at all times to solve administrative problems. We were given a free hand to pick and choose the best and brightest from throughout state government to get the prisons built .… It was the most exciting time in my career. I would rather have built hospitals or schools, but the Governor wanted to build prisons.
Voter support peaked in 1988 for state GOB financing of prisons with an $817,000,000 bond issue. However, in 1990 the legislative leadership floated two ballot initiatives for about a half billion dollars each. The first request passed in June, but the second failed in November. By 1990, anxieties about crime and civil unrest were subsiding, and so was the support needed from voters across the state to pass a continuing stream of large GOB prison bonds. The private sector financial institutions were ready to be of further assistance in this newly evolving political environment.
By the early 1980s, America was entering the Reagan Revolution of financial de-regulation (Reinehart and Rogoff, Reference Reinhart and Rogoff2009), and investment firms were eager to develop the public finance side of their portfolios. Deukmejian’s Deputy Craig Brown indicated that “once the financial firms learned Deukmejian was serious about building prisons, they were all interested.” Another official commented that “most of the larger underwriters with municipal desks, such as L. F. Rothchild, Morgan Stanley, Bank of America, and Merrill Lynch were involved as underwriters—as senior or junior partners.” Thus the financial firms willingly assisted the state in developing a new—and for the firms, more profitable—approach to authorizing and marketing bonds for prison construction.
The new mechanism consisted of lease revenue bonds. LRBs are not backed in the same way as GOBs with “the full faith and credit of the state.” LRBs originally were designed to fund projects with a revenue stream—parking garages, toll roads, and parking meters—to make the interest payments. They converted the leases to ownership following debt repayment. Of course, a prison generates costs rather than revenue. The entrepreneurial “repurposing” of LRBs was made possible in this era of de-regulation by having the CDCR lease the prisons to the state and by covering the interest payments from the corrections budget. The innovation involved the creation of a stream of revenue from an annual appropriation in a state budget and was highly unorthodox. It required a demonstration to establish its credibility.
The precedent-setting demonstration involved an “asset transfer” authorized as a “sale/leaseback” of a prison that already had been completed with a government obligation bond. A corrections official explained: “This was the Southern Maximum Security Complex, a 1000 cell facility built in the early 1980s in Tehachapi. After it was completed, it was refinanced as an asset transfer … for a $90 million lease revenue [LRB] transaction.” This transaction was the plausible basis for a credible evaluation of LRBs by the ratings firms, and “the proceeds were deposited in the 1984 [GOB] bond fund and appropriated to start or complete several other projects funded from this fund (e.g., Avenal, San Diego, CWF [California Women’s Facility], or Solano [prisons]).”
The corrections official went on to explain that the ratings agencies were now willing to approve the novel use of LRBs for new prison construction, albeit with a rating of A1 by Moody's and AA-minus by Standard & Poor's, rather than the GOBs’ typical AAA ratings. “The construction of Mule Creek and Corcoran Prisons were funded later from direct lease revenue bond transactions, as the ratings agencies questions about the … ability of CDCR to manage these large construction projects had been demonstrated.” By “manage,” the official meant that the CDCR had demonstrated its capacity to gain and sustain an annual budget line from the legislature to cover the bond interest payments. For the next decade, LRBs and annual budgeted interest payments were routinely authorized by the state legislature.
Movement of funds between GOB and LRB funded projects further reflected the lightly regulated and fluid financial environment. A footnote to an internal CDCR report explained that: “In most cases, projects received initial start-up/planning funding from other sources such as the General Fund. In cases of lease-revenue funded projects, the initial funding may have included either the General Fund, G.O. Bond Funds, or both.” There was considerable co-mingling of funds, with GOB and LRB funding allocations for prison construction treated as fungible. Senator Presley (2003) explained, “There were pots of money everywhere” (p. 89).
Business Week’s Suzanne Woolley (Reference Woolley Suzanne1992) eventually called the transition from GOBs to LRBs an “End Run Around the Taxpayer.” LRBs had changed the politics of authorization in a way that at least temporarily had neutralized potential anti-tax objections. A successful statewide ballot initiative following a legislative vote was no longer required, as in the case of GOBs, since the LRBs were not backed by “the full faith and credit of the state.” A simple legislative majority sufficed for the LRBs. Local legislators rationalized prison construction costs as a free ride on the state.
To assist the county-based legislators in gaining constituent support, the CDCR offered counties further mitigation funds for community infrastructure, procurement expenditures, free inmate labor, and annual subventions from state tax accounts. It also helped that federal funds for Medicaid and Social Services Block Grants were allocated on the basis of population counts that now included the new locally detained inmates. Gilmore (Reference Gilmore2007) found in Corcoran that 70% of subventions went straight to the city police, including for an officer placed in the high school. Legislators logrolled majority approval with Senator Presley’s endorsement.
Presley sponsored and brokered bills with assistance from Deukmejian. Orange County Assemblyman Richard Robinson, later a lobbyist and investment banker, helped the first “sale/leaseback” bill along with a quote to The Bond Buyer saying that, “The lease revenue bonds are like state general obligations [GOBs] and were treated like GOs by the ratings agencies” (Pierce Reference Pierce1986, p. 4). This ignored the lower rating of LRBs reflecting their absence of “full faith and credit of the state” and their dependency on annual legislative budgetary approval of funds for the bond interest payments. Los Angeles Times reporter, Kenneth Bunting (Reference Bunting1985) nonetheless nonjudgmentally called Robinson “the Legislature’s lawyer” who devised “the creative financing scheme to launch Deukmejian’s ambitious prison construction program.”
The Legislative Analyst’s Office (LAO) (1993, p. 1-19) later corrected Robinson’s characterization of LRBs by explaining that while GOBs pledged the “full faith and credit of the state,” LRBs were funded “with “annual appropriations for debt service payments.” As noted above, the results were typically lower agency ratings for LRBs compared to GOBs, as well as higher interest rates, stipulated reserve funds, mandatory liability insurance, underwriting fees, and issuance costs with negotiated rather than competitive bidding from the financial firms involved. By 1994, the Deukmejian administration had paid investment houses, bond attorneys, and other consultants more than $35 million from the sale of LRBs.
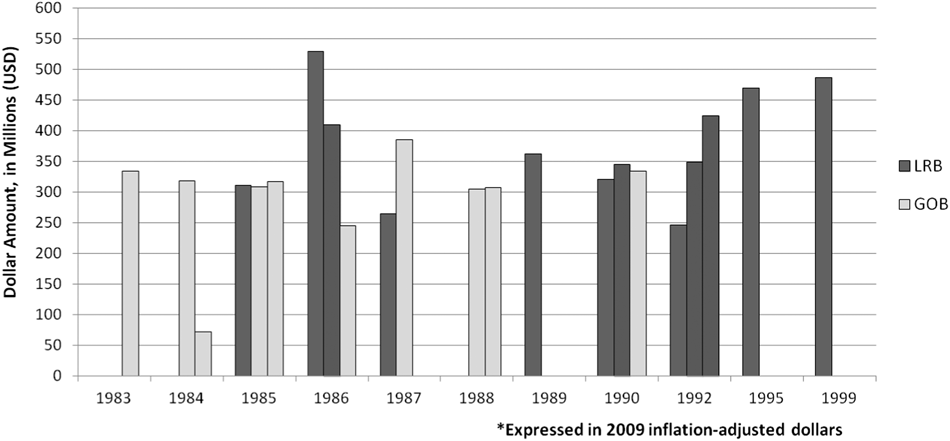
The LAO (1993) estimated that “for every $1billion in capital projects financed with lease-payment bonds instead of GO bonds, the state pays about $250 million to $350 million, or about 15 to 20 percent, more … over the life of the bonds” (pp. 1–21). Local legislators who persuaded their counties to support a prison appropriation did not object. Presley (2003) rationalized that “What we pay is worth it …. To be relatively free of criminals is very, very expensive” (p. 112). The LAO’s estimate of the difference in costs is consistent with results we present in Figure 1, with the increased costs of LRBs relative to GOBs reported in 2009 dollars. The LAO recommended in 1993 that “the legislature … should avoid future situations where lease payment bonds are the only available funding source” (p. 1–2).
GOB and LRB Appropriations for Prisons Constructed in California*
Note: LRB = Lease Revenue Bond; GOB = Government Obligation Bond. Each bar represents a specific appropriation for a new prison to be constructed.
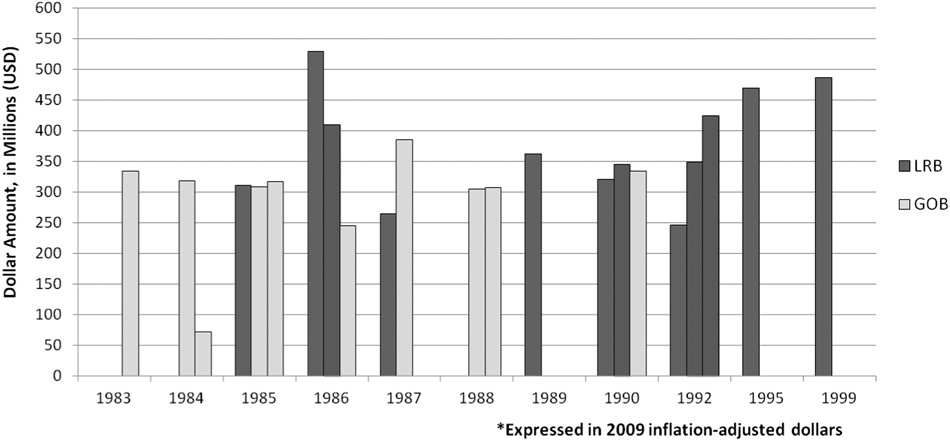
Figure 1 reflects three periods in the leveraging of funding for prison construction, with each bar in the figure indicating whether it was an appropriation for a GOB or LRB and the amount of inflation-adjusted funding involved. The first period is from 1980–1984 when the legislature authorized GOBs for prison construction; the second period is from 1985–1989 when the state jointly authorized GOBs and LRBs for prison building; and 1990–1999 is the third period that began when the second 1990 GOB ballot initiative failed and LRBs were subsequently exclusively used to build prisons—despite the LAO admonition. Newspaper articles criticizing LRBs helped end their use for prison construction in California in the late 1990s.
Figure 1 indicates that in the early 1980s, when only GOBs were available, slightly more than $700 million dollars was appropriated for prison construction. In terms of the overall funding of prison construction, the period of maximum leverage for prison construction was 1985–1989, during Deukmejian’s second term, when both GOBs and LRBs were available. During this period the CDCR was able to use GOB funds appropriated from the initial ballot initiative passed in Deukmejian’s first term to quickly construct new prisons in Solano and Sacramento counties (discussed below). In total, more than three and a half billion dollars was appropriated by GOBs and LRBs for prison construction in this second period. In the third period, from 1990 to 1999, when only LOBs were available, about three billion dollars was nonetheless successfully appropriated for prison building. Overall, nearly three billion dollars was appropriated through GOBs, and more than four billion dollars was appropriated through LRBs. The latter figure indicates the essential importance of the innovation of LRBs in enabling and sustaining the funding of the prison boom through the last decade and a half of the twentieth century in California. Prison construction in California reached a boom level thanks to expanded and sustained LRB financing.
THE SIGNIFICANT ROLE OF VISIBLE MINORITY POPULATIONS
We argue finally that race as well as Republican-driven financial entrepreneurship played a parochial role in influencing the counties involved in the appropriation of funds during the California prison boom. Katherine Beckett (Reference Beckett1977) has chronicled the rising parochial concern about race in national and California politics. She traced this to the Nixon presidential campaigns when “a Republican victory and long-term realignment was possible primarily on the basis of racial issues and therefore suggested the use of coded anti-Black campaign rhetoric” (p. 41). Nixon aide John Ehrlichman (Reference Ehrlichman1982) confirmed that the “subliminal appeal to the anti-Black voter was always present in Nixon’s statements and speeches” (p. 233). Although Carter’s election intervened, Reagan resurrected parochial concerns about race, crime, and punishment when he took to the national stage in 1980.
To fully understand the role played by race in where, why, and how California’s state prisons were ultimately built, it is necessary to start with Governor Deukmejian’s connection to 1982 legislation authorizing a never-to-be-built prison in downtown Los Angeles (Varley Reference Varley2000). The CDCR (1984) insisted the site “was required by the fact that approximately 35% of state prisoners come from Los Angeles County but no prisons are presently located in that county” (p. 2). The radio personality Bill Press (Reference Press1986) elevated parochial anxiety by saying “Los Angeles County breeds 38% of the state’s criminals, but has no place to put them.”
The proposed downtown prison was contentious throughout Deukmejian’s two terms because: (1) Los Angeles actually already housed 12,000 federal and county inmates; (2) no state prison was previously placed in a large city; (3) building prisons was Deukmejian’s signature issue; (4) residents of the Latino neighborhood adjoining the site vigorously resisted; and (5) Deukmejian’s gubernatorial opponent was the Black Los Angeles Mayor Tom Bradley. Senator Presley (2001-2002, p. 68) explained that, “we finally came up with a site downtown …. Then we went over in the Assembly and Gloria Molina…, she just threw a tizzy fit.” Gloria Molina represented the East Los Angeles neighborhood of Boyle Heights, a predominately low-income Mexican American area, and had helped organize the Mothers of East Los Angeles. She mobilized neighborhood residents and took them to protest in Sacramento. Molina also formed a business “Coalition Against the Prison.” She successfully opposed the site throughout Deukmejian’s first term.
However, Deukmejian’s aide told reporters that “it’s a win-win situation … on one of his strength issues,” (Richardson Reference Richardson1986b, p. A-12), and Deukmejian therefore placed the proposed prison at the center of his 1986 reelection campaign (Richardson1986a). He accused Tom Bradley (see Richardson Reference Richardson1986a), as Mayor of Los Angeles throughout the period when this prison was considered, of “standing by and doing nothing” (p. 1) about the need for a state prison in California’s largest city. Deukmejian always anchored his arguments in the premise that “If there is any reason whatsoever for a legislator to be elected and to serve, it’s to protect the public … maintaining some peace and order in the community” (p. 35).
Deukmejian convinced the African American Assembly Speaker, Willie Brown, to initiate an election-connected surprise vote on the prison. Molina was unforgiving, telling the Los Angeles Times (Boyer and Hernandez, Reference Boyer and Hernandez1986) “I never thought Willie would go this far." Deukmejian got the legislature to support him in threatening to block the opening of any new prisons until the Los Angeles prison issue was fully settled. The CCPOA warned that the prisons were dangerously overcrowded and Deukmejian (quoted in Richardson Reference Richardson1986a) forecasted, “This could lead to bloodshed in our prisons.” As the election campaign was about to begin, Deukmejian called a Special Senate Session about the Los Angeles prison.
In mid-session, Deukmejian flew with television crews to the unopened San Diego and Stockton state prisons. Presley (2001-2002) recalled, “I get a call from Deukmejian’s staff… I said, ‘well, I’m the author of the L.A. bill; yes, I’ll go with him’” (p. 68). On the flight, Presley tried a compromise: “I said, ‘Governor, why don’t we build [i.e., fund] two prisons in L.A.? Build one in a Democratic and one in a Republican area.’ … later on that’s what we did” (p. 69 ).
The Los Angeles prison fight reflected racial divisions in the California electorate. Deukmejian had successfully divided his racial/ethnic opposition by pitting the African American Speaker of the Assembly, Brown, against the Latina assembly member, Molina, and he had been able to get the White Democrat Presley to: “barnstorm the state to drum up support” (Richardson Reference Richardson1986b, p. A-12). This foreshadowed the outcome: Deukmejian won reelection in a landslide. When the legislature reconvened, Deukmejian renewed his pledge to build the Los Angeles prison, promising “As long as I’m governor, fighting the reign of criminal terror will be at the very top of California’s agenda.” Presley (2003) considered switching party affiliations, but the Democrats had a secure majority in the state senate and he wanted to remain chair of the Senate Appropriations Committee, “because you have control over every bill that has any appreciable amount of money” (p. 88).
Presley (2003) succeeded in getting his compromise appropriation bill for two Los Angeles prisons passed, but litigation continued throughout Deukmejian’s second term and he never got the downtown Los Angeles prison built. Pete Wilson, Deukmejian’s successor, nonetheless sustained the state-wide prison boom. He had Craig Brown, Deukmejian’s CDCR ally, negotiate a compromise: to forgo the downtown Los Angeles prison in exchange for building three new prisons—Salinas Valley State Prison, High Desert State Prison, and Valley State Prison for Women. “Not bad,” Brown observed in one of our interviews, “three for one!”
Whether the Los Angeles prison was ever built was of doubtful importance. The demographics of this issue were changing the implications of the stalemate. Latinos and African Americans were now moving in substantial numbers into the central and southern parts of the state. Robert Teranishi (Reference Teranishi2005) published a landmark report, Black Residential Migration in California, analyzing trends from 1980 to 2000. He reported that African Americans were leaving the coastal cities (Lopez Reference Lopez2002; Williams et al., Reference Williams, Spiker, Bundi and Skahen2010) and dispersing to suburban and rural settings. The greatest numerical increase of African Americans was occurring in mid- to large-size suburban cities—such as Stockton, Lancaster, and Sacramento—while the largest percentage increase of African Americans was occurring in smaller, rural communities—such as Susanville, Tehachapi, and Calipatria. The latter had very small numbers of African Americans before 1980, but sizable numbers by 2000. The African American population in many counties had doubled and even tripled. Many of these counties were strongly Republican and growing more so. Six of the seven counties (Fresno, Kern, Riverside, Sacramento, San Bernardino, and Solano) with the largest increase in the share of the total African American population were sites for new state prisons.
For Teranishi, the import of the racial migration was educational: “The rapid growth of Blacks in small school districts between 1990 and 2000 has created a critical mass of Black students ….” (2005, p. i). The implications of this “critical mass” were similarly significant for the corrections system and local politicians sensitive to the potential of population changes to provoke feelings of discontinuity, instability, and insecurity—the hallmarks of parochialism.
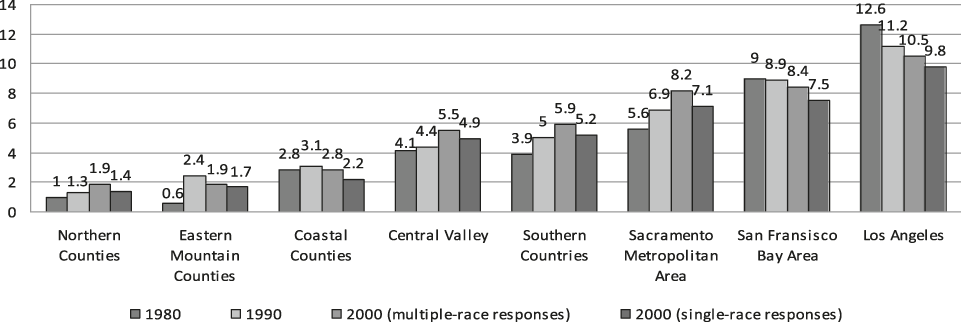
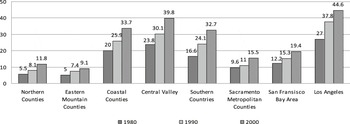
Figure 2b shows Latino population growth across all the major regions of California, including the large coastal urban areas, but with the largest increases in the Central Valley and southern counties. Alternatively, Figure 2a indicates declines in African American populations in the Bay Area and Los Angeles, and increases of African Americans living in the Central Valley, the Southland, and the Sacramento area. Conservative pro-punishment and anti-tax politicians warned of economic as well as social costs associated with increasing numbers of African Americans and Latinos, including costs of law enforcement (Liebman and Clarke, Reference Liebman and Clarke2011).
Percent Black by Region (Source: Lopez Reference Lopez2002:7)
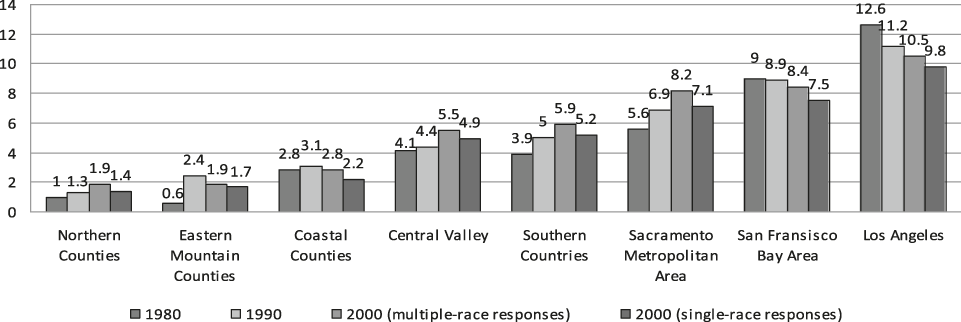
Percent Latino by Region (Source: Lopez Reference Lopez2002:8)

Lawrence De Graaf’s (2001) widely read paper, “African American Suburbanization in California, 1960 through 1990,” noted that, while suburbs could provide a path of upward mobility, there were reasons for concern. Many suburbs were older and more Republican, with deteriorating housing and high unemployment—factors likely to aggravate parochial politics. Many worried these exurban areas would become “mini-ghettos.” The African American population was visibly growing but still modest in size. De Graaf calculated that the number of communities with one-tenth of 1% of the state’s Black population—which he defines as a “significant” presence—had increased from twenty-six to 118 between 1960 and 1980. This was a visible change for the communities involved.
De Graff emphasized that the exurban minority communities were not yet able to provide strong organizations and civic institutions for their new residents, and were therefore perhaps uniquely vulnerable to the parochial politics of racial division. Thus minorities in these communities were insufficiently organized and entrenched to resist the siting of nearby prisons in the same way organizations in Boyle Heights had done in Los Angeles. In the absence of this organized resistance, the Republican-dominated punishment regimes of Deukmejian and Wilson were able to use massively capitalized debt to build prisons in exurban Republican-dominated California counties with growing visible minority communities, thus making possible the imprisonment of an inordinately large and racially disproportionate inmate population in California.
THE CHANGING MAP OF CALIFORNIA IMPRISONMENT
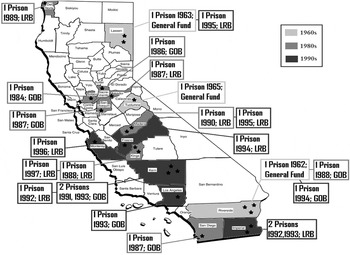
We mapped the temporal sequence of the resulting prison sitings in California from CDCR reports. The map in Figure 3 includes counties with single prisons and clusters of prisons. Our initial interviews suggested that counties with existing prisons might have infrastructure advantages (e.g., water treatment facilities) that made building an added facility less burdensome. While we found no clear evidence for this hypothesis, we did find evidence that the entrepreneurial parochial politics of the Republican regime and race played a role.
Sites and Timing of California Prison Construction
Note: LRB = Lease Revenue Bond; GOB = Government Obligation Bond.

The most compelling qualitative account of early prison placement came from Craig Brown, the career bureaucrat tasked with getting at least one prison built in the first year of Governor Deukmejian’s first term. He chose Solano County State Prison in Vacaville, which was already under construction. Brown reported that it was raining when he made his first site visit. Workers were huddled in trailers and complained about wet conditions delaying construction. Brown returned to Sacramento and ordered a large quantity of lime to be mixed with the mud to form a cement foundation and “kick-start” construction. As the prison neared completion, the last obstacle was obtaining steel doors. Brown ordered wood doors, which were then painted silver. The prison was finished within one year and Deukmejian presided at the dedication.
The factors that led to the appropriation of funds for the Solano site were consistent with our expectation that Republican racial politics played a role. Solano County is within an hour drive of both San Francisco and Sacramento, which led to a “spillover” of population growth. Deukmejian carried the county in 1982, and it had one of the largest and fastest growing African American populations in the state. Between 1970 and 1980, the African American population of Solano County increased from 16,656 to 27,785 (66.8%), and between 1980 and 1990 it increased to 45,839 (another 65%). By 1990, in less than twenty years, the African American population of Solano County nearly tripled. The Latino population nearly doubled.
The historically large African American population of the San Francisco Bay Area was dispersing to the west, resulting in the growth of Black communities in nearby suburban and rural areas. Sacramento County adjoins Solano County and also experienced both a numerical and proportional increase in its African American population (see Figure 2a). African Americans were already present, facilitating a migration chain.Footnote 1 The Latino population of Sacramento County also approximately doubled between 1980 and 2000.
It was therefore not surprising that the next facility built after the Solano State Prison in Vacaville was Sacramento State Prison near Folsom. Deukmejian carried Sacramento County by a comfortable 7% margin in 1982. This institution was named “New Folsom Prison” in deference to the older prison built in 1880. Within two years of his 1982 election, the new governor was able to claim credit for the completion of both of these new prisons, and California continued to build prisons at a rapid rate for the following two decades.
A QUANTITATIVE CODA
We conducted a final proportional hazard analysis. The models we used included key variables from our political economy perspective on appropriation of funds for construction of California’s state prisons. We used data from the Legislative Analyst’s Office to create a file containing county-spells of prison funding appropriations (or censoring). For each county any particular spell contains a number of records representing one year of observation. The first spell begins with the first year of county observation and is closed the year a prison funding appropriation was first approved or at the end of the observation period, whichever comes first. The second spell is open at the end of the year when first appropriation was approved and is closed when a second set of appropriations was secured or at the end of the observation period for the county, whichever comes first. The records cover the period from 1960 to 1999 across all fifty-eight counties in California.
Thus the dependent variable for this analysis is the risk of approval of appropriation of funds in a particular county-year for construction of a specified prison or prison number. Most counties that experience the event of interest do so only once and thus contribute with only one spell. A handful of counties experience multiple appropriations and these contribute with as many spells as appropriations we observe. Estimation proceeds treating each event as distinct using standard conditional likelihood procedure for recurrent events. The prisons constructed with appropriated funds are as indicated in Figure 3.
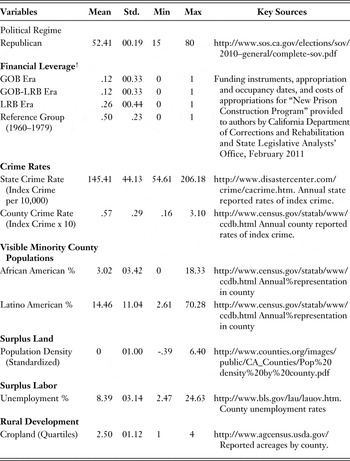
The variables and the primary sources used for their measurement by county and year are indicated in Appendix Table 1. We present results for an index measure of crime as a fixed effect across all counties, because state prisons in any county receive inmates from all over the state. However, we also relaxed this assumption of a fixed effect and allowed a measure of serious crime to vary by county. Regardless, we found no significant crime rate effects, even when we lagged this rate by five, ten, and twenty years. We further included a reduction in cropland measure implied by Gilmore’s agricultural recession model, but as anticipated in our discussion of cropland above, this variable had no significant effect.
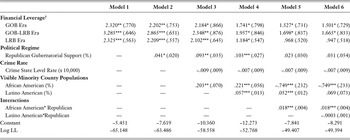
Table 1 presents results of estimating the hazard of funding appropriations for prisons. Model 1 introduces dummy variables representing the three eras (GOB/GOB&LRB/LRB) described in relation to Figure 1 of debt leveraging for prison construction. The risk of an appropriation was significantly heightened when voters for the first time between 1980 and 1984 approved GOBs for this purpose. Exponentiation of the GOB era coefficient in Model 1 indicates that the odds of the California legislature appropriating funds for prison construction during the GOB era were more than ten times higher than during the previous two decades, when the legislature appropriated funding for only three prisons on a “pay as you go” basis. Risk of prison appropriations peaked (in statistical significance and coefficient strength) when the legislature approved LRBs and voters approved GOBs between 1985 and 1989. The legislature acted with and without (i.e., with LRBs as well as GOBs) voters’ approval to maximize leverage of prison funding during this middle period. The odds of appropriation were twenty-seven times higher during this GOB-LRB era than during the 1960s and 1970s. When voters in 1990 rejected a second proposed GOB, the legislature continued to pass LRB appropriations that sustained the boom for nearly another decade. The leveraging strategies for the LRB period increased the odds of prison appropriations for 1990–1999 by more than ten times, marking a return to the level of risk in the GOB period.
Proportional Hazard Models of Appropriations for Prison Placement in California

Note:* p < .05; ** p < .01; *** p < .001. Coefficients using Gompertz Estimation are provided with robust std. errors in parentheses.
† GOB (Government Obligation Bond, 1980–1984) Era; GOB-LRB (Government Obligation and Lease Revenue Bond, 1985–1989) Era; LRB (Lease Revenue Bond, 1990–1999) Era; Reference Group (General Funds, 1960–1979) Era.
Thus the strength of the GOB-LRB coefficient indicates that the combined use of general obligation and lease revenue bonds in the period between 1985 and 1989 marked the most prolific era in the appropriation of funds for building prisons in California history. Nearly half (eleven out of twenty-five) of all California’s prisons were authorized in the 1985–1989 GOB-LRB period. Consistent with our political economy model, this was the period when the risk of California prison construction appropriations peaked. This leads us to ask whether the rising electoral strength of Republican voters also played a role in channeling the supply of newly leveraged funding to Republican counties. After exponentiation, Model 2 indicates that each 1% increase in the county Republican vote for governor significantly increased by about 4% a county’s odds of selection for prison construction. This impact of the Republican county vote also reduced the effect of the peak period of GOB-LRB funding. The implication is that Republican counties disproportionately received newly leveraged construction funds.
We further see in Model 3 that growth of the visible African American population increased the risk of prison construction. Each 1% increase in the local African American population significantly increased by about 23% a county’s odds of selection for prison construction. Like the Republican county vote, African American population also reduced the effect of the peak period of GOB-LRB funding. The percentage of African Americans in county populations also notably reduced the effects in the preceding GOB and following LRB funding eras. The implication is that the visibility of African American population growth, combined with the Republican support for imprisonment, increased the hazard of the allocation of construction funds.
Model 4 extends attention from African American to Latino county populations. While Latino residents of downtown Los Angeles were able to fight and hold off the building of a prison abutting communities of color, this was not the case in the central and southern inland areas. The percentage of Latino population significantly increased the prospects of county prison construction, with a 1% increase raising the odds of a prison appropriation by about 6%. The rise in the Latino American population of counties also further reduced the effect of the peak period of GOB-LRB leveraged funding in 1985–1989, as well as funding in the GOB and LRB periods. The implication is that the visibly growing Latino and African American populations operated in combination with Republican voter support for prison construction to channel the allocation of construction funds.
Finally, Models 5 and 6 of Table 1 introduce interaction terms to consider whether Republican regime voting and African American and Latino populations, respectively, multiplicatively increased the risk of the allocation of county prison construction funds. The first of the interaction terms estimated in Model 5 indicates that the combination of increased Republican votes and African American population significantly raised the odds of allocations to counties for prison construction. This interaction effect is highly significant and it both reduces the Republican main effect below significance and reverses the direction of the African American main effect. The implication is that the support of Republican voters for prison funding was prominently focused on counties with growing African American populations. This interaction at the county level of increased Republican voter support and African American population further reduces the effect of the 1985–1989 peak period of GOB-LRB leveraged funding. Although the main effect of growth in the Latino population is significant in Model 5, its interaction with Republican voting strength is not significant in Model 6, indicating that Model 5 with the Latino additive main effect is the better specification.
Overall, the effect of the peak period in GOB-LRB prison financing in the late 1980s was substantially mediated (as indicated by the reduction in coefficients) by more than 80% by the main effects of Republican voter strength and Latino and African American population growth, as well as the interaction of county African American population with the Republican vote. These main and interaction effects also substantially reduced the GOB and LRB funding era effects, decreasing the effect of LRB funding below statistical significance. These findings support a political economy perspective that traces the Republican-channeled and racially focused role of leveraged state debt in the funding and location of California prison construction.
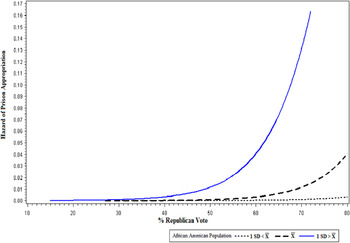
Figure 4 graphs the county-level interaction between voter support for Republican gubernatorial candidates and the African American population on the hazard of an appropriation for prison construction, with other variables set at their mean values. The lines in the figure represent the hazards at one standard deviation above and below average African American population growth. As expected, the lines begin to sharply diverge as the Republican vote increases beyond the majority level. The hazards of prison appropriation were higher in counties with larger Republican majorities and increases in African American populations. The steepness of the curve as the Republican majority rises above 60% is consistent with the occurrence of the peak in California appropriations for prison construction in the 1980s.
Interaction Effect of Percent Republican Vote and African American Population Growth on Hazard of Prison Appropriation During California Prison Boom

DISCUSSION AND CONCLUSIONS
Leveraged debt was the slippery slope of the California prison boom. Creatively financed prison construction made it possible to incarcerate an inordinately large minority inmate population with bond funds that deferred and externalized the costs from the counties where the prisons were built to the state level where the bonds were issued. This satisfied the punitive preferences of parochial Republican voters in these counties, while forestalling anti-tax objections from many of these same voters. The advent of lease revenue bonds turned the initial prison expansion through government obligation bonds into a full-fledged prison construction boom. LRBs did so by replacing the GOB requirement of legislative approval for ballot initiatives followed by a statewide vote with a simpler and more easily attained legislative majority. Senator Presley (2003) boasted that, “People came here from all over the United States and other countries to see how we built prisons—to get ideas” (pp. 73–74).
This article has used oral history, interview, and archival data combined with proportional hazard models to demonstrate how financially leveraged state debt was used by a parochial California Republican political regime focused on personal security to build prisons in counties with growing and locally visible minority African American and Latino populations. The great increase in California imprisonment occurred in the 1980s and 1990s, when the state opened more than twenty prisons and the inmate population jumped by more than 100,000 inmates to over 160,000. The innovation of lease revenue bonds raised the additional capital required for multiple prison construction projects from the mid-1980s, and sustained this construction through the 1990s, fueling the prison explosion. The “3 Strikes Law” was not passed until 1995, and at most accounts for an increase of 25,000 inmates. It is more likely that newly constructed prisons made passing 3 Strikes possible than vice versa.
California was not the first state and George Deukmejian was not the first governor to circumvent the requirement for direct statewide voter approval to build prisons with general obligation bonds. In 1980, Governor Mario Cuomo of New York responded to voter rejection of a GOB prison bond proposal by repurposing the authority of the state’s Urban Development Corporation to issue revenue bonds for public housing. The “revenue” to pay the annual interest on the bonds for prison construction came from the budget of the New York Department of Correctional Services—as would also become the case in California (Pranis Reference Pranis, Herivel and Wright2007).
California assumed a leadership role with its prolific prison construction in the 1980s and 1990s. In the mid-1980s, less than 10% of the nation’s prisons were financed with lease revenue bonds, but by the middle of the following decade, funding for prison construction in America more than doubled—with more than half of this construction paid for through variants of this kind of revenue bond (PublicBonds.org 2004). Kevin Pranis (2007; see also Gottschalk Reference Gottschalk, Rosenfeld, Quinet and Garcia2012) reports that since the turn of the century, no state has constructed a new prison with a general obligation bond and few states have sought direct voter approval for prison building.
The Director of Corrections, Craig Brown, oversaw the ten-year construction program that built more than twenty prisons in the 1980s and 90s. He was a bureaucrat taken with the power of his project, delivering prisons on time and within budget. He boasted “We’re dammed good at it” (Morain Reference Morain1994b, p. A16). Yet Brown’s own acknowledgement of the contingent nature of legislative funding and potential objections suggested his sense that the prison building project might have peaked by the mid-1990s. He remarked, “We don’t view this estimate as destiny…. It doesn’t have to happen” (Morain Reference Morain1994a, A16). Governor Wilson followed a recommendation by Brown in 1994 to put on the ballot a $2 billion GOB to build six more prisons. This initiative failed in the legislature. The overcrowded prison population leveled off at about 165,000 inmates, an apparent recognition of constraints imposed by the limits of prison construction. The financially leveraged building boom was over.
At its peak, Senator Presley boasted that “We call it the Pentagon around here. We say that because it costs so much. It’s like the military” (Morain Reference Morain1994a). The decline of this era coincided with a Los Angeles Times expose (Morain Reference Morain1994d) about the revolving door between state government and the financial sector. Rodney Blonien, who served as an undersecretary of corrections, had moved to a New York-based law firm involved in issuing the debt for prisons initiated during his government employment. Richard Robinson, the former state assemblyman credited with creating the first LRBs, joined an investment house that became a lead underwriter for a prison bond issue. The investment firm of L. F. Rothchild underwrote the first four LRBs at a discount of nearly $20 million. The media finally succeeded in revealing the costs to taxpayers of the deregulated financial innovations introduced by the entrepreneurial political regime.
While Deukmejian never got his downtown Los Angeles state prison built (and in this sense lost his epic symbolic battle), he won a larger war fought along the cleavages and wedge issues of race, law, and order. A key to Deukmejian’s success was that he built on parochial public support for prison construction by highlighting his symbolic struggle against urban ethnic resistance. Governors Deukmejian and Wilson’s Republican regime put this public support to work elsewhere in the state by getting the legislature to authorize a massive financial leveraging of funds involving GOBs and LRBs for prison construction in the inland central and southern parts of the state where Latino and African American populations were growing.
In Los Angles, where the proposed downtown prison was beaten back, the second compromise prison located in Lancaster was completed in 1993. The construction of this prison was ostensibly a deviant case in our hazard models, since the African American population of Los Angeles County declined from about 17 to 11% between 1980 and 2000. However, within Los Angeles County, the African American population of the city of Lancaster actually increased during this period, from 3 to 16%. Section 8 housing grants and aggressive mortgage lending were beginning to fuel a construction boom in this exurban corner of Los Angeles County. The same leveraged financing that was driving construction of prisons in places like Lancaster was also driving the movement of African American homebuyers and renters from the city to exurbia. Leveraged financing—private and public—fostered both housing and prison construction in the exurban regions of central and southern California.
The irony of Deukmejian’s symbolic battle for the Los Angeles prison was that it made so little difference for the CDCR. The Department operates one of the largest fleets of buses in the state. Inmates are ferried back and forth from the prisons to the courts where they are tried. The buses run daily throughout the state. The location of prisons away from urban coastal population centers makes it hard for the families of inmates to visit, but for the CDCR, it is just one more part of an enormous bureaucratic puzzle whose moving pieces multiplied to bureaucratic advantage in number and power during the prison boom years and beyond.
Descriptive Statistics and Sources for Proportional Hazard Models, 1960–2000