



1 Introduction
The mean flow over a rotating disk represents a canonical three-dimensional boundary layer flow which exhibits a cross-flow instability. With the rotating disk, there are two types of convective instabilities that can appear which are designated as Types I and II. The Type I instability originates from the cross-flow component in the boundary layer. The Type II instability arises from centrifugal and Coriolis forces over the rotating disk. Faller (Reference Faller1991) showed that the Type II instability has a lower critical Reynolds number than the Type I instability, namely
 $Re_{c}=49$
versus 285 (without wall suction) (Malik, Wilkinson & Orzag Reference Malik, Wilkinson and Orzag1981). Although the Type II instability is amplified first, its lower amplification rate makes the more amplified Type I instability the dominant mechanism of turbulence transition on the rotating disk.
The Type I instability leads to the growth of stationary and travelling waves that spiral outward towards the edge of the disk. The growth and spatial characteristics of the Type I cross-flow modes are predicted well by linear stability theory, which indicates that the travelling Type I modes are the most amplified. However, the initial amplitudes of stationary cross-flow modes are exceedingly sensitive to surface imperfections (roughness), and therefore, as a result, can be the dominant mechanism for transition to turbulence. The stationary cross-flow modes appear as co-rotating vortices that spiral out from the centre of the disk. The flow visualization of Kohama, Kobayashi & Takamadate (Reference Kohama, Kobayashi and Takamadate1980) provides an excellent example of the stationary cross-flow modes in a rotating disk boundary layer.
Malik et al. (Reference Malik, Wilkinson and Orzag1981) showed that the azimuthal mode number,
 $n$
, of Type I cross-flow modes on a rotating disk increases with Reynolds number according to the linear relationship
 $$\begin{eqnarray}n={\it\beta}Re,\end{eqnarray}$$
where
 ${\it\beta}=0.0698$
is the most amplified azimuthal wavenumber and
 $Re$
is the Reynolds number, defined as
 $$\begin{eqnarray}Re=r\left(\frac{{\it\omega}}{{\it\nu}}\right)^{1/2},\end{eqnarray}$$
where
 $r$
is the local radius on the disk,
 ${\it\omega}$
is the angular velocity at the surface of the disk at radius
 $r$
and
 ${\it\nu}$
is the kinematic viscosity of the air over the disk. For a fixed rotation speed, therefore,
 $r\propto Re$
.
One of the first experimental investigations of Type I cross-flow modes on a rotating disk was performed by Smith (Reference Smith1946). Gregory, Stuart & Walker (Reference Gregory, Stuart and Walker1955) followed up with an experimental and theoretical investigation. Utilizing a china-clay surface visualization technique, they revealed two critical radii, one within which the flow was purely laminar, and the other outside which the flow was fully turbulent. In between, they recorded the presence of 28–31 spirals equally spaced around the disk, with a spiral angle of
 $14^{\circ }$
. The outboard radius where the boundary layer was turbulent was at
 $Re\simeq 530$
.
Surface visualization techniques such as china clay generally reveal stationary cross-flow modes. Wilkinson & Malik (Reference Wilkinson and Malik1985) traced the origin of stationary cross-flow modes to minute dust particles randomly placed on the surface of the disk. This affected the transition Reynolds number, lowering it from a maximum of 556 on a ‘clean’ disk to 530 on a ‘less clean’ disk.
Corke & Knasiak (Reference Corke and Knasiak1998) and Corke & Matlis (Reference Corke and Matlis2006) exploited the sensitivity of the stationary cross-flow modes to surface roughness by depositing arrays of ink dots on the disk surface to enhance a narrow band of azimuthal and radial wavenumbers. The measured velocity fluctuation time series were decomposed into stationary and travelling components, and their development was documented in the linear and nonlinear growth stages leading up to turbulence. In the nonlinear stage, they documented a resonant phase locking between pairs of stationary and travelling modes, and low-azimuthal-wavenumber stationary modes,
 $3\leqslant n\leqslant 5$
, that were evident at transition in the classic rotating disk flow visualization of Kohama et al. (Reference Kohama, Kobayashi and Takamadate1980). This is further discussed by Corke, Matlis & Othman (Reference Corke, Matlis and Othman2007).
Lingwood (Reference Lingwood1995) was the first to discover the absolute instability of travelling cross-flow modes on the rotating disk while performing linear stability analysis that included Coriolis and streamline curvature effects. She predicted a critical Reynolds number for the absolute instability of
 $Re_{c_{A}}=513$
. This was later corrected to be
 $Re_{c_{A}}=507.3$
(Lingwood Reference Lingwood1997), which was verified in numerical flow simulations by Davies & Carpenter (Reference Davies and Carpenter2003) and Pier (Reference Pier2003). These indicated that a critical Reynolds number (or critical radius for a given rotation speed) existed at which disturbances grew temporally, leading to an unbounded linear response and presumably turbulent transition.
Although the existence of the absolute instability of the boundary layer over a rotating disk is not in dispute, its role in transition to turbulence remains a question. Lingwood (Reference Lingwood1995) observed that the transition location in a number of experiments based on flow visualization was within
 $\pm 3\,\%$
of the absolute instability critical radius. Lingwood therefore surmised that the absolute instability was responsible for the onset of turbulence in this flow. However, as pointed out in the careful low-disturbance experiments of Wilkinson & Malik (Reference Wilkinson and Malik1985), transition occurred as high as
 $Re=556$
, or approximately 9 % higher than
 $Re_{c_{A}}$
. This result suggested that the absolute instability is not the cause of transition to turbulence in the rotating disk boundary layer.
Lingwood (Reference Lingwood1996) performed an experimental study designed to capture the temporal growth associated with the absolute instability. This involved introducing unsteady disturbances into the boundary layer and following their development in space and time. The unsteady disturbance was a short-duration air pulse that emanated from a hole in the disk surface. The pulse occurred once every disk rotation, with every passage of the hole in the disk over the air source. The location of the pulse was just outboard of the minimum critical radius for Type I cross-flow modes. Lingwood followed the evolution of the azimuthal velocity fluctuations with a hot-wire sensor placed at different radial and azimuthal distances from the air pulse. Ensemble averages of the time series, correlated with the azimuthal position of the air pulse, revealed wavepackets. When the leading and trailing edges of the wavepackets were presented in terms of their Reynolds number (radius) and time (azimuthal position with respect to the disk rotation speed) they revealed a tendency for an accelerated advancing of the trailing edge. Unfortunately Lingwood’s measurements stopped short of the critical radius of the absolute instability. However, Lingwood extrapolated the growth of the wavepacket and suggested that the growth was tending towards pure temporal. She took this to be evidence that the transition to turbulence was the result of the absolute instability.
A different picture has emerged following numerical simulations by Davies & Carpenter (Reference Davies and Carpenter2003). They solved the linearized Navier–Stokes equations for conditions of the rotating disk flow using the velocity–vorticity method introduced by Davies & Carpenter (Reference Davies and Carpenter2001), in which they introduced a small impulsive disturbance. When assuming a spatially inhomogeneous flow, the numerical results initially agreed well with those of Lingwood (Reference Lingwood1995). However, instead of the unlimited temporal growth that one would expect from an absolute instability at
 $Re_{c_{A}}$
, the temporal growth saturated. Based on this, Davies & Carpenter (Reference Davies and Carpenter2003) surmised that the absolute instability was not the mechanism of transition to turbulence, and instead the transition was due to the earlier growing Type I modes.
Following Lingwood (Reference Lingwood1996), Othman & Corke (Reference Othman and Corke2006) experimentally investigated the absolute instability of the rotating disk boundary layer. Rather than introducing temporal disturbances through a hole in the disk, they utilized an air pulse through a hypodermic tube that was located outside the boundary layer. This avoided the effect of having a hole in the disk surface which was observed by Wilkinson, Malik & Orzag (Reference Wilkinson, Malik and Orzag1981) to create a stationary disturbance wedge that could locally modify the mean flow. In addition, because the external air pulses used by Othman and Corke were not triggered at a particular disk rotation position, they de-emphasized imperfections in the disk surface (roughness and waviness) that would emerge in the ensemble-averaged velocity time series used to correlate the development of disturbance wavepackets.
Othman & Corke (Reference Othman and Corke2006) utilized a hot-wire sensor that was placed at different radial and azimuthal locations to follow the growth of azimuthal velocity disturbances in space and time. The results for a low-amplitude pulse revealed that the spreading of the disturbance wavepacket did not continue to grow in time as
 $Re_{c_{A}}$
was approached. Rather, the spreading of the trailing edge of the wavepacket decelerated and the wavepacket amplitude asymptotically approached a constant value. This result supported those of Davies & Carpenter (Reference Davies and Carpenter2003).
Pier (Reference Pier2003) conducted a secondary instability analysis for the rotating disk flow that was perturbed by finite-amplitude cross-flow vortices that were expected to develop through the absolute instability mechanism. He showed that the perturbed flow was itself absolutely unstable, thus providing a possible explanation for the absence of a dominant temporal frequency due to the primary absolute instability in physical experiments. The higher initial amplitude case of Othman & Corke (Reference Othman and Corke2006) was aimed at examining the effect of the finite-amplitude disturbances. The wavepackets in that case displayed an abrupt increase in the maximum amplitude just beyond
 $R_{c_{A}}$
that was not present at the lower initial amplitude, which suggested that the development was not purely convective. Although the most amplified frequencies appeared to be weakly nonlinear, the higher frequencies which were expected to be absolutely unstable continued to show linear characteristics with the higher initial amplitude. Therefore, the conditions did not appear to satisfy those needed to excite a global instability.
In an effort to explain the variability of the results on the role of the absolute instability on transition, Healey (Reference Healey2010) performed investigations of the linearized complex Ginzburg–Landau equation to model the propagation of a wavepacket through a weakly inhomogeneous unstable medium which applied to the rotating disk boundary layer. The results demonstrated that as a result of strong detuning of the absolute frequency, an absolutely unstable wave is only absolutely unstable over a finite range of radii, whereupon it reverts back to a convectively unstable wave. As suggested by Davies, Thomas & Carpenter (Reference Davies, Thomas and Carpenter2007), this detuning exerts a strong stabilizing influence. However (Healey Reference Healey2010) went on to indicate that boundaries (like the edge of a finite disk) can strongly affect the global modes, and suggested a correlation between the Reynolds numbers at transition and that at the edge of the disk.
In order to investigate this further, Imayama, Alfredsson & Lingwood (Reference Imayama, Alfredsson and Lingwood2013) performed rotating disk experiments with different edge configurations which included an open edge and a non-rotating extension of the disk surface. The edge Reynolds number was varied by changing the disk r.p.m. The mean azimuthal velocity profiles were found to be affected at radii that were within 5 mm (10 boundary layer units) of the disk edge. Otherwise, their general conclusion was that Healey’s (Reference Healey2010) suggested correlation between the disk edge and transition Reynolds numbers was weak, if present at all.
Pier (Reference Pier2013) weighed in on this issue with an experimental investigation which emphasized measurements in the region closely surrounding the edge of the disk. A particular emphasis was placed on defining the onset of natural velocity fluctuations. Not surprisingly, the edge of the disk was found to be a strong source of fluctuations. With regard to the onset of transition, the results possibly pointed towards a weakly stabilizing edge effect predicted by Healey (Reference Healey2010), which Pier also points out could be a negligible effect. Thus Pier concludes that Healey’s theory cannot be confirmed, and also any attempt to compare data obtained through different experiments and transition criteria cannot be justified. Such criteria have been the subject of investigations by Siddiqui et al. (Reference Siddiqui, Mukund, Scott and Pier2013) and Imayama, Alfredsson & Lingwood (Reference Imayama, Alfredsson and Lingwood2014).
Motivated by this exchange, Appelquist et al. (Reference Appelquist, Schlatter, Alfredsson and Lingwood2015) performed a linearized Navier–Stokes simulation of the boundary layer over the rotating disk to seek to document global instability growth. In addition to radial outward travelling modes, it investigated disturbances from the edge of a finite disk that could propagate radially inward. They concluded that there is a linear global instability provided that the Reynolds number at the edge of the disk is sufficiently larger than the critical Reynolds number for the onset of absolute instability. In this, presumably the velocity disturbances produced at the edge of the disk feed the instability.
The first theoretical study of suction on a rotating disk was performed by Stuart (Reference Stuart1954). Stuart showed that the boundary layer thinned with the addition of suction, defined by a suction parameter,
 $a=-v_{z0}/\sqrt{{\it\nu}{\it\omega}}$
, where
 $-v_{z0}$
is the wall-normal velocity at the disk surface. He observed that the radial and azimuthal flow decreased with increasing suction. However, he indicated that there was no significant change in the shape of the azimuthal or radial velocity profiles, so that he expected that the region of laminar flow would not be increased. Later, Dhanak (Reference Dhanak1992) performed a theoretical investigation on the effects of uniform suction on the stability of a rotating disk. He obtained exact linear equations governing the development of infinitesimal disturbances to the steady flow on a rotating disk. A parallel-flow approximation was used to determine the effect of suction on the instability. This indicated that suction had a stabilizing effect. The wave angle of spiral instability waves was shown to decrease with increasing suction.
The first theoretical investigation on the effect of suction on the absolute instability of a rotating disk boundary layer was performed by Lingwood (Reference Lingwood1997). Using linear stability analysis, she calculated the critical radii at which the onset of absolute instability occurs for different values of suction. Based on this, she concluded that suction had a stabilizing effect on the stationary and travelling Type I modes, and stationary Type II modes. With regard to the absolute instability, wall suction increased
 $Re_{c_{A}}$
, for example from 507.3 for
 $a=0$
to 803.0 for
 $a=0.4$
. Wall blowing would similarly decrease
 $Re_{c_{A}}$
.
Thomas (Reference Thomas2007) and later Thomas & Davies (Reference Thomas and Davies2010) also performed theoretical investigations of the effect of suction on the rotating disk boundary layer. They solved the problem assuming both parallel and non-parallel flows. The parallel-flow solutions matched those of Lingwood (Reference Lingwood1997). However, the non-parallel-flow simulations resulted in somewhat unexpected behaviour whereby disturbances placed within the region of absolute instability exhibited temporal growth and radial inward propagation. They observed that the flow was globally stable when
 $a\leqslant 0$
, and very clearly globally unstable when
 $a=1$
. Verification of globally unstable flow at lower suction parameters was more difficult for them to assess because of prohibitively long simulation times, although they determined that with
 $a=0.5$
the flow was most likely globally unstable.
Gregory & Walker (Reference Gregory and Walker1953) performed an early experimental study on the effect of wall suction on a rotating disk. Their disk was 36 in. in diameter, of which 28 in. was porous. The disk had 0.5 in. diameter holes drilled through in an evenly spaced azimuthal ring pattern. These holes communicated between the measurement side of the disk and an enclosure on the underside of the disk. The enclosure was
 $7~\text{ft}\times 7.5~\text{ft}\times 1~\text{ft}$
deep. The measurement side of the disk was covered by a perforated aluminium sheet with 30 0.125 in. diameter holes per square inch. This was then covered by a metal woven wire cloth that was dry-mounted onto the perforated aluminium sheet. The other surface of the disk consisted of a dural skin that was 0.0625 in. thick. It included 72 evenly spaced 0.004 in. wide radial slits that were cut in the dural skin between the 3 and 14 in. radius circles. Suction was applied by lowering the pressure in the enclosure.
Gregory and Walker used a hot-wire anemometer and a microphone probe to investigate the state of the boundary layer in their experiment. Using the slitted surface disk at rotational speeds between 550 and 1250 r.p.m., they found that with a suction parameter of
 $a=0.4$
, the turbulent transition Reynolds number increased from 524 to 632. This contradicted Stuart (Reference Stuart1954), who postulated that there would be little effect of suction on the boundary layer stability. The transition Reynolds number of 632 observed in this experiment was less than the
 $Re_{c_{A}}=803$
that would be expected to occur with the
 $a=0.4$
suction parameter. Therefore, this did not provide proof of the global absolute instability with suction on the rotating disk.
Given this background, the object of our research was to experimentally investigate the effect of wall suction on the growth of Type I travelling cross-flow instability modes in the boundary layer on a rotating disk. Specifically, it was designed to determine the effect that wall suction had on the absolute instability, and whether it led to a globally unstable flow as postulated by Thomas (Reference Thomas2007) and Thomas & Davies (Reference Thomas and Davies2010). The experimental approach would be designed to capture the temporal growth of disturbance wavepackets that would be associated with the absolute instability at
 $Re_{c_{A}}$
. This would involve introducing unsteady disturbances into the boundary layer inboard of
 $Re_{c_{A}}$
, and following their development in space and time. We proposed to utilize the technique of Othman & Corke (Reference Othman and Corke2006), which introduced the disturbances from outside the boundary layer. The amplitudes of the disturbances would be verified to satisfy the linear stability assumptions used in the analysis of the absolute instability (Lingwood Reference Lingwood1995; Thomas Reference Thomas2007; Thomas & Davies Reference Thomas and Davies2010). The spectral content of the disturbances would be designed to cover the most amplified range of Type I cross-flow modes and absolutely unstable modes. Comparisons would then be made with the wavepacket development without suction, documented by Othman & Corke (Reference Othman and Corke2006).
2 Experimental set-up
The experiment was designed to produce conditions on the rotating disk so that the critical radius of the absolute instability with a particular suction parameter would be on the disk. The location of the absolute instability is a function of the suction parameter,
 $a$
, which determines
 $Re_{c_{A}}$
. For a fixed disk diameter, the disk r.p.m. determines the radius on the disk where
 $Re_{c_{A}}$
occurs. In our case, the diameter of the disk was 62.23 cm (24.5 in.). At a chosen suction parameter of
 $a=0.2$
,
 $Re_{c_{A}}=650$
. A disk r.p.m of 826 was then chosen, which would place
 $Re_{c_{A}}$
at the disk radius of
 $r_{c_{A}}=27.85~\text{cm}$
, which was 90 % of the disk radius. The
 $r_{c_{A}}$
was then 33 mm from the edge of the disk, which was then six times further than the distance where (Imayama et al.
Reference Imayama, Alfredsson and Lingwood2013) observed an effect on the mean velocity profile. In addition, the wall suction extended beyond
 $r_{c_{A}}$
to further minimize the possibility of disturbances propagating inward from the disk edge. The disk conditions are summarized in the table in figure 1(b). Figure 1(a) shows the region of the porous surface where wall suction was applied relative to the two critical radii: (1) that of the minimum critical Reynolds of the Type I cross-flow mode without suction,
 $Re_{c_{I}}$
, and (2) the critical Reynolds number of the absolute instability for
 $a=0.2$
,
 $Re_{c_{A}}$
. We note that the suction starts just outboard of
 $Re_{c_{I}}$
, and extends outboard of
 $Re_{c_{A}}$
.
Rotating disk with wall suction design conditions.

The rotating disk was fabricated from a 3.15 cm (1.25 in.) thick die-cast aluminium plate. The design of the disk to allow uniform suction through the surface followed the concept of Gregory & Walker (Reference Gregory and Walker1960). Details of the design of the rotating disk are presented in appendix A.
A traversing mechanism was used to move a hot wire through the boundary layer over the disk. Two separate stepper motors controlled the placement of the hot wire in the radial and wall-normal directions over the disk. The wall-normal motion further utilized a Schaevitz 125 DC-EC linear variable differential transformer to provide feedback on the position. The accuracy of the wall-normal motion was
 $1.43\times 10^{-4}~\text{mm}$
. There was no feedback on the horizontal motion, but tests on the motion concluded that its repeatability was within one motion step or 0.002 mm. The accuracy and repeatability of both directions of motion were verified using a Keyence LS-7600 high-precision digital micrometer.
The hot wire was operated in a constant-temperature mode using a Dantec 56C01 CTA unit. The overheat ratio used for the experiments was 1.5. The hot-wire sensor consisted of a 0.00381 mm (0.00015 in.) diameter platinum-coated tungsten wire that was soldered to the ends of the broaches. The broaches were more than 20 times longer than the boundary layer thickness in order to minimize any passive effect of the probe body on the flow.
For optimum resolution, the anemometer output was divided into AC and DC signals. The AC signal was obtained by passing the analogue signal through a band-pass filter with the high-pass frequency cutoff set to remove the DC (
 ${\geqslant}0.1~\text{Hz}$
) and the low-pass frequency cutoff set at one-half the sampling frequency to prevent frequency aliasing. The filtered AC signal was amplified to use the full range of the analogue-to-digital (A/D) converter and thereby minimize digital quantization error. The DC containing signal was separately DC shifted and amplified. Following this analogue conditioning, the AC and DC signals were input to the A/D converter in the data acquisition and control computer (DAQ). Data acquisition and control was performed by a United Electronic Industries DNA-PPC5 ethernet DAQ. This included a 16-bit A/D and a 32-bit D/A converter. These were operated using specially developed software that controlled the traversing mechanism, hot-wire anemometer voltage acquisition and the generation of air pulses used in producing disturbance wavepackets.
The hot wire was calibrated in a dedicated calibration jet facility. The calibration was performed over the full range of velocities that encompassed the maximum disk velocity. The velocity–voltage pairs from the hot-wire calibration were best-fitted to a fourth-order polynomial which became the calibration relation between hot-wire voltage and velocity in the disk experiments. The uncertainty of the calibration was
 $0.01~\text{m}~\text{s}^{-1}$
. The hot wire was oriented in the disk experiments to be primarily sensitive to the azimuthal velocity component.
Schematic of the air-pulse disturbance generator (a) and the ensemble-averaged pulse duration with time normalized by the disk rotation period,
 $T$
(b).

As mentioned above, the method for introducing temporal disturbances into the boundary layer was based on that developed by Othman & Corke (Reference Othman and Corke2006). A schematic of the system is shown in figure 2(a). A specially designed hypodermic tube was positioned above the disk outside the boundary layer. The hypodermic tube had a 0.2 mm inside diameter and was part of an assembly that was rigidly held from a mount on the traversing mechanism. Both the wall-normal and radial positions of the hypodermic tube were adjustable. The air pulse came from a regulated pressure source. Two solenoid valves controlled the duration of the pulse. One solenoid valve was normally open and the other one was normally closed. Square-wave time series were sent to the valves. The combination of the two square waves controlled the duration of the air pulse. That control plus the source pressure level gave the necessary control to produce linear amplitude disturbances in the boundary layer. The ensemble-averaged velocity pulse duration for one disk rotation is shown in figure 2(b). This was obtained by placing a hot-wire sensor near the exit of the hypodermic tube. For all of the measurements, the distance of the air-pulse jet from the disk surface was 4 mm, which corresponded to
 $z^{\ast }=9.3$
. Based on mean velocity profiles at the radial location of the air-pulse jet, this corresponded to approximately three times the boundary layer height.
2.1 Computational fluid dynamic simulation disk design
Prior to fabricating the disk, computational fluid dynamic (CFD) simulations were performed to aid in the design of the suction system. The objective was to design a system that could produce a region of uniform wall suction around the location of
 $Re_{c_{A}}$
. The details of the simulation are presented in appendix B.
The simulation was performed for the disk spinning at 1500 r.p.m., corresponding to
 ${\it\omega}=157.1~\text{s}^{-1}$
. This was an upper limit for the rotating disk set-up at which a suction parameter of
 $a=0.4$
located the
 $Re_{c_{A}}=803$
over the suction portion of the disk, at
 $r_{c_{A}}=25.5~\text{cm}$
. In this case, for
 $a=0.4$
,
 $v_{z_{0}}=-2~\text{cm}~\text{s}^{-1}$
. This r.p.m. condition was meant to represent a worst case with regard to any induced flow within the enclosure that would influence the distribution of suction through the holes in the disk.
A first validation of the rotating disk simulation simply involved comparing the resulting boundary layer mean velocity profiles against those of the exact solution for a solid disk, without through holes. The result is shown in figure 3, where the symbols represent the simulation results and the curves represent the exact solution corresponding to the standard normalized radial,
 $H$
, tangential (azimuthal),
 $F$
, and axial,
 $G$
, velocity components. The simulation results and exact solution were found to agree very well.
Validation of simulation boundary layer profiles against the exact solution for a solid rotating disk.

Following this validation with a solid disk, the simulation was used to investigate the sensitivity of the radial pressure gradient over the measurement side of the disk to the suction enclosure dimension. The disk in the simulation included the through holes between the measurement and the underside of the disk. The wire mesh covering over the holes was not included in this simulation. Two different enclosure sizes were investigated: the first was 5 ft
 $\times$
5 ft, which matched that of Gregory & Walker (Reference Gregory and Walker1960), and the second was twice as large (10 ft
 $\times$
10 ft). Both enclosures had a depth of 15 in. The initial static pressure in the enclosure was set to be atmospheric. The results are shown in figure 4. The rotation of the disk caused a lowering of the pressure in the enclosure which resulted in air being drawn through the holes from the measurement side of the disk. The wall-normal velocity normalized by the maximum value,
 $v_{z}/v_{z_{max}}$
, is shown as a function of the radial position on the disk. The simulation indicates that doubling the size of the enclosure below the disk would not change the radial uniformity by an appreciable amount. As a result, the smaller enclosure size was used in the experiment.
Simulation results of the effect of the under-disk enclosure size on the radial distribution of wall-normal velocity through the holes through the disk with rotation. The wire mesh covering was not included.

As indicated previously, Gregory & Walker (Reference Gregory and Walker1960) had used a porous wire mesh to cover the suction holes in the disk. The simulation was then used to investigate this aspect, in both the necessity and the degree of the added pressure drop over the holes. Figure 5 shows the simulation results without the holes covered. This is for the smaller 5 ft planform enclosure, and without active suction. The simulation indicates fairly large passive suction with velocities ranging from 2 to
 $4~\text{m}~\text{s}^{-1}$
. In addition, the simulation reveals some passive blowing that occurs in the radially inboard side of the holes through the disk. Detailed analysis of this indicated a small separation bubble near the top edge of the holes.
The characteristics of the different wire mesh coverings investigated for the disk.

The results in figure 6 are for the same conditions as figure 5 except for the addition of a pressure drop corresponding to a pressed wire mesh screen with the characteristics of LFM-25 in table 1 placed over the holes. Immediately apparent in the results is a two-order-of-magnitude reduction of the passive suction velocity with the addition of the pressure drop producing mesh covering. In addition, except at the most outboard location, there is no passive blowing through the holes. This justifies the use of the porous mesh covering by Gregory & Walker (Reference Gregory and Walker1960).
In this simulation, the target
 $v_{z_{0}}=-2~\text{cm}~\text{s}^{-1}$
resulted in
 $Re_{c_{A}}=803$
. The simulation indicated that that suction velocity was achievable, and that the suction velocity was relatively constant near the target radius. This was the final step in solidifying the design of the rotating disk with wall suction set-up.
Radial distribution of wall-normal velocity at the disk surface, with rotation and without active suction or a wire mesh covering.

Radial distribution of wall-normal velocity at the disk surface, with rotation, a wire mesh covering and suction with
 $a=0.4$
.

3 Experimental results
3.1 Basic flow with suction
The challenge in the experiment was to have surfaces on the measurement side of the disk that were (1) porous, (2) smooth and (3) uniform in thickness. As discussed in the introduction, the stationary cross-flow modes are highly receptive to surface roughness. Wall suction, which thins the boundary layer, makes the requirement on achieving a smooth surface critically important. Furthermore, wall suction increases
 $Re_{c_{A}}$
, meaning that laminar flow needs to be maintained out to larger radii. The uniformity of the thickness of the porous sheet covering the disk is important to allow hot-wire measurements as close as possible to the disk surface. The requirement on the thickness uniformity was a deviation of less than 0.13 mm in order to resolve the peak in the cross-flow mode wall-normal eigenfunction that occurs at
 $z^{\ast }\simeq 1.5$
.
A number of porous measurement surfaces had been investigated. They consisted of an uncovered compressed wire mesh, the same compressed wire mesh with two different stretched fabric coverings, and the same compressed wire mesh that was covered by a 1.6 mm thick sheet of porous high-density polyethylene. The polyethylene sheet had a
 $20~{\rm\mu}\text{m}$
pore size. The uncovered compressed wire mesh surface was comparable to one of the surfaces used by Gregory & Walker (Reference Gregory and Walker1960).
These different surfaces were examined in terms of (1) the ability to match theoretical wall-normal velocity profiles with different suction parameters and (2) the ability to maintain laminar flow out to the vicinity of the radius location of
 $Re_{c_{A}}$
. Of these, the second became the greater challenge, since even minute surface roughness could result in dominant stationary cross-flow modes that would lead to turbulent transition inboard of the
 $Re_{c_{A}}$
location. This is presumed to be what occurred in the suction experiments of Gregory & Walker (Reference Gregory and Walker1960), in which transition was reported to occur well inboard of what would have been
 $Re_{c_{A}}$
for their
 $a=0.4$
suction parameter.
Of the four surfaces examined, only the polyethylene sheet was smooth enough to maintain laminar flow out to a radius close to
 $Re_{c_{A}}=650$
with the desired suction parameter of
 $a=0.2$
. Unlike the stretched fabric coverings, the polyethylene sheet was semi-rigid and therefore could not be stretched over the disk surface. Instead, the sheet was bonded to the solid centre portion of the disk, and clamped by a ring at the outer edge of the disk. The outer clamping ring was the same as that shown with the fabric covering in figure 23(d). An issue with the polyethylene sheet was that it was not precisely uniform in thickness. As a result, there was a slight once-per-revolution waviness of the surface of 0.08 mm. This did not appear to affect the character of the cross-flow instability. However, it limited how close to the disk surface the hot wire could be traversed. In general, measurements down to the location of the maximum azimuthal velocity fluctuation,
 $z^{\ast }\simeq 1.5$
, were achievable.
Mean azimuthal velocity measurements were performed over the polyethylene sheet that covered the disk in order to compare them with the theoretical velocity profile, as well as previous measurements of Gregory & Walker (Reference Gregory and Walker1960). In order to compare with Gregory and Walker, the measurements were taken at the location on the disk where
 $Re=319$
. To accomplish this, the disk r.p.m. was reduced to 600, which corresponded to
 ${\it\omega}=62.8~\text{s}^{-1}$
. The results are shown in figure 7 for a desired
 $a=0.2$
suction parameter. The wall coordinate and mean azimuthal velocity are presented in similarity form,
 $z^{\ast }=z({\it\omega}/{\it\nu})^{1/2}$
and
 $\overline{U}_{{\it\theta}}/(r{\it\omega})$
respectively. The theoretical mean azimuthal velocity profiles are shown by the different curves corresponding to different suction parameters. These were found by the solution of the four ordinary differential equations governing the viscous mean flow over a rotating disk in similarity variables (Schlichting Reference Schlichting1968), namely
 $$\begin{eqnarray}\displaystyle & \displaystyle F^{2}-G^{2}+F^{\prime }H-F^{\prime \prime }=0, & \displaystyle\end{eqnarray}$$
 $$\begin{eqnarray}\displaystyle & \displaystyle 2FG+G^{\prime }H-G^{\prime \prime }=0, & \displaystyle\end{eqnarray}$$
 $$\begin{eqnarray}\displaystyle & \displaystyle P^{\prime }+H^{\prime }H-H^{\prime \prime }=0, & \displaystyle\end{eqnarray}$$
 $$\begin{eqnarray}\displaystyle & \displaystyle 2F+H^{\prime }=0, & \displaystyle\end{eqnarray}$$
 $$\begin{eqnarray}u=r{\it\omega}F({\it\zeta}),\quad v=r{\it\omega}G({\it\zeta}),\quad w=\sqrt{{\it\nu}{\it\omega}}H({\it\zeta}),\end{eqnarray}$$
 $$\begin{eqnarray}\displaystyle p=p(z)={\it\rho}{\it\nu}{\it\omega}P({\it\zeta})\end{eqnarray}$$
and
 ${\it\zeta}=z({\it\omega}/{\it\nu})^{1/2}$
. The standard boundary conditions were used, namely
 $$\begin{eqnarray}\displaystyle & \displaystyle {\it\zeta}=0:\quad F=0,\quad G=1, & \displaystyle\end{eqnarray}$$
 $$\begin{eqnarray}\displaystyle & \displaystyle P=0,\quad H=-a; & \displaystyle\end{eqnarray}$$
 $$\begin{eqnarray}\displaystyle & \displaystyle {\it\zeta}=\infty :\quad F=0,\quad G=0. & \displaystyle\end{eqnarray}$$
 $F^{\prime }(0)$
and
 $G^{\prime }(0)$
from Dhanak (Reference Dhanak1992) were used based on the different suction parameters,
 $a$
.
Wall-normal profiles of the azimuthal velocity at
 $Re=319$
for
 ${\it\omega}=62.8~\text{s}^{-1}$
and
 $a=0.2$
.

For the present results at
 $Re=319$
in figure 7, the measured azimuthal velocity profile follows the shape of the theoretical profile for the intended
 $a=0.2$
reasonably well. We note that some points fall between the
 $a=0.2$
and
 $a=0$
theoretical profiles. As is evident, the differences between the two theoretical profiles, as well as that for
 $a=0.4$
, are small. We did our best to fine tune the wall suction as much as possible to be closest to the
 $a=0.2$
profile. The unavoidable azimuthal thickness variation in the polyethylene sheet covering the disk prevented measurements closer to the disk surface. The horizontal line marks the lowest height before which the hot wire would touch some part of the disk surface. The comparable measured azimuthal velocity profiles of Gregory & Walker (Reference Gregory and Walker1960) were observed to deviate from the theoretical profile closer to the disk surface. They observed that the profiles were fuller, indicating a lower value of the shape factor for the azimuthal component. At least in the limited profile extent of the present measurements, this was not the case.
The measured mean azimuthal velocity profiles at the radial locations corresponding to
 $518\leqslant Re\leqslant 620$
for the rotating disk conditions that were listed in the table in figure 1 are shown in figure 8. The radius
 $Re=518$
is significant because that was the location at which the air-pulse disturbances were introduced. The radius
 $Re=620$
is slightly inboard of
 $Re_{c_{A}}=650$
which was expected with
 $a=0.2$
. Ideally, we wanted to achieve a uniform suction parameter over all of the disk. However, this proved to be difficult as the r.p.m. of the disk was increased. The simulation results that were shown in figure 6, however, indicated that the change with radius would asymptote in the vicinity of
 $Re_{c_{A}}$
. This was found to be the case, whereby the velocity profiles stopped changing with increasing radius (
 $Re$
), and converged to a single profile for
 $Re\geqslant 611$
. The process of setting the wall suction conditions was then to adjust the pressure in the enclosure below the disk so that the mean azimuthal velocity profile in the outer part of the boundary layer,
 $z({\it\omega}/{\it\nu})^{1/2}\geqslant 2$
, matched the theoretical profile for
 $a=0.2$
. With this, we focused on the outer part of the profile because the portion near the disk surface appeared to lag in its radial development. A similar deviation from the theoretical mean velocity profile nearer to the wall was observed by Gregory & Walker (Reference Gregory and Walker1960). We then examined the impact this would have on the stability characteristics of the boundary layer.
Wall-normal profiles of the azimuthal velocity at different radial locations on the disk for
 ${\it\omega}=86.5~\text{s}^{-1}$
and
 $a=0.2$
.

3.2 Natural instability development with suction
The linear stability of the basic flow was documented through spectral analysis of the azimuthal velocity fluctuations at different radial locations on the disk with the
 $a=0.2$
suction parameter. This involved 2048-point fast Fourier transforms (FFTs), which for the 10 kHz sampling frequency provided a frequency resolution of 4.88 Hz, or for stationary cross-flow modes an azimuthal mode number resolution of
 ${\rm\Delta}n\simeq 0.36$
.
The velocity fluctuations were not decomposed into contributions due to stationary and travelling Type I modes, as in Corke & Knasiak (Reference Corke and Knasiak1998). Consequently, the measured velocity fluctuations included both stationary and travelling Type I cross-flow modes. Since no attempts were made to separate the velocity fluctuations into travelling and stationary components, it followed that the abscissae of the spectra plots are in units of frequency and not normalized by the disk rotation frequency to represent the stationary azimuthal mode number,
 $n$
. Linear theory predicts that the most amplified travelling modes move at approximately 85 % of the local disk surface velocity. This had been experimentally substantiated in the wavenumber measurements in a rotating disk boundary layer by Corke & Matlis (Reference Corke and Matlis2006).
The instability mechanism in the boundary layer selectively amplifies the band of frequencies it prefers. At radii supercritical of the Type I instability,
 $(Re/Re_{c_{I}})>1$
, we expected to see a range of frequencies (mode numbers) that represented exponentially growing and decaying cross-flow modes. We performed linear stability analysis of the basic flow for various suction parameters corresponding to the mean azimuthal velocity profiles that were shown in figure 8. This utilized a generic spectral collocation code called ‘Linear.x’ that was developed by Herbert (Reference Herbert, Hussaini and Voight1990). Based on the theoretical mean profile shown in figure 8 for
 $a=0.2$
, we obtained
 $Re_{c_{I}}\simeq 365$
. For the same conditions, using a linearized Navier–Stokes formulation, Dhanak predicted
 $Re_{c_{I}}\simeq 375$
(Dhanak Reference Dhanak1992).
The mean velocity profiles at different radius Reynolds numbers that were shown in figure 8 indicated that the suction parameter was higher at the inboard radii,
 $Re<611$
. This would have an effect on the growth of disturbances in the boundary layer. To examine this, we documented the radial growth of the maximum azimuthal velocity fluctuations in the boundary layer that occurred at 400 and 450 Hz. This is shown in figure 9. These frequencies were selected because they were in the most amplified band of Type I cross-flow modes just prior to turbulent transition in the experiments by Othman & Corke (Reference Othman and Corke2006), without wall suction.
The radial development of the azimuthal fluctuations at 400 and 450 Hz is presented with log–linear axes in figure 9 to highlight exponential growth. The energy at these frequencies is likely to consist of a combination of stationary and travelling cross-flow modes. The amplitude development indicates two exponential growth regions. The first extends to approximately
 $Re\simeq 518$
. This has an extremely low dimensionless amplification rate of
 ${\it\alpha}_{i}=0.0029$
which is consistent with the initially higher suction that existed at the inboard radii shown in figure 8. The second exponential growth region exhibits a significantly higher amplification rate of
 ${\it\alpha}_{i}=0.0141$
. This region corresponds to where the mean profile converges towards the theoretical profile for
 $a=0.2$
. The measured amplification rate compares well with our linear stability prediction for travelling cross-flow modes based on the theoretical profile for
 $a=0.2$
, for which
 ${\it\alpha}_{i}=0.0122$
. We note that this amplification rate is approximately one-half the theoretical linear amplification rate for
 $a=0$
, which was verified in the experiment without suction by Othman & Corke (Reference Othman and Corke2006). This provides the first evidence that the natural instability characteristics of the boundary layer approaching
 $Re_{c_{A}}$
were consistent with linear theory predictions at our target
 $a=0.2$
suction condition.
Radial growth of the maximum azimuthal velocity fluctuation amplitude at frequencies of 400 and 450 Hz for a rotating disk with
 ${\it\omega}=86.5~\text{s}^{-1}$
and
 $a=0.2$
.

Plots of the power spectral density of the azimuthal velocity fluctuations for the range
 $565\leqslant Re\leqslant 620$
are shown in figure 10. The amplitude axis of the spectra is a log scale to better present the energy content over the frequency band of interest. At each Reynolds number, the different curves correspond to different wall-normal locations, ranging from
 $z^{\ast }=1.414$
to
 $z^{\ast }=3.374$
. The spectra document an amplifying band of frequencies between approximately 300 and 600 Hz, with the peak at approximately 450 Hz. Based on these spectra, there is no indication of turbulent transition at least up to
 $Re=620$
.
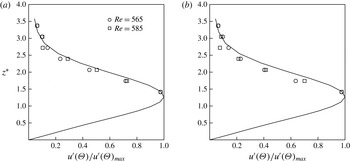
In order to determine whether the frequencies in this amplified band correspond to linear Type I travelling cross-flow modes, the wall-normal amplitude distribution was investigated. This is shown in figure 11 for the two frequencies of 400 and 450 Hz at
 $Re=565$
and 585, which were in the middle of the higher growth region in figure 9. The curve in the plots is the linear theory azimuthal velocity fluctuation eigenfunction for
 $a=0.2$
. The agreement between the measured wall-normal distribution and the linear theory eigenfunction is reasonably good. This further indicates that the baseline conditions just inboard of
 $Re_{c_{A}}$
were consistent with linear theory of Type I cross-flow modes with a suction parameter of
 $a=0.2$
.
Power spectral density measured at
 $Re=565$
(a), 585 (b) and 620 (c) for a rotating disk with
 ${\it\omega}=86.5~\text{s}^{-1}$
and
 $a=0.2$
.

Wall-normal azimuthal velocity fluctuation eigenfunctions at two radii corresponding to
 $Re=565$
and 585 for frequencies of (a) 400 and (b) 450 Hz for a rotating disk with
 ${\it\omega}=86.5~\text{s}^{-1}$
and
 $a=0.2$
. The curve is based on linear stability theory.
3.3 Temporal disturbance development with suction
Following the characterization of the basic flow and natural instability development with suction, experiments were performed to document the space–time evolution of controlled disturbance wavepackets that were introduced into the boundary layer on the disk. The disk conditions were the same as with the previous results, namely
 ${\it\omega}=86.5~\text{s}^{-1}$
and
 $a=0.2$
.
Short-duration air-pulse disturbances were introduced at a fixed radius in order to follow the development of wavepackets and discern their amplitude growth in space and time. This utilized the air-pulse disturbance generator developed by Othman & Corke (Reference Othman and Corke2006). The air pulses introduced disturbance wavepackets that featured a broad range of frequencies that could be selectively amplified by the boundary layer. The radial location of the air-pulse generator corresponded to a Reynolds number of
 $Re=518$
. The hot wire was placed at different Reynolds numbers (radial locations) and azimuthal locations relative to the air-pulser jet. The symbols in figure 12(b) show the relative positions of the air-pulse generator and hot-wire measurement locations. Figure 12(a) is a sketch of the expected wavepacket path spiralling out from the air-pulse generator origin. The relative radial and azimuthal spacings between the disturbance generator and the hot wire were used to document the temporal and spatial growth of the disturbances that were introduced. The documentation of the temporal growth was the key element in confirming the absolute instability.
A schematic of the relative positions between the hot wire and the air-pulse jet with expected wavepacket paths (a) and actual locations of wavepacket ensemble measurements (b).

The air pressure provided to the air-pulse generator was the same 28 p.s.i. as used by Othman & Corke (Reference Othman and Corke2006). Figure 2 documented that this produced a very similar temporal velocity pulse to their previous experiments. In addition, this supply pressure was verified by Othman and Corke to produce wavepackets that exhibited wall-normal azimuthal velocity fluctuation distributions that matched linear theory eigenfunctions.
The sequence for acquiring the velocity time series with the air pulses consisted of acquiring the hot-wire voltage time series for a time duration of four disk revolutions. In a few cases that were mostly at more inboard radial locations, six disk revolutions were acquired. The air pulse was initiated approximately 3 s after the start of data acquisition. Therefore, data were acquired before and after the air pulse. The time in the data series was subsequently referenced to the time at which the air pulse was generated, which was recorded along with the velocity time series. The contiguous time series at a given Re–
 ${\it\theta}$
location generally consisted of approximately 1000 air-pulse events, corresponding to a total of approximately 4000 disk rotations.
Othman & Corke (Reference Othman and Corke2006) determined the leading and trailing edges of the wavepackets generated by the air pulses by ensemble-averaging the time series using the pulse initiation as a time reference. They subsequently employed a Hilbert transform to determine the envelope of the peak velocity fluctuations within the wavepacket.
A different approach was used in the present work to identify the wavepackets. This involved matched filtering in which the time series following the first disturbance pulse was correlated with the time series that followed from subsequent pulses. Matched filtering is widely used in one-dimensional signal detection applications such as radar and digital communications (Turin Reference Turin1960; Thomas Reference Thomas1965) and in image processing (Andrews Reference Andrews1970). In the present approach, matched filtering provides a measure of the temporal correlation between the time series which can be used to identify the bounds of the wavepackets. The correlations were performed in the frequency domain using a digital FFT. The time series each corresponded to four disk rotations. The matched-filter outputs were averaged over the approximately 1000 air-pulse events. No other filtering of the time series was performed.
Examples of the output from the matched filtering are shown in figure 13. This figure shows disturbance wavepackets obtained by ensemble-averaging the time series in the manner of Othman & Corke (Reference Othman and Corke2006), along with the corresponding averaged matched-filter output. The height of the measurement from the disk surface corresponded to
 $z^{\ast }=1.414$
, which was the position nearest to the fluctuation amplitude maximum in the azimuthal velocity wall-normal eigenfunction shown in figure 11 that could be reached with the hot wire.
Examples of ensemble-averaged time series and the corresponding matched-filter output based on azimuthal velocity fluctuations measured at (a)
 $Re=530$
,
 ${\it\theta}=10^{\circ }$
and (b)
 $Re=560$
,
 ${\it\theta}=20^{\circ }$
.

The ensemble-averaged time series is made up of higher-frequency fluctuations that are representative of the azimuthal velocity fluctuations associated with the growing and decaying cross-flow modes excited by the air-pulse disturbance. The frequency content of such wavepackets will be presented later in the paper. The matched-filter output corresponds to the smooth curve that envelops the higher-frequency fluctuations. This smooth curve best suits our objective of locating the leading and trailing edges of the wavepackets as they evolve in space and time on the disk.
The evolution of the disturbance wavepackets as indicated by the matched-filter envelopes is shown in figures 14–16. These figures show discrete azimuthal locations relative to the air-pulse generator for
 $0.89\leqslant Re/Re_{c_{A}}\leqslant 1$
. This range of Reynolds numbers was chosen to present because they encompass where the spreading of the wavepacket departed from that found by Othman & Corke (Reference Othman and Corke2006) with
 $a=0.$
. At the lower-Reynolds-number locations, the envelope of the wavepacket is evident over an azimuthal extent of
 $10^{\circ }\leqslant {\it\theta}\leqslant 40^{\circ }$
. As it evolves radially outward to higher Reynolds numbers, the envelope of the wavepacket expands in time (number of disk rotations,
 $T$
). In addition, by the last two Reynolds number locations, the azimuthal extent shifts towards larger angles of
 $20^{\circ }\leqslant {\it\theta}\leqslant 70^{\circ }$
. This angular shift in the envelope of the wavepacket reflects the manner in which the disturbances travel along a log spiral from the disturbance source. We have attempted to represent the development of the wavepacket envelope along the log-spiral trajectory based on the most amplified linear mode in figure 17. Because of their discrete nature, the presented locations do not exactly follow the log spiral. However, it does provide a sense of the motion and spreading of the wavepacket envelope.
Matched-filter output at
 $Re/Re_{c_{A}}=0.89$
(a,c,e,g,i) and 0.92 (b,d,f,h,j) for
 ${\it\theta}=10^{\circ }$
(a,b),
 $20^{\circ }$
(c,d),
 $30^{\circ }$
(e,f),
 $40^{\circ }$
(g,h) and
 $70^{\circ }$
(i,j) locations from the air-pulse generator.

Matched-filter output at
 $Re/Re_{c_{A}}=0.93$
(a,c,e,g,i) and 0.95 (b,d,f,h,j) for
 ${\it\theta}=10^{\circ }$
(a,b),
 $20^{\circ }$
(c,d),
 $30^{\circ }$
(e,f),
 $40^{\circ }$
(g,h) and
 $70^{\circ }$
(i,j) locations from the air-pulse generator.

Matched-filter output at
 $Re/Re_{c_{A}}=0.99$
(a,c,e,g,i) and 1.00 (b,d,f,h,j) for
 ${\it\theta}=10^{\circ }$
(a,b),
 $20^{\circ }$
(c,d),
 $30^{\circ }$
(e,f),
 $40^{\circ }$
(g,h) and
 $70^{\circ }$
(i,j) locations from the air-pulse generator.

Matched-filter output at increasing Reynolds numbers and azimuthal angles which follow the approximate log-spiral path from the air-pulse generator of the most amplified linear cross-flow mode: (a)
 $Re=540$
,
 ${\it\theta}=10$
; (b)
 $Re=550$
,
 ${\it\theta}=20$
; (c)
 $Re=560$
,
 ${\it\theta}=20$
; (d)
 $Re=580$
,
 ${\it\theta}=40$
; (e)
 $Re=645$
,
 ${\it\theta}=70$
.

The wavepacket envelopes such as those shown in figures 14–16 were analysed in order to identify their leading and trailing edges. This was performed in an automated manner in which the output from the matched-filter operation was scanned to determine the maximum and minimum values of the envelope, and the
 $t/T$
location of the envelope maximum. The leading edge of the envelope was found by searching backwards in time from the location of the envelope maximum to the point at which the value of the envelope was 5 % of the dynamic range (envelope maximum minus envelope minimum). The trailing edge of the envelope was found by searching forward in time from the location of the envelope maximum to the point at which the value of the envelope was again 5 % of the dynamic range. The 5 % threshold was based a determination of what was consistent with a visual inspection of the envelopes. The results were not found to change significantly for thresholds between 4 % and 6 % of the dynamic range. The result of this analysis of the wavepackets is shown in figure 18.
Space–time map of leading-edge (LE) and trailing-edge (TE) locations of disturbance wavepackets for a rotating disk with
 $86.5~\text{s}^{-1}$
and
 $a=0.2$
. The solid red curve is the space–time map from Othman & Corke (Reference Othman and Corke2006) with
 $a=0$
. The upward-arrow data points signify that the trailing-edge location exceeded the four-disk-rotation-time-series limit. The dashed curve is an exponential fit to the TE data from
 $0.88\leqslant Re/Re_{c_{A}}\leqslant 0.96$
that was extrapolated to
 $Re_{c_{A}}=1.0$
.

The open and closed symbols in figure 18 correspond to the leading and trailing edges of the wavepackets respectively. The upward-arrow symbols signify data points where the location of the trailing edge was beyond the four-rotation-time-series limit, that is
 $t/T>4$
. In order to compare with the previous wavepacket measurements of Othman & Corke (Reference Othman and Corke2006), without disk suction, the Reynolds number is normalized by
 $Re_{c_{A}}$
for two experiments. Without suction,
 $Re_{c_{A}}=507$
, compared with 650 with
 $a=0.2$
. Time is normalized by the disk rotation period,
 $T$
.
The solid red curves in figure 18 correspond to the space–time development of the wavepackets from Othman & Corke (Reference Othman and Corke2006) without disk suction. For the leading edge of the wavepacket, we observe very good agreement in the space–time development between the present experiment and that of Othman & Corke (Reference Othman and Corke2006). For the trailing-edge development, there is good agreement between the two experiments up to
 $Re/Re_{c_{A}}=0.876$
(
 $Re=570$
). Outboard of that location of the disk, we observe a continual spreading of the wavepacket trailing edge that was not observed by Othman and Corke without suction. The dashed curve is an exponential fit of the trailing-edge data from
 $0.876\leqslant Re/Re_{c_{A}}\leqslant 0.962$
that was then extrapolated to
 $Re_{c_{A}}=1.0$
. The three cases denoted by the upward-arrow symbols signify that the trailing-edge locations exceeded the four-disk-rotation limit of the contiguous time series. Unfortunately, the six-rotation-long time series taken at these Reynolds numbers were at azimuthal angles of
 ${\it\theta}=10^{\circ }$
, where, as indicated in figure 16, the matched filter did not return a coherent wavepacket envelope. This either signifies that the wavepacket was not in that location as it progressed along the log-spiral path, or that the velocity fluctuations were zero, or that they were not correlated with the disturbance pulse. Further analysis will come in examining the velocity fluctuation spectra.
As is evident from the red curve for the wavepacket trailing-edge development without suction (Othman & Corke Reference Othman and Corke2006), the temporal spreading of the wavepackets had asymptoted even as
 $Re_{c_{A}}$
was approached, which agreed with the simulation observations of Davies & Carpenter (Reference Davies and Carpenter2003). In the present experiment with a wall suction factor of
 $a=0.2$
, the temporal expansion of the trailing edge of the wavepackets continued to increase exponentially with the Reynolds number, exceeding by approximately a factor of two that without suction at the comparable
 $Re/Re_{c_{A}}$
. We can only speculate on how far the trailing edge would have continued to expand given that in three cases, and especially at
 $Re/Re_{c_{A}}\geqslant 0.99$
, the four-rotation-time-series limit was reached. Ideally, in the case of the existence of a global mode, we would expect the trailing-edge spreading to achieve a vertical temporal slope. However, the enhanced spreading of the wavepacket trailing edge in contrast to that without suction documented by Othman & Corke (Reference Othman and Corke2006) suggests support for the predictions of Thomas (Reference Thomas2007) and Thomas & Davies (Reference Thomas and Davies2010).
Another indication of the character of the disturbance wavepackets comes from examining the frequency content of the velocity fluctuations associated with the wavepackets. These were obtained from the same time series on which the matched filtering was performed. Each record of the spectra consisted of the contiguous four-rotation time series. The time series was digitally band-pass filtered in the frequency domain using a specially designed finite impulse response (FIR) filter with a low-pass cutoff of 200 Hz and a high-pass cutoff of 1200 Hz. This was intended to highlight frequencies that are associated with the most amplified linear cross-flow mode, which for our experimental conditions was near 400 Hz, and the most amplified absolute instability mode, which was near 750 Hz. The resulting spectra were averaged over approximately 1000 records, each triggered by the pressure pulse. The amplitude of the spectra corresponds to the r.m.s. of the azimuthal velocity fluctuations with a 1 Hz bandwidth.
Figures 19 and 20 show spectra for the
 ${\it\theta}=10^{\circ }$
,
 $20^{\circ }$
,
 $30^{\circ }$
,
 $40^{\circ }$
and
 $70^{\circ }$
locations from the air-pulse generator for a subset of the Reynolds numbers of the wavepacket envelopes that were shown in figures 14–16. Figure 19(a,c,e,g,i) is at the same Reynolds number location (
 $Re/Re_{c_{A}}=0.88$
) as the matched-filter amplitude envelopes in figure 14(a,c,e,g,i). In the latter, the absence of a coherent wavepacket envelope at
 ${\it\theta}=70^{\circ }$
coincides with very low velocity fluctuations observed in the spectrum at that azimuthal location. Thus, we can surmise that the disturbance wavepacket produced by the pressure pulse had not spread to that azimuthal position.
At
 $Re/Re_{c_{A}}=0.93$
, the matched-filter amplitude envelopes in figure 15(a,c,e,g,i) still do not reveal a coherent wavepacket. However, the corresponding spectra shown in figure 19(b,d,f,h,j) reveal the influence of the pressure pulse at
 ${\it\theta}=70^{\circ }$
, with energy appearing in the most amplified linear theory band of frequencies.
The spectra for
 $Re/Re_{c_{A}}=0.99$
and 1.00 are shown in figure 20. On comparing these with the previous spectra, they immediately reflect the spatial growth in amplitude of the velocity fluctuations associated with the pressure pulse. Another feature is that the amplitude magnitude and frequency distribution is nearly uniform across the azimuthal angle locations. This is revealing because the corresponding wavepacket envelopes that were presented in figure 16 indicated that the velocity fluctuations were not correlated with the disturbance pulse at the
 ${\it\theta}=10^{\circ }$
location. Since the fluctuation amplitudes are not zero, this might indicate that the boundary layer has undergone turbulent transition.
Spectra of azimuthal velocity fluctuations triggered on pressure pulses at
 $Re/Re_{c_{A}}=0.89$
(a,c,e,g,i) and 0.93 (b,d,f,h,j) for
 ${\it\theta}=10^{\circ }$
(a,b),
 $20^{\circ }$
(c,d),
 $30^{\circ }$
(e,f),
 $40^{\circ }$
(g,h) and
 $70^{\circ }$
(i,j) locations from the air-pulse generator.

Spectra of azimuthal velocity fluctuations triggered on pressure pulses at
 $Re/Re_{c_{A}}=0.99$
(a,c,e,g,i) and 1.00 (b,d,f,h,j) for
 ${\it\theta}=10^{\circ }$
(a,b),
 $20^{\circ }$
(c,d),
 $30^{\circ }$
(e,f),
 $40^{\circ }$
(g,h) and
 $70^{\circ }$
(i,j) locations from the air-pulse generator.

In order to further show the full evolution of the velocity fluctuations that emanate from the disturbance air pulse, spectra like those presented in figures 19 and 20, but at all of the measured radii, were compiled to produce the contour plots shown in figure 21. These plots show the amplitudes in (
 $Re,{\it\theta}$
)-space at two frequencies of 450 and 750 Hz, which are representative of the most amplified linear cross-flow mode and the predicted absolute instability mode respectively. The amplitudes have been normalized by their minimum value and presented as log-level contours to highlight exponential growth. The solid curve corresponds to a log spiral with a spiral angle of
 ${\it\psi}=10.36^{\circ }$
that is based on
 ${\it\beta}=0.0698$
and the most amplified
 ${\it\alpha}_{r}=0.382$
for
 $a=0.2$
. Over the small-azimuthal-angle range, this looks almost linear. The log spiral is drawn to originate from the location of the air-pulse generator, which was at
 $Re=518$
.
Spatial amplitude distributions produced by the pulse generator shown as contours of
 $\log (u^{\prime }({\it\theta})/u^{\prime }({\it\theta})_{min})$
for frequencies of 450 Hz (a) and 750 Hz (b). The solid curve corresponds to a log spiral with a spiral angle of
 ${\it\beta}=0.0698$
that originates from the disturbance source.

The spatial development of the normalized azimuthal velocity fluctuations measured along log spirals in plots in figure 21. The lines correspond to a least-square curve fit of the data to an exponential function.

Close to the air-pulse generator, the disturbance is only felt at small azimuthal angles from the generator. Therefore, the velocity fluctuations at larger angles are much lower, at baseline levels. As illustrated by the previous plots, the disturbance wavepacket forms and expands. This is evident in the contour plots by the rapid azimuthal expansion of velocity fluctuation amplitudes that occurs at approximately
 $Re=560$
(
 $Re/Re_{c_{A}}=0.86$
). Since this is reflective of the growth of the wavepacket, this occurs for the full spectrum of velocity fluctuations, observed at both 450 and 750 Hz. Outboard of this radius, the amplitudes of the disturbances, reflected in the two selected frequencies, grow steadily. The uniform spacing between contours indicates that the growth is exponential. This continues out to
 $Re_{c_{A}}=650$
without an indication of saturating.
This is further examined by plotting the growth in the fluctuation amplitudes at the two selected frequencies while following the log-spiral trajectory. The result is shown in figure 22. Here again the amplitude is normalized by the minimum value at each frequency and presented as a log value to highlight exponential growth. The initial azimuthal expansion of the disturbance wavepacket is again evident up to
 $Re/Re_{c_{A}}=0.86$
. Outboard of that radius, the amplitudes at the two selected frequencies grow exponentially, which is signified by the straight line fits to the data. We note that there is a change in the slope of the linear fits which signifies a change in the growth rate. The change in slope occurs at the same location,
 $Re/Re_{c_{A}}=0.95$
, for both of the selected frequencies. Prior to that radius, the growth rate at 450 Hz is larger than that at 750 Hz, which is expected based on linear stability theory. However, at
 $Re/Re_{c_{A}}=0.95$
, the growth rates at both frequencies increase, and appear to be the same. This suggests that the whole spectral band is increasing in amplitude, which one might expect if the boundary layer was transitioning to turbulence. Is there a significance to the
 $Re/Re_{c_{A}}=0.95$
where this occurs? Based on the space–time evolution of the disturbance wavepacket that was shown in figure 18, this is well within the region of the exponential temporal spreading of the wavepacket trailing edge, and of course close to the expected location of the absolute instability. Although compelling, turbulent transition in itself does not guarantee the presence of a global mode.
4 Conclusions
The object of this work was to experimentally investigate the effect of wall suction on the growth of Type I cross-flow instability modes in the boundary layer on a rotating disk. More specifically, the focus was on the effect that wall suction had on the absolute instability of the Type I cross-flow modes that was first predicted by Lingwood (Reference Lingwood1995).
The present work grew out of the earlier rotating disk experiment by Othman & Corke (Reference Othman and Corke2006), without wall suction, in which a deceleration of the temporal spreading of linear disturbance wavepackets at the absolute instability location was found. The same behaviour was observed by Davies & Carpenter (Reference Davies and Carpenter2003) in their linear simulations, whereby they concluded that although the higher-frequency disturbances were absolutely unstable, this did not produce a global mode. The later numerical simulations of Thomas (Reference Thomas2007) and Thomas & Davies (Reference Thomas and Davies2010), however, indicated that wall suction applied to the rotating disk boundary layer could transform the linear absolute instability into a global instability.
The object of the present experiment was to develop a means of applying uniform suction on the rotating disk with a suction parameter and disk rotation rate that placed the critical Reynolds number of the absolute instability,
 $Re_{c_{A}}$
, at a radius on the disk. The approach ultimately closely followed that of Gregory & Walker (Reference Gregory and Walker1960). The various elements in the design were examined in numerical simulations. These were essential to the final design of the rotating disk set-up which included an array of holes that allowed air to pass through the disk into an enclosure below the disk that was held at a slight subatmospheric pressure, and a pressed-screen mesh that covered the holes in the disk to add pressure drop which was needed to achieve the target wall-normal velocity. Care was also taken to minimize any potential effects of disturbance contamination from the outer edge of the disk. Such precautions included having the top exterior surface of the box flush with the surface of the disk, similar to the ‘plate-type’ edge condition of Imayama et al. (Reference Imayama, Alfredsson and Lingwood2013), having
 $r_{c_{A}}$
33 mm from the disk edge, which was six times further than where the mean flow was affected in Imayama et al. (Reference Imayama, Alfredsson and Lingwood2013), and finally having the wall suction extend beyond
 $r_{c_{A}}$
.
The simulations predicted that the suction parameter at inboard radii would initially overshoot our target value, but eventually asymptote to the target suction parameter well enough inboard and outboard of the critical radius of the absolute instability. These predictions were validated in the experiment, with the final conditions being a rotation rate of
 ${\it\omega}=86.5~\text{s}^{-1}$
and a suction parameter of
 $a=0.2$
, whereby
 $Re_{c_{A}}=650$
was at the 90 % disk radius location.
A number of porous measurement surfaces were investigated. These consisted of an uncovered compressed wire mesh like that used by Gregory & Walker (Reference Gregory and Walker1960), the same compressed wire mesh covered by stretched silk fabric, or a 1.6 mm thick sheet of porous high-density polyethylene having a
 $20~{\rm\mu}\text{m}$
pore size. The two criteria for the selection of the porous measurement surface were (1) the ability to match theoretical wall-normal velocity profiles with different suction parameters and (2) the ability to maintain laminar flow out to the vicinity of the radial location of
 $Re_{c_{A}}$
. Of these, the second became the greater challenge, since even minute surface roughness could result in dominant stationary cross-flow modes which would lead to turbulent transition inboard of the
 $Re_{c_{A}}$
location. Ultimately, the polyethylene sheet was the only covering that met these two criteria. An issue with the polyethylene sheet was that it was not precisely uniform in thickness. As a result, there was a slight waviness of the surface which did not appear to affect thecharacter of the cross-flow instability, but limited how close measurements could be made to the disk surface. Measurements just above the azimuthal velocity wall-normal eigenfunction maximum were achievable.
The documentation of the basic flow indicated that the natural boundary layer stability was consistent with that expected on the rotating disk with
 $a=0.2$
. This included a measured amplification rate of the largest amplitude frequency of
 ${\it\alpha}_{i}=0.0141$
, which compared with
 ${\it\alpha}_{i}=0.0122$
based on linear theory, and good agreement with linear theory of the azimuthal velocity wall-normal eigenfunction.
The method of Othman & Corke (Reference Othman and Corke2006) was found to be successful in introducing temporal disturbances from outside the boundary layer which developed into well-defined wavepackets. The temporal character of the generated disturbances matched well with those of Othman and Corke, which had been documented to satisfy linear theory assumptions. The disturbances were introduced at a radius
 $Re=518$
that was inboard of the radius location of the absolute instability.
The space–time evolution of the wavepackets was documented with a hot wire placed at increasing radii and azimuthal angles from the disturbance generator. A different approach from that of Othman & Corke (Reference Othman and Corke2006) was used in the present work to identify the wavepackets. This involved matched filtering in which the time series following the first disturbance pulse was correlated with the time series that followed from subsequent pulses. In the present approach, matched filtering provided a measure of the temporal correlation between the time series which was used to identify the bounds of the wavepackets. The correlations were performed in the frequency domain using a digital FFT and encompassed four disk rotations. The matched-filter outputs were averaged over approximately 1000 air-pulse events. No other filtering of the time series was performed.
The leading and trailing edges of the disturbance wavepackets were identified using an automated approach. Good agreement was found in the space–time development of the wavepacket leading edge between the present experiment and that of Othman & Corke (Reference Othman and Corke2006). Thus, the addition of wall suction on the rotating disk did not affect the wavepacket leading-edge development.
For the wavepacket trailing-edge development, there was good agreement between the two experiments (with and without suction) up to
 $Re/Re_{c_{A}}=0.876$
. Outboard of that location on the disk, an exponential spreading of the wavepacket trailing edge occurred which was not observed by Othman and Corke without suction.
Examination of the spectra of the azimuthal velocity fluctuations associated with the wavepacket indicated exponential growth that was consistent with linear theory well into the region of exponential spreading of the wavepacket trailing edge. This continued to
 $Re/Re_{c_{A}}=0.95$
, outboard of which the growth rates of a broad range of frequencies increased, and became the same. This increase in the broad-band spectral amplitude suggests that the boundary layer was transitioning to turbulence. These overall observations and contrast to the cases without wall suction appear to support the predictions of Thomas (Reference Thomas2007) and Thomas & Davies (Reference Thomas and Davies2010).
Appendix A. Rotating disk design
The rotating disk was fabricated from a 3.15 cm (1.25 in.) thick die-cast aluminium plate. The design of the disk to allow uniform suction through the surface followed the concept of Gregory & Walker (Reference Gregory and Walker1960). This involved drilling 360 1.27 cm (0.5 in.) holes arranged in concentric circles through the disk to produce a region where the wall suction would be applied. This is shown in the photograph in figure 23(a). The location of the holes starts at the radial location
 $r=14.29~\text{cm}$
. (5.625 in.) and continues to
 $r=29.21~\text{cm}$
(11.5 in.). At the design disk rotation rate of 826 r.p.m., these radial locations correspond to
 $Re=317$
and
 $Re=696.5$
. This gave the suction portion of the disk inboard of
 $Re_{c_{A}}$
zero suction and that slightly outboard of
 $Re_{c_{A}}$
a suction parameter of
 $a=0.2$
. The holes through the disk were covered with a sheet of pressed wire mesh which added a specific amount of pressure drop to help to uniformize the suction on the surface of the disk. The pressed wire mesh installed on the disk is shown in the photograph in figure 23(b). A close-up view of the pressed wire mesh is shown in figure 24. This surface was not smooth enough for the flow to remain laminar before reaching the absolute instability critical radius with a suction parameter of
 $a=0.2$
. Therefore, a smooth porous covering was required. A number of smooth coverings were investigated. One was a stretched silk cloth. The process of stretching the cloth covering over the disk is shown in the photograph in figure 23(c). A special tensioning device was used to stretch the fabric directly over the disk. The fabric was held taught by a clamping ring that attached to the outer edge of the disk. The final disk assembly with the stretched cloth is shown in figure 23(d).
Construction of the disk designed for suction, showing the array of holes (a), the wire mesh (b), the cloth stretching device (c) and the final disk (d).

Close-up view of the pressed wire mesh that covered the holes through the rotating disk.

Schematic of the rotating disk system with the low-pressure enclosure.

Photograph of the rotating disk system with the low-pressure enclosure partially open.

Photograph of the rotating disk system with the low-pressure enclosure closed.

The disk assembly and motor were enclosed in a sealed suction box. The measurement side of the disk was open to the outside of the box. A schematic drawing of the rotating disk with the suction box is show in figure 25. The photograph in figure 26 shows the rotating disk assembly with the partially open suction box which displays the internal set-up. Figure 27 shows the rotating disk assembly with the fully constructed box and the motorized traversing mechanism that was used for hot-wire measurements. The top exterior surface of the box was flush with the surface of the disk. This was similar to the ‘plate-type’ edge condition of Imayama et al. (Reference Imayama, Alfredsson and Lingwood2013). We expected this condition to produce lower edge disturbances than an open edge.
Variable-speed vacuum pumps were used to lower the pressure in the box. This caused the flow to be driven through the holes in the disk, which communicated between the outside space and the space inside the box. The size of the box was designed to produce a minimal internal flow circulation due to the rotation Von Karman pump effect. Ideally, we expected the same theoretical zero pressure gradient as existed on an unbounded rotating disk.
Appendix B. Experimental set-up simulations
The objective of the simulations was to design the rotating disk system described in appendix A which could produce a region of uniform wall suction around the location of
 $Re_{c_{A}}$
. The simulations were performed using Fluent software. The simulations modelled the free space above the rotating disk, the enclosure box below the disk, the suction passages through the disk, and the pressed-screen mesh and any other coverings that produced pressure drop through the suction passages. Figure 28 shows the computational grid for the Fluent simulation. The mesh domain consisted of a
 $45^{\circ }$
wedge with rotationally periodic boundary conditions which comprised structured hexahedrals in the boundary layer and unstructured tetrahedrals in the far field, with a total of
 $7\times 10^{6}$
cells. The
 $y^{+}$
value of the lowest cell in the boundary layer was approximately 1. The computational formulation was a 3-D pressure-based incompressible segregated steady Reynolds averaged Navier–Stokes (RANS), with a two equation eddy viscosity
 $(k{-}{\it\omega})$
shear stress transport (SST) turbulence model. Standard air properties of
 ${\it\rho}=1.225~\text{kg}~\text{m}^{-3}$
and
 ${\it\nu}=1.7894\times 10^{-5}~\text{m}^{2}~\text{s}^{-1}$
were used.
The 3-D structured/unstructured mesh used in the CFD simulation of the rotating disk with suction (a), and a zoomed-in square region of the computational mesh showing the passages through the disk into the lower enclosure box (b).

In order to model a simple homogeneous porous material like the wire mesh covering, an additional source term,
 $S_{i}$
, was added to the
 $i$
th (
 $x,y$
or
 $z$
) momentum equation, such that
 $$\begin{eqnarray}S_{i}=-\left(\frac{{\it\mu}}{{\it\alpha}}v_{i}+C_{2}\frac{1}{2}{\it\rho}v_{mag}v_{i}\right),\end{eqnarray}$$
where
 $C_{2}$
is the inertial resistance factor and
 $1/{\it\alpha}$
is the viscous inertial resistance factor. A simplified version of the momentum equation which relates the pressure drop to the source term can be expressed as
 $$\begin{eqnarray}\boldsymbol{{\rm\nabla}}p=S_{i},\end{eqnarray}$$
and assuming that the pressure drop is in only one direction, the pressure drop simplifies to
 $$\begin{eqnarray}\boldsymbol{{\rm\nabla}}p=-S_{i}\boldsymbol{{\rm\nabla}}n,\end{eqnarray}$$
where
 $\boldsymbol{{\rm\nabla}}n$
is the thickness of the porous material.
In order to obtain the resistance factors, data on the pressure loss as a function of the throughflow velocity were obtained for different solidities of the stainless steel wire mesh. The values of the required coefficients in (B 1) were then determined. Table 1 gives these values for three mesh solidities investigated in the study. The LFM mesh designations are those of the manufacturer, Martin-Kurz Dynapore. In this table,
 $k$
is the ratio of the pressure drop and dynamic pressure, namely
 $$\begin{eqnarray}k=\frac{P_{2}-P_{1}}{\frac{1}{2}{\it\rho}V_{2}^{2}-\frac{1}{2}{\it\rho}V_{1}^{2}}.\end{eqnarray}$$
To address the steep pressure gradients that are characteristic of swirling flows, the PRESTO scheme was used for pressure discretization. This discretization is used for flows with high swirl numbers, flows with porous media and high-speed rotating flows. The simulations were started at zero rotational speed and allowed to converge; afterwards rotation was turned on. The under-relaxation parameters for pressure and momentum were decreased slowly until the solution converged.



