Implications
The overproduction of horses in Europe is claiming to promote the consumption of equine products (Álvarez et al., Reference Álvarez, Perona, Valera, Mantecón and Alcalde2013; Saastamoinen, Reference Saastamoinen2013). Thus, it will be interesting to value equine alternative productions because of the increase in the number of animals slaughtered, which implies an increase of equine products in the market. The study of health-promoting compounds in equine products, such as carotenoids and fat-soluble vitamins (retinol and tocopherol), would help in improving the consumption of these products. In this study, the accumulation of these compounds in different horse tissues (plasma, milk, fat and liver) have been explored and have been compared with that of cattle, widely studied by previous authors. Absorption and accumulation of carotenoids, retinol and tocopherol were observed in horse body fluids and tissues.
Introduction
Carotenoids are important in human health and nutrition because of their provitamin A function and other possible biological actions. In this sense, they have been associated with a lower risk of developing certain types of cancer, cardiovascular diseases, cataracts, etc. These compounds are lipophilic pigments that animals cannot synthesize de novo, but can metabolize them, such that those present in their plasma or tissues come from their diets (Nozière et al., Reference Nozière, Graulet, Lucas, Martin, Grolier and Doreau2006a). In addition, carotenoids with at least one unsubstituted β-ring in their structure (such as β-carotene, α-carotene and β-cryptoxanthin) are precursors of vitamin A – that is, retinol – through cleavage. Retinol is involved in several functions such as vision, growth and bone development, reproduction and integrity of mucosal and epithelial surfaces (Ortega et al., Reference Ortega, Mena and Andrés2005). Schweigert (Reference Schweigert1998) established that based on the accumulation of carotenoids in adipose tissue, mammals can be divided into two groups: the ‘white-fat’ and the ‘yellow-fat’ animals. The first group is comprised of species that do not absorb carotenoids at all or at least only at very low levels, such as pig, goat, sheep and rodents. Animals in the second group are those that do absorb carotenoids, such as cattle, horses and birds. However, reasons for the characteristic species-specific differences in carotenoid metabolism are not yet well-understood.
On the other hand, the role of fat-soluble vitamins (such as retinol and tocopherol) in the nutritional and sensory properties of foods have been recently pointed out (Sauvant et al., Reference Sauvant, Graulet, Martin, Grolier and Azaïs-Braesco2011). Many studies (Martin et al., Reference Martin, Fedele, Ferlay, Grolier, Rock, Gruffat and Chilliard2004; Majchrzak et al., Reference Majchrzak, Fabian and Elmadfa2006; Calderón et al., Reference Calderón, Chauveau-Duriot, Pradel, Martin, Graulet, Doreau and Nozière2007) have been carried out about the presence and accumulation of carotenoids and fat-soluble vitamins in cattle fluids and tissues (plasma, milk, fat, liver, etc.), as well as their implication on consumer point of view of the cattle products. However, few studies have been developed (Schweigert and Gottwald, Reference Schweigert and Gottwald1999) with this aim in horses. Therefore, it would be interesting to study the accumulation of both carotenoids and fat-soluble vitamins in horse tissues, as, nowadays, (Lorenzo et al., Reference Lorenzo, Sarriés, Tateo, Polidori, Franco and Lanza2014) efforts in extending the knowledge on equine products by improving consumer awareness of the high value of these products are being carried out, because in countries like Spain their production is growing but the consumption is limited (Lorenzo et al., Reference Lorenzo, Sarriés and Franco2013). Therefore, the study of health-promoting compounds such as carotenoids could help increase the acceptability of horse products by the consumer in order to improve their consumption in countries like Spain, Italy, France and Belgium, where it remains low (Lorenzo et al., Reference Lorenzo, Sarriés, Tateo, Polidori, Franco and Lanza2014). In addition, it has been stated that the color perception of food quality plays a major role in consumer evaluation (O’Sullivan et al., Reference O’Sullivan, Byrne, Martens, Gidskehaug, Andersen and Martens2003). In this way, the consumer first needs to be entirely satisfied with the sensory properties of the products, before other quality dimensions become relevant. Studies on fat color in different species, such as cattle, have been carried out (Dunne et al., Reference Dunne, Monahan, O’Mara and Moloney2009), but limited information is available about horses in this sense.
In this regard, the aim of this report was to study the accumulation of carotenoids and fat-soluble vitamins (retinol and tocopherol) in different horse tissues compared with that of cattle at two levels, females fed on pasture and young males fed indoors and tied. Differences in fat color were also assessed with the same aim.
Material and methods
Animals
For this study, four groups of animals were used. Group 1 (G1) included 15 lactating mares from the Hispano–Breton breed, whose rearing is oriented to meat production (www.feagas.com). These animals had an average weight of 709.82±23.09 kg and they were reared in an extensive feeding system. Group 2 (G2) comprised 15 lactating cows in an extensive production system, with an average weight of 576.93±31.94 kg. All animals belonged to a commercial crossbred Limousine–Retinta, mainly reared for meat production (www.feagas.com). Group 3 (G3) comprised 15 male foals from the Hispano–Breton breed. The foals were weaned at 6 months of age and were fattened in an intensive system until slaughter (at around 14 months of age) when the animals had an average weight of 556.8±25.9 kg. Finally, Group 4 (G4) consisted of 15 male calves from the commercial crossbred Limousine–Retinta. These animals were weaned at 6 months of age and were fattened in confinement until they were 14 months old, and were slaughtered when they reached an average weight of 474.7±36.2 kg.
Diets and Sampling
Mares from G1 were reared in a continuous grazing system in an area of dehesa silvopastoral system in Central Spain Mountains, where the pasture has been characterized by previous authors (San Miguel, Reference San Miguel2009) as xero-mesophytic acid soil. Moreover, Martínez et al. (Reference Martínez, Urquía, Tejerina and Guerrero2014) reported 1159 kg dry matter (DM)/ha as biomass production in an area similar to that where our animals were reared, with 12.52% CP and 7.3% legumes. These pastures allow stocking between 0.5 to 1.0 Livestock Unit/ha. The paddock where the mares were reared was mainly composed, according to Muslera and Ratera (Reference Muslera and Ratera1984), of plants from the Poaceae family, such as Agrostis spp., Bromus spp., Festuca spp, etc. Besides, species from the Fabaceae family were present, such as Trifolium spp., Medicago spp. and Lotus spp. In addition, species from the Asteraceae family, such as Carduus spp., were present. Furthermore, cows from G2 were reared based on continuous grazing system in a farm in Southwestern Spain in a dehesa landscape. This area is characterized by a Mediterranean climate with mostly acid soils on siliceous sedimentary materials (Alejano et al., Reference Alejano, Vázquez-Piqué, Domingo-Santos, Fernández, Andivia, Martín, Pérez-Carral and González-Pérez2012). Moreover, 1440 kg DM/ha as the average production (10.3% CP and 8.5% legumes) led to a similar central-Spain dehesa stocking between 0.5 and 1.0 Livestock Unit/ha. In the case of the paddock where the animals were reared, the pasture was mainly composed, according to Madejón et al. (Reference Madejón, Domínguez and Murillo2009), of plants from the Poaceae family, such as Agrostis spp., Vulpia app., Poa spp., Bromus spp. and Lollium spp. In addition, species from the Fabaceae family were present, such as Trifolium spp., Ornithopus spp., Medicago spp. and Lotus spp. The amount of pasture ingested by each animal, both mares and cows, was not controlled, as they presented a good body condition due to a proper stocking adapted to the pasture production.
According to Olea and Paredes (Reference Olea and Paredes1997), most of the pasture production in these areas (70%) occurs in spring; thus, representative samples of the different pastures from G1 and G2 were collected specifically in mid-May, 10 days before the sampling of the animal tissues, as a low persistence of carotenoids in blood of animals have been reported previously (Prache et al., Reference Prache, Priolo and Grolier2003b; Serrano et al., Reference Serrano, Prache, Chauveau-Duriot, Agabriel and Micol2007). The sampling areas were randomly selected at the prairie where the animals were reared. The pasture was sampled in triplicate from the ground using six definite quadrates (0.5 by 0.5 m) that were randomly established. Samples were pooled in order to analyze them overall because of the reported (Nozière et al., Reference Nozière, Graulet, Lucas, Martin, Grolier and Doreau2006a) variability in carotenoid content between botanical species. On the other hand, concentrate fed to foals (G3) was composed (Piensos Binaga S.A., Huesca, Spain) of barley, soybean, carob flour, maize gluten, bran leaf, beet pulp, molasses, palm oil, calcium carbonate, sodium chloride and phosphate dicalcium. The analytical composition of the concentrate was as follows: CP (14.3%), Mg (0.22%), fat (3.4%), Ca (0.89%), crude fiber (11.0%), ash (6.1%) and P (0.50%). Finally, the diet (Piensos Inalsa S.A., Ciudad Real, Spain) of the calves (G4) was composed by maize, barley, soybean, citric pulp, wheat, calcium carbonate, sodium chloride, fatty acids, calcium carbonate and palm oil. The analytical composition was as follows: CP (15.5%), fat (4.7%), crude fiber (4.5%), ash (5.6%) and sodium (0.33%).
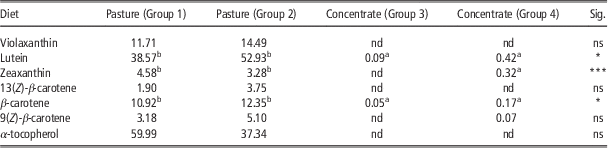
After sample collection, all the feedstuff were transported to the laboratory, lyophilized and stored at −80ºC until extraction. Samples were analyzed in triplicate according to a methodology described by Pickworth et al. (Reference Pickworth, Loerch, Kopec, Schwartz and Fluharty2012) with some modifications. One gram of each sample was lyophilized and the extractions were carried out using 3 ml of hexane/ethanol (1 : 1, v/v) as the extractant. The extraction was repeated twice and the organic phases obtained were pooled and saponified with 15% ethanolic potassium hydroxide (w/v) overnight at room temperature in the dark and under nitrogen atmosphere. Finally, the organic phase was washed several times with water. Subsequently, the organic phase was collected and dried using a concentrator (Concentrator plus, Eppendorf Research®, Madrid, Spain). The dry residue was dissolved in 100 µl of ethyl acetate for HPLC analysis. Table 1 summarizes the content of carotenoids and α-tocopherol in the diets of the animals. The main carotenoids in pasture (G1 and G2) were lutein, β-carotene and its Z isomers, whereas lutein and β-carotene were detected in concentrate samples from both G3 and G4, as well as zeaxanthin and (9Z)-β-carotene in concentrate samples from G4. Retinol was neither detected in the pasture nor in the concentrate samples. However, α-tocopherol was present in the pasture but not in the concentrate. Considering the data in Table 1, it can be stated that the diets of the animals in this study with the same rearing system, – that is, extensive or intensive – showed a similar carotenoid and fat-soluble vitamin profile.
Level (µg/g DM) of carotenoids and α-tocopherol identified in the diets of the animals: Group 1 (pasture of mares), Group 2 (pasture of cows), Group 3 (concentrate of foals) and Group 4 (concentrate of calves)

ns=not significant; nd=not detected.
Sig.: significant differences. *P<0.05, ***P<0.001.
Significant differences (P<0.05) within a column are indicated by superscripts (a, b, c).
Tissues from mares and cows
Thirty milliliters (ml) of milk was collected from mares and cows (G1 and G2). For this, the animals were placed in a cattle crush in order to make the handing easier. The milk was collected aseptically into sterile vials covered with aluminum foil and immediately stored at −80ºC until laboratory analysis. Besides, 10 ml of blood sample was collected, using Li-Heparin as anticoagulant, from the jugular vein and the caudal vein of the mares and cows, respectively. Blood samples were transported to the laboratory at 4ºC for centrifugation (1500×g, 10 min, 4°C) in order to collect plasma, which was stored at −80ºC until analysis.
The extraction of carotenoids and fat-soluble vitamins from milk was carried out applying approved methodologies by Hulshof et al. (Reference Hulshof, Van Roekel-Jansen, Van de Bovenkamp and West2006) and Nozière et al. (Reference Nozière, Grolier, Durand, Ferlay, Pradel and Martin2006b) with some modifications. One milliliter of milk was mixed with 0.5 ml of distilled water, 1 ml of ethanol and 1 ml of hexane. Samples were then centrifuged (8000×g, 10 min, 4ºC), and the upper organic phase was collected. The extraction was repeated until color exhaustion. The organic phases were pooled and 2 ml of ethanolic sodium hydroxide 15% (w/v) was added. The saponification reaction was maintained overnight at room temperature in the dark. Finally, the organic phase was washed several times with water, collected and dried using a concentrator (Concentrator plus, Eppendorf Research®). The dry extract was dissolved in 35 µl of ethyl acetate for HPLC analysis.
For plasma samples, the methodology described by Lyan et al. (Reference Lyan, Azaïs-Braesco, Cardinault, Tyssandier, Borel, Alexandre-Gouabau and Grolier2001) was used with some modifications. Two milliliters of plasma was deproteinized by adding 2 ml of ethanol. Carotenoids, retinol and tocopherol were extracted twice with 2 ml of hexane with centrifugation (8000×g, 10 min, 4ºC); the extracts were pooled and evaporated to dryness with a concentrator (Concentrator plus, Eppendorf Research®). The dried extracts were dissolved in 100 µl of ethyl acetate for HPLC analysis.
Tissues of foals and calves
Foals and calves (G3 and G4) were slaughtered in spring according to the European Regulation (Council Regulation (EC) No. 1099/2009 of 24 September (2009)). The animals arrived at the abattoir the night before slaughter and had access to water until 30 min before slaughtering. They were transported to the abattoir in a truck, in agreement with the EU Regulation (Council Regulation (EC) No. 1/2005 of 22 December 2004). The slaughterhouse was located 9 km (G3) and 12 km (G4) from the farms where the animals were reared. Ten milliliters of blood was taken from each animal at the moment of the slaughter using Li-Heparin as the anticoagulant. In addition, 3 g of liver and 5 g of fat from the perirenal area of the carcass of each animal were also collected immediately after slaughter. This location was selected based on the hypothesis of Priolo et al. (Reference Priolo, Prache, Micol and Agabriel2002), who affirmed a greater accumulation of carotenoid pigments in the perirenal compared with the caudal fat in lambs. One hour after the slaughter, the instrumental color measurements of the perirenal fat samples were carried out. The samples were transported to the laboratory at 4ºC, the blood was centrifuged (1500×g, 10 min, 4ºC) and the plasma was collected. All the samples were stored at −80ºC until further analysis. Before the analysis, all the samples were thawed overnight and in the dark in a fridge at 4ºC.
The perirenal fat CIELab (CIE, 1976) color parameters (L*, a*, b*, C* ab and h ab ) were measured using a CM-700d spectrocolorimeter (Konica Minolta Holdings Inc., Osaka, Japan), considering the D65 Illuminant, the 10º Observer and zero and white calibration. The reflectance spectra in the visible region (approximately between 360 and 740 nm, considering 10 nm increments) were also acquired and recorded in order to obtain translated reflectance values (TR i ) and the absolute value of the integral (AVI) of the translated spectra. In previous studies (Priolo et al., Reference Priolo, Prache, Micol and Agabriel2002), the reflectance spectra between 510 and 450 nm were translated to make the reflectance value at 510 nm equal to zero (TR). The TR i was calculated from the reflectance values (R i ) as follows: TR i=R i −R 510 with i=360, 370, 380, … , 740; whereas AVI of the translated spectra was calculated according to the following formula:
 $$\eqalign{{\rm AVI}=[(TR_{{{\rm 45}0}} /{\rm 2}){\plus}TR_{{{\rm 46}0}} {\plus}TR_{{{\rm 47}0}} {\plus}TR_{{{\rm 48}0}} {\plus}TR_{{{\rm 49}0}} \cr\quad {\plus}TR_{{{\rm 5}00}} {\plus}TR_{{{\rm 51}0}} /{\rm 2]}{\times}{\rm 1}0$$
Carotenoids and fat-soluble vitamin extractions from plasma were carried out following the same methodology explained above for plasma of mares and cows. For liver samples, the methodology described by Woodall et al. (Reference Woodall, Britton and Jackson1996) was followed with some modifications. A total of 0.1 g of liver was lyophilized and the dried samples were homogenized in 0.5 ml of saline solution 85% (w/v). The compounds were extracted from the samples using 1 ml of dichloromethane by vortexing for 1 min, centrifuging (8000×g, 10 min at 4ºC) and collecting the lower layer. Samples were extracted twice, pooled and evaporated. Subsequently, the extracts were reconstituted with 35 µl of ethyl acetate for HPLC analysis. Finally, fat extraction was carried out following the methodology described by Dunne et al. (Reference Dunne, O’Mara, Monahan and Moloney2006) with some modifications. Five hundred milligrams of perirenal fat was mixed with 1 ml of 3,5-di-ter-4-butylhydroxytoluene (BHT) solution (12% w/v) in order to suppress the oxidation of the analytes. Five milliliter of ethanolic sodium hydroxide solution (30% w/v) and 5 ml of ethanol were also added. The saponification reaction was carried out overnight at room temperature and in the dark. Water was finally added to terminate the reaction and the analytes were extracted with 10 ml of a mixture ether/hexane (2 : 1 v/v). The samples were then centrifuged (8000×g, 10 min, 4ºC) and the upper organic phase was collected. The extraction process was repeated twice. The organic phases were pooled, washed several times with water, collected and dried. The residue was dissolved in 1 ml of ethyl acetate and filtered for HPLC analysis.
HPLC
The analyses were performed using an Agilent 1100 system (Agilent, Palo Alto, CA, USA), fitted with a photodiode array detector, a quaternary pump, a column temperature control module set at 20 °C and an auto sampler set to draw 20 μl aliquots from the concentrated extracts. A YMC C30 column (5 µm, 250×4.6 mm) (YMC, Wilmington, NC, USA) was used for the analyses. The mobile phase consisted of methanol (MeOH), methyl-ter-butyl ether (MTBE) and water according to the linear gradient: 0 min: 90% MeOH+5% MTBE+5% water; 12 min: 95% MeOH+5% MTBE; 25 min: 89% MeOH+11% MTBE; 40 min: 75% MeOH+25% MTBE; 50 min: 40% MeOH+60% MTBE; 56 min: 15% MeOH+85% MTBE; and 62 min: 90% MeOH+5% MTBE+5% water. The mobile phase was pumped at 1 ml/min and the chromatograms were monitored at 450 nm for carotenoids, at 325 nm for retinoids and at 280 nm for tocopherol. The compounds were identified by comparison of their spectroscopic and chromatographic characteristics with those of standards obtained from natural sources using recommended procedures as described elsewhere (Meléndez-Martínez et al., Reference Meléndez-Martínez, Vicario and Heredia2009). The quantification was performed using calibration curves of standard solutions.
Liquid chromatography-electrospray ionization ion trap/time-of-flight mass spectrometry
Identification of retinyl esters was carried out using HPLC-MS analysis according to Álvarez et al. (Reference Álvarez, Vicario, Meléndez-Martínez and Alcalde2014). The liquid chromatography in the HPLC-electrospray ionization (ESI)/TOF-MS system was Dionex Ultimate 3000RS U-HPLC (Thermo Fisher Scientific, Waltham, MA, USA). The HPLC conditions were the same as described above. A YMC C30 column (5 µm, 250×4.6 mm; YMC) was used. A split post-column of 0.4 ml/min was introduced directly on the mass spectrometer electrospray ion source. Mass spectrometry was performed using a micrOTOF-QII High Resolution Time-of-Flight mass spectrometer (UHR-TOF) with Q-TOF geometry (Bruker Daltonics, Bremen, Germany), equipped with an ESI interface. The instrument was operated in positive ion mode using a scan range from m/z 50 to 1200. Mass spectra were acquired in MS full scan. The instrument control was performed using Bruker Daltonics HyStar 3.2.
Statistical analysis
The SPSS 15.0 software for Windows (SPSS Inc., 2006) was used. The ANOVA test was applied to assess the existence of significant differences. The significant differences among groups’ means were determined by a Tukey-b post-hoc test, with a significance level of P<0.05. Correlations analyses were performed between β-carotene levels in plasma and milk from mares and cows as well as between AVI and b* values in fat of foals and calves, using the GLM procedure of SPSS. Discriminant analysis was carried out using a stepwise model considering the species of the animals as the independent variable. The discriminant classification method was leave-one-out-cross-validation. The significance level for a variable to be included in the model was 0.05.
Results and discussion
Carotenoids and vitamins in the tissues of mares and cows
Plasma
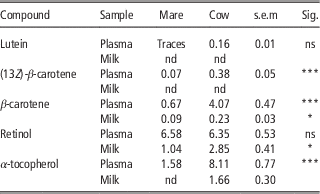
(13Z)-β-carotene and all-E-β-carotenes were present (Table 2) in the plasma of both species, the concentration being significantly higher (P<0.001) in cows than in mares, according to the numerical differences between the diets, although these differences were not statistically significant. The absence of significant differences in carotenoid content between both pasture diets (Table 1) was expected, as Nozière et al. (Reference Nozière, Graulet, Lucas, Martin, Grolier and Doreau2006a) summarized that differences in carotenoid content among plant species are less important that within-species differences due to drying, processing or maturity stage, and both pasture diets, for mares and for cows, were from similar growing areas during the same season. Lutein was also detected in cow plasma, but not in mares. In relation to this, dramatic differences in the bioavailability of carotenoids between different species of animals have been reported and it has been pointed out (Schweigert, Reference Schweigert1998) that some strictly herbivorous species may absorb carotenoids into the mucosa cells of the small intestine, but may not be capable of transferring the carotenoids into the body’s circulation. These observations could explain the low plasma carotenoid levels in mares. It must be underlined that our experimental design did not allow to assess the mechanisms of these differences and those observed are global effects of the experimental comparison between both species. In addition, Yang et al. (Reference Yang, Larsen and Tume1992) stated that, although xanthophylls account for the majority of dietary carotenoids, β-carotene is the main circulating carotenoid in bovines. However, the mechanisms that could explain the low apparent transfer of xanthophylls form forages to plasma in bovines have not been clearly described. Furthermore, Calderón et al. (Reference Calderón, Chauveau-Duriot, Pradel, Martin, Graulet, Doreau and Nozière2007) reported in cows fed a mixed ration (hay+silage+alfalfa +concentrate) two isomers of β-carotene in plasma – that is, all-E-β-carotene (78.9%) and (13Z)-β-carotene (8.6%); these results are in accordance with our results, where β-carotene represented 88.3% and (13Z)-β-carotene represented 8.2% of total plasma carotenoids in cow plasma. With respect to plasma carotenoid content (PCC) in mares, β-carotene appeared (Table 2) as the main circulating carotenoid (90.5%), wherease (13Z)-β-carotene appeared in much lower amounts (9.5%). Limited information is available in the bibliography with respect to PCC in mares, and, to the best of our knowledge, it is the first time that plasma carotenoid levels in cows and mares are being compared. Taking into consideration these data, it can be concluded that, despite there were no differences in the diets (Table 1), there were differences in circulating carotenoid levels between the bovine and equine species. However, more studies are needed in order to establish the underlying reasons of these differences.
Carotenoids, retinol and α-tocopherol (µg/ml) detected in the plasma and milk from mares (Group 1) and cows (Group 2), both fed on pasture

s.e.m.=standard error of the means; ns=not significant; nd=not detected.
Sig.: significant differences. *P<0.05, ***P<0.001.
On the other hand, retinol and α-tocopherol were detected (Table 2) in the plasma of both species. No significant differences in retinol levels were observed between both species. Previously, Greiwe-Crandell et al. (Reference Greiwe-Crandell, Kronfeld, Gay, Sklan, Tiegs and Harris1997) reported that grazing horses derive vitamin A from provitamin-A carotenoids present in the forages, but the efficiency of this conversion is relatively poor in these animals. Furthermore, it has been stated (Martin et al., Reference Martin, Fedele, Ferlay, Grolier, Rock, Gruffat and Chilliard2004) that the levels of vitamin A in blood of cows was unaffected by the diet because of the animal’s metabolic regulation. Considering our data (Table 2), it is tempting to hypothesize that this metabolic regulation also occurs in mares. This hypothesis could be supported by the data of Kuhl et al. (Reference Kuhl, Aurich, Wulf, Hurtienne, Schweigert and Aurich2012), who stated that a β-carotene supplementation did not increase plasma vitamin A concentrations neither in mares nor in foals.
Milk
β-carotene was the only carotenoid detected in the milk of both species (Table 2), the concentration being significantly higher (P<0.05) in cows than in mares. These findings are in contrast with those reported by Schweigert and Gottwald (Reference Schweigert and Gottwald1999), who observed that the concentrations of β-carotene in the milk of mares are comparable with those of cows. Greiwe-Crandell et al. (Reference Greiwe-Crandell, Kronfeld, Gay, Sklan, Tiegs and Harris1997) hypothesized that the bioavailability of β-carotene may be overestimated because of the presence or absence of other substances in the diet that may influence efficiency of absorption and metabolism, and there are significant differences in β-carotene utilization within species, which could explain the differences found in the present study. Moreover, Schweigert and Gottwald (Reference Schweigert and Gottwald1999) established that β-carotene levels in milk at all stages of lactation are highly dependent on the levels in plasma; however, we did not observe significant correlations (P>0.05) in this sense neither in mares nor in cows. Calderón et al. (Reference Calderón, Chauveau-Duriot, Pradel, Martin, Graulet, Doreau and Nozière2007) stated for cattle that when plasma β-carotene exceeds 5 µg/ml, the mechanisms involved in the transfer of β-carotene from plasma to milk are limiting in terms of β-carotene secretion. This indicates that the limitation of β-carotene secretion may not be due to a higher cleavage of this carotene in the mammary gland, but rather due to a limited uptake by the mammary gland or limited transport by binding β-lactoglobulin and/or due to saturation of milk fat globules. This can help in explaining the lower levels of β-carotene in cow’s milk with respect to plasma, as the total β-carotene plasma levels – that is, all isomers detected – reported in the present study were very close to the limit proposed by Calderón et al. (Reference Calderón, Chauveau-Duriot, Pradel, Martin, Graulet, Doreau and Nozière2007). More studies are needed to understand the mechanism of carotenoid secretion into milk in both species.
In addition, low levels of retinol were also found in the milk of both species (Table 2). Mora et al. (Reference Mora, Romano, Gonzalez, Ruiz and Shimada2000) demonstrated the low intestinal activity of 15.15′-dioxygenase, enzyme responsible for the conversion of β-carotene into retinal (that is further converted into retinol), in cattle, which may explain to some extent the presence of β-carotene in the milk of cows. This affirmation agrees with the data obtained in the present study for both cow and mare milk, which suggests that the transformation of carotene to retinol could be similar and limited in both species. Finally, α-tocopherol was present in cow but not in mare milk. Engel et al. (Reference Engel, Ferlay, Cornu, Chilliard, Agabriel, Bielicki and Martin2007) found a high depletion (3x) of α-tocopherol levels in mares from colostrum to milk, until achieving minimal levels of this vitamin at 4 days of lactation (ng/ml). This could explain, to some extent, the absence of this vitamin in mare milk. Nevertheless, more studies are necessary to establish the metabolism of α-tocopherol in both cattle and horses before trying to clarify the differences between the two species.
Carotenoids and vitamins in the tissues of foals and calves
Plasma
When plasma from foals and calves were analyzed, β-carotene and retinol levels were detected but α-tocopherol was not found, probably due to the absence of this vitamin in the concentrate fed to both species (Table 1). With respect to β-carotene levels, the plasma from the calves (0.05±0.04 µg/ml) showed higher (P<0.05) levels than that from the foals (0.02±0.01 µg/ml), probably due to minimal difference in β-carotene isomers content in the feedstuffs of both species (Table 1). However, the levels of β-carotene were lower than those reported in previous studies (Mäenpää et al., Reference Mäenpää, Koskinen and Koskinen1988; Gay et al., Reference Gay, Kronfeld, Grimsley-Cook, Dascanio, Ordakowski-Burk, Splan and Sklan2004; Serrano et al., Reference Serrano, Prache, Chauveau-Duriot, Agabriel and Micol2007) probably due to the diet of the animals, as Mäenpää et al. (Reference Mäenpää, Koskinen and Koskinen1988) studied foals fed on pasture, Gay et al. (Reference Gay, Kronfeld, Grimsley-Cook, Dascanio, Ordakowski-Burk, Splan and Sklan2004) studied suckling foal plasmas and Serrano et al. (Reference Serrano, Prache, Chauveau-Duriot, Agabriel and Micol2007) supplied a mixed diet of grass and concentrate. Moreover, Serrano et al. (Reference Serrano, Prache, Chauveau-Duriot, Agabriel and Micol2007) reported that the persistence of carotenoid in plasma is usually low, which could also explain the levels found in this study. With respect to retinol levels in plasma, no statistically significant differences were observed between foals (7.41±2.62 µg/ml) and calves (6.20±1.91 µg/ml). These levels are remarkable in comparison with those of β-carotene in the plasma of the same animals. In this sense, Schweigert (Reference Schweigert1998) confirmed that, in mammals, an estimation of the dietary carotenoid supplementation can be obtained from the plasma levels, as carotenoid levels in blood plasma are clearly affected by the dietary intake and reflect the intake of these compounds in recent weeks, contrary to vitamin A, which is homeostatically regulated. Therefore, it could be concluded that plasma carotenoid concentration of both foals and calves depend on the diet, whereas retinol levels are efficiently regulated for both species, independently of the diet.
Fat
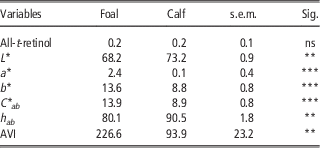
Retinol was detected in fat samples while carotenoids were not (Table 3). This fact could be due to the minor amount of carotenoids present in the diets of these animals (Table 1), which could result in negligible amounts of these compounds in their fat. α-tocopherol was not detected in the fat of the animals either, probably because of its absence in the diet and the fact that young animals accumulate less amount of pigments. Finally, retinol was detected in the fat of both foals (0.16±0.12 mg/g fat) and calves (0.20±0.10 mg/g fat), but no significant differences were found between species. This may indicate that there are certain similarities in the absorption and metabolism of this vitamin between species.
Retinol (mg/g fat), color parameters (L*, a*, b*, C* ab , h ab ) and absolute value of the integral (AVI) of the translated reflectance spectra measured in the fat of foals (Group 3) and calves (Group 4) with a diet based on concentrate

s.e.m.=standard error of the means; ns=not significant.
Sig.: significant differences. **P<0.01, ***P<0.001.
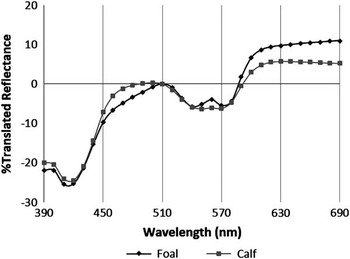
Table 3 summarizes the data relative to the color parameters measured in fat. All parameters showed significant differences (P<0.01, P<0.001), despite the fact that animals were slaughtered at the same age and they were reared under very similar conditions, indicating that such differences could be, to some extent, due to factors related to the species. More specifically, b* and L* values were significantly higher (P<0.001, P<0.01, respectively) in foals than in calves, indicating that the fat from foals was lighter and yellower than that from calves. In this sense, Priolo et al. (Reference Priolo, Prache, Micol and Agabriel2002) reported that yellow fat is associated with carotenoid accumulation, and thus it could be interesting for foal producers, as the ‘yellow fat’ could be associated with a desirable ‘natural’ and health-promoting diet, which could be exploited to increase the consumption of foal meat. Besides, when the percentage of reflectance spectra in the visible region (i.e. from 360 to 740 nm) of the fat from both species was evaluated, significant differences (P<0.01) were observed in the region between 450 and 510 nm (i.e. in the region where the carotenoids absorb light) between species. Figure 1 shows the average translated reflectance spectra of the perirenal fat of foals and calves, which is, to the best of our knowledge, the first time that foal fat spectrum is being measured and compared with that from calf fat. Prache et al. (Reference Prache, Priolo and Grolier2003a) demonstrated that perirenal fat carotenoid concentration is negatively related to live weight gain during the finishing period, whereas the spectrocolimetric index of perirenal fat remains high during this finishing period, which could support the hypothesis that foals accumulate more carotenoids in fat than calves, although more studies are needed in order to confirm this. Table 3 also shows the mean value of the AVI of the translated spectra between 450 and 510 nm (the integral values were always negative and for this reason is presented as absolute value) for both species. It could be observed that this AVI was significantly higher (P<0.01) in foals than in calves, supporting the hypothesis that there are differences in the accumulation of pigments in perirenal fat between both species. In addition, positive and significant correlations were found between AVI and b* values for both foals (r=0.830, P<0.01) and calves (r=0.839, P<0.01). Priolo et al. (Reference Priolo, Prache, Micol and Agabriel2002) also reported positive correlations between these two parameters in perirenal fat in lambs, and they attributed them to the carotenoid concentration in fat, so that higher values of b* and AVI were assigned to higher concentrations of these pigments in fat.
Averaged translated reflectance spectra pattern of perirenal fat of the foal (Group 3) and calf (Group 4). The reflectance values have been translated to have reflectance at 510 nm equal to zero.

Liver
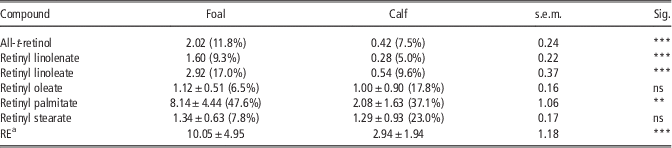
Wingerath et al. (Reference Wingerath, Kirsch, Spengler, Kaufmann and Stahl1997) reported that, in mammals, up to 80% of the body’s total retinol content is present in the liver, mainly located in stellate cells, representing that the retinyl esters with various long-chain fatty acids are the major storage forms. Table 4 shows the data relative to these compounds found in both foal and calf livers, as well as the retinol equivalent (RE) values calculated for both species. The livers of calves contained lower (P<0.001) amounts of vitamin A (2.94±1.94 mg RE/100 g) compared with foals (10.05±4.95 mg RE/100 g). These results in calves are in good agreement with those obtained by Majchrzak et al. (Reference Majchrzak, Fabian and Elmadfa2006), who reported 2.01±0.55 of mg RE/100 g as the mean value of RE in calves; however, these authors did not report data for foals. In addition, Alosilla et al. (Reference Alosilla, McDowell, Wilkinson, Staples, Thatcher, Martin and Blair2007) reported that vitamin A availability is limited in ruminants due to losses by ruminal destruction, which is especially high when ruminants are fed high concentrate diets. Therefore, under our trial conditions, it can be deduced that foals accumulate retinoids in liver better than calves; thus, the foal liver may be considered as a good source of vitamin A. In all the examined livers, vitamin A was present in both species as retinol, retinyl linolenate, linoleate, oleate, palmitate and stearate. Retinyl palmitate was the predominant form of vitamin A in the liver of both foals (47.6%) and calves (37.1%), which is in agreement with Majchrzak et al. (Reference Majchrzak, Fabian and Elmadfa2006). In addition, the profile of retinoids, in percentage, was different between species (Table 4), which is, to the best of our knowledge, the first time that retinyl linolenate is being identified in the liver from foals and calves. To sum up, the contribution of retinyl esters with saturated fatty acids – that is, retinyl palmitate and stearate – accounted for 55.4% and 60.1% of total vitamin A in liver of foals and calves, respectively. However, the retinyl esters with polyunsaturated fatty acids – that is, retinyl linoleate and linolenate – made up 26.3% of total vitamin A in foal liver and 14.6% in calf liver. Finally, the contribution of retinol and retinyl oleate to the total vitamin A content in the liver of foals was 11.8% and 6.5%, respectively, and 7.5% and 17.8%, respectively, in calves (Table 4). The difference in the retinyl ester profile might be due to the bacterial modification of dietary fat in the rumen of calves – that is, the freely released unsaturated fatty acids are hydrogenated to saturated fatty acids (Majchrzak et al., Reference Majchrzak, Fabian and Elmadfa2006). Finally, a discriminant analysis was carried out in order to assess which retinoids differentiate better the liver from both species. Retinol, retinyl stearate and retinyl palmitate were considered in the model. This model allowed classifying 100% of the liver samples according to the species (foal v. calf). All these results seem to indicate that the accumulation of retinol and its esters in liver is different between foals and calves reared under the same conditions. This should be taken into consideration as it is interesting from a nutritional point of view for humans.
Liver retinol, retinyl esters (mg/100 g) and mg REa/100 g of foals (Group 3) and calves (Group 4) with a diet based on concentrate

RE=retinol equivalent; s.e.m.=standard error of the means; ns=not significant.
The relative percentage of each retinoid relative to the total quantity in brackets.
a mg RE/100 g=mg all-t-retinol+mg retinyl palmitate/1.83+mg retinyl oleate/1.92+mg retinyl stearate/1.93+mg retinyl linoleate/1.92+mg retinyl linolenate/1.91.
Sig.: significant differences. **P<0.01, ***P<0.001.
Conclusions
Species-specific factors exist for the accumulation of carotenoids and fat-soluble vitamins (retinol and tocopherol) between equine and cattle livestock. In this sense, differences in circulation and secretion of carotenoids into the milk were found between mares and cows; thus, more studies are needed in order to establish the mechanism of this metabolism in horses. Furthermore, similar accumulation of vitamin A in plasma and fat was detected for foals and calves, which implies a homeostatic regulation of it in both species, independently of the diet. Finally, both species have a different metabolism for retinoids in the liver, and foals have a better ability to accumulate them. The foal liver may be considered as a good source of vitamin A, which should be taken into consideration from a nutritional point of view for humans.
Acknowledgments
This work was partially supported by the project AGR-7783-2011 Consejería de Innovación, Ciencia y Empresa, Junta de Andalucía. Rocío Álvarez Alonso held a predoctoral research grant from the University of Seville. The authors are members of the IBERCAROT network, funded by CYTED (ref. 112RT0445). Authors are grateful to Ecolactis® for sampling and to Mr José Miguel Mejías-Montalbo and Jose Luis Ríos for technical support.