

Introduction
The role of street-level bureaucracy in social policy has been taken up by two relatively distinct streams of research, based on Lipsky’s foundational work (2010). One group of literature has focused on the organizational working conditions, practices and coping mechanisms of street-level bureaucrats, their impact on the implementation of political programs and reforms, and the scope for discretion in the face of political pressures and institutional demands (Brodkin and Marston, Reference Brodkin and Marston2013; Jessen and Tufte, Reference Jessen and Tufte2014; Breit et al., Reference Breit, Alm Andreassen and Salomon2016; Van Berkel et al., Reference Van Berkel, Caswell, Kupka and Larsen2017; van Berkel, Reference van Berkel2020). Starting from a focus on interaction with clients and the direct impact of discretionary decisions ‘on people’s lives’ (Lipsky, Reference Lipsky2010, 8), a second group of studies has focused more on differences in allocation of benefits caused by perceived ‘deservingness’ and discrimination among street-level bureaucrats (Altreiter and Leibetseder, 2014; Terum et al., Reference Terum, Torsvik and Øverbye2018; Jilke and Tummers, Reference Jilke and Tummers2018).
Research on ‘representative bureaucracy’ provides a valuable but under-utilized contribution to the latter (Bradbury and Kellough, Reference Bradbury and Kellough2011, Riccucci and Van Ryzin, Reference Riccucci and Ryzin2017). The core idea of this agenda is that race, ethnicity and gender of individual bureaucrats will, under certain conditions, translate into active representation, meaning that they ‘will provide more substantive benefits to members of their own social group than to equally eligible members of other social groups – in contravention to the bureaucratic norm of impartiality and existing rules’ (Lim Reference Lim2006, 195). Looking specifically at ethnicity, we put this claim to the test in Danish job centers: based on a survey experiment, we study whether ethnic majority and minority caseworkers are more likely to grant clients from their own group benefits than other clients.
In this way, our study focuses on the administrative behavior of street-level bureaucrats as a source of discrimination and ethnically disparate welfare outcomes (Terum et al., Reference Terum, Torsvik and Øverbye2018, Phillips, Reference Phillips2011). Active representation implies in-group bias and partiality toward clients, which will generally benefit majority clients and place minority clients at a disadvantage (Meier Reference Meier2019). However, the representative bureaucracy framework also opens the problem of discrimination and ethnic disparity up to broader and systematic exploration, in particular with respect to the critical role of individual street-level bureaucrats and their encounter with clients and citizens in the allocation of welfare benefits. Moreover, the framework is well suited to experimental research, which is lacking in studies of social policy discrimination (Terum et al., Reference Terum, Torsvik and Øverbye2018).
From street-level to representative bureaucracy: the case of Danish job centers
The issue of representative bureaucracy applies to bureaucrats on all levels, at least in principle, but it is particularly pertinent to those at the street level. Active representation of race and/or gender have thus been studied and found among the classical examples of street-level bureaucrats highlighted by Lipsky, including police officers (Meier and Nicholson-Crotty, Reference Meier and Nicholson-Crotty2006; Theobald and Haider-Markel, Reference Theobald and Haider-Markel2009; Riccucci et al., 2014, Reference Riccucci, Ryzin and Jackson2018; Hong, Reference Hong2017) and teachers (Meier and Stewart Reference Meier and Stewart1992; Keiser et al., Reference Keiser, Wilkins, Meier and Holland2002; Meier and Rutherford, Reference Meier and Rutherford2017; Agyapong, Reference Agyapong2018; Zhang, Reference Zhang2019). Street-level bureaucrats implementing social policies, what Lipsky broadly referred to as social workers, have been studied more sparsely in the context of U.S. agencies providing assistance to needy families (Riccucci and Meyers, Reference Riccucci and Meyers2004) and child support (Wilkins and Keiser, Reference Wilkins and Keiser2004; Wilkins, Reference Wilkins2006).
However, this direction of research also reflects a particular approach to street-level bureaucracy. In contrast to more organizational and/or relational approaches, representative bureaucracy is an individual-level theory focused on the links between the social identity of street-level bureaucrats, administrative behavior, and policy outcomes for clients and citizens (Riccucci and Van Ryzin Reference Riccucci and Ryzin2017). More concretely, this means that working conditions and practices are either left entirely out of view, or treated as simplified contextual conditions in relation to the link between social background and administrative behavior. The latter approach can include factors such as program attributes and organizational patterns, but two are highlighted more consistently: discretion and the salience of social identities for such discretion (Keiser, Reference Keiser2010; Meier, Reference Meier2019).
Discretion and the more inclusive concepts of autonomy and independence are essential features of the street-level bureaucrat (Lipsky, Reference Lipsky2010). Correspondingly, the nature and limits of discretion has been researched extensively, in particular in light of political programs and reforms directly or indirectly curbing discretion through standardization, control and budget constraints (Breit et al., Reference Breit, Alm Andreassen and Salomon2016). However, studies of representative bureaucracy take their cue more from the point that ‘the attitude and general approach of a Street-level Bureaucrat toward his client may affect his client significantly’ under conditions of discretion (Lipsky Reference Lipsky1969, 2). Hence, the focus is not on the level of discretion per se, but rather with discretion as a necessary but insufficient condition of active representation. Concretely, this means that discretion is typically treated as a contextual condition established prior to the analysis, which raises the question: do caseworkers in Danish job centers have sufficient discretion for active representation to occur, at least in principle?
Debate over the effects of the workfare agenda on street-level discretion is ongoing, but there is considerable support for the view that street-level bureaucrats retain significant discretion, although it has been reduced by work first policies, performance management regimes and budget restraints (Jessen and Tufte Reference Jessen and Tufte2014, van Berkel Reference van Berkel2020). In line with this general description, frontline workers in Danish job centers do maintain discretion, even though it has been reduced by the workfare agenda and a system of ‘decentralized centralization’, which gives operational responsibility for activation policies to municipal job centers, but also submits them to extensive national supervision, benchmarking and control (Caswell and Larsen Reference Caswell, Larsen and van Berkel2017). Municipal job centers thus operate within a narrow and highly monitored goal of getting people back to work, but fullfillmint of this task still allows discretion for the individual caseworker. Indeed, the focus on client behavior and ‘people-changing’ in conditional welfare policy also gives frontline workers an added source of discretion in their assessment and response to the client’s situation (Caswell and Larsen, Reference Caswell, Larsen and van Berkel2017), a point also raised in the broader literature on welfare conditionality (Watts and Fitzpatrick, Reference Watts and Fitzpatrick2018).
The second sine qua non of active representation is salience of the social identity in question for the benefits over which discretion is exercised. If social identities are not relevant to the benefit being provided, active representation is not expected to occur. Salience is difficult to establish conclusively, but arguments typically rely on a mix of references to established socio-demographic categories, interest group activity, public opinion and media content (Keiser, Reference Keiser2010). The social identities probed most consistently in existing research are gender and race. Both of these can generally be assumed to be salient in relation to most welfare policies and social benefits, but due to the pragmatic constraints on the experimental study and the need to prioritize between potentially relevant identities, we focus on ethnicity. This, however, raises the question of the relationship between race and ethnicity, and more generally the application of a framework developed primarily in the U.S. to Denmark – and European cases more generally.
Existing research has focused on African American and/or Hispanic minority bureaucrats vis-à-vis white majority bureaucrats and clients in the U.S. (Meier and Stewart, Reference Meier and Stewart1992; Sowa and Selden Reference Sowa and Selden2003; Meier and Rutherford Reference Meier and Rutherford2017; Riccucci et al., Reference Riccucci, Ryzin and Jackson2018). Similar distinctions have been applied in studies in the U.K. (Andrews, Ashworth, and Meier, Reference Andrews, Ashworth and Meier2014; Hong, Reference Hong2017), but further extension of the framework beyond its American ‘comfort zone’ to Europe has also been called for (Meier and Hawes, Reference Meier and Hawes2009). However, conflicts in Europe do not reflect the racial categories used in U.S. research straightforwardly. Race and ethnicity are both essentially contested concepts subject to abuse, but ethnic identities can generally be considered broader constructs based on combinations of shared religion, language, geographical origin, cultural heritage and traditions. In the European context of extensive debates over immigration, inclusion, culture and religion, this is expressed primarily through the distinction between ‘Western’ and ‘non-Western’ ethnicity (Dancygier Reference Dancygier2010). This distinction is infused with questions of power and domination, but it nevertheless stands at the center of political attention and conflicts. A key issue here is the focus on religion and Islam as a marker of non-Western identity. While ethnic identities do remain cultural in a broad sense, religion has also become a principal signifier of cultural differences and conflicts (Dancygier Reference Dancygier2017).
Looking specifically at the Danish context, immigration and the relationship between the Danish majority and the ‘non-Western’ minority have remained on top of the public and political agenda for decades. In this process, Islam has often been singled out as the essential component of non-Western ethnicity in public and political debate, often in rather antagonistic ways (Nielsen, Reference Nielsen2011; Sniderman et al., Reference Sniderman, Petersen, Slothuus and Stubager2014). Materially, non-Western immigrants make up 6 percent of the Danish population, and descendants of non-Western immigrants 2,6 percent (Statistics Denmark, 2019a). The general socio-political salience of ethnic identities also has direct bearing on the job centers. The employment rates and labor market attachment of ethnic minority groups vis-à-vis the Danish majority have been an issue of consistent and even heated debate both in narrow policy discourse and broader public debate for at least a decade (Bredgaard and Thomsen, Reference Bredgaard and Thomsen2018). Moreover, there has been a constituent focus on the restriction of social benefits for immigrants, which have drawn international attention and criticism (Martinsen, Reference Martinsen, Lafleur and Vintila2020).
Variables and hypotheses
The core model of representative bureaucracy suggests that social background will affect the administrative behavior of individual bureaucrats, which will in turn produce differences in policy outcome for the client groups in question (Riccucci and Van Ryzin, Reference Riccucci and Ryzin2017). Passive representation may affect policy outcomes for other reasons, including organizational changes and client behavior, but these are ‘indirect’ compared to the ‘direct’ link between passive and active representation (Lim Reference Lim2006). This link invokes the broader socio-psychological concept of socialization, meaning that primary and secondary socialization processes are assumed to influence individual administrative behavior. While organizational socialization, rules and incentive systems are clearly recognized as important factors, the basic claim remains that these will not entirely nullify earlier socialization (Meier, Reference Meier2019; Meier and Hawes, Reference Meier and Hawes2009). This socialization effect is assumed to hold equally for majority and minority bureaucrats, leading to the following hypothesis:
H1 Job center caseworkers will treat clients of their own ethnicity as more deserving of unemployment-related benefits than clients with a different ethnicity.
The prevalent interpretation of the socialization model is that bureaucratic partiality occurs because socialization experiences lead to particular values and beliefs (Selden, Reference Selden1997; Riccucci and Van Ryzin, Reference Riccucci and Ryzin2017). Thus understood, values and beliefs are associated with overt advocacy as well as more or less implicit attitudes and biases, roughly equating conscious and unconscious bias by individual bureaucrats (Lim, Reference Lim2006). Although both types of bias fall within the scope of socialization theory, the former has been the focus of the dominant empirical approach to the issue: the study of individual identification with being a minority representative (or ‘trustee’) vis-à-vis a more traditional civil servant role associated with efficiency and neutrality (Selden Reference Selden1997, Sowa and Selden Reference Sowa and Selden2003). This approach has found strong correlation between commitment to the bureaucratic role of the minority representative and active representation.
By contrast, we focus on the perception of the broader socio-political problem likely to motivate active representation based on ethnicity: discrimination of minority clients. Hence, we assume that socialization experiences will make minority bureaucrats more likely to see ethnic discrimination as a problem than their majority counterparts and, secondly, that a high level of perceived discrimination will increase active representation of minority clients. Shifting the focus away from overt advocacy and values in this way is not only a matter of broadening the approach to values and beliefs theoretically; but also reflects contextual differences. Danish public administration is strongly influenced by the ideals and standards of impartial ‘Weberian’ bureaucracy, meaning that the traditional bureaucratic role is more or less universally accepted and unchallenged. In combination with a comparatively short history of focus on ethnic cleavages, this means that overt advocacy and commitment to minority representation is likely to be found incompatible with constitutive bureaucratic norms and professional self-understanding.Footnote 1 In other words, important attitudinal differences likely do not (yet) arise from conflicts over bureaucratic values in response to a broadly accepted problem, but rather the question of whether this problem exists in the first place. Individually held perceptions of already existing and general discrimination are thus assumed to affect the decision of the caseworker. This leads to the following hypotheses:
H2a Job center caseworkers of a minority background are more likely to find that minority clients are subject to general discrimination.
H2b Job center caseworkers will treat minority clients as more deserving of unemployment-related benefits if they perceive ethnic minorities to be subject to general discrimination.
Additionally, we test whether empathy toward the client plays a role in the link between passive and active representation. The issue of innate vis-á-vis learned empathy is subject to extensive debate and research within social psychology, evolutionary biology and neuroscience. However, the kind of situational empathy exercised by caseworkers interacting with clients can be plausibly linked to socialization experiences by previous research suggesting that empathy affects bureaucratic decision-making on the street level significantly (Jensen and Pedersen, Reference Jensen and Pedersen2017), as well as research on ethnic in-group/out-group bias (Albiero and Matricardi, Reference Albiero and Matricardi2013).
Empathy differs from advocacy and attitudinal congruence, insofar as partial behavior is assumed to occur not because of particular values or beliefs; but rather because shared socialization experiences provide bureaucrats with a capacity to understand the situation of clients from a background similar to their own (Lim, Reference Lim2006, 196). Such understanding for the clients and their life conditions involves a cognitive dimension (the focus of Lim’s argument), as well as a capacity for affective appreciation, i.e. an emotional capacity to put oneself in the place of the other, sometimes referred to more straightforwardly as sympathy. This capacity for cognitive and affective understanding is, in contrast to the perceived discrimination, assumed to be equally present among minority and majority bureaucrats. Hence, both the level and effects of empathy for their respective client groups should, in principle, be equal for minority and majority bureaucrats:
H3a Job center caseworkers will display higher levels of empathy for clients of their own ethnicity.
H3b Job center caseworkers will treat clients as more deserving of unemployment-related benefits if they empathize with their situation.
Method and data
In order to test the hypotheses, we distributed a survey to job center caseworkers, based on the principles of the experimental ‘paper people’ vignette methodology (Aguinis and Bradley Reference Aguinis and Bradley2014). In spite of the inherent emphasis on individual behavior, most studies of representative bureaucracy have in fact relied on aggregated measures of organizational performance, leading to a certain discrepancy between theory and data at best, and a tendency toward ecological fallacies at worst (Bradbury and Kellough Reference Bradbury and Kellough2011, 160). Survey experiments are well suited to avoid this problem, provided that the external validity is high. More concretely, the use of experimental vignettes presenting caseworkers in charge of real-life decisions with realistic and summary information about a fictional client provides a valuable and under-utilized approximation to individual administrative behavior (Atzmüller and Steiner Reference Atzmüller and Steiner2010).
The central component of the survey is thus a short and factual description of such a client, based on which caseworkers were asked to assess the eligibility of the client for unemployment-related benefits in general and the rehabilitation scheme in particular. The key measure of the dependent variable in the study is thus clearance rates for the rehabilitation scheme, supplemented by the broader assessment of eligibility for an alternative form of unemployment-related benefits. For citizens deemed fully employable, the portfolio administrated by municipal job centers includes provision of basic social benefits, support and control of job-seeking activity, internships and co-financing of designated part-time jobs, general qualification and job training, education, mentor support, coaching etc. Rehabilitation, by contrast, is a temporary support scheme designed to increase the employability and labor market readiness of citizens with reduced job capacity (Law 548, 07/05/2019, Chapter 21).
An offer of rehabilitation thus requires that the caseworker deems the client temporarily incapable of becoming fully self-sustaining through standard measures. The specific offer of rehabilitation is individual for each client, but includes monthly financial support dependent on the age and situation of the client, in various combinations with internships, wage supplements, education support and/or financial support for smaller business start-ups. The maximum length of a rehabilitation process is 5 years (subject to exceptions), but should be as short as possible according to the letter of the law. Against this background, the vignette was designed to make the client a likely candidate for rehabilitation, based on factors such as age, living conditions, family situation, educational and occupational background, military service, a moderate medical condition and a stated ambition to pursue education as a pedagogical assistant, while leaving sufficient uncertainty to make denial of rehabilitation by the caseworker a possible outcome. The survey was pilot-tested on 150 caseworkers, leading to minor revisions.
In line with similar designs, the experiment varies the ethnicity of the client by running two trials with different names, while leaving all other information in the vignette unchanged (Bertrand and Duflo Reference Bertrand, Duflo, Banerjee and Duflo2017). In the first trial, the majority client is referred to as ‘Jesper’, a common and consistently used Danish name, whereas the name ‘Ahmed’ was chosen for the minority client in the second trial as it is the most common name among Danish citizens of non-Western ethnicity, and among Muslims more generally (Statistics Denmark, 2019b). Correspondingly, the treatment effect of the experiment can effectively be understood as a measure of bureaucratic partiality, i.e. differences in clearance rates for rehabilitation and/or general eligibility between the majority and minority groups represented by Jesper and Ahmed. In addition to the two trials, the experiment includes variation in the ethnicity of the caseworker, determined on the basis of self-reported country of birth for the caseworkers and their parents. Non-Western ethnicity is thus equated with direct or parental origin in the Middle East, Sub-Saharan Africa, Asia or South America. Furthermore, we also identify a smaller subgroup of Muslim caseworkers, defined by parental or direct origin in a Muslim majority country (as listed by Pew Research Center, 2015). The overall experimental design is illustrated in Figure 1.
Experimental design

Based on this design, the overall test of ethnicity-based bureaucratic partiality required by hypothesis 1 can be conducted through comparisons of the two trials, but more importantly also through the pairwise comparison of groups A and C as well as B and D. Perceived discrimination, as defined by hypothesis 2a and 2b, is operationalized through two questionnaire items later used in an additive index. Although we did not find a direct template for the questions used in the survey, a broadly similar approach to problem perceptions as attitudinal variables can be found in a previous study of active representation by frontline workers in welfare agencies (Riccucci and Meyers Reference Riccucci and Meyers2004). As for hypothesis 3a and 3b, the questionnaire included two items inspired by a previous study of ethnically biased empathy (Neumann et al., Reference Neumann, Boyle and Chan2013). Although empathy is measured through extensive indicator lists in specialized psychological and clinical studies, this approach is neither feasible nor desirable within the parameters of our study. Hence, the included questions are designed to capture the basic cognitive and affective dimension of empathy. More generally, concerns for repetitiveness and the response rate outweighed the demand for index construction based on longer item lists. The specific wording of included variables is as follows:
Rehabilitation:
-
1) Given the above information, do you agree or disagree that [Jesper/Ahmed] should be granted rehabilitation? (completely agree=1/completely disagree=6)
General deservingness:
-
1) To what degree do you find [Jesper/Ahmed] deserving of aid from the municipality? (very much=1/not at all=6)
Perceived discrimination (additive index: Cronbach’s Alpha 0,7):
-
1) Authorities in my municipality are generally less forthcoming to citizens of a different ethnicity than citizens of Danish ethnicity (completely agree=1/completely disagree=5)
-
2) It is more difficult for citizens of a different ethnicity to get access to service and benefits in my municipality than for citizens of Danish ethnicity (completely agree=1/completely disagree=5)
Empathy (additive index: Cronbach’s Alpha 0,65):
-
1) Do you find the worries of [Jesper’s/Ahmed’s] understandable given his situation? (very much=1/not at all=6)
-
2) Did you sympathize with [Jesper’s/Ahmed’s] situation? (very much=1/not at all=6)
The survey was distributed to 5,338 caseworkers, out of a total population of approximately 35,000. The slightly over-sized sample represents a rough estimate of the numbers needed to ensure sufficient representation of minority bureaucrats according to standard experimental guidelines (i.e. a minimum of 30 respondents per trial for this group), based on the number of Danish citizens with a non-Western background and average responses rates for similar studies. The sample includes job centers in 52 of the 98 Danish municipalities and is nationally representative, although the larger Copenhagen area is somewhat underrepresented. The method of sampling gave priority to screening of respondents and direct distribution of the survey, thus drawing the bulk of the sample from job centers with publicly available staff information (29 municipalities/4052 caseworkers). In the remaining municipalities, middle managers in the job centers were identified through broader searchers in available online information on municipal staff and asked to distribute the survey among relevant staff (33 municipalities/1286 caseworkers). The method of distribution remains insignificant to response rates and results. The overall response rate is 27 percent, equal to 1.434 fully completed responses (78 % female and 22 % male). A further 112 caseworkers provided partially completed responses.
Results
The first step in the analysis is to determine the level of bureaucratic partiality exhibited by the caseworkers included in the experiment. To this end, table 1 compares the overall eligibility and clearance rates found in the two trials for both majority and minority caseworkers. Since the administrative decision taken is ultimately binary, this method of comparison is preferable to comparison of means. Looking at majority caseworkers first, we find a significant difference of 5 percentage points for affirmations of general eligibility and a highly significant 9 percentage point difference in the clearance rate for rehabilitation, both in favor of the majority client Jesper. In other words, the results provide clear support for the hypothesis that caseworkers will provide more substantial benefits to clients of their own ethnicity in the case of majority bureaucrats. We find the same result for minority caseworkers when it comes to the assessment of general eligibility for unemployment-related benefits, in particular among Muslim caseworkers who find the minority client eligible in 76 percent of the cases vs 63 for the majority client. However, the clearance rates for rehabilitation among minority bureaucrats tell a different story. On the one hand, the clearance rate for Ahmed is noticeably higher among minority bureaucrats than for majority bureaucrats, in particular among Muslim caseworkers. On the other hand, minority bureaucrats also grant Jesper rehabilitation more frequently.
Caseworker finding the client deserving of municipal assistance/qualified for rehabilitation. Percentages.

Note: For general deservingness, ‘very deserving’ and ‘deserving’ are included from the 5-point Likert scale, whereas clearance rates for the rehabilitation scheme includes all affirmative responses (‘fully agree’, ‘agree’ and ‘largely agree’) from the 6-point scale. If limited to the former two options, clearance rates for Ahmed and Jesper are, respectively, 33 percent and 40 percent (also significant at p < 0.001). *Five caseworkers abstained from a decision on qualification for rehabilitation.
Although the treatment effect is not significant within the naturally smaller group of minority caseworkers, this result is clearly noticeable. We thus observe bias in the opposite direction of what was expected for non-Western caseworkers and near-absence of bias within the smaller subgroup of Muslim caseworkers when it comes to clearance rates for rehabilitation. While both results contradict the hypothesis that caseworkers will treat members of their own ethnic group more favorably than clients of a different ethnicity, we can attest some importance to the fact that minority bureaucrats do indeed act more favorably towards the minority client than their majority counterparts. However, the fact remains that minority bureaucrats also act more favorably towards Jesper, meaning that hypothesis 1 can only be partially supported.Footnote 2 Moreover, the results indicate that active representation by minority bureaucrats is most likely to occur when the match between minority clients and Ahmed is based on the religious component of non-Western ethnicity, leading us to focus on Muslim caseworkers in the remainder of the analysis.
The next step concerns the role of values and beliefs in the link between social origin and administrative behavior. For this purpose, we focus on the clearance rates for rehabilitation, which remains the strongest measure of administrative behavior, and conduct a binary logistic regression including the additive index for perceived discrimination of minorities. In addition to the more general argument over OLS regression based on Likert-scaled variables, binary logistic regression is more closely aligned to the real-world implications of the experiment, i.e. the effects of changes in the independent variable on the probability of the caseworker clearing the client for rehabilitation. Correspondingly, the survey scales have been recoded to binaries. The results are found in table 2. Here, model 1 shows that the bureaucrats with a minority (Muslim) background are indeed significantly more likely to find discrimination of ethnic minorities a reality in the manner suggested by hypothesis 2a. Moreover, the model controls for the treatment effect, in order to ensure that perceived discrimination is not merely a priming effect of the vignette itself.
Binary logistic regression. Perceived discrimination and rehabilitation clearance.

Note: p < 0.05*, p < 0.01**, p < 0.001***; perceived discrimination (index) from 2= completely disagree to 10= completely agree; coefficients express the estimated average effects of changes in independent variables on the probability of an event (expressed as log-odds). N= 1504
Model 2 provides initial confirmation that perceived discrimination significantly increases the chance of clearance for rehabilitation, even if the partiality in favor of Jesper is still highly significant. The overall increase in the chance of clearance suggests that the benefits of belief in discrimination reaped by minority clients comes without a corresponding drop in clearance rates for majority clients. In order to test this more directly, we introduce the interaction between perceived discrimination and the name of the client in model 3. The negative and highly significant interaction effect shows that caseworkers believing discrimination against ethnic minorities to be a reality are indeed more likely to clear Ahmed for rehabilitation, as suggested by hypothesis 2b. Since the size of the negative interaction effect largely offsets the overall effect of perceived discrimination, moreover, perceived discrimination appears to have a positive effect for minority clients, but little or no effect on clearance rates for majority clients.
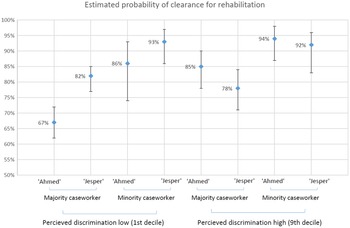
In order to further develop the substantial implications of this finding, we calculate probabilities for clearance to the rehabilitation scheme, based on King et al.’s argument and corresponding software for the use of simulation as a means to improve interpretation and analysis of statistical data and models, including binary regression (King, Tomz, and Wittenberg 2000, Tomz, Wittenberg, and King Reference Tomz, Wittenberg and King2003). The complete output is included as appendix A, but in accordance with King et al.’s focus on particularly interesting cases or scenarios, Figure 2 shows the estimated probabilities of clearance for each of the four groups included in the experiment when discrimination is found highly unlikely vs highly likely. In the former case, the difference between clearance rates for Ahmed and Jesper among majority bureaucrats is a full 15 percentage points, whereas the difference for minority bureaucrats is smaller and statistically insignificant. A minority client thus faces a particularly long road to rehabilitation when faced with a majority bureaucrat finding discrimination to be highly unlikely. If the majority caseworkers do find discrimination to be a problem, however, the estimated probability of clearance increases rather drastically from 67 to 85 percent for Ahmed and drops from 82 to 78 percent for Jesper. Among minority bureaucrats, perceived discrimination improves estimated clearance rates for Ahmed to a smaller degree (86 to 94 per cent) and leaves Jesper practically unaffected. In addition to overall support for both hypothesis 2a and 2b, then, we can add the important qualification that the impact of perceived discrimination on administrative behavior is particularly pronounced when majority bureaucrats are assessing minority clients.
Probability of clearance with low and high levels of perceived discrimination. (95% CI).

Finally, we introduce empathy as a possible factor affecting clearance rates for rehabilitation. In contrast to the attitudinal difference assumed for minority and majority bureaucrats on the issue of discrimination, the level and effect of empathy produced by socialization experiences should in principle be equal for majority and minority clients: higher degrees of empathy among minority bureaucrats should benefit Ahmed in equal measure to the benefits of increasing empathy among majority bureaucrats reaped by Jesper. Model 1 in table 3 below shows, in addition to a significantly higher level of empathy for Jesper through the entire of corps of caseworkers, that the overall level of empathy is in fact somewhat unequal between minority and majority bureaucrats: although moderately significant, the former are somewhat less empathetic toward the client than the latter. More importantly, we find that minority bureaucrats are not significantly more empathetic toward Ahmed than Jesper: the introduction of an interaction term in model 2 shows only a marginal and statistically insignificant reduction in the overall empathy bias for Jesper found in model 1 among minority bureaucrats, in contradiction of hypothesis 3a. What do these findings mean for clearance rates for rehabilitation? Model 3 indicates that empathy as such is indeed a strong predictor for clearance of rehabilitation measures, although the treatment effect remains moderately significant in the model. As shown by the inclusion of an interaction term in model 4, however, the effect is far from symmetrical for minority and majority clients. Rather, Jesper stands to benefit much more from an empathizing caseworker than Ahmed, which contradicts hypothesis 3b. Together with the findings from model 1 and 2, we thus find evidence that empathy does indeed influence administrative behavior, but also in a way that partially contradicts expectations.
Binary logistic regression. Empathy and rehabilitation clearance

Note: p < 0.05*, p < 0.01**, p < 0.001***; Empathy (index) ranges from 2= no empathy at all to 12= very high degree of empathy; coefficients express the estimated average effects of changes in independent variables on the probability of an event (expressed as log-odds). N= 1504
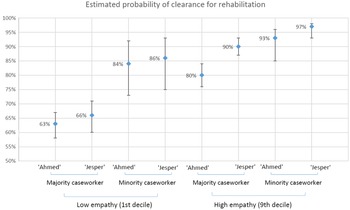
Using the same approach already applied to perceived discrimination, we develop the material implications of this finding through calculation of expected clearance rates for caseworkers with low and high levels of empathy (see appendix B for the full output). Figure 3 thus provides further confirmation that a higher level of empathy increases the likelihood of clearance significantly, but also demonstrates some notable differences between the four experimental groups. For one, a low level of empathy affects clearance rates among majority caseworkers much more than those of minority caseworkers, the latter still being rather generous. For both groups, however, a low level of empathy also means that the treatment effect almost disappears: the respective difference in clearance rates for Ahmed and Jesper are insignificant at 3 and 2 percentage points. For minority caseworkers, a steep increase in the level of empathy only increases the likelihood of clearance moderately, albeit still significantly, and leaves the difference in Jesper’s favor unchanged. For majority caseworkers, by contrast, a higher level of empathy increases clearance rates and widens the gap between minority and majority clients rather drastically. In sum, the hypothesis that bureaucrats are more emphatic toward their own group finds no support in the case of minority bureaucrats, and neither does the hypothesis that higher levels of empathy among majority and minority bureaucrats will benefit their respective client groups equally.
Probability of clearance with low and high levels of empathy. (95% CI).

Discussion
Within the parameters of the experimental design, the results clearly show that majority bureaucrats treat clients of their own group more favorably than minority clients. However, in-group bias has not been found for minority bureaucrats, which merits further attention. A potential explanation for this result could be differences in the costs associated with negative assessments of the out-group. Minority caseworkers are more favorable toward ‘Ahmed’ than their majority counter-parts, but they also clear ‘Jesper’ more frequently for rehabilitation. More than a fundamental argument against in-group bias and the underlying idea of socialization, this could suggest that negative assessments of the outgroup are more precarious for minority bureaucrats, whereas it is likely to be considered risk-free and/or subjected to limited reflection by majority bureaucrats. This logic seems consistent with the fact that minority decisions are more favorable toward majority clients in the case of the highly specific and formal decision on clearance for rehabilitation than for the general and looser assessment of eligibility. Although a conjecture as it stands, this explanation aligns well with recent attention drawn to importance of costs and risks in determining whether bureaucrats ‘decide to represent’ (Meier Reference Meier2019, 47).
In line with the expectations, perceived discrimination has been shown to be higher among minority bureaucrats and to have a positive effect on clearance rates. Although the measure here is problem perception rather than role perception, the result is broadly in line with existing research on advocacy (Selden Reference Selden1997, Sowa and Selden Reference Sowa and Selden2003). The most important insight from the study in this respect is that the effect of perceived discrimination on administrative behavior in favor of minority clients is considerably larger for majority bureaucrats than for minority bureaucrats. In other words, the results do not only show a tendency toward discrimination among majority bureaucrats, but also that this can be more or less offset by acceptance of discrimination as an actually existing problem and the awareness of the limits to bureaucratic impartiality that comes with this.
Empathy, for its part, has been shown to affect clearance rates significantly, thus providing robust prima facie evidence that understandings (both cognitive and affective) for clients are an important source of administrative behavior, and that active representation is only likely to occur beyond a certain threshold of empathy for the client. This clearly lends support to the notion that empathy is an important factor in how street-level bureaucrats approach their clients (Jensen and Pedersen Reference Jensen and Pedersen2017). Contrary to the expectations, however, increased empathy has also been shown to matter primarily for majority bureaucrats and work primarily to the advantage of majority clients, meaning that higher level of empathy not only increases clearance rates, but also widens the gap between clearance of minority and majority clients. These results should be interpreted cautiously given the more explorative nature of the study in this respect, but they do suggest that empathy interacts with socialization in complex ways in need of further attention.
The results also provide input to the ongoing debate on how to improve the situation of minority clients. The two options usually considered in the debate about representative bureaucracy are recruitment of more minority bureaucrats and bureaucratic standards associated with legal-procedural rationality and impartiality (Lim Reference Lim2006). Our study does not challenge either solution per se, but rather suggests that increased awareness of discrimination among majority bureaucrats could be key to improving the situation of minority clients. As seen from the perspective of the minority client, at least, the most immediate improvement to the chances of being cleared for rehabilitation comes from being faced with a majority bureaucrat who sees discrimination as something that can in fact happen in the municipality in question. In other words, educational activities and awareness training focused in this very possibility, and hence to the fact that bureaucratic procedure and legal frameworks are not automatic safeguards against material discrimination, could be an important and relatively manageable way to improve the situation of minority clients.
Conclusion
Our study shows how a representative bureaucracy approach can contribute to research on street-level behavior as a source of disparate welfare outcomes. We conclude by highligting some prospects for further research in this direction. First, the salient identities under research should be extended from ethnicity to gender. Gender has been excluded from the present study due to the research focus and the pragmatic limitations of the experimental research design (i.e. the need for additional trials, as well as sampling needed to included a sufficient number of male minority caseworkers), but gender is a salient identity in most areas of social policy, and it is competely integral to the representative bureaucracy framework. Secondly, representative bureaucracy raises important questions about discretion. Whereas researches have pointed to a loss of discretion caused by workfare agenda and performance management, in Denmark and elsewhere, discretion is generally viewed as a present (but insufficient) condition in most studies of representative bureaucracy. This is the result of a split in research focus and methodology already built into Lipsky’s work, but also points to a need for a reconnection of these streams at their source. Hence, there is a productive debate to be had, and a potential for mixed-method designs, which looks both at changes to street-level discretion and the active representation exercised within it.
Looking more specifically at ethnicity, a productive line of inquiry would be better integration of the representative bureaucracy framework within a ‘multi-level‘ approach to discrimination and ‘racialisation’ of ethnically disparate welfare outcomes (Phillips Reference Phillips2011). In particular, the emphasis on the causal link between socialization and individual administrative behavior complements the prevailing and more interactionist approach to ‘micro-level racialisation’, which primarily focuses on the context and process through which in-group/out-group perceptions and frames are developed and shared. Whether simply through improved dialogue or more integrated mixed-method designs, a combination of these approaches to micro-level racialisation thus holds significant promise. A concrete example of this would be the inclusion of frames and perceptions identified by interactive and interpretive research in studies of representative bureaucracy, as opposed to the rather one-sided focus on bureaucratic roles.
Micro-level racialisation is an important addition to institutional racism on the meso-level of analysis (Phillips Reference Phillips2011). This level spans from concrete institutional processes and practices to broader political discourses and governance practices, which confers status, rights and benefits on ethnic groups based on different rationales of ‘belonging’ (Carmel and Sojka Reference Carmel and Sojka2020). This, in turn, connects with the macro-level of racialisation, which includes more or less global patterns associated with the development of post-industrial society (Phillips Reference Phillips2011). Although research on representative bureaucracy does not focus on these levels directly, the framework does view the micro-level link between passive and active representation as contingent upon meso-level factors. However, this aspect also remains underdeveloped, and there is in this sense an untapped potential for more systematic inclusion of contingency factors. Key among these are factors related to political context. This could involve an attempt to operationalize and include the broader constructs of political discourse and ideas as policy paradigms or styles, as well as research focused more directly in the impact of political leadership. In systems with locally elected leadership of welfare agencies, leaders of different political persuasions may interpret legal and regulatory frameworks differently and send corresponding signals downwards toward the frontline. Whether focused on political context or other factors, a more comparative approach seems particularly well suited to focus on the intersection of micro- and the meso-level in this way.
Conflict of interest
No conflicts of interest to report.
Supplementary material
To view supplementary material for this article, please visit https://doi.org/10.1017/S0047279422000034