

Since 2019, governments around the globe have spent billions to decarbonize their domestic economies. Prominent examples include the $180 billion German Climate and Transition Fund, the roughly $300 billion in climate spending of the EU’s COVID NextGen stimulus, the $55 billion South Korean Green New Deal, and the US Inflation Reduction Act, estimated to cost well over $390 billion. Yet despite the widespread ramp-up of public investments in decarbonization, there remains substantial cross-national variation in the timing and size of such green fiscal spending.
This article argues that both the recent rise of climate spending policies and its cross-national variation can be explained by the relative size and influence of a new economic actor in climate politics that has so far been undertheorized: the decarbonizable sector, which includes automotive firms, utilities, and energy-intensive manufacturers. Decarbonizable industries have traditionally been understood as part of “fossil coalitions” of carbon-intensive industries that opposed meaningful climate policies (e.g., Brulle Reference Brulle2021; Cory, Lerner, and Osgood Reference Cory, Lerner and Osgood2021; Mildenberger Reference Mildenberger2020). We show that the growing political momentum behind major emission cuts has changed the decarbonizable sector’s political calculus. Beginning in the late 2010s, given the growing political momentum behind major emissions cuts, as well as new technological advances that made industrial decarbonization more feasible, many industries became susceptible to what we describe as decarbonization bargains. They became more accepting of climate goals in exchange for policies that maximize new economic transition opportunities from expanding green markets—while minimizing the transition costs and risks through public subsidies and other means of state support. For governments, such decarbonization bargains are also an appealing climate strategy. By focusing on fiscal incentives and green competitiveness, they broaden the base of economic supporters and reduce the size of the core fossil opposition.
We identify this political reorientation of industry interests as a key engine propelling the recent green fiscal expansion and argue that the relative size and political influence of the decarbonizable sector help explain variation in the size of green fiscal investments across rich OECD economies. For example, the decarbonizable sector is central to the export-led growth models of the economies of Germany, South Korea, or Austria, which leads us to expect that extensive public climate spending programs will increase the competitiveness of the existing industrial base. In contrast, in economies where the decarbonizable sector is small as a share of the overall economy and has limited political influence—for instance, in the United Kingdom or Switzerland—fiscal investments in decarbonization are likely not a large part of climate policy. We also document cases where the decarbonizable sector is not central to national growth models but remains politically influential; for instance, in federalist political economies like the United States or Canada. There, the geographic concentration of the decarbonizable sector in politically important swing states gives it outsize political influence. In such cases, we expect a higher level of green fiscal spending than the relative share of the decarbonizable sector would predict.
Our argument extends existing scholarship on climate change as a problem of distributive politics (e.g., Aklin and Mildenberger Reference Aklin and Mildenberger2020; Colgan, Green, and Hale Reference Colgan, Green and Hale2021). The literature has long conceptualized climate politics as a function of the struggle between larger fossil coalitions of carbon-intensive industries and insurgent green coalitions of clean tech startups and civil society actors. We build on such work and show that the fossil coalition has begun to fracture as a growing number of carbon-intensive yet decarbonizable industries have joined green groups in demanding a green fiscal expansion. Our argument also introduces new expectations about how differences in politico-economic structure influence climate policy outcomes. Specifically, it links the level of fiscal climate spending to a country’s growth model and industrial composition (Baccaro, Blyth, and Pontusson Reference Baccaro, Höpner, Blyth, Pontusson and Baccaro2022; Nahm Reference Nahm, Blyth, Pontusson and Baccaro2022). The turn to net-zero emissions does not pose the same challenge for all countries, even when they are rich and democratic; the challenge varies depending on each country’s political and economic setup. Our conception provides one way to make sense of this diversity by foregrounding the pivotal role of decarbonizable industries.
This article proceeds as follows. In the next section, we define the decarbonizable sector, theorize its interests, and quantify its relative size. We then explain our comparative research design, including our case selection for in-depth qualitative case studies: Germany, the United States, and the United Kingdom. We proceed to show how the new climate politics of the decarbonizable sector shaped climate spending policies across the three cases. The core of our empirical analysis is based on more than 200 primary documents published by trade organizations and governments on climate policy since 2018, as well as interviews with 17 representatives of decarbonizable industries.
The Decarbonizable Sector
This article builds on literature on the distributional politics of climate change, in particular scholarship that emphasizes the role of economic interests in shaping climate policy outcomes (Bechtel, Genovese, and Scheve Reference Bechtel, Genovese and Scheve2019; Brulle Reference Brulle2021; Cory, Lerner, and Osgood Reference Cory, Lerner and Osgood2021; Mildenberger Reference Mildenberger2020; Urpelainen and Aklin Reference Aklin and Urpelainen2018). Within this framework, climate politics has often been understood through the relative balance of power between low-carbon and carbon-intensive economic actors (Aklin and Mildenberger Reference Aklin and Mildenberger2020, 10). Our central claim is that the large fossil coalition has begun to fracture as the interests of the fossil fuel sector and carbon-intensive, yet principally decarbonizable, industries diverge.
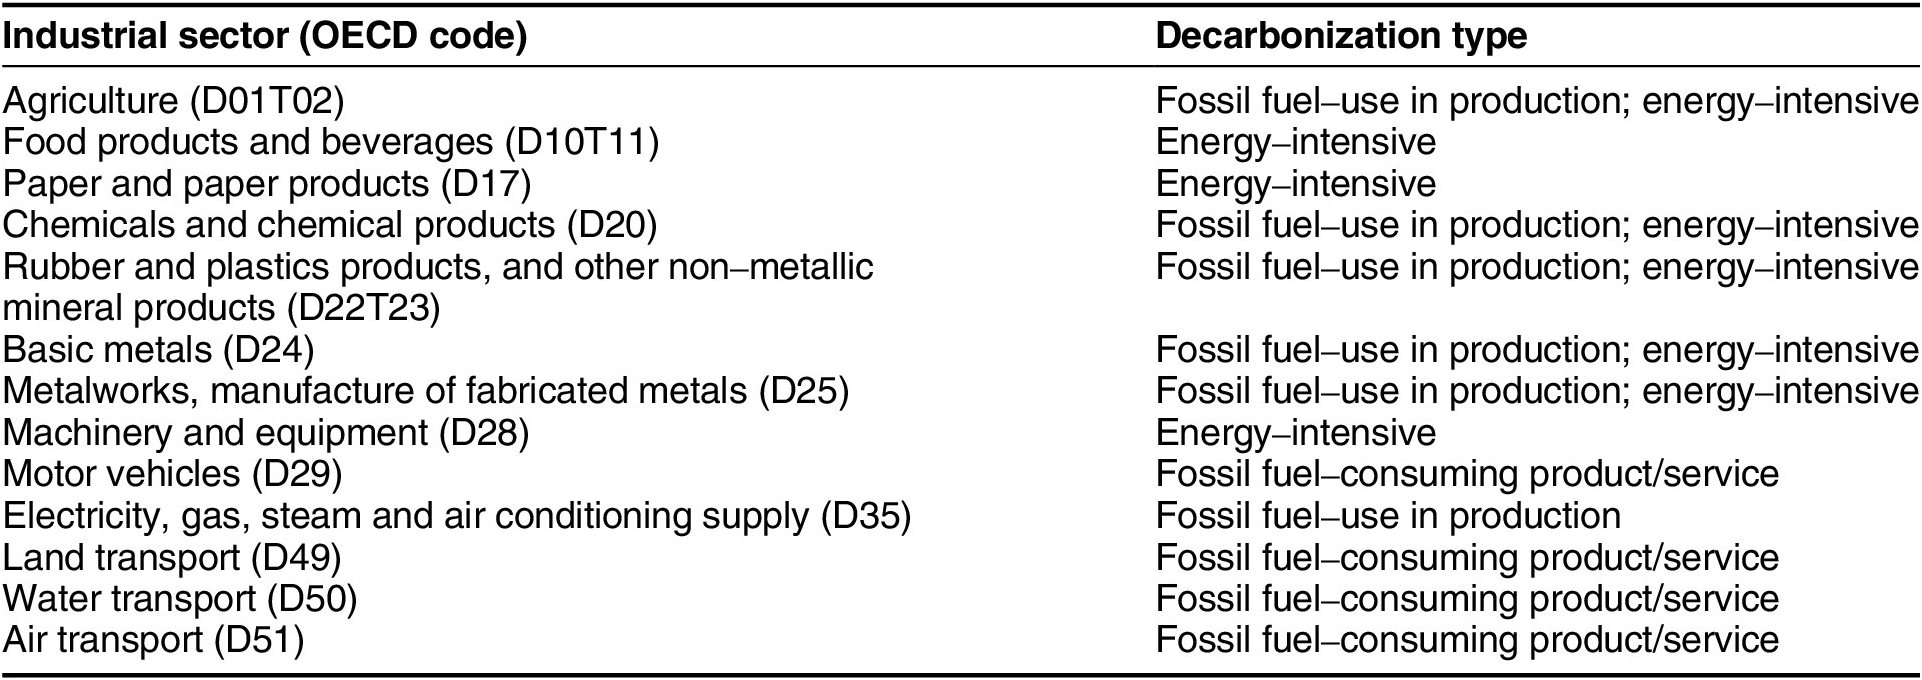
We define the decarbonizable sector as comprising industries that have a technological pathway to decarbonize their business models and can potentially derive competitive advantages from decarbonization if they can finance the upfront capital investments to make the switch. In contrast to green industries whose business model is already compatible with a net-zero economy, the decarbonizable sector faces large costs and risks generated by the necessary shifts in technologies. But in contrast to companies that produce fossil fuels, decarbonizable industries not only have a credible technological and economic pathway to decarbonizing their business models but, importantly, also may have transition opportunities to gain competitive advantages through decarbonization—even if they are currently heavily dependent on fossil fuels (table 1).
Analytical Types Differ Based on Industries’ Relative Risks and Opportunities in Making a Clean Energy Transition

The decarbonizable sector thus includes industries that currently use fossil fuels in production but have the potential to make the transition to hydrogen or renewable electricity; for example, chemical industries, metal manufacturers, and electricity producers. It also includes manufacturers, including those of automobiles or airplanes, that create products and services powered by fossil fuels but that can shift to energy sources like batteries or fuel cells. Lastly, it includes electricity-intensive industries such as paper, beverage, and food manufacturers. These industries have long benefited from inexpensive fossil fuel electricity but can now benefit from investing in energy efficiency or receiving compensation for higher electricity prices.
Fossil fuel producers are not part of the decarbonizable sector, despite their claims that carbon-capture technology can make their operations compatible with a carbon-constrained future. Even the International Energy Agency (2023b, 16) considers this technological pathway “inconceivable” because its large electricity needs would exceed the world’s current total electricity demand. Only a 60% reduction in oil and gas production by 2050 is compatible with warming below 1.5°C (International Energy Agency 2023b; see also Li, Trencher, and Asuka Reference Li, Trencher and Asuka2022). In addition, transitioning from producing fossil fuels to selling green power represents not merely the decarbonization of an existing business model but also a radical break from it because of the lower profitability of green power (Christophers Reference Christophers2024).
The Decarbonization Bargain
During the first three decades of climate politics, the intensity of transition risks and costs secured the position of the decarbonizable sector in fossil coalitions that prevented swift climate action. Extensive research has convincingly demonstrated that energy-intensive incumbents obstructed new green technologies and policies that would threaten their advantages in fossil-intensive production and products (e.g., Breetz, Mildenberger, and Stokes Reference Breetz, Mildenberger and Stokes2018; Brulle Reference Brulle2021; Mildenberger Reference Mildenberger2020).
However, the interests of the core fossil fuel sector and the decarbonizable sector have begun to diverge. A central reason for this divergence—in addition to new technological pathways to decarbonization for a growing number of industrial sectors—is the increasing political momentum behind major emission cuts in major economies around the world. As part of the 2015 Paris Agreement, but especially in response to a wave of new climate protests in the late 2010s, many governments have passed and begun to implement legislation to reduce emissions. This includes long-term net-zero carbon targets, short-term carbon prices, and phase-out regulation for fossil fuel technologies (Hale et al. Reference Hale, Smith, Black, Cullen, Fay, Lang and Mahmood2022; Meckling and Nahm Reference Meckling and Nahm2019).
As major economies are making progress on committing to emissions cuts, a new set of economic opportunities has emerged in the form of growing markets for zero-carbon products and technologies (International Energy Agency 2023a). Growing demand for green products is creating novel opportunities for zero-carbon business models. Indeed, anticipating such a demand, some countries and firms have made pioneering investments in zero-carbon technologies and industries to maximize the economic opportunities of this green shift and to leapfrog into global leadership positions. In China, for instance, decarbonization is part of a broader industrial strategy to overtake established industries in the rest of the world in markets from electric vehicles and batteries to water electrolysis (Helveston and Nahm Reference Helveston and Nahm2019; IRENA 2022; Meckling and Nahm Reference Meckling and Nahm2019).
The ability to use the green transition as an economic opportunity—and the new transition risk of losing competitiveness by failing to keep pace with the transition—makes a growing set of principally decarbonizable industries receptive to a bargain with the long-standing proponents of climate action (figure 1). We expect such firms to become more accepting of the need to reduce their emissions in exchange for policies that maximize the opportunities of their green business transitions. At the center of such decarbonization bargains are spending policies, including clean energy infrastructure investments, consumer subsidies, tax incentives, subsidized loans, or government procurement policies.
A Shifting Political and Economic Context Led a Growing Number of Decarbonizable Industries to Endorse Decarbonization Bargains

The economic interests and political advocacy of the decarbonizable industries and firms are, of course, not fixed or uniform. First, core to our argument, is their shared structural position vis-à-vis decarbonization, which is distinct from both the core fossil fuel sectors and the already green sector (see table 1). This structural position of firms and industries in the decarbonizable sector results in the potential to switch their economic and political position. If and when this potential is realized is an empirical question. For example, the power sector is clearly the pioneering example of firms engaging in decarbonization bargains. Industries like agriculture and aviation are still at the beginning of this process (see figures 2 and 3). Second, although we expect that decarbonizable industries will come together in advocacy for more climate spending, they can diverge on other climate policies. Steelmakers can support trade policies that protect them from international competition, while power companies will push for protection from decentralized energy producers. Such differences could conceivably lead to inter-industrial conflicts over electricity prices or free trade, for example.
Decarbonizable Industries Have a Uniquely Flexible Position vis-à-vis Climate Policies When the Balance of Transition Risks, Costs, and Opportunities Shifts

None of these pivots in industry advocacy imply that the decarbonizable sector is a new climate advocate when emissions reductions do not align with economic opportunities. Our analysis of the business risks and opportunities of green transitions suggests that the decarbonizable sector will likely remain opposed to policies such as carbon pricing whose sole goal is to penalize carbon pollution (table 2). As the policy process shifts to the concrete implementation of new climate spending policies, differences between industry and climate advocates are likely to surface again, especially over conditions of near-term emissions reductions.
Policy Preferences in the Era of Decarbonization

Note: Generally, we expect that bystander industries will oppose green fiscal spending if they are made to pay for it, such as via tax increases.
This is of course not the first attempt to map out the distributional dimension of climate politics. Colgan, Green, and Hale (Reference Colgan, Green and Hale2021) examine the existential conflict between holders of climate-forcing assets and those with climate-vulnerable assets. In their framework, economic actors shift their policy stance when assets flip from climate forcing to climate vulnerable. Our study builds on this emphasis on transition risks but adds a focus on opportunities from the energy transition that divide the policy preferences of holders of climate-forcing assets. Similarly, we concur with Kelsey (Reference Kelsey2018) who goes beyond categorizing winners and losers from climate policies to differentiate between “management industries” and “convertible industries.” The former use fossil fuels in production (like steelmakers) and are expected to always oppose climate policies. The latter produce fossil fuel-based products (like carmakers) and may support climate policies. In contrast, we propose that industries (including both carmakers and steelmakers) should come to endorse fiscal policies that give them an edge when going green. Our concept of the decarbonization bargain builds on existing work on climate policy sequencing that has so far examined the positive feedback emanating from green industrial policies and cross-policy subsystem pressures (Meckling and Goedeking Reference Meckling and Goedeking2023; Meckling, Sterner, and Wagner Reference Meckling, Sterner and Wagner2017). We add to this literature by showing that net-zero laws and other types of phaseout commitments can shift the political role of an important group of industrial interests.
The Comparative Political Economy of Climate Spending
Our reconceptualization of industrial interests vis-à-vis climate politics allows us to make predictions about when and why industries shift their advocacy toward demands for fiscally expansive climate policies. It also offers new insights about the relative impact of this new advocacy on fiscal policy outcomes: the more central the decarbonizable sector is to the domestic economy, the higher the expected level of climate spending.
The centrality of the decarbonizable sector to a country’s economy is first and foremost a function of its relative size as share of a country’s gross output. We expect that the larger the size of the decarbonizable sector’s share of gross output, the higher the level of fiscal climate spending relative to a country’s GDP. Countries with a relatively large decarbonizable sector must invest more to decarbonize it. Simply put, they have more steel plants, more car factories, and more power plants that need to be retooled or replaced. A larger relative size of the sector can also be linked to greater political influence because it ties a country’s economic well-being directly to that sector’s success, notably through jobs, growth, and tax contributions. It is thus in a better bargaining position vis-à-vis governments to extract fiscal support.
To approximate the size of the decarbonizable sector, we use the OECD’s Structural Analysis Database, which decomposes OECD economies into 99 industrial types as a share of total gross output. Table 3 provides an overview of the 16 industries we coded as constituting the core decarbonizable sector. Based on our definition provided earlier, identifying industries that either use fossil fuel in production or sell fossil fuel-based products and services is straightforward. It is more difficult to identify the third group: energy-intensive industries. To identify energy-intensive industries, we relied on IEA (2021) estimates of energy use by industrial sector. We coded industries as energy intensive if they consumed more than 2% of global industrial energy. This cutoff excludes the construction industry, which, despite being one of the largest global industries, only consumes 2% of global industrial energy. Conversely, the smallest industry we include in the decarbonizable sector is the paper and pulp industry, which, despite being much smaller than the construction industry, consumes 4% of global industrial energy. Figure 4 depicts the resulting shares of gross output for the 20 richest OECD countries.

Share of the Decarbonizable Sector in OECD Countries with the Highest GDP per capita, Authors’ Own Calculations
Note: Israel is excluded because it reported no industry data for recent years. Both South Korea and Japan are included because they reported similar levels of GDP per capita and frequently switch in and out of the last rank.

In addition to sheer relative size, the decarbonizable sector’s influence is subject to a second factor: its sources of political influence, which are independent of its size. We expect that the greater the political influence of the decarbonizable sectors on a country’s government, the higher the level of climate spending relative to a country’s GDP.
This political influence depends on a variety of factors. Some are systematic and predictable. We put special importance on the centrality of the decarbonizable sector to a country’s growth model. A country’s growth model is a factor that shapes the uneven standing of different industries within a country’s larger political economy (Baccaro, Blyth, and Pontusson Reference Baccaro, Höpner, Blyth, Pontusson and Baccaro2022). Similarly, institutional differences can offer the decarbonizable sector more political clout in some places than others. Corporatist structures, for instance, can give decarbonizable industries a better bargaining position for fiscal support (Finnegan Reference Finnegan2022). Moreover, federalist legislative and electoral institutions can amplify regional economic interests, even when they make up a small share of an economy’s gross output (Grumbach, Hacker, and Pierson Reference Grumbach, Hacker, Pierson, Hacker, Hertel-Fernandez, Pierson and Thelen2021). Of course, such institutional factors can cut both ways: regional voices can be green, fossil, or decarbonizable (Oatley and Blyth Reference Oatley and Blyth2021). Yet other factors are more contingent and even harder to predict. For example, some political parties can be receptive to demands for a green fiscal expansion based on their ideological priors, especially regarding fiscal austerity. The measurement of the political influence of the decarbonizable sector requires careful qualitative case-by-case analysis, as we discuss in the next section.
Case Selection and Research Design
For an empirical probe of the hypotheses, we opt for a comparative case study research design. Case studies are generally considered ideal in probing the plausibility and usefulness of new hypotheses and concepts (Eisenhardt Reference Eisenhardt1989; Yin Reference Yin2009). Qualitative case studies have the advantage of being able to integrate a variety of systematic, underdetermined, and contingent factors. They allow us to examine their relative importance and causal direction through careful contextualization (e.g., Mahoney Reference Mahoney2007). For our theory, this is especially relevant for the sources of political influence not tied to the size of the decarbonizable sector. However, qualitative comparative analyses also set clear limitations in terms of the generalizability of new insights. We work to counterbalance such limits through the careful discussion of scope conditions and case selection.
A crucial scope condition for our argument is a country’s fiscal capacity and authority. To expand climate spending, a country needs to have the necessary budgetary resources and explicit control over them. We thus limit our universe of cases to the 20 OECD economies with the highest per capita GDP. Extending the analysis beyond the OECD 20 would involve middle-income countries whose fiscal resources are limited. Richer OECD countries are in any case central to global decarbonization efforts, given their large carbon footprints. They account for about 28% of global emissions and half of the global GDP and bear responsibility for most historical emissions. These countries also have the unique opportunity to play an outsized role in the international diffusion of new greener technologies and products, making the cases especially relevant for the future of climate politics (Hasna et al. Reference Hasna2023).
From our universe of cases, we select three countries that show significant variation in the size and political influence of the decarbonizable industries: Germany, the United States, and the United Kingdom. Germany is a country with a large decarbonizable sector, making up close to 30% of its gross output. Additionally, around 80% of these principally decarbonizable industries are central to Germany’s growth-led economic model (figure 5), including its large auto and energy-intensive manufacturing sectors (Baccaro and Höpner Reference Baccaro, Höpner, Blyth, Pontusson and Baccaro2022).

The United Kingdom and the United States serve as contrasting cases with relatively small decarbonizable sectors. We use the comparison between them to examine our second hypothesis regarding political influence, treating them as two most-similar cases in terms of sector size. Indeed, from the perspective of comparative political economy, the United Kingdom and the United States share many economic and political characteristics because of their finance-led growth models and status as liberal market economies (Hall and Soskice Reference Hall and Soskice2001; Reisenbichler and Wiedmann Reference Reisenbichler, Wiedmann, Blyth, Pontusson and Baccaro2022). Despite these similarities, we expect the decarbonizable sector in the United States to wield greater political influence and therefore have a stronger bargaining position. This is primarily because of its federal legislative and electoral institutions, which amplify the voices of regional economies (Grumbach, Hacker, and Pierson Reference Grumbach, Hacker, Pierson, Hacker, Hertel-Fernandez, Pierson and Thelen2021)—in this case the decarbonizable sector of important Midwestern swing states. The United Kingdom has no comparable institutional veto points tied to regional economic strongholds.
For the case studies, we combine a series of qualitative and quantitative data sources. We draw on data from the OECD’s Structural Analysis Dataset and the US Bureau of Economic Analysis to probe the size of the decarbonizable sector in each of the three economies. We use official public statements on climate politics from the largest decarbonizable industries in the three countries: carmakers, metals manufacturers, machine builders, and electric utilities. Given the state of technology, these industries should be at the forefront of the push for fiscal support in exchange for climate commitments, compared to industries like aviation where a clear technological pathway to decarbonization has not yet been established. We also collect public statements from the largest national industry organizations for each of these sectors, compiling more than 200 climate policy statements by industry associations across the three cases from 2018 to 2023. We triangulate our findings with confidential interviews with 17 industry representatives from the key trade groups. In addition, we rely on a series of primary documents by governments on green fiscal spending, as well as secondary journalistic and academic accounts.
The Decarbonization Bargain and Fiscal Climate Policies
Our case studies first examine data on the political advocacy of decarbonizable industries before 2019, as well as initial debates over fiscal aid for decarbonization. We then trace how new political pressures and economic opportunities from the energy transition led to a shift in advocacy by major industry groups in favor of a green fiscal expansion. Lastly, we document the government response and provide quantitative estimates of the level of climate spending (table 4).
Case Studies Overview

Germany
In Germany, calls for an expansive green fiscal turn emerged in the aftermath of the 2007–8 global financial crisis. Climate advocates, the Green Party, and progressive unions used the economic crisis as an opportunity to call for increased investment in green jobs and industries (e.g., Bündnis 90/Die Grünen 2009; Deutscher Gewerkschaftsbund Reference Gewerkschaftsbund2012; Giegold and Bütikofer Reference Giegold and Bütikofer2009). These calls initially had some success; the German fiscal response to the global financial crisis was to allocate around 15% of its spending to emissions-reducing activities (Nahm, Miller, and Urpelainen Reference Nahm, Miller and Urpelainen2022). But the increasing attention given to green fiscal expansion did not shift the political stance of powerful energy-intensive industries in the subsequent decade. Automakers, utilities, energy-intensive manufacturers, and umbrella industry groups primarily focused on preventing policies that would force them to make significant emission reductions (figure 5; see Brauers, Oei, and Walk Reference Brauers, Oei and Walk2020; Goetze and Joeres Reference Goetze and Joeres2022; Kupzok Reference Kupzok2020; Meckling Reference Meckling2014; Pellerin-Carlin, Lamy, and Pons Reference Pellerin-Carlin, Lamy and Pons2022; Rasmussen Reference Rasmussen2015).
Yet, such industry opposition failed to prevent the German government from adopting increasingly ambitious emissions reduction pledges. The potential economic consequences of these nonbinding pledges led decarbonizable industries to begin to reconsider their political stance on decarbonization. Paradigmatic for this process were the negotiations around the 2016 Klimaschutzplan 2050 that was meant to create a corporatist-style policy consensus between industry and civil society around long-term emissions reductions. As part of these negotiations, industry actors—ranging from the union representing coal miners to the largest German business association—successfully prevented policies that would have led to strong emissions reductions, such as the phaseout of coal power or a ban on internal combustion engines (Bundesumweltministerium 2015; Wacket Reference Wacket2016). Industry nonetheless failed to prevent a government pledge to reduce emissions by 80–95% by 2050 (Bundesministerium für Umwelt, Naturschutz, Bau und Reaktorsicherheit 2016), which led industry leaders to openly explore what decarbonization would mean for them. Most importantly, in 2018, the Association of German Industries released a commissioned study arguing that the government’s climate goals could create “opportunities,” specifically “for German exporters in growing ‘climate protection markets’” (Boston Consulting Group and BDI 2018; interview, March 15, 2023). Additionally, the report outlined the need for large-scale investments of about 1.2% to 1.8% of GDP to achieve this successful decarbonization scenario.
Although first confined to expert reports, the focus on transition opportunities and the need for strong fiscal support became the cornerstone of industrial advocacy in the wake of Germany’s 2019 Net-Zero Law. Amidst growing pressure from an emerging youth-driven climate movement and the electoral successes of the oppositional Green Party, it became evident that legislation for legally mandated emissions reduction targets would be enacted with broad support from parties across the political spectrum. Higher and more extensive carbon-pricing policies and phaseout regulations would follow (de Moor et al. Reference De Moor, De Vydt, Uba and Wahlström2021; Pearson and Rüdig Reference Pearson and Rüdig2020). Industry representatives describe the Net-Zero Law and its policy repercussions as a tipping point that changed their advocacy strategy, weakening their resistance to reducing emissions and leading them to demand strong fiscal support that could minimize their costs and risks and maximize the business opportunities from decarbonization. Three days after the German parliament passed the Net-Zero Law, the German Industry Association joined Germany’s umbrella trade union organization in proposing a strong fiscal expansion with an emphasis on decarbonization (BDI and DGB 2019; IW and IMK 2019). Industry groups began publishing comprehensive reports, outlining their technological pathways to net zero, as well as the concrete fiscal and regulatory support needed to make this transition an economic success (e.g., BDI 2019; Mattes, Reference Mattes2019; Wirtschaftsvereinigung Stahl 2019; interview, March 3, 2023).
This advocacy continued throughout the COVID-19 pandemic. Industry groups called on the government to make a green fiscal expansion central to the crisis response and to put out increasingly detailed calls for action (BDEW 2020; 2021; BDI 2021; VDA 2021; VDMA and Boston Consulting Group 2020; VDA, 2021). For example, in 2022, the German Industry Association called for 230–80 billion euros of climate spending from then until 2030. The report describes climate policy not only as “a tremendous and strenuous effort” but also a “historic chance.” Decarbonization can become a “new source for future economic growth” that could be a “chance” for “German exporters” due to the “rapidly growing global markets for climate protection technologies” (Boston Consulting Group and BDI 2022, 32; interview, March 17, 2023).
The German government was receptive to this new industrial advocacy. Indeed, strong climate spending became identified with German economic interests, reflecting the centrality of the decarbonizable sector to the German growth model. The centrist government under Angela Merkel explicitly tied the passage of the Net-Zero Law to the provision of new funding for decarbonization in the “three-digit billion-euro range.” The government stressed that this climate spending was an “investment in the future of the German economy and associated jobs” (Bundesregierung 2019; authors’ translation).
In 2021, a new Social Democrat-led government reaffirmed this commitment, agreeing to spend more than 200 billion euros on the energy transition by 2026 (Lindner, cited in ZDF 2022). Between 2020 and 2023, climate spending quadrupled, jumping to around 35 billion euros a year. For example, in 2023, the government committed to 6.6 billion euros to support major steel producers in converting to hydrogen-based production and 30 billion euros for the buildout of renewable power generation (interview, October 27, 2023). The German economic minister defended this fiscal ramp-up, arguing that it had become central to Germany’s “economic future,” particularly as other countries like the United States were also increasing their fiscal support for industry decarbonization (Habeck Reference Habeck2022). But policies to support the decarbonizable industries went beyond spending: they prominently included a trade policy dimension when the German government backed the EU Commission’s push for a carbon border adjustment mechanism that would impose a fee on carbon-intensive imports from countries without a comparable carbon price—an old idea by the French government adopted by its key EU ally (McNamara Reference McNamara2023). Industry representatives emphasized the government’s responsiveness to their policy demands. However, exporting industries also highlighted the need for additional trade support, particularly for exports to non-EU markets (interviews, March 3, 2023a; 2023b; March 17, 2023; March 15, 2023; October 27, 2023).
The main obstacles to the new expansive green fiscal agenda are neither inter-industrial conflict nor a lack of government support but rather constraints that limit Germany’s fiscal space, particularly the constitutional debt brake that restricts new government debts to 0.35% of GDP. The German government first tried to work around these debt limits by reallocating 95 billion euros from COVID-19 funds into an extra-budget, the previously defunct Climate Fund (BMKW 2021; Bundestag 2019). Prompted by a lawsuit by the new leader of the conservative CDU, who claimed that the suit was directed against illegal budget practices and not “against adequate means to address the climate crisis” (Merz, quoted in Die Welt 2022), the Constitutional Court issued a ruling rescinding this reallocation in December 2023. The government subsequently reduced some spending, mostly for more mature zero-carbon technologies like solar panels and electric vehicles. Despite these cuts, funding through the Climate Fund is projected to increase from 35 to 49 billion euros between 2023 and 2024 (Bundesregierung 2023).
The Climate Fund is not the only source of climate spending in Germany. The German Economic Ministry independently will spend around 3.9 billion euros to support the green transition in 2024 (Bundestag 2023). Germany is also responsible for around one-fifth of the seven-year EU budget totaling around 2 trillion euros, 30% of which is allocated to green purposes (European Commission 2022). Altogether, a conservative estimate of Germany’s annual climate spending between 2024 and 2026 is around 52 billion euros, which is about 1.4% of its 2021 GDP. This estimate does not include the billions of green EU funds, the investments and cheap loans by German and European public investment banks, and the European Central Bank’s greener monetary policies (European Investment Bank 2022; Jabko and Kupzok Reference Jabko and Kupzok2024; Kreditanstalt für Wiederaufbau 2022).
The German case confirms our central theoretical expectations: decarbonizable industries began advocating for a green fiscal expansion only after it became clear that substantial emission reductions were inevitable, as part of the 2019 Net-Zero Law. After passage of the legislation, German governments were highly responsive to the combined calls for fiscal support from industry, green, and labor groups. Decarbonization began to be perceived as a do-or-die moment for the German economic model, which relies greatly on the continued competitive strength of its exporting decarbonizable industries.
The United Kingdom
Advocacy for a fiscally expansive climate policy in the United Kingdom began during the global financial crisis (Green New Deal Group 2008), when 10% of economic stimulus funding was dedicated to green purposes. But the increasing prominence of the strategy to fight climate change via spending policies ultimately failed to yield a shift in industry advocacy. Indeed, industries ranging from automakers to energy-intensive manufacturers frequently fought against EU-level climate regulations, securing exemptions from domestic and EU-level carbon-pricing policies, for example (figure 6). Except for such similarities in the roles played by economic interests in climate politics, the situation in the United Kingdom differed from that in Germany in important ways. The United Kingdom’s dominant industries, such as finance and real estate, were either neutral toward emissions reductions or saw benefits in climate policies like carbon trading. In addition, the United Kingdom was able to position its utility sector early on as a benefactor from climate action—made possible by weakening of the coal industry and of associated labor groups under Thatcher beginning in the 1980s. The special role of business in climate politics is often cited as a key reason why the United Kingdom was able to introduce more ambitious climate policies than its peer countries, first and foremost the 2008 Climate Change Act (Brauers, Oei, and Walk Reference Brauers, Oei and Walk2020; Carter Reference Carter2014; Lockwood Reference Lockwood2013; Reference Lockwood2021; Meckling Reference Meckling2014; Paterson Reference Paterson2024).
Industrial Composition of the Decarbonizable Sector in the United Kingdom
Source: OECD STAN.

As in Germany, industries long opposed to climate policy began to reconsider their stance in the second half of the 2010s when long-term emission cuts became more salient. The UK government also attempted to create a consensus between relevant business and civil society actors around such goals. Although some of these engagements were informal, they also took place through the framework established by the 2008 Climate Change Act. The act set an emissions reduction target of 80–95% by 2050 to be achieved through increasingly tight carbon budgets. As part of the fifth climate budget published in 2016, debates moved to consider the wider need to decarbonize all industries, leading to comprehensive stakeholder consultations (interview, February 17, 2023). The outcome of such debates was a series of reports that began to present decarbonization as an “opportunity” to establish a “first mover advantage” for UK industries (Ricardo Energy & Environment for the Committee on Climate Change 2017). These reports also spelled out the political need for additional investments, including funding for renewable energy and clean technologies, as well as tax incentives for energy-efficient practices (HM Government 2017a; 2017b). This new take on climate policy was also seen as a means to aid poorer regions of the United Kingdom where the decarbonizable sector had its strongholds. Addressing regional inequalities became a key issue in British politics because these regions had flipped their allegiance to the Conservative Party and overwhelmingly voted for the British exit from the EU (Hudson and Lockwood Reference Hudson and Lockwood2023). But, importantly, just like in Germany, this emerging new policy vision did not result in a lasting shift in industrial advocacy or government policy in favor of expansive fiscal climate policies. Indeed, in 2017, the UK government privatized the British Green Bank, which had originally been introduced to provide public funds for decarbonization efforts (e.g., Vaughan Reference Vaughan2018).
In line with our theoretical expectations, these policy ideas only began to dominate industrial advocacy when the UK’s own net-zero law raised climate ambitions and locked them in legally (Carter and Pearson Reference Carter and Pearson2022). During the negotiations around the new law and in its immediate aftermath, many British industries began to foreground transition opportunities while calling for government support, including additional climate spending (e.g., Confederation of British Industries 2018; Energy UK Reference Energy2019; MAKE UK 2018; SMMT 2019). This fundamentally shifted industry positions vis-à-vis climate policy (interview, February 14, 2023). With passage of the net-zero law, for example, the steel industry had to reduce 96–100% of its emissions by 2050, not the expected 40–50% based on the preceding 2008 Climate Change Act. Such ambitious targets turned climate politics into an existential threat to the steel industry. But steel industry representatives also highlighted new opportunities inherent in this shift: greening steel production could end the decade-long shrinkage of the industry through the new demand for green steel. Subsequently, the industry outlined a detailed set of demands to facilitate its green transition, including funding for energy efficiency, green procurement, decarbonization of heat, R&D, and infrastructure investments in carbon capture technology and hydrogen (UK Steel 2022). The COVID-19 pandemic and subsequent fiscal stimulus intensified political lobbying for fiscal support. The UK’s energy-intensive manufacturing industry association framed the crisis as a “golden opportunity for the UK Government and industry, working together, to implement a green recovery” (MAKE UK 2020, 2; see also SMMT 2021; UK Steel 2022).
In contrast to the German case, the UK government was not immediately responsive to the new combined advocacy by green, labor, and industry groups. The Conservative May (Reference May2019) government simply pointed to existing industrial strategies. May’s successor Boris Johnson (Reference Johnson2020), did highlight the need for fiscal climate policies in response to the COVID-19 pandemic, regional inequalities, and the imperative to “level up” the UK economy, promising a “green recovery.” Yet, the Johnson government’s fiscal stimulus was not green; it was even smaller than the UK’s response to the 2008 global financial crisis (Nahm, Miller, and Urpelainen Reference Nahm, Miller and Urpelainen2022). The Johnson government’s subsequent “Ten Point Plan for a Green Industrial Revolution” only added funds totaling 4 to 8 billion pounds to support decarbonization (Carbon Brief 2020). Although not insignificant, this amount paled in comparison to new fiscal climate policies put in place by the UK’s European peers, which allocated hundreds of billions of COVID-19 funds to the green transition (McNamara Reference McNamara2023).
Industry representatives point to government irresponsiveness to explain this low level of climate spending: its rhetoric has simply not been met with sufficient action (interviews, February 13, 2023; February 14, 2023, March 10, 2023). By 2023, the Confederation of British Industry began to warn that the lack of government support would prevent the United Kingdom from winning the “Race to Zero.” Its leadership declared, “We believe the UK could lead the world on green growth as we did in setting net-zero targets. But we’re on the verge of being relegated from the Champions League by the Americans and the Europeans: both in an arms race to win global market shares” (Danker Reference Danker2023; SMMT 2022; interviews, February 14, 2023, March 10, 2023).
The disappointment expressed by industry officials can be understood in a direct comparison to the US case. The UK’s governing Conservative Party (Reference Party2019) was less receptive to their demands than US politicians, instead emphasizing the need for market-based climate policies. Nor did federalist legislative institutions give the regionally strongholds of the British decarbonizable industries an outsize political role.
By 2024, the increases in climate spending were, as expected, smaller than in Germany and the United States. Under the new Conservative prime minister Sunak, the government committed 1.3 billion pounds to subsidize an ongoing nuclear plant project (Patel Reference Patel2024), 500 million pounds to support the buildup of the UK’s first battery factory (Sweney and Jolly Reference Sweney and Jolly2023), and, most ambitiously, 20 billion pounds for carbon-capture technology—a significant sum but spread out over 20 years (UK Department of Energy Security and Net Zero 2023). The government also committed a comparatively modest 800 million pounds to subsidize the green retooling of the UK’s steel industry—only 15% of Germany’s green steel investments announced in the same year (Jolly Reference Jolly2023; Sweney and Lawson Reference Sweney and Lawson2022). The modest spending can be explained by two factors: the United Kingdom only had two functioning large steel blast furnaces, and it is taking a cheaper route to decarbonization via the use of electric arc furnaces. Because these electric arc furnaces require fewer personnel to operate, steelworker unions are now opposing this steel strategy. But labor groups do not uniformly oppose green steel; instead, they support more green steel alternatives that would yield higher employment outcomes (Courthouse News Service 2024). Overall, the Office for Budget Responsibility (2023) estimates that annual climate spending will be around 5.5 billion pounds—or around 0.25% of the UK’s 2021 GDP. This is one-sixth the amount of German climate spending as a percentage of GDP.
Unlike in Germany, decarbonization is not broadly seen as a do-or-die moment for the UK economy, which reflects the decarbonizable sector’s small size and the UK’s finance and service-led growth model. Moreover, although regional strongholds of decarbonizable industries became more prominent post-Brexit, this did not give the industries any direct influence over government policy, unlike in the United States. They remained dependent on the goodwill of the UK government, which was in the hands of the Conservative Party with its market-based view on climate policy and growing number of net-zero critics after 2021 (Paterson, Wilshire, and Tobin Reference Paterson, Wilshire and Tobin2023). The British Labour Party, running on more fiscally generous green plans, is poised to take power next year. However, it has already scaled back some of its most ambitious climate spending pledges (Blyth Reference Blyth2023). Ultimately, even in an optimistic scenario where Labour spearheads a decarbonization bargain, it is unlikely that the United Kingdom will match the spending levels of countries like Germany—and even if it eventually increases climate spending, it no longer has a broad industrial base composed of competitive firms.
The United States
In the United States, fiscal climate policies also grew in prominence in the context of the global financial crisis. Environmentalists, often in direct collaboration with progressive labor groups, began to call for large-scale investment in a green industrial revolution (BlueGreen Alliance Reference Alliance2008; Center for American Progress 2008). They also celebrated initial successes as the Obama-era fiscal stimulus included $80 billion in climate spending (Nahm, Miller, and Urpelainen Reference Nahm, Miller and Urpelainen2022). But these calls were not joined by energy-intensive groups who remained committed to preventing meaningful climate action in fields ranging from emissions regulations for power plants to car emissions standards to the Waxman-Markey Act that tied emissions trading to new green investments (Mildenberger Reference Mildenberger2020; Skocpol Reference Skocpol2013; Stokes Reference Stokes2020).
Just like in Germany and the United Kingdom, major decarbonizable industries shifted their political stance only when major emission cuts became increasingly inevitable (figure 7). The pivotal event was the election of Democratic president Biden in 2020. Biden had campaigned on the promise to reduce US emissions in line with the Paris Agreement and to provide an unprecedented expansion of green expenditures of around $2 trillion. His focus on climate change resulted partly from pressure by an active youth-led climate movement that successfully moved climate politics to the top of the Democratic agenda during the primary search for a presidential candidate (Stokes Reference Stokes2024). But climate policy also became part of a political strategy to gain support in swing states in the Midwest that Democrats had unexpectedly lost in the previous election (Farley Reference Farley2019). In campaign speeches, Biden argued that subsidies for industry decarbonization would drive Michigan’s economic “revitalization” and enable companies to “retool manufacturing facilities to make them more competitive for example by shifting to help build a new fleet of clean American vehicles” (Biden Reference Biden2020a; see also Biden Reference Biden2020b).
Industrial Composition of the Decarbonizable Sector in the United States
Source: OECD STAN.

After the 2020 election, many decarbonizable industries began to aggressively support Biden’s fiscally expansive climate policies. Most prominently, automaker General Motors engaged in what journalists describe as an “about-face” (Boudette and Davenport Reference Boudette and Davenport2021). The car manufacturers had opposed stricter car emissions regulations during the Obama and Trump administrations. By 2021, they had shifted their stance, promising to exclusively sell electric vehicles by 2035. To make this strategy economically feasible, they demanded fiscal aid, resulting in their strong public support for the Biden administration’s climate policies (Bose and Shepardson Reference Bose and Shepardson2021; Shepardson and Bellon Reference Shepardson and Bellon2022; interview, March 8, 2023). Similarly, the Biden administration’s decision to rejoin the Paris Agreement “made it clear that we were going to have to get serious about emissions.” Confronted with this shifting political reality, US steelmakers realized that they were already “holding great cards in our hand” because their steel was 75% less carbon intensive than its global competitors. This was largely due to the widespread use of electric arc furnaces in the production process. A tipping point was reached in 2020 when US steelmakers embraced the Biden agenda, demanding climate policies that would grow demand for green steel (Climate Leadership Council 2020; 2021; Steel Manufacturers Association 2021; interview, September 22, 2023). Utilities had already slowly begun to embrace renewable energy in response to regulatory changes and the decreasing costs for renewables in the late 2010s. Yet Biden’s focus on fiscal incentives and the prospect of growing electricity demand due to decarbonization turned them into vocal allies of public aid for renewable energy (Edison Electric Institute 2021; interview, September 1, 2023).
But unlike in Germany and the United Kingdom, some industrial groups in the United States did not join the coalition advocating for fiscal climate policies. These outliers line up with our theoretical expectations. First, some independent electricity producers did not support fiscal aid for renewables. The business model of this specific group of firms remained more closely tied to coal-based electricity production because of recent investments that could not be easily decarbonized and that were under threat from subsidized green energy (figure 8; EPSA 2021; Snitchler Reference Snitchler2022; interview, September 1, 2023). Second, large industry associations, including the Chamber of Commerce and the National Association of Manufacturers, were internally divided due to strong representation from core fossil fuel firms. Although they ultimately supported some green investments as part of a larger push for infrastructural spending, especially in the aftermath of COVID-19, their advocacy for fiscal climate policies remained muted due to internal divisions (National Association of Manufacturers 2021; US Chamber of Commerce and Build by Fourth of July Coalition 2021). Associations from the US finance and real estate sectors also came to reject some of the crucial tax increases that the Democrats envisioned would pay for the climate spending spree (National Association of Realtors 2022).

Unsurprisingly then, unlike in Germany, no bipartisan agreement around fiscally expansive climate policies followed the new industrial advocacy. Instead, intense inter-industrial and political conflict emerged. Indeed, there was not even unity within the Democratic Party. US federalism is crucial to understanding this dynamic. In particular, the US Senate heavily overrepresents states that are less densely populated and less economically central. The Democrats controlled the US Senate only by a one-vote margin, giving them a tiny majority to pass fiscal legislation. This meant that every senator representing regionally distinct growth models acted as a veto player—not only those from the heavily decarbonizable Midwest but also a Democratic senator representing the fossil fuel-dominated state of West Virginia and one from Arizona, a state heavily reliant on the finance, insurance, and real estate sectors.
In the crossfire of these regional economic interests, Democratic leadership repeatedly lowered their spending ambitions, cut out painful tax increases and progressive social provisions, and instead added policies that could secure the buy-in of the fossil fuel sector (Everett and Caygle Reference Everett and Caygle2021; Lobosco and Luhby Reference Lobosco and Luhby2021). The negotiations came to a head in June and November 2022, when Senator Manchin from West Virginia walked away from the compromise deal. Fearing that the Democrats might not come to an agreement before the next election cycle, decarbonizable industries unleashed an intense period of lobbying (interviews, September 1 and 21, 2023). Most publicly, in June 2022, the CEOs of GM, Ford, Stellantis, and Toyota sent an open letter to Congress, urging policymakers to pass tax incentives and pointing to the threat of European and Chinese automakers (Shepardson and Bellon Reference Shepardson and Bellon2022). In this context, it is important to note that West Virginia is a hub for the fossil fuel sector, which contributes around 16% to the state’s GDP, and has an oversize decarbonizable sector, making up around 20% of the state’s GDP. Crucial decarbonizable industries, working side by side with organized labor, pressured Senator Manchin to agree to a deal (Colman, Siegel, and Tamborrino Reference Colman, Siegel and Tamborrino2022; interviews, September 1 and 21, 2023).
Ultimately, the senators from West Virginia and Arizona agreed to a smaller bill of around $760 billion over 10 years, with around half of this money dedicated to climate interventions (Berman Reference Berman2022). Although lower than the originally proposed $2 trillion of climate spending, the bill retained many subsidies and tax incentives for the decarbonizable sectors, including funds to expand renewable electricity and tax incentives for electric vehicles, hydrogen, and clean manufacturing technology. With the green provisions of the Inflation Reduction Act added to those of investment acts passed in 2022 and to independent green R&D spending by the Department of Energy, the United States is set to spend between $80 billion and $120 billion annually on climate change over the next decade (Goldman Sachs 2023; Rocky Mountain Institute 2022). Overall, such climate represents around 0.5% of US 2021 GDP and about one-third to one-half of Germany’s spending when measured as a percentage of GDP.
But relative size is not the only difference. First, the US legislation included a series of local content requirements that limit eligibility to domestic producers. This was another political concession that could negatively affect or delay the overall climate benefits of the spending. It will take time to develop domestic supply chains, and this may lead to trade conflicts. Second, the fossil fuel industry successfully lobbied to remove some of the provisions that would have had the most immediate and drastic impact on it—such as a clean energy standard—and worked to include a series of benefits for the fossil fuel companies and their workers (Evers-Hillstrom Reference Evers-Hillstrom2022).
Overall, the US decarbonizable sector is neither large nor tied to US growth prospects. Unlike in the United Kingdom, these industries were able to rely on sources of political influence through contingent and institutional political factors—including regional strongholds and federal institutions. This outsize political role, however, did not enable the green–industrial coalition to simply overcome the lobbying power of other industrial actors, such as the oil and gas sector or the finance and real estate sector. Instead, the green fiscal agenda was also scaled back until it became acceptable to many important actors that comprise the US’s fragmented political economy.
Conclusion
Since 2019, there has been a dramatic increase in climate spending policies through which governments attempt to incentivize industries and households decarbonize. A key driver behind this green fiscal expansion was the shift in industry incentives. The growing momentum behind major emissions cuts and new economic transition opportunities from the growing green markets led principally decarbonizable industries—such as carmakers, utilities, and energy-intensive manufactures—to enter what we describe here as decarbonization bargains: they became more open to reducing emissions in exchange for policies and funding that support their decarbonization. They joined environmentalists and labor groups in their advocacy for a green fiscal expansion, tipping the balance in favor of such policies. In addition, we show that the size and political influence of these decarbonizable industries are crucial factors in explaining the size of this green fiscal expansion.
Although additional research is needed to further generalize our insights, there are signs that support the broad applicability of the qualitative comparative analysis provided here. First, within the universe of wealthy democratic countries since 2019, we cannot identify a single country that has not expanded its fiscal support for decarbonization. This includes least likely cases such as fossil fuel-rich Norway or the small city-state of Luxembourg (Le gouvernement du grand-duché de Luxembourg 2023; Solheim Reference Solheim2022).
Second, emerging comparative data points align with expectations regarding the covariation between a country’s decarbonizable industries’ relative size and its level of climate spending. Austria and South Korea—like Germany, export-led and manufacturing-heavy economies—have strongly increased their respective climate spending, reaching levels clearly above 1% of their respective GDPs (Parlament Österreich Reference Österreich2024). Conversely, economies where the decarbonizable sector is small and politically not influential have not seen such a strong ramp-up of spending. When Switzerland passed its 2022 Climate Law, it only allocated $3.5 billion in industry and household support—and these funds are stretched out over six and ten years, respectively (Bundesamt für Umwelt 2022). Even when these additional funds are added to the preexisting rebates of Switzerland’s considerable carbon tax, this adds up to only about 0.3% of the Swiss GDP (Bundesamt für Umwelt 2023). Similarly low spending levels can be found in other finance-led economies like Luxembourg (Le gouvernement du grand-duché de Luxembourg 2023). Between these extremes, Canada most closely aligns with the United States in regional economic diversity, federalism, and polarized climate politics. Yet, after calls from decarbonizable industries and a receptive Liberal government, Canada is now also committed to a moderate level of climate spending in 2024 (Government of Canada 2023). Future research will need to determine how OECD country pledges are allocated, how much of these allocated funds are actually spent, and how much of this spending can legitimately be tied to emissions-reducing economic activities.
A second line of future inquiry concerns the viability and future of decarbonization bargains. Currently, the core industrial backers of expansive fiscal climate policies are in the electric power, automotive, and energy-intensive manufacturing industries. Our findings suggest that more decarbonizable industries, such as aviation, will follow once political pressure and economic competition intensify and technological pathways to decarbonization become more established. But this is no foregone conclusion. For example, feedback or learning effects will occur depending on how successfully the fiscal climate policies expand or, at least, secure an economic model throughout decarbonization. Especially when certain states or industries fail to make the green turn a success, there will be more resistance to embracing decarbonization bargains. In particular, Germany, which in addition to the challenge of decarbonization also faces an energy crisis from the Ukraine–Russian war and from the self-imposed constraints of fiscal austerity, could end up a being crucial case that other countries and industries will observe (Costantini and Storm Reference Costantini and Storm2024). Decarbonization bargains have emerged as one way to mitigate some distributional conflicts over climate action and grow the political coalition in support of emissions reduction. Their failure could just as quickly undermine our ability to avert catastrophic climate change.
Acknowledgments
We thank Salil Benegal, Mark Blyth, Jeff Colgan, Jessica Green, Jennifer Hadden, Kate McNamara, Johannes Urpelainen, and the participants in Brown and Harvard Universities’ 2023 Climate Pipeline Workshop, UC Santa Barbara’s 2023–24 Inflation Reduction Act Workshop, and the 2023 Max Planck Institute’s Comparative Political Economy Workshop. We are also grateful for the constructive feedback and support of the four anonymous reviewers.
Funding
This work was supported by Norges Forskningsråd (grant number 324468).