


1. INTRODUCTION
The glaciers of Taylor Valley, McMurdo Dry Valleys (MDV), have been shown to be in equilibrium with the current climate over the period, 1993–2001 (Fountain and others, Reference Fountain, Nylen, MacClune and Dana2006). This finding is unusual in the global assessment of glacier stability because the majority of glaciers during that time period were not only receding, as they have over much of the past century, but their retreat was accelerating (Kaser and others, Reference Kaser, Cogley, Dyurgerov, Meier and Ohmura2006; Lemke and others, Reference Lemke, Solomon, Qin, Manning, Chen, Marquis, Averyt, Tignor and Miller2007). The differing behavior is due to the below freezing summer air temperatures in the MDV and the cooling trend in the decade of the 1990s (Doran and others, Reference Doran2002b; Thompson and Solomon, Reference Thompson and Solomon2002). In this report we update the measured mass-balance record to 2013 and reconstruct the time series back to 1965 to evaluate whether changes we observe in recent decades differ from previous decades. This is important for distinguishing temporary variations from long-term trends and how the climate, as expressed by glacier variations, may be changing. Finally, because so few programs have monitored the mass balance of polar glaciers, we examine whether some of the basic concepts for evaluating the balance of temperate glaciers apply to polar glaciers.
The MDV are the largest ice-free expanse in Antarctica, ~4500 km2 (Levy, Reference Levy2012) (Fig. 1). The Trans Antarctic Range blocks the flow of the East Antarctic ice sheet into the valleys and the precipitation shadow cast by the range reduces snowfall, minimizing local glacier growth (Fountain and others, Reference Fountain, Nylen, Monaghan, Basagic and Bromwich2010). The landscape is characterized by broad expanses of a sandy gravel matrix with frequent exposures of bedrock, particularly along the valley walls. Alpine glaciers descend from the local mountain ranges, the largest of which reach the valley floor. A few outlet glaciers of the East Antarctic ice sheet make their way into the valleys terminating in the western margins. Average annual air temperatures vary between −15 and −30 °C across the valleys and summer temperatures commonly hover a few degrees below freezing. Meltwater from the glaciers feed ephemeral streams, which flow for ~6–10 weeks a year (McKnight and others, Reference McKnight1999) before discharging into enclosed perennially ice-covered lakes. Little snow falls in the valley bottom; the largest values are found at the coast, typically >0.05 m w.e. a−1, with smaller values away from the coast (Fountain and others, Reference Fountain, Nylen, Monaghan, Basagic and Bromwich2010). Most of the snow accumulation sublimates before melting (Chinn, Reference Chinn, Green and Friedmann1993; Eveland and others, Reference Eveland, Gooseff, Lampkin, Barrett and Takacs-Vesbach2012). Consequently, glacial melt is the most important source of water to the streams and lakes in the valleys. The glaciers act as frozen reservoirs of water, liberated when energy is available, feeding the streams, lakes and supporting the microbial life that inhabits all landscape elements (Fountain and others, Reference Fountain1999; Gooseff and others, Reference Gooseff, McKnight, Doran, Fountain and Lyons2011). Therefore, knowing the current stability of these glaciers is also important for understanding the hydrological functioning of this polar landscape and the microbial ecosystem that it supports.
Satellite image of the McMurdo Dry Valleys, showing the study glaciers (labelled) and the Lake Hoare weather station (yellow dot). The image is from the Landsat Image Mosaic of Antarctica (http://lima.usgs.gov/index.php) and dates to1999–2002.

The alpine glaciers of the MDV are polar glaciers frozen to the bed, consequently all meltwater is from surface melt (Bull and Carnein, Reference Bull and Carnein1970; Cuffey and others, Reference Cuffey2000; Fountain and others, Reference Fountain, Nylen, MacClune and Dana2006). The accumulation zone is blanketed with dry snow and firn with thin ice layers from brief episodic melt events. The ablation zone is typically snow-free year-round because episodic snow accumulations are often swept away by winter winds. The glaciers terminate in tall (~20 m) cliffs, typical of polar glaciers at high latitudes or elevations (Bull and Carnein, Reference Bull and Carnein1970; Mölg and others, Reference Mölg, Cullen, Hardy, Kaser and Klok2008). Larger glaciers reach the valley floor forming a fan-like lobe that accommodates much of the ablation zone.
Mass balance is controlled by snow accumulation and ablation like glaciers elsewhere. Unlike glaciers in temperate regions, however, the mass balance regime is not entirely defined by season (Chinn, Reference Chinn1981; Fountain and others, Reference Fountain, Nylen, MacClune and Dana2006). Snow accumulates any time of year and, from time to time, summer is the accumulation season and winter is the ablation season. Ablation occurs continually as sublimation, accounting for all ablation in winter and often >50% in summer (Lewis and others, Reference Lewis, Fountain and Dana1998; Hoffman and others, Reference Hoffman, Fountain and Liston2008, Reference Hoffman, Fountain and Liston2016). During the summer, snow typically sublimates instead of melting because the below-freezing air temperatures and windy environment keep the surface cool and solar heating is minimized by snow's high albedo (Fountain and others, Reference Fountain, Nylen, Monaghan, Basagic and Bromwich2010). Ice too does not readily melt and the icy ablation zones are commonly dry to the touch. Surprisingly, most melt seems to occur in the subsurface due to a solid-state greenhouse effect (Brandt and Warren, Reference Brandt and Warren1993; Fountain and others, Reference Fountain, Tranter, Nylen, Lewis and Mueller2004a; Hoffman and others, Reference Hoffman, Fountain and Liston2008, Reference Hoffman, Fountain and Liston2016). Solar radiation is transmitted into the ice where it is absorbed faster than heat conducted out of the ice causing internal melt. Glacial runoff is common in December and January, with a peak melt period of about 4 weeks long from mid-December to mid-January coinciding with the period of maximum solar radiation (Hoffman and others, Reference Hoffman, Fountain and Liston2008, Reference Hoffman, Fountain and Liston2016). We define summer as the 3-month period from November–January, which brackets both peak glacial runoff (ablation) and our summer mass-balance measurements. Winter is the remaining 9 months. Generally, the magnitudes of summer and winter ablation are equivalent although the rates are much higher in summer than winter (Fountain and others, Reference Fountain, Nylen, MacClune and Dana2006). The response time of these glaciers is slow, ~103 a, based on the magnitude of annual mass change at the terminus, ~10−1 m a−1, and the average ~102 m thickness of the glaciers (Johannesson and others, Reference Johannesson, Raymond and Waddington1989; Fountain and others, Reference Fountain, Neumann, Glenn and Chinn2004b).
Scientific studies of glaciers in the Dry Valleys (Fig. 1) started in 1961 with the investigation of three glaciers in Wright Valley (Calkin, Reference Calkin1964) followed by a study on the Meserve Glacier (Bull and Carnein, Reference Bull and Carnein1970). In the summer of 1969/70 the New Zealand Antarctic Program (NZAP) established the first long-term glacier monitoring program as part of their annual hydrological surveys (Chinn, Reference Chinn1980). The program included mass-balance measurements on seven glaciers in Wright and Victoria valleys and repeatedly photographed terminus positions on these and other glaciers from fixed markers on the landscape (Chinn and Cumming, Reference Chinn and Cumming1983). After more than a decade of measurements the last were made in the 1982/83 season. Ten years later the Long Term Ecological Research project (LTER) of the United States National Science Foundation initiated a long-term program of physical and biological measurements in neighboring Taylor Valley that included mass-balance measurements on two glaciers, and ablation-zone-only measurements on four other glaciers (Fountain and others, Reference Fountain, Nylen, MacClune and Dana2006). Both NZAP (Chinn and Cumming, Reference Chinn and Cumming1983) and LTER (Fountain and others, Reference Fountain, Neumann, Glenn and Chinn2004b) programs photographed glacier terminus positions. In addition, snow pits have provided data on annual snow accumulation for the past 50 a (Welch, Reference Welch1993; Witherow and others, Reference Witherow2006; Bertler and others, Reference Bertler2006).
2. METHODS
We monitored mass balance on two glaciers, Commonwealth and Howard. Commonwealth Glacier flows southward from the Asgard Range and has an area of 52.2 km2 with elevation ranging from ~50 m a.s.l. to a little over 1200 m a.s.l., with the upper 400 m being steep (>30°), thin ice with many rocky outcrops, which probably contributes little to the main glacial accumulation zone that reaches 800 m. The Howard Glacier is across the valley, inland, and 6 km from Commonwealth Glacier. It flows northward from the Kukri Hills. It has an area of 8.3 km2 and ranges in elevation from ~300 m a.s.l. to a little over 1000 m a.s.l. Mass balance was estimated using a conventional field approach (Ostrem and Brugman, Reference Ostrem and Brugman1991; Fountain and others, Reference Fountain, Nylen, MacClune and Dana2006). Changes in surface height were measured against bamboo poles drilled 2 m into the glacier. The poles were measured twice each season, at the beginning and end of summer. If the surface was snow, its density was measured to a depth twice that of the height change since last measurement, and if the surface was ice its density was assumed to be 890 kg m−3 (LaChapelle, Reference LaChapelle1959). From these measurements the mass balance was calculated at each stake. The small magnitude of snow accumulation and ice ablation on the glaciers allowed us to re-measure the same stakes for almost a decade before having to reset the stake.
To estimate mass balance a piece-wise linear regression was applied between the measurements at each pole and elevation with a 95% confidence interval to estimate uncertainty. The mass balance and uncertainty estimates for each 50 m elevation interval were multiplied by the area of the interval and summed over the glacier. Dividing by the area of the glacier yielded the specific mass balance. Details of the procedure can be found in Fountain and others (Reference Fountain, Nylen, MacClune and Dana2006). Specific start dates of the measurements in November and end dates in January can vary by a week or so. Annual values are reported on a November–November, ‘austral spring’, cycle to match the mass balance year in the northern Hemisphere for ease of comparison. This approach nominally violates the convention of reporting mass balance over the interval of time between successive minima of mass balance in autumn (Cogley and others, Reference Cogley2011). Because seasonal glacier mass balance in the MDV does not easily conform to expectations of net mass loss in summer and net mass gain in winter (Chinn, Reference Chinn1980; Fountain and others, Reference Fountain, Nylen, MacClune and Dana2006), a strict application of the convention renders mass balance ‘years’ meaningless and for practical reasons a choice is made to define the annual cycle.
2.1. Terminus change
We quantified terminus change (advance/retreat) of three glaciers, Commonwealth, Howard and Canada to detect any length changes. Previous studies, using oblique ground-based photographs, show the alpine glaciers in MDV advancing or retreating slightly (Chinn and Cumming, Reference Chinn and Cumming1983; Chinn, Reference Chinn1998; Fountain and others, Reference Fountain, Neumann, Glenn and Chinn2004b). These measurements, however, are point measures and do not account for changes along the entire fan-like shape of the glacier termini. Unlike many temperate alpine glaciers that have a relatively narrow terminus the larger alpine glaciers of the MDV, particularly in Taylor Valley, spread on reaching the valley floor forming a lobate ablation zone (Fig. 1). We used vertical aerial and satellite imagery to assess changes in extent along the entire terminus. Including Canada Glacier in this assessment provides us an opportunity to compare the results of ground-based photographic assessments (Fountain and others, Reference Fountain, Neumann, Glenn and Chinn2004b) against results from vertical imagery.
Aerial photographs were geo-registered using near-nadir Quickbird multispectral satellite imagery, ~1 m resolution, provided by the National Geospatial-Intelligence Agency commercial imagery program. The satellite imagery was terrain corrected to the 30 m Advanced Spaceborne Thermal Emission and Reflection Radiometer Global Digital Elevation Model version 1 [ASTER-GDEM] and used ground control points collected by the Antarctic Geospatial Information Center in the 2008/09 Survey. The aerial photographs are registered to the recent satellite images used for change detection. Air photo registration relied on ground control points consisting of permanent features (e.g. boulders, bedrock) present in both the photographs and satellite images. The region of interest was the glacier termini so the points were chosen on the valley floor near the terminus of each glacier. Landscapes with low relief required fewer control points whereas extreme relief required many more. Control points were added to the registration process until the uncertainty between images no longer changed significantly; the number required ranged from 50 to 150. The relative registration error between the satellite image and aerial photographs was within 2 pixels.
The terminus perimeter, defined as the contact between the ice and ground, was digitized from one side of the glacier to the other at a scale of 1:500. The location of the starting and ending points were identical for each pair of images and located where the glacier begins to fan outwards. To calculate the magnitude of terminus change points were spaced at ~10 m intervals along the perimeter defined in the older image. At each point, a line normal to the perimeter was drawn to the perimeter in the younger image and the distance between intersections calculated.
2.2. Mass-balance reconstruction
To estimate glacier mass balance prior to field measurements we apply a multiple linear regression model. Studies of temperate glaciers have used summer air temperature as an index of ablation and winter precipitation as an index of mass accumulation (e.g. Tangborn, Reference Tangborn1980; Greuell, Reference Greuell1992). Our linear regressions utilized local meteorological measurements at Lake Hoare station, recorded since 1988 (Clow and others, Reference Clow, McKay, Simmons and Wharton1988; Doran and others, Reference Doran2002a), and for prior years back to 1957 air temperatures from Scott Base on Ross Island, 100 km away. No time series of precipitation measurements is available although we tested the utility of a proxy measure of snow accumulation derived from snow pits on the glaciers. In addition, we also tested stream discharge, a proxy measure of summer ablation.
The local meteorological data from Lake Hoare Station were downloaded from the McMurdo Dry Valley Long Term Ecological Project (http://www.mcmlter.org) and air temperatures at Scott Base were downloaded from the National Climate Database of the National Institute of Water and Atmospheric Research of New Zealand (http://www.cliflo.niwa.co.nz). Mean summer air temperature was calculated by averaging the daily values from November–January, which bracket the months of December and January, which account for 90% of the meltwater runoff (Ebnet and others, Reference Ebnet, Fountain, Nylen, McKnight and Jaros2005) and most of the variability in summer ablation (Hoffman and others, Reference Hoffman, Fountain and Liston2016). Estimates of snow accumulation are derived from snow pits on several glaciers including Commonwealth (Witherow and others, Reference Witherow2006), Newall (Welch, Reference Welch1993) and the Baldwin Valley Glacier (Bertler and others, Reference Bertler2006). For stream discharge we used the longest record on the continent (since 1969), the Onyx River in neighboring Wright Valley (Chinn, Reference Chinn1981; Gooseff and others, Reference Gooseff, McKnight, Doran and Lyons2007a). Unfortunately, water loss to the hyporheic zone along the river banks and evaporation prior to reaching the gauging site complicates the discharge record (Cozzetto and others, Reference Cozzetto, McKnight, Nylen and Fountain2006; Gooseff and others, Reference Gooseff2007b).
3. RESULTS AND ANALYSIS
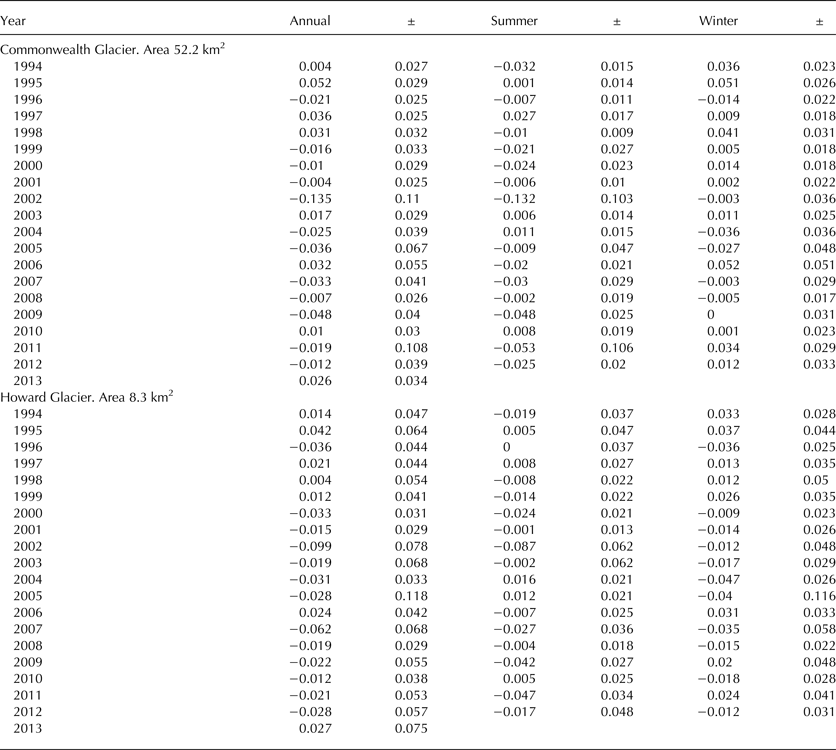
Mass-balance measurements have been made at Commonwealth and Howard glaciers for 20 years, 1993–2013, the longest in the MDV and perhaps the longest record for an alpine glacier in Antarctica (Table A1). Specific mass balance at any stake on either glacier is ~±0.1 m w.e. Mass balance increases with elevation for both glaciers but Commonwealth Glacier exhibits a decrease above 500 m a.s.l. (Fig. 2). At low elevations the mass balance is more variable than at higher elevations, probably resulting from episodic snow accumulations in either summer or winter seasons. Annual balances between the two glaciers are similar with generally positive balances in the 1990s and generally negative since 2000 (Fig. 3). The summer balances were typically negative, but not always, and vice versa for winter. The large negative spike in summer/annual mass balance for 2002 is caused by a 3-week warm period during late December 2001 to early January 2002 (Foreman and others, Reference Foreman, Wolf and Priscu2004; Doran and others, Reference Doran2008).
Mean glacier mass balance (1993–2013) with elevation for Commonwealth and Howard glaciers (left). Horizontal error bars are one standard deviation. Lines are piecewise linear regression fits used to estimate mass balance for the entire glacier. Glacier area elevation distribution (right) at 50 m elevation intervals.

Annual and seasonal mass balances for Commonwealth and Howard glaciers, Taylor Valley. Note that the year is the ‘end year’ of the measurements such that the year 2002 includes summer measurements of 2001/02 and winter measurements of 2002.

Correlations between seasonal and annual mass balance for Commonwealth Glacier indicate that summer (r = 0.80) is better correlated with annual than winter (0.55); for Howard Glacier, summer balance is slightly less correlated (r = 0.58) with annual than winter (0.67). If the big negative year of 2002 is removed the correlation between summer and annual at Howard Glacier weaken significantly (r = 0.24) and the winter correlation increases significantly (0.79). Similarly for Commonwealth Glacier, the correlation with summer decreases (r = 0.51) and the correlation with winter increases (r = 0.69). No trend in mass balance was significant for either glacier, although peak positive mass balance of both glaciers decreased from the start of the measurement in 1993 to ~2000.
The correlation of annual balance between the two glaciers is good (r = 0.88) with a much better correlation between summer balances (r = 0.96) compared with winter (r = 0.83). If the extreme melt summer of 2002 is removed, the correlations are smaller for both annual and summer balances, 0.78 and 0.88 respectively. Regressing the mass balance of Howard Glacier against Commonwealth for annual, summer and winter values, assuming a linear relationship, yields an r 2 (intercept) of 0.77 (−0.008 m w.e.), 0.91 (0 m w.e.) and 0.70 (−0.12 m w.e.) respectively. This indicates Howard Glacier has an annual balance typically 0.008 m w.e. less than Commonwealth and caused by the difference in winter balance.
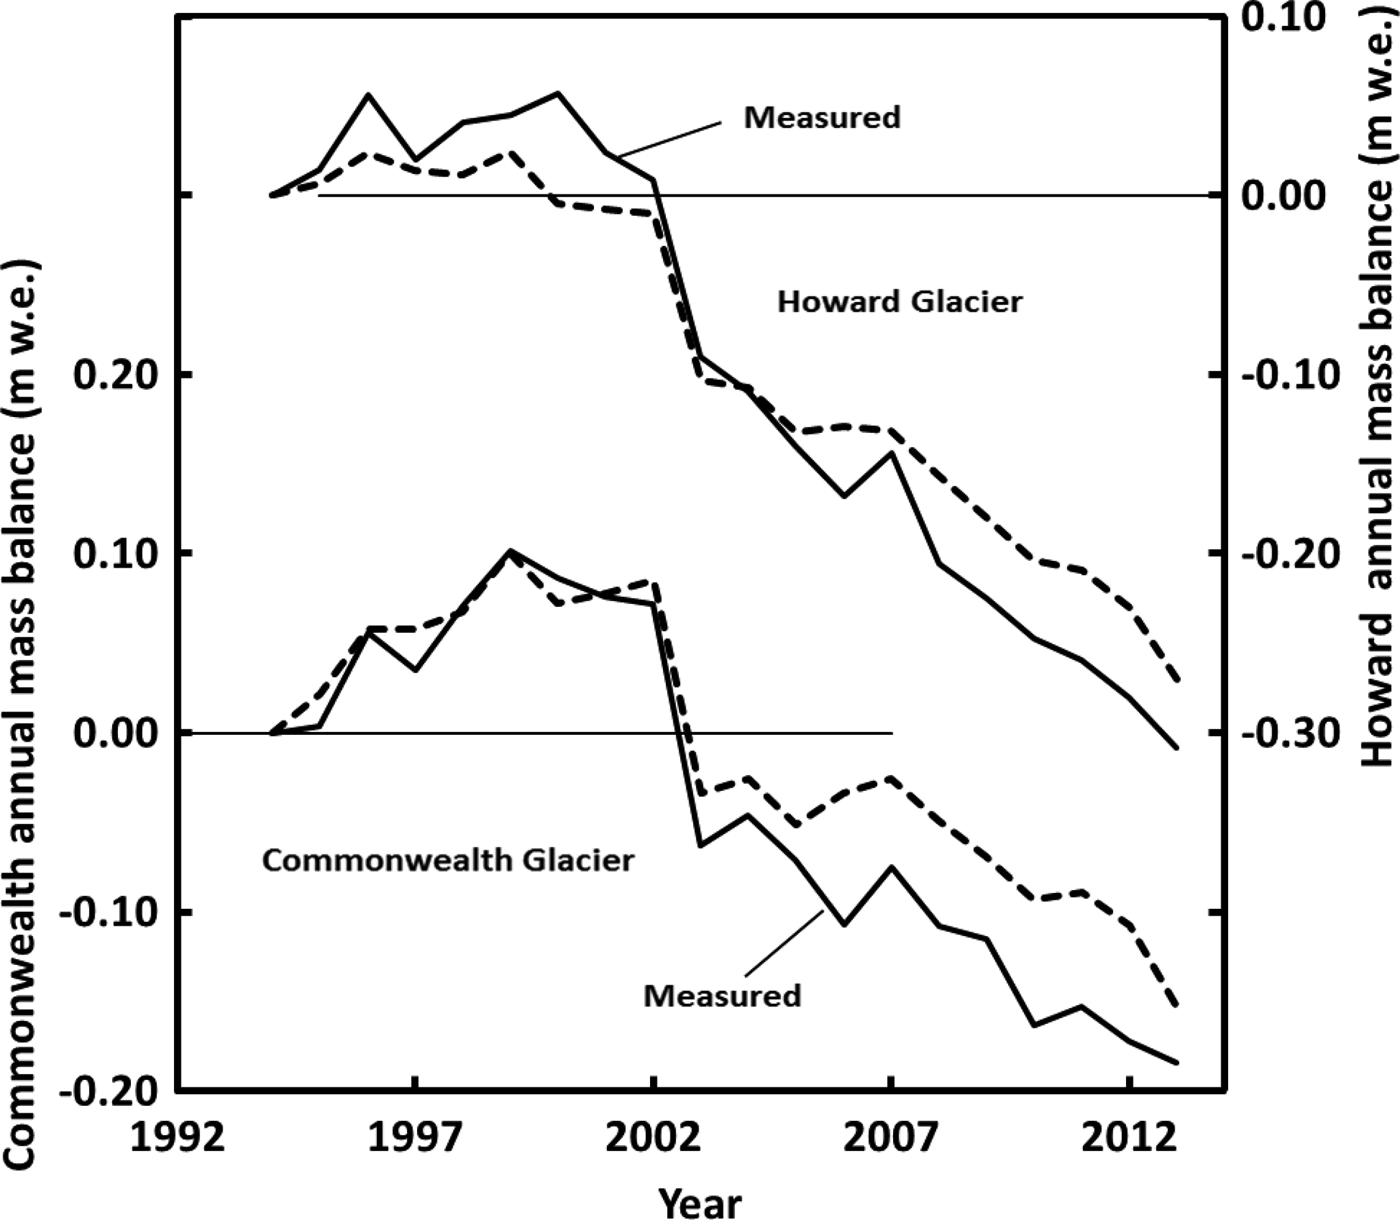
To better track mass change over time the cumulative sum of annual balances for each glacier was calculated (Fig. 4). Clearly, the glaciers have lost mass since measurements began. Over the period of record, the glaciers gained mass in the 1990s, achieved equilibrium for a few years, then lost mass over the remaining record starting the big melt summer of 2002.
Cumulative mass balance for Howard and Commonwealth glaciers. The 95% uncertainty is indicated by the shaded area for Commonwealth (darker) and Howard (lighter). Where the two uncertainties overlap is colored with an intermediate grey.

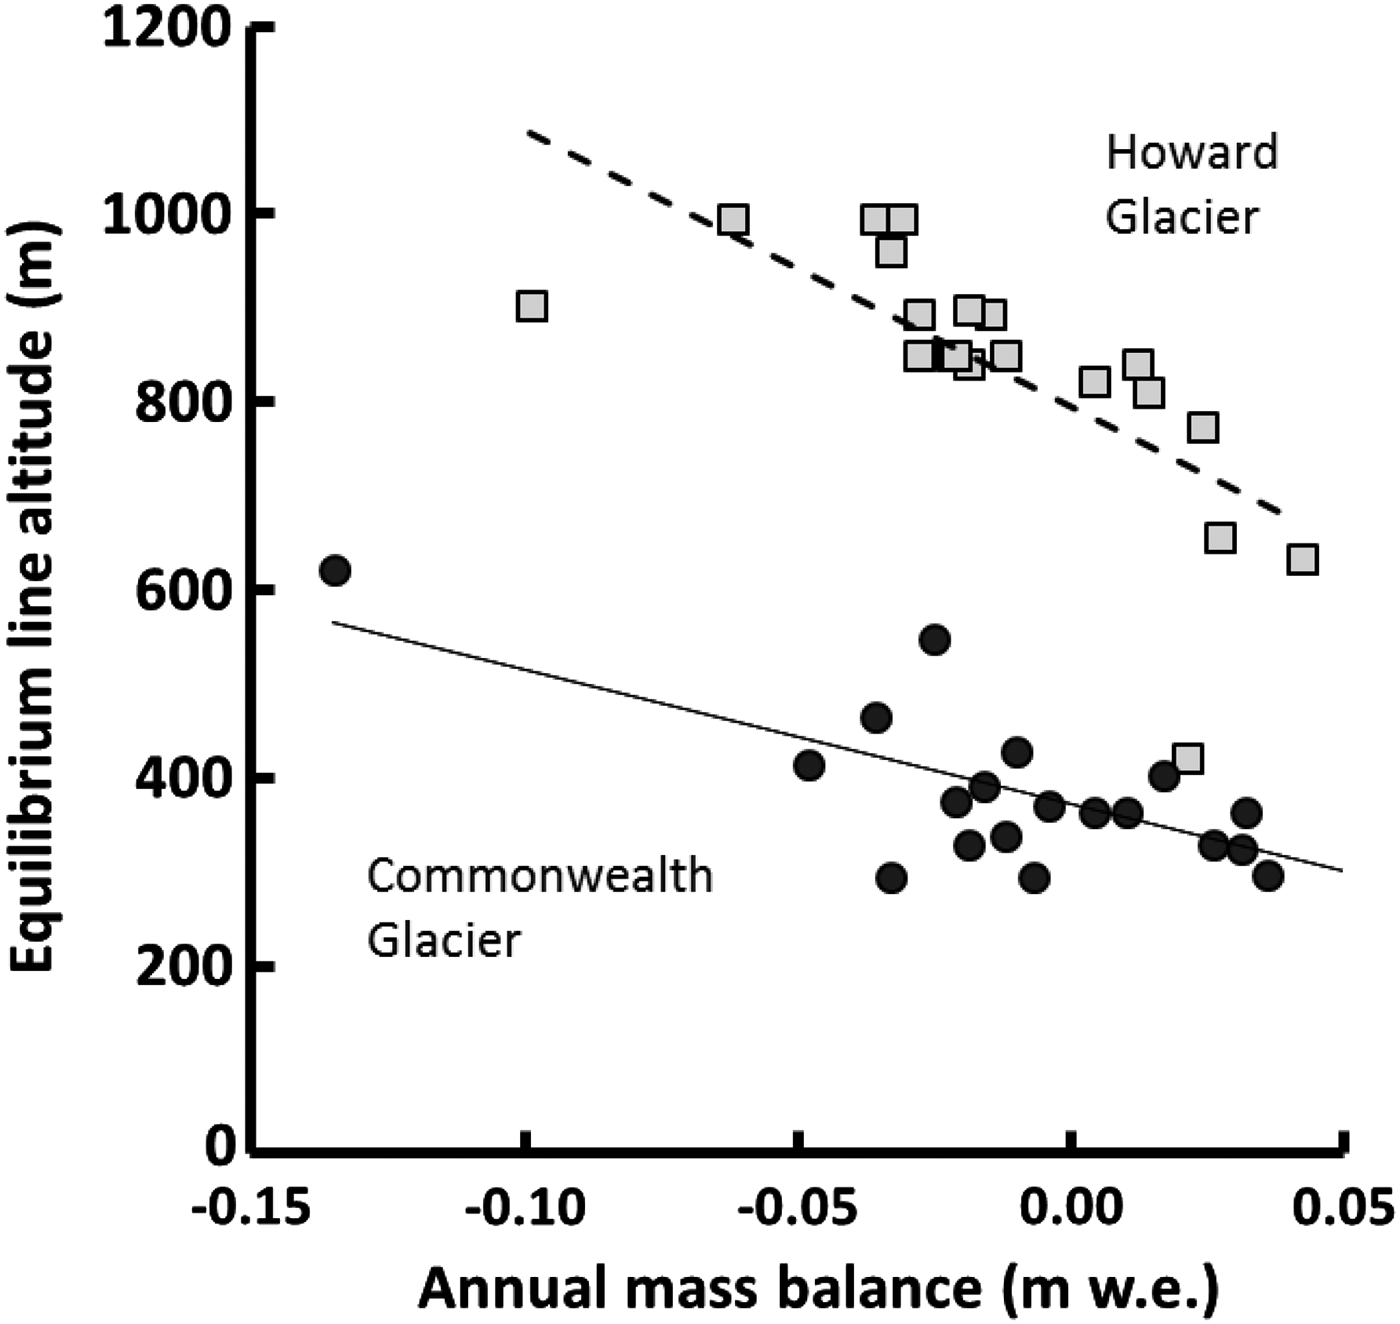
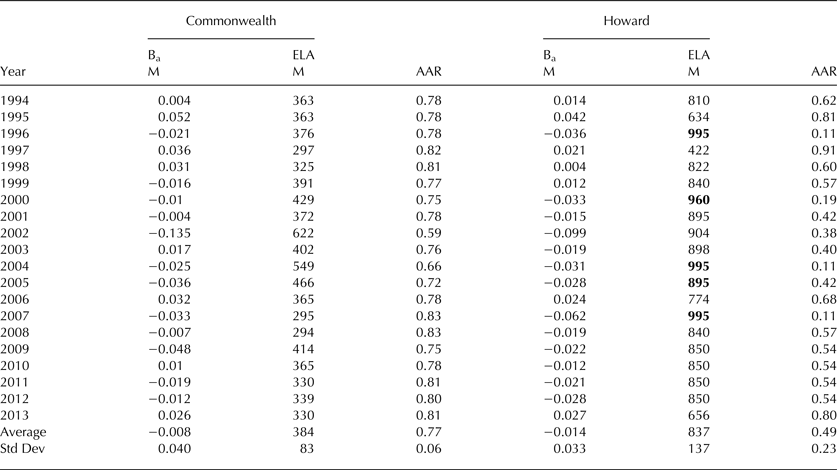
The equilibrium-line altitude (ELA) and accumulation area ratios (AAR) are tabulated (Table A2). For Howard Glacier a few ELA values had to be estimated because they were at an altitude greater than the highest stake on the glacier. In these cases the ELA was estimated from extrapolation of the mass-balance curve to higher elevations. The ELA (standard deviation) for Commonwealth Glacier is 384 m a.s.l. (83 m); for Howard Glacier 837 m a.s.l. (137 m). The large difference between these glaciers, which are only ~6 km apart, is due to the spatial gradients in precipitation and energy balance that cause the ELAs to rise rapidly with distance from the ocean (Fountain and others, Reference Fountain1999, Reference Fountain, Nylen, Monaghan, Basagic and Bromwich2010). The relation between ELA and annual mass balance exhibits a slope at Howard Glacier (−293 m (m w.e.)−1), twice that for Commonwealth (−143 m (m w.e.)−1; Figure 5). The correlation coefficients for the two regressions are about the same, r 2 ~ 0.49. The yearly change in ELA is not correlated between glaciers (not shown), so that an increase in ELA at one glacier is not necessarily mirrored at the other glacier, despite the highly correlated mass balances between the glaciers. The AAR (standard deviation) for Commonwealth Glacier is 0.77 (0.06); for Howard Glacier, 0.49 (0.23). Like the ELA, the yearly variation is not consistent between glaciers.
Equilibrium line altitude and annual mass balance for Commonwealth and Howard glaciers, 1994–2013. The squares are for Howard Glacier, the open squares are estimated values. The lines are linear regressions.
3.1. Estimating past mass balance
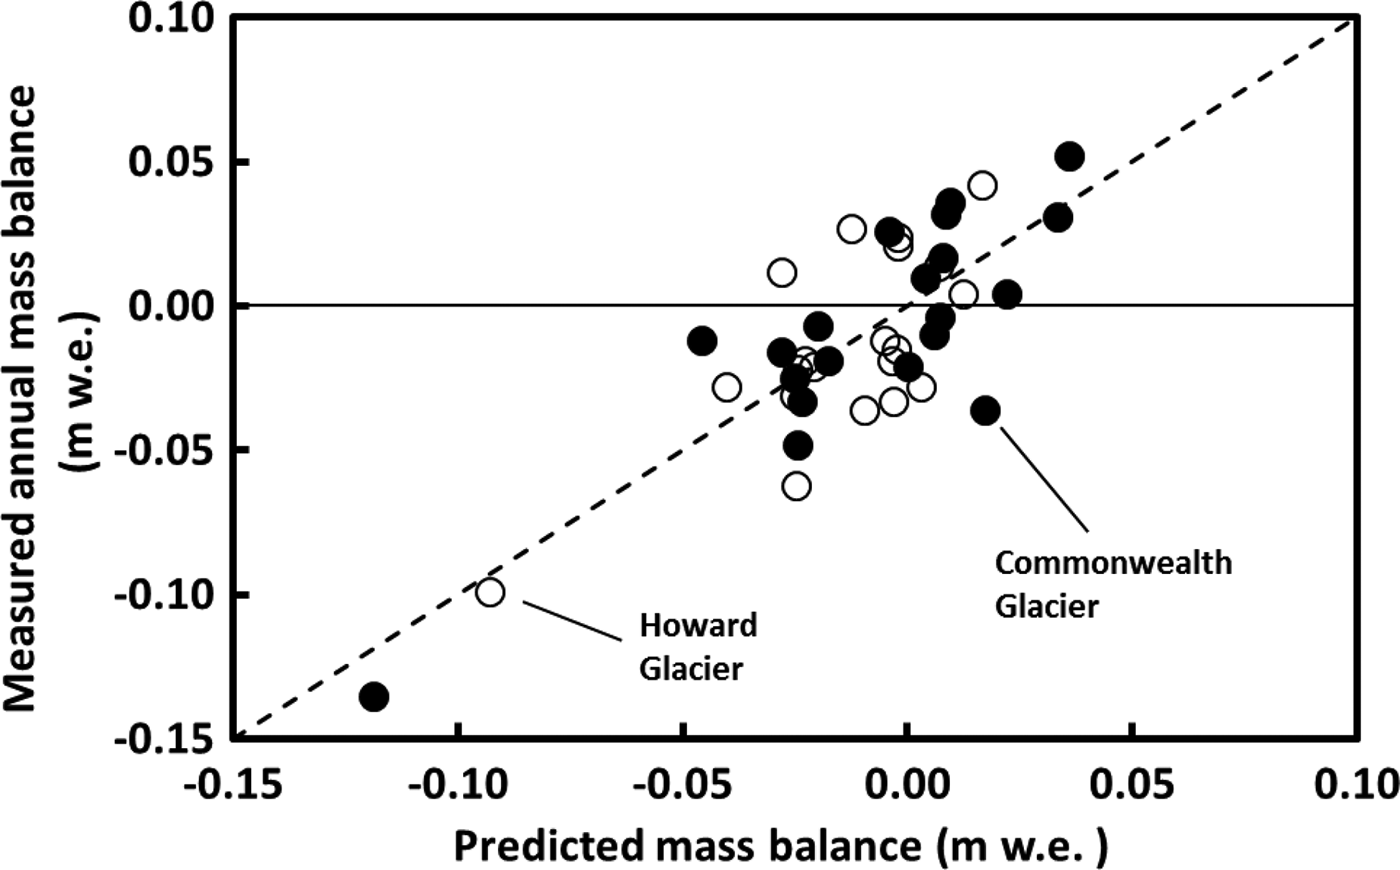
To reconstruct annual mass balance from meteorological variables and proxy measures we used both linear and multiple linear regressions. Unfortunately none of the proxy measures were useful. Either their time series did not overlap sufficiently with measurements of mass balance or the correlation was statistically insignificant. The best statistically significant correlation included summer (November–January) degree-days and summer average shortwave radiation at Lake Hoare station in Taylor Valley (Fig. 1),
 $$B_{{\rm a-c}}\, = \,492.815 - 1.795R - 1.893T_{\rm d},\ \ r^2\, = \,0.71$$
 $$B_{{\rm a - h}}\, = \,323.034\, - \,1.203R\, - \,1.386T_{\rm d},\ \ r^2\, = \,0.52$$
where B a is the annual balance, c for Commonwealth Glacier, h for Howard Glacier, R is mean shortwave radiation (W m−2), and T d is summer total degree-days. The degree–day is the sum of temperatures above 0°C divided by the number of measurement intervals in a day. Temperatures are measured every 15 minutes. For slopes in Eqn (1) the t (degrees of freedom) and p-values of the regression coefficients are, t(17) = −4.254, p = <0.001; t(17) = −4.190, p = <0.001 respectively; and for Eqn (2), t(17) = −2.721, p = 0015; t(17) = −2.930, p = 0.009. These measurements were used to extend the mass balance record back to 1988, the start of continuous meteorological measurements at Lake Hoare station.
For the period prior to 1988 we used air temperatures from Scott Base and the only statistically significant correlation with mass balance was using summer degree days. The temperature record began in 1957, however daily observations were only available starting in October 1964, so the mass balance was reconstructed back to 1965. The daily observations of minimum and maximum temperatures were averaged to estimate the daily mean. The number of degree-days over the summer was calculated by summing daily mean temperatures >0°C. Summer degree-day temperatures at Scott Base correlates very well with temperatures at Lake Hoare, r 2 = 0.78. The resulting linear regressions are,
 $$B_{{\rm a - c}}\, = \,23.221\, - \,9.833T_{{\rm d - s}}\comma \ \ r^2\, = \,0.52$$
 $$B_{{\rm a - h}} = \,6.588 - 6.521T_{{\rm d - s}}\comma \ \ r^2\, = \,0.34$$
where, T d-s is summer total degree-days for Scott Base. For the slope in Eqn (3), t(18) = −4.42, p = 0.0003; and for Eqn (4), t(18) = −3.07, p = 0.0066.
The relatively high-correlation results from the outlier of very negative mass balance caused by extreme summer melt in 2001/02 (Fig. 6). The figure shown is for the linear regressions, Eqns (1) and (2), which are similar to the results of Eqns (3) and (4). In any case, that air temperature alone does so well is a bit surprising. However, the temperature-based regression cannot adequately predict precipitation (accumulation) as Figure 7 suggests. The regression under-predicts years of positive mass balance. Comparison of snow accumulation from snow pits to degree-days at Scott Base revealed no correlation, as expected.
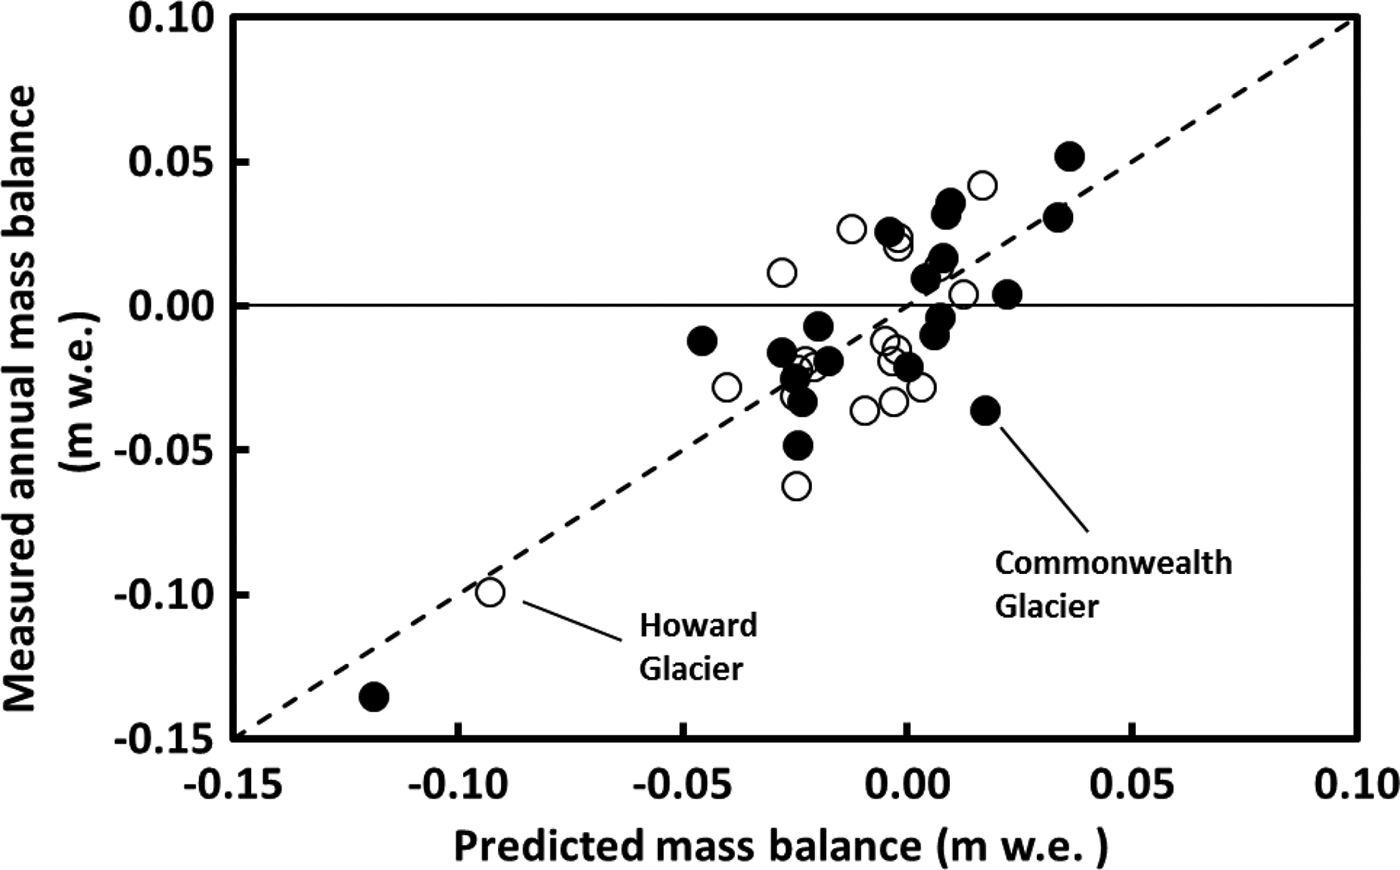
Cumulative sum of annual mass balance, predicted (dashed) and measured (solid) for Commonwealth and Howard glaciers.
The reconstructed mass-balance record shows an overall small negative mass balance for both glaciers, except for the mid-late 1980s when extremely high temperatures suggest much melt loss from the glaciers (Fig. 8). In the early 1990s mass balances were positive but a decreasing trend has continued since that time.
Reconstructed glacier mass balance for Commonwealth and Howard glaciers (top and middle panels). The solid line is the measured balance, the dashed curve is reconstructed from the degree-day and shortwave radiation models, Eqns (1) and (2); and the dotted line is the reconstruction from degree-day models alone, Eqns (3) and (4). The bottom panel is the total number of summer degree-days from Scott Base.
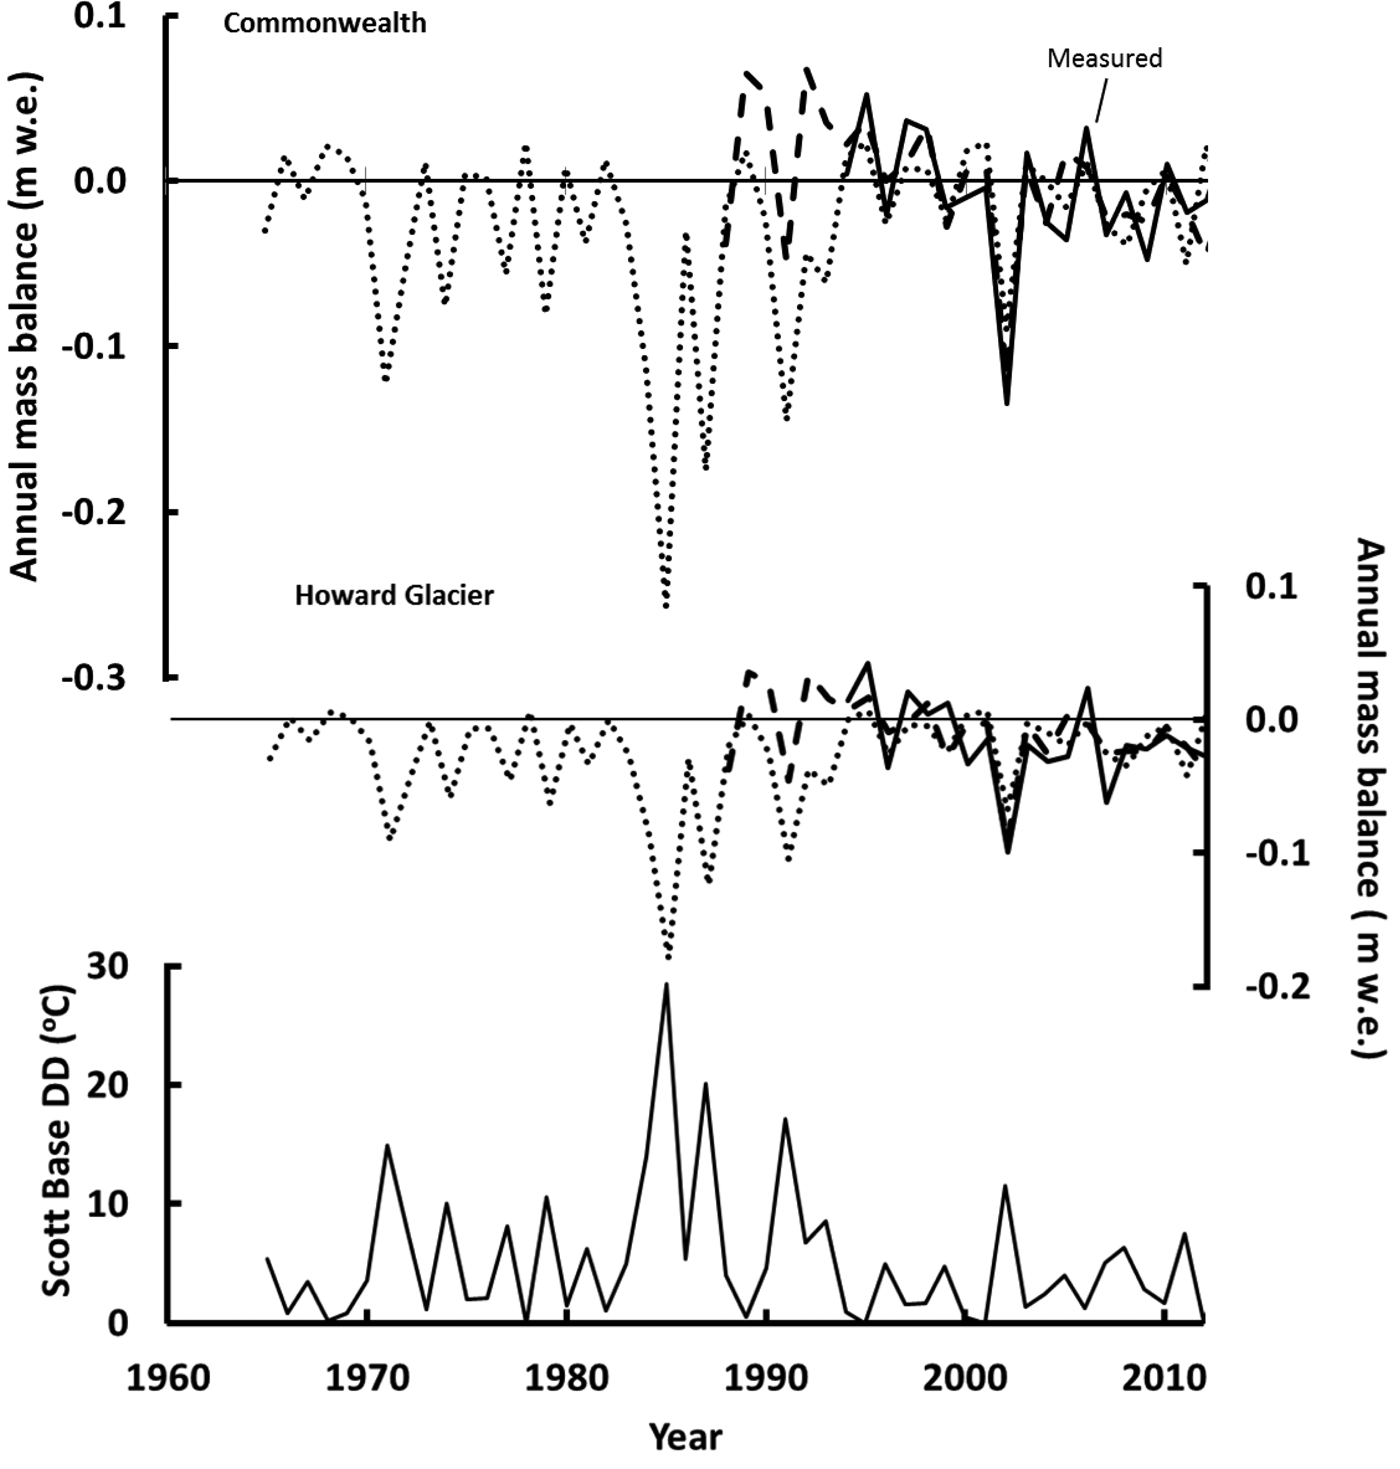
Over the entire 48 a period from 1965 to 2013, the cumulative mass change for Howard and Commonwealth glaciers is −1.6 and −1.2 m w.e. respectively. We consider these values to be over-estimates of the mass loss, due to the reliance on temperature-based regression that under-predict years of mass gain from snowfall.
An attempt was made to reconstruct the mass balance of Heimdall Glacier, the longest monitored glacier (12 years, 1971–82) of the NZAP program (Chinn, Reference Chinn1980; Chinn and Cumming, Reference Chinn and Cumming1983). The hope was to predict mass balance to include the period of the LTER measurements and compare magnitudes and trends. We re-calculated the mass balance for the Heimdall Glacier, using our methods, for the first 5 years of record, then calculated the mass balance for the last 5 years, which had not been completed originally. Unfortunately, no significant regressions were found between the mass balance and environmental variables and the comparison between glaciers was not attempted.
3.2. Changes in glacier extent
Vertical imagery of the MDV was available as early as 1956, acquired by the US Geological Survey, with image quality improving in later photographic missions. We chose black and white 1957 imagery for Canada Glacier and 1975 imagery for Commonwealth and Howard glaciers. These were the earliest photos with good texture, contrast and minimal snow cover. The image positives were scanned at 400 dots inch−1 (157 dots cm−1), but spatial resolution varies between images due to differing flight line altitudes. The resolution for 1957 is 0.9 m and for 1975, 1.8 m. We used 2007 Quickbird-02 multispectral imagery (1 m spatial resolution) for Canada and Commonwealth glaciers and 2013 Worldview-02 imagery (0.5 m spatial resolution) for Howard Glacier. The temporal range for Commonwealth Glacier was 32 years (1975–2007), for Howard Glacier, 38 years (1975–2013) and for Canada Glacier, 50 years (1957–2007).
The perimeter of a glacier terminus was defined by discriminating between the lighter pixels of snow and ice on the glacier and the dark pixels of the bedrock and gravelly soil of the adjacent valley floor. The uncertainty, including both co-registration of the images and interpretation of the glacier perimeter, is ~ ±2 m under optimal conditions. Defining the perimeter, however, could be challenging. Shadows and contrast of some photos made it difficult to distinguish the edge of the ice apron, a deposit of partly melted ice debris at the cliff base of most glaciers in the MDV, from the edge of the ice cliff. In some cases, the offset between image nadir and ice cliff obscured the ice/ground contact such that the perimeter was defined by the top edge of the cliff rather than the bottom. Finally, the edge of the glacier was often rounded making the precise delineation of the terminus cliff position ambiguous. In these circumstances the uncertainty can be high as 17 m.
Results showed advances and retreats occurring along the perimeter on all three glaciers (Fig. 9). The range was greatest along the perimeter of Commonwealth Glacier, ±59 m, with the largest uncertainty associated with the advance. Even Howard Glacier, the smallest of the three glaciers, showed a range of −30 m to +17 m. Estimates of terminus change at Canada Glacier are similar to estimates from the ground-based photographs. The vertical imagery spans a 50 year interval and brackets the 23 year (1972–95) span of the ground-based photographs (Fountain and others, Reference Fountain, Neumann, Glenn and Chinn2004b). For the northwest (southeast) tip of the glacier the vertical imagery estimate changes of +12 m ± 4 m (+5 m ± 7 m), whereas the ground-based photos estimated a change of +17 m ± 2 m (+1.9 m ± 0.4 m), respectively. Averaging changes along the entire perimeter the terminus change for Commonwealth was −3 m ± 7 m, Howard −10 m ± 5 m, and for Canada −4 m ± 8 m (Table 1). The change is no different from zero for the two largest glaciers, Commonwealth and Canada, and a small retreat for Howard Glacier.
Plan view images of Canada, Howard and Commonwealth glaciers (2007, 2013, 2007 respectively) showing advance-retreat. All images are at the same scale and are the satellite images for each. Terminus change for each glacier is shown to the right of the image. The black curve is the measured change and the grey shading is the uncertainty. The change is relative to the earliest terminus position such that positive is advance. The plotted distance along the terminus is in a clockwise direction relative to each image as indicated by the arrows and ‘x's on the images indicating the start and end of the measurements respectively.

Glacier terminus change

Year indicates when the aerial (older) and satellite (younger) imagery were taken. Area is the area of the glacier in 1971 based on the US Geological Survey maps. Time is the interval in years between imagery. Advance is the maximum advance of any point along the terminus. Retreat is the maximum retreat. Average is the average change along the entire terminus.
4. DISCUSSION AND SUMMARY
Annual and seasonal glacier mass balances in the MDV are small (>± 0.06 m w.e.), consistent with the cold dry climate of a polar desert and with previous studies (Bull and Carnein, Reference Bull and Carnein1970; Chinn, Reference Chinn1980; Fountain and others, 1996). The seasonality of ablation and accumulation is similar to that of temperate glaciers, snow accumulation dominates in winter and ablation dominates in summer. However, a single snowfall event in summer, or lack of winter snow, can dominate the mass balance in that season (Chinn, Reference Chinn1980; Fountain and others, Reference Fountain, Nylen, MacClune and Dana2006). The importance of each season to annual balance may differ between glaciers despite their proximity. Commonwealth Glacier is more sensitive to summer balance whereas Howard Glacier is more sensitive to winter. This difference is probably due to the area-elevation distribution of each glacier. Commonwealth Glacier reaches a lower elevation and maintains a large area (~20% of total) below 325 m a.s.l. whereas Howard Glacier is a higher glacier with its lowest elevation at 325 m a.s.l. (Fig. 2). Consequently higher summer air temperatures subject a larger fractional area of Commonwealth Glacier to greater sublimation and melt compared with Howard Glacier (Hoffman and others, Reference Hoffman, Fountain and Liston2016). When the extreme melt summer of 2001/02 is removed the correlation between summer and annual balance decreases significantly for both glaciers – Howard shows no significant correlation whereas it is still significant for Commonwealth. This underscores the importance of low-elevation glacier regions to the mass balance of Commonwealth Glacier. It may be tempting to exclude the summer of 2002 as an outlier, however, as the temperature record shows (Fig. 3), warm summers occur episodically and are an important feature of the MDV climate.
The correlation of annual and seasonal balances between the glaciers is high, which is reassuring for two glaciers only ~6 km apart in an open valley. This supports the notion that regional climate variations control the overall variability whereas local setting controls the magnitude of the response (Walters and Meier, Reference Walters, Meier and Peterson1989; Bitz and Battisti, Reference Bitz and Battisti1999; Vuille and others, Reference Vuille, Kaser and Juen2008; Basagic and Fountain, Reference Basagic and Fountain2011). Both the correlation and regression values are much higher for summer balances than for winter indicating that the meteorological controls on ablation are similar between glaciers. The intercept for the regression between summer balances is zero indicating a well-mixed heat content of the summer atmosphere over the short distance between the two glaciers. This inference is predicated on the association of summer air temperature with summer ablation (Tangborn, Reference Tangborn1980; Dana and others, Reference Dana, Davis, Fountain and Wharton2002; Ebnet and others, Reference Ebnet, Fountain, Nylen, McKnight and Jaros2005; Hock, Reference Hock2005). Winter balances were less well correlated, probably due to the spatial variation of snowfall and effects of wind redistribution between glaciers. The negative intercept for the regression between winter balances of −0.12 m w.e. indicates that Howard Glacier receives less snow accumulation, consistent with the spatial gradient of snow fall and energy balance in the valley (Fountain and others, Reference Fountain1999, Reference Fountain, Nylen, Monaghan, Basagic and Bromwich2010). The differences in mass balance between glaciers are probably due to the local vagaries of area/elevation distribution, precipitation and wind redistribution.
Systematic ELA differences between the glaciers results from strong precipitation and temperature gradients in the valleys (Fountain and others, Reference Fountain1999). The poor correlations between ELA and annual mass balances (r 2 ~ 0.49) is surprising because this correlation is typically excellent for temperate glaciers (Armstrong, Reference Armstrong and Oerlemans1989; Paterson, Reference Paterson2000), polythermal glaciers (Holmlund and others, Reference Holmlund, Jansson and Pettersson2005) and polar glaciers (Hagen and Liestøl, Reference Hagen and Liestøl1990). The plot of ELA and balance (Fig. 5) shows that for the same mass balance the ELA can change by 100–200 m, and the year to year variations in ELA between the two glaciers are not correlated (not shown) despite highly correlated balances. This is due to the highly variable mass-balance gradient with elevation, which not only changes significantly from year to year, but also may change in sign in the upper elevations. For example, the mass balance with elevation plots for Howard and Commonwealth glaciers in Fig. 2 could represent the same glacier on different years. In fact, on Howard Glacier, the zone of zero mass balance, which otherwise defines the ELA, can adopt a longitudinal profile spanning over 100 m in elevation range. This has been observed on other glaciers in the region (e.g. Fig. 29 of Chinn and Dickson, Reference Chinn and Dickson1986). For most glaciers in other environments, the mass-balance gradient with elevation is roughly constant from year to year, with only the offset changes resulting in a positive or negative mass balance (Meier and Tangborn, Reference Meier and Tangborn1965; Kuhn, Reference Kuhn1984; Greuell, Reference Greuell1992). We hypothesize that the temporally variable gradient in the MDV results from the wind redistribution of the low snowfall. Field observations and stake measurements document bare ice regions up wind of the direction of the high-speed drainage winds and snow accumulation downwind suggesting patterns of snow erosion and deposition by wind. A characteristic feature of the MDV is the high-velocity drainage winds, particularly in winter, that descend from the East Antarctic ice sheet into the valleys reaching velocities of 30 m s−1 (Doran and others, Reference Doran2002a, Reference Doranb; Nylen and others, Reference Nylen, Fountain and Doran2004; Speirs and others, Reference Speirs, Steinhoff, McGowan, Bromwich and Monaghan2010). The wind also enhances sublimation, which represents about half of the total ablation from these glaciers (Fountain and others, Reference Fountain, Nylen, MacClune and Dana2006; Hoffman and others, 2012). An extreme form of wind-redistribution and sublimation process is evidenced by the presence of blue ice areas on the ice sheet. Although elevation changes vary little (<10 m) over horizontal distances of kilometers, the accumulation zone transitions into an ablation zone (blue ice) due to wind erosion of snow and ablation of ice (Whillans and Cassidy, Reference Whillans and Cassidy1983). In the mountainous terrain of the MDV, wind effects are such that the higher elevation head of a glacier may be an ablation zone as well as the lower elevation terminus.
In temperate regions, the gradient of ablation with elevation is an important factor in establishing the gradient in mass balance. In summer, air temperatures are commonly above freezing and melting at the terminus of a glacier may be an order of magnitude larger than at the top of the glacier, caused by warmer temperatures at lower elevations and a lowering of albedo when the snowpack disappears, revealing the darker ice underneath (Hock, Reference Hock2005, Meier and Tangborn, Reference Meier and Tangborn1965; Ostrem and Brugman, Reference Ostrem and Brugman1991). The MDV air temperatures are commonly below freezing and ablation is dominated by sublimation, a less efficient ablative process compared with melt, which is weakly dependent on temperature (Neumann and others, Reference Neumann, Albert, Engel, Courville and Perron2009; Cuffey and Paterson, Reference Cuffey and Paterson2010). Given the relatively small elevation ranges (<800 m) of the measured glaciers, air temperature differences over that range do not exceed 8°C at the dry adiabatic lapse rate, consequently ablation differences are small. Therefore, the gradient of ablation via sublimation only weakly enforces an increasing mass balance with elevation.
The trend since 1993 of measured mass balance on Commonwealth and Howard glaciers generally show mass accumulation prior to 1999 and mass loss after the big melt summer of 2001/02 (Fig. 4). Inspection of the seasonal mass balance (Fig. 3) shows that after 2001 the annual mass loss is due to the small, sometimes negative, winter mass balances that, over a period of a few years, sum to near zero, whereas the summer mass balances have been generally negative. The cause of the small winter balances is unknown. Valley floor measurements of wind speed, perhaps a proxy for snow erosion and transport from the glaciers, show no trend. The trend of increasingly negative summer mass balances after 2005 is also a puzzle. Although the number of degree-days is generally increasing (Fig. 8), the trend is not significant. Hoffman and others (Reference Hoffman, Fountain and Liston2016) found that after 2001/02 their energy balance model, using meteorological stations on four glaciers in Taylor Valley, underestimated ablation at lower elevations within the ablation zones. By reducing the albedo, measured at the meteorological station, they found slightly an excellent match between modeled and measured ablation. They contend that increased surface sediment in those regions can explain the increased ablation. We speculate that the cause of the negative summer mass balances is due to the increased sediment and is linked to the big melt summer of 2001/02. During that event a surface layer, several tens of cm thick, was melted off the ablation zone of the glaciers revealing subsurface sediment trapped in cryoconite holes. Snow in the summers of 2003 and 2004 shielded the ice surface from extensive melting. Since that time the sediment redistributed over the ablation zone reducing the albedo and increasing melt. Perhaps the summer ablation is becoming more sensitive to air temperature due to lower albedo ice.
The multiple linear regression analysis showed that glacier mass balance is well correlated (negatively) with air temperature, as has been shown elsewhere, and therefore it should be no surprise here (Dyurgerov, Reference Dyurgerov2001). These results differ from Chinn (Reference Chinn1981) who suggested a positive correlation between air temperature and mass balance. The mass balance for Howard and Commonwealth glaciers was reconstructed for a 48 year period starting in 1965 using a linear correlation with temperature at Scott Base for the first 23 years, a multiple linear correlation with locally measured air temperature and shortwave radiation for the next 5 years and field measurements for the last 20 years. Results show generally small mass balances except for the mid-1980s when large negative balances occurred associated with high summer air temperatures. Since 1965 the cumulative mass loss is estimated to be −1.6 m and −1.2 m w.e., averaged over the glacier surface, for Howard and Commonwealth glaciers respectively. These small changes over nearly half a century are well within the uncertainty of the regressions. Furthermore, a temperature-based regression is insensitive to periods of snow accumulation, as shown in Fig. 7, making our estimated cumulative mass loss an overestimate, so that the glaciers are closer to equilibrium than implied by our results. Therefore, we infer no mass change of the glaciers for the past half century.
Changes in glacier extent were examined for three glaciers to provide another perspective of glacier change. Over the past 32–50 years, depending on the glacier, the net change for all glaciers was retreat. The magitude of retreat, however, was small (<5 m) and less than the uncertainty at Commonwealth and Canada, the two largest glaciers. We therefore conclude that these glaciers have not changed significantly. Howard Glacier exhibited a larger retreat, of −10 m, and twice its uncertainty. Whether this retreat is a long-term (~10 ka) response to conditions in the distant past or a response to the net mass loss of <−1.6 m w.e. over the past 48 years is unclear. It is doubtful that the current retreat is due to the small (and over-estimated) mass loss estimated for the past 48 years. Given the slow response time of the glacier, we conjecture that the current retreat is a response to conditions in the distant past. That similar behavior is not observed in the other two glaciers results from differences in response times.
Our evidence of glacier stability stands in contrast to most glaciers globally (Jacob and others, Reference Jacob, Wahr, Pfeffer and Swenson2012) and results from the low temperatures and overall stability of the Antarctic climate (Doran and others, Reference Doran2002a, Reference Doranb; Thompson and Solomon, Reference Thompson and Solomon2002). This stability and lack of major advance is supported by the geologic record (Wilch and others, Reference Wilch, Denton, Lux and McIntosh1993). That the glaciers appear to be losing mass in the recent decade may be merely a short-term trend with unclear long-term implications. Indeed, the small variations in mass balance in this polar desert and the associated uncertainty suggest the glaciers may be even closer to stability than we indicate.
The changes in extent for Canada Glacier compare favorably with point estimates from hand-held ground-based photography. Over 23/24 a (1972/73–1996) two locations on Canada Glacier advanced by 2 and 17 m (Fountain and others, Reference Fountain, Neumann, Glenn and Chinn2004b). At about the same locations the vertical imagery showed −1 m ± 4 m and 20 m ± 5 m of change. Point measurements at other glaciers showed similar changes. At Suess Glacier, next to Canada Glacier the change was −2 and −5 m over a 24 year period (Fountain and others, Reference Fountain, Neumann, Glenn and Chinn2004b). Measurements at 12 different glaciers over a 10–13 year period showed changes in extent of −2 m to +8 m; Meserve Glacier, over a 30 a span (1966–96), changed by –8 m but the entire retreat was accomplished in the first 20 a (Chinn, Reference Chinn1998). Outside the MDV, the large outlet glaciers in the McMurdo Sound region show no detectible change (>60 m) from 1973/74 to 2001 (Ferrigno and others, Reference Ferrigno, Foley, Swithinbank and Williams2010).
For fan-shaped ablation zones we questioned whether changes in extent were uniform along their termini; the answer is important for glacier change studies based on point measurements of extent (Chinn, 1989; Fountain and others, Reference Fountain, Neumann, Glenn and Chinn2004b). Our results show that the changes were quite variable along the termini and surprisingly large, ±tens of meters, and we conclude that point measures may not necessarily reflect average net change of a glacier with a fan-shaped ablation zone. It may be coincidence but some retreat occurred on the west-facing terminus of all three glaciers and we speculate that drainage winds may be the cause. High-speed winter drainage winds transport and deposit sediment on the windward (west-facing) segments of the termini locally enchance summer ablation. Also, the drainage winds warm adiabatically as they descend into the valley (Doran and others, Reference Doran2002a, Reference Doranb; Nylen and others, Reference Nylen, Fountain and Doran2004; Speirs and others, Reference Speirs, Steinhoff, McGowan, Bromwich and Monaghan2010) rapidly ablating the glaciers (Hoffman and others, accepted), particularly the windward segments.
5. CONCLUSIONS
The cold dry climate of the McMurdo Dry Valleys limit the magnitude of the seasonal and annual balances to values typically <±0.06 m w. e. Although winter is typically the accumulation season, a single large snowfall can dominate the accumulation for a season sometimes making summer the accumulation season, and if little snowfall occurs in winter it can be the ablation season. Mass balance increases with elevation like glaciers elsewhere, but the gradient can change dramatically from year to year due to wind redistributing the low snow accumulation. Consequently, the year to year ELA is poorly correlated with mass balance.
Mass balance increased during the 1990s, associated with a cooling trend in the region (Doran and others, Reference Doran2002a, Reference Doranb). Since 2002, after the ‘big melt’ summer of 2001/02, glaciers have lost mass due to the lack of consistently positive winter mass balance (sometimes negative) and increasingly negative summer balances. Annual glacier mass was reasonably correlated with locally measured shortwave radiation and air temperature, expressed as degree-days; and an acceptable correlation with air temperature alone (degree-days) at Scott Base, ~100 km away. Reconstructing the mass balance record back to 1965 shows generally small balances except for mid 1980s when the balances were quite negative and coincided with high air temperatures. The cumulative mass change over the past half century (since 1965) is <−2 m w.e. averaged over the surface of the glaciers and the uncertainty suggests the cumulative value is no different than zero. Furthermore, the regression is relatively insensitive to periods of positive mass balance and a more robust model would yield a cumulative change closer to zero.
Changes in glacier extent were measured at three glaciers. For the two largest, Commonwealth and Canada, both had retreated but measurement uncertainty suggests the change is no different from zero. Howard Glacier also retreated, −10 m over 38 a, and the change is significant. The retreat is an unlikely response to the small mass loss over the same time period and more likely a response to conditions in the past 103 years based on glacier response time. The change in extent was variable along the fan-shaped termini of these glaciers. Each terminus had some parts that advanced and others that retreated within a total net change of retreat. This behavior calls into question the use of ground-based photographs and point measurements for assessing the activity of glaciers with fan-shaped termini.
Our reconstructed half-century of glacier mass balance supports the long term perspective (105 years) of glacial stability and relatively small variations determined from the geologic record. The glacial stability within the MDV contrasts with the rapid mass loss of alpine glaciers in the temperate regions of the planet.
ACKNOWLEDGEMENTS
This research was funded by McMurdo LTER NSF OPP grant 1115245. We greatly appreciate the effort of many people who helped take the field measurements, particularly Thomas Nylen, Paul Langevin and Karen Lewis, and the logistical support provided by Antarctic Support Center, its predecessors, and PHI Helicopters. Discussions with our wonderful colleagues within the LTER and with fellow scientists in general are warmly acknowledged. We appreciate the suggestions of the two reviewers, Peter Jansson and anonymous that improved the manuscript significantly. Finally, we appreciate the efforts of the Chief Editor, Jo Jacka, who has gently guided this and many other manuscripts toward publication. He is now in the final weeks of his tenure and deserves many thanks.
Appendix 1
Specific mass balance of Commonwealth, Howard and Heimdall glaciers for annual, summer and winter balances
Annual mass balance (Ba) in m w.e., ELA (m a.s.l.) and accumulation area ratio (AAR) for Commonwealth and Howard glaciers




 Open access

