





Non-technical Summary
The fossil record suggests that marine gastropods (snails) increased in diversity during the Mesozoic and Cenozoic eras. However, on average, the preservational condition of these fossils is higher in more recent deposits, such that they are easier to collect and identify, which might inflate the appearance of diversification toward the present. Specifically, the sediments containing the fossils tend to be less cemented (lithified) in younger deposits, and the aragonite that makes up their shells is less likely to be altered or dissolved. Notably, both factors affect the collection and identification of small fossils. Here, we quantify the relationship between preservational quality and body size in Cretaceous and Paleogene snails in the paleontological literature. We measured shell size for specimens representing more than 7000 species occurrences illustrated in more than 200 sources and assessed their preservational quality based on three factors that could be observed in the photographs. We found that shells smaller than 9–14 mm become underrepresented in the paleontological literature as preservational quality declines. Furthermore, the average quality of fossil preservation does improve through time. We also found that shells that were either less cemented or had more pristine surfaces tended to be smaller in size. Thus, preservation likely complicates estimates of biodiversity change in gastropods during this time interval, and future work based on the methods described here could offer improved estimates of this bias.
Introduction
The observed biodiversity of marine fossil animals increased both globally and locally during the Mesozoic and Cenozoic (Bambach Reference Bambach1977; Sepkoski et al. Reference Sepkoski, Bambach, Raup and Valentine1981; Kowalewski et al. Reference Kowalewski, Kiessling, Aberhan, Fürsich, Scarponi, Wood and Hoffmeister2006; Alroy Reference Alroy2010a; Bush and Bambach Reference Bush and Bambach2011). However, the true magnitude of diversity change has been widely debated, reflecting (in part) different opinions on the extent to which preservational biases obscure trends in diversity (Bambach Reference Bambach1977; Sepkoski et al. Reference Sepkoski, Bambach, Raup and Valentine1981; Kowalewski et al. Reference Kowalewski, Kiessling, Aberhan, Fürsich, Scarponi, Wood and Hoffmeister2006; Hendy Reference Hendy2009; Alroy Reference Alroy2010b; Bush and Bambach Reference Bush and Bambach2015; Bush and Payne Reference Bush and Payne2021; Karapunar et al. Reference Karapunar, Nützel, Seuss and Mapes2022).
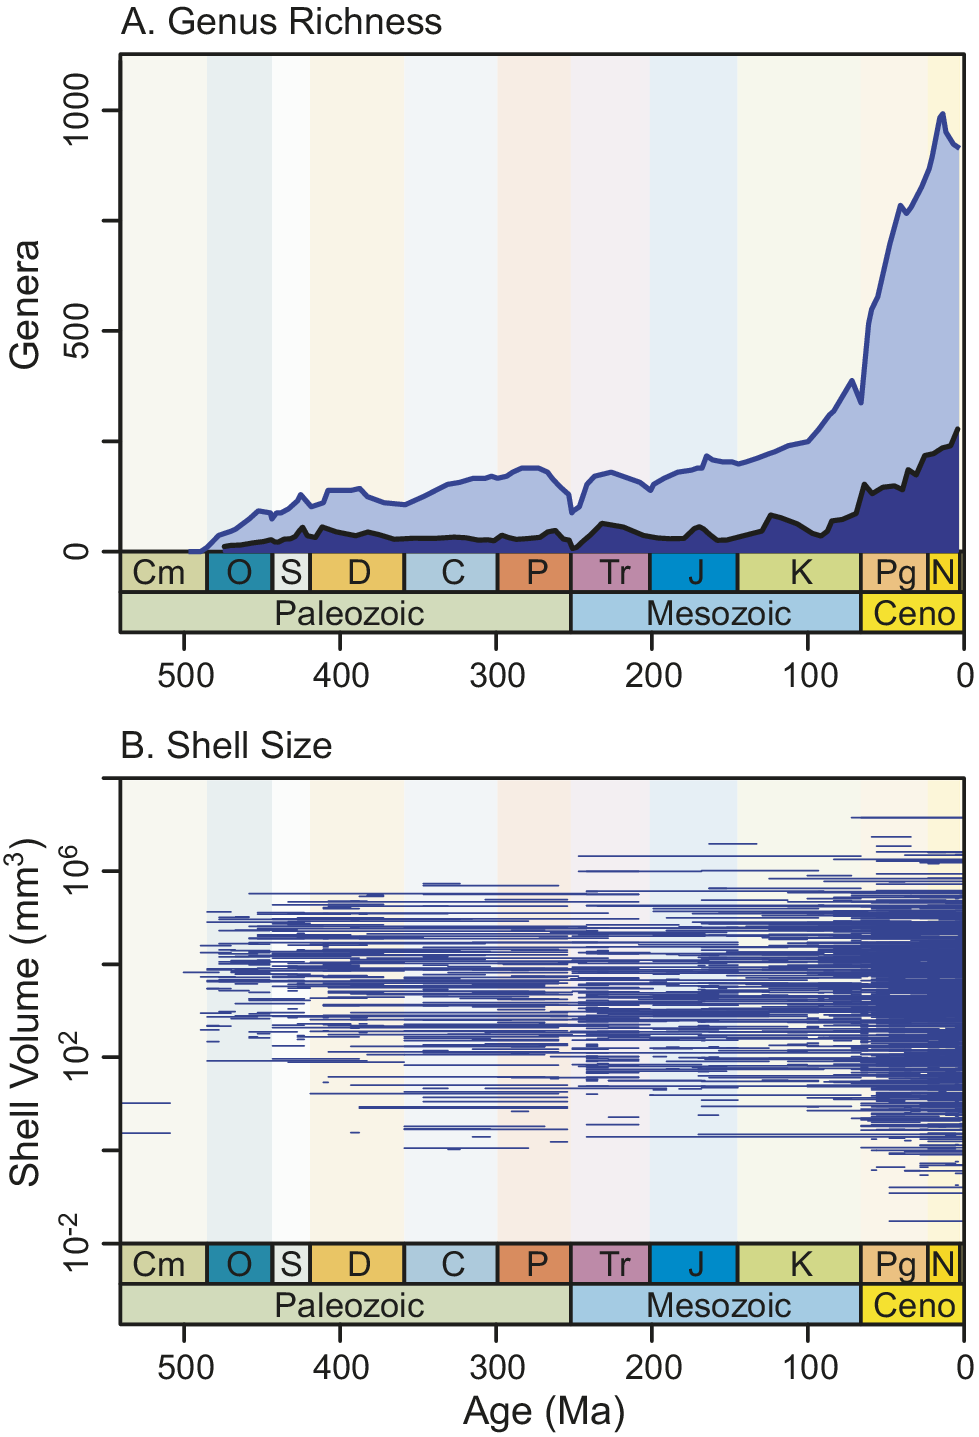
Gastropods were a major contributor to post-Paleozoic diversification (Sohl Reference Sohl1987; Kowalewski et al. Reference Kowalewski, Kiessling, Aberhan, Fürsich, Scarponi, Wood and Hoffmeister2006; Cherns and Wright Reference Cherns and Wright2009; Finnegan et al. Reference Finnegan, McClain, Kosnik and Payne2011; Fig. 1A) and provide a useful model system for investigating the effects of preservation on diversity history during the late Mesozoic and Cenozoic, alongside other key groups like bivalves. The gastropod record is affected by a number of taphonomic megabiases, which cause major distortions in inferences of biological patterns from the fossil record (Kowalewski and Flessa Reference Kowalewski and Flessa1996). Here, we focus on biases related to (1) a decrease toward the present in the prevalence of lithified sedimentary deposits and (2) an increase toward the present in the average quality of shell preservation.
Phanerozoic trends in gastropod diversity and body size. A, Number of sampled genera through time. Top curve: total diversity (not standardized for sampling). Data downloaded from the Paleobiology Database (https://paleobiodb.org/) on 10 May 2024 and tabulated using the boundary-crosser method, including genera from marine paleoenvironments and excluding taxa that Bush and Bambach (Reference Bush and Bambach2015) flagged as terrestrial. Bottom curve: marine gastropod richness standardized by shareholder quorum subsampling (data and analysis from Karapunar et al. Reference Karapunar, Höhna and Nützel2024). B, Shell size through time (data from Heim et al. Reference Heim, Knope, Schaal, Wang and Payne2015). Stage-level timescale ranges from the Cambrian through the Pliocene. Cm = Cambrian; O = Ordovician; S = Silurian; D = Devonian; C = Carboniferous; P = Permian; Tr = Triassic; J = Jurassic; K = Cretaceous; Pg = Paleogene; N = Neogene; Ceno = Cenozoic.

Figure 1 Long description
Part A shows genus richness of gastropods over time. The y-axis shows the number of genera, and the x-axis shows the geologic time scale, covering the Paleozoic, Mesozoic, and Cenozoic. There are two curves; the top curve is total diversity and is not standardized for sampling, while the bottom curve uses shareholder quorum subsampling. Both curves generally rise through time, but steeply rise at the beginning of the Cenozoic. Part B shows gastropod shell size over the same time interval; the range of sizes increases through time, particularly at the beginning of the Cenozoic.
Lithification, the conversion of loose sediment to solid rock, comprises several processes, including compaction and cementation by mineral precipitation (Dapples Reference Dapples1972; Hendy Reference Hendy2009, Reference Hendy2011; Hawkins et al. Reference Hawkins, Kowalewski and Xiao2018). Lithification affects the ease with which fossils can be extracted from the host rock by removing the surrounding matrix. Fossils can be easily sieved or removed from unlithified sediments (e.g., liberation Lagerstätten), whereas they can only be released from partially lithified (weakly cemented) sediments with some effort (Kowalewski and Hoffmeister Reference Kowalewski and Hoffmeister2003; Hendy Reference Hendy2009, Reference Hendy2011; Roden et al. Reference Roden, Hausmann, Nützel, Seuss, Reich, Urlichs, Hagdorn and Kiessling2019; Karapunar et al. Reference Karapunar, Nützel, Seuss and Mapes2022). Complete extraction from fully lithified sediments, if possible, may require chemical treatments or mechanical tools like hammers, air pens, and rock splitters (Kowalewski and Hoffmeister Reference Kowalewski and Hoffmeister2003; Hendy Reference Hendy2009).
Representation of unlithified deposits increases toward the Holocene, as the likelihood of their preservation increases toward the Recent (Jablonski et al. Reference Jablonski, Roy, Valentine, Price and Anderson2003; Hendy Reference Hendy2011; Nawrot Reference Nawrot2012; Sanders et al. Reference Sanders, Merle and Villier2015). Mesozoic deposits are commonly preserved as lithified rock, but some Jurassic and many Cretaceous sediments are partially lithified or unlithified (Kowalewski et al. Reference Kowalewski, Kiessling, Aberhan, Fürsich, Scarponi, Wood and Hoffmeister2006; Sessa et al. Reference Sessa, Patzkowsky and Bralower2009; Hendy Reference Hendy2011). Unlithified sediments become much more common in the Cenozoic, such that Cenozoic sediments can often be sieved for fossils (Kowalewski and Hoffmeister Reference Kowalewski and Hoffmeister2003; Kowalewski et al. Reference Kowalewski, Kiessling, Aberhan, Fürsich, Scarponi, Wood and Hoffmeister2006; Hendy Reference Hendy2009, Reference Hendy2011; Sessa et al. Reference Sessa, Patzkowsky and Bralower2009; Bush and Bambach Reference Bush and Bambach2015).
Observed species diversity is often two to four times higher in assemblages from unlithified sediments than in assemblages from lithified sedimentary rocks from similar environments (Hendy Reference Hendy2009; Sessa et al. Reference Sessa, Patzkowsky and Bralower2009; Nawrot Reference Nawrot2012; Sanders et al. Reference Sanders, Merle and Villier2015). Some of this difference results from the relative ease of collecting large samples from unlithified deposits, but assemblages from lithified rocks and unlithified sediments still differ in species richness after sampling standardization (Sessa et al. Reference Sessa, Patzkowsky and Bralower2009; Hendy Reference Hendy2011; Nawrot Reference Nawrot2012). Therefore, other factors must contribute to the difference in diversity between lithified and unlithified rocks, including the preferential loss of certain types of fossils during diagenesis, differences in sample preparation, and differences in time averaging (Flessa et al. Reference Flessa, Cutler and Meldahl1993; Martin Reference Martin1999; Behrensmeyer et al. Reference Behrensmeyer, Kidwell and Gastaldo2000; Kidwell et al. Reference Kidwell, Rothfus and Best2001; Rothfus Reference Rothfus2005; Hendy Reference Hendy2009; Sessa et al. Reference Sessa, Patzkowsky and Bralower2009; Brown et al. Reference Brown, Evans, Campione, O’Brien and Eberth2013; Hausmann and Nützel Reference Hausmann and Nützel2015).
Dissolution is a particular problem for gastropods and other invertebrates that have shells of aragonite (Behrensmeyer et al. Reference Behrensmeyer, Kidwell and Gastaldo2000; Foote et al. Reference Foote, Crampton, Beu and Nelson2015). While both aragonitic and calcitic shells are vulnerable to dissolution when shallowly buried (Behrensmeyer et al. Reference Behrensmeyer, Kidwell and Gastaldo2000; Cherns and Wright Reference Cherns and Wright2000; Allison and Bottjer Reference Allison and Bottjer2011a), aragonite is less stable and more likely to dissolve during diagenesis, suggesting that aragonitic shells are often underrepresented in the fossil record (Cherns and Wright Reference Cherns and Wright2000, Reference Cherns and Wright2009; Bush and Bambach Reference Bush and Bambach2004; Sanders Reference Sanders2004; Wright and Cherns Reference Wright and Cherns2004; Kidwell Reference Kidwell2005; Cooper et al. Reference Cooper, Maxwell, Crampton, Beu, Jones and Marshall2006; Butts and Briggs Reference Butts and Briggs2011; Cherns et al. Reference Cherns, Wheeley and Wright2011; Fraiser et al. Reference Fraiser, Clapham and Bottjer2011; Hendy Reference Hendy2011; Daley and Bush Reference Daley and Bush2020; Frank et al. Reference Frank, James and Shultis2020).
Given that the vast majority of Mesozoic–Cenozoic gastropods have aragonitic shells, we expect all gastropod groups to be significantly affected by dissolution. However, small fossils are particularly vulnerable to dissolution due to their higher surface area to volume ratio and thin shell walls (Flessa et al. Reference Flessa, Cutler and Meldahl1993; Gardin and Monechi Reference Gardin and Monechi1998; Sanders Reference Sanders2003; Cooper et al. Reference Cooper, Maxwell, Crampton, Beu, Jones and Marshall2006; Cherns and Wright Reference Cherns and Wright2009; Hendy Reference Hendy2009; Sessa et al. Reference Sessa, Patzkowsky and Bralower2009; Butts and Briggs Reference Butts and Briggs2011; Hawkins et al. Reference Hawkins, Kowalewski and Xiao2018; Dominici et al. Reference Dominici, Forli, Bogi, Guerrini and Benvenuti2020; Hausmann et al. Reference Hausmann, Nützel, Roden and Reich2021; Banerjee and Halder Reference Banerjee and Halder2024).
Lithification is also likely to preferentially hamper the recovery of small fossils. Larger shells are more likely to be exposed on rock surfaces (Hawkins et al. Reference Hawkins, Kowalewski and Xiao2018) and less likely to be overlooked (Bouchet et al. Reference Bouchet, Lozouet, Maestrati and Heros2002; Cooper et al. Reference Cooper, Maxwell, Crampton, Beu, Jones and Marshall2006; Cherns and Wright Reference Cherns and Wright2009; Hendy Reference Hendy2009; Sessa et al. Reference Sessa, Patzkowsky and Bralower2009; Finnegan et al. Reference Finnegan, McClain, Kosnik and Payne2011; Nawrot Reference Nawrot2012; Sanders et al. Reference Sanders, Merle and Villier2015; Hausmann et al. Reference Hausmann, Nützel, Roden and Reich2021; Brown et al. Reference Brown, Campione, Mantilla and Evans2022). Smaller shells can be more difficult to remove from lithified sediments and may be destroyed or damaged during collection and preparation (Cooper et al. Reference Cooper, Maxwell, Crampton, Beu, Jones and Marshall2006; Cherns and Wright Reference Cherns and Wright2009; Hendy Reference Hendy2009, Reference Hendy2011; Nawrot Reference Nawrot2012; Hawkins et al. Reference Hawkins, Kowalewski and Xiao2018; Daley and Bush Reference Daley and Bush2020). Furthermore, after collection, small taxa may be more difficult to identify (Jablonski et al. Reference Jablonski, Roy, Valentine, Price and Anderson2003; Finnegan et al. Reference Finnegan, McClain, Kosnik and Payne2011; Hendy Reference Hendy2011; Sanders et al. Reference Sanders, Merle and Villier2015). Biases against preservation and collection of small specimens are probably widespread, affecting many taxa (e.g., Behrensmeyer and Dechant Boaz Reference Behrensmeyer, Boaz, Behrensmeyer and Hill1980; Kidwell Reference Kidwell2002; Brown et al. Reference Brown, Evans, Campione, O’Brien and Eberth2013, Reference Brown, Campione, Mantilla and Evans2022).
As lithification and dissolution are both expected to preferentially eliminate or conceal small gastropod shells, size is a valuable parameter to explore how preservation affects diversity estimates. Body-size data compiled by Heim et al. (Reference Heim, Knope, Schaal, Wang and Payne2015) suggest that small gastropods (less than ~5 mm in length) were rare in the Paleozoic and most of the Mesozoic (Fig. 1B), becoming more common in the latest Mesozoic and Cenozoic, when unlithified sedimentary deposits also become more common (Kowalewski and Hoffmeister Reference Kowalewski and Hoffmeister2003; Sessa et al. Reference Sessa, Patzkowsky and Bralower2009; Hendy Reference Hendy2011; Bush and Bambach Reference Bush and Bambach2015). These shifts in size and preservation occurred at the same time that the apparent diversity of gastropods increased globally (Fig. 1A), suggesting that improved preservation could indeed be accentuating observed diversity trends. However, Heim et al.’s (Reference Heim, Knope, Schaal, Wang and Payne2015) gastropod size data are derived from older literature (i.e., Wenz Reference Wenz and Schindewolf1938; Knight et al. Reference Knight, Keen, Moore, Yonge, Batten, Robertson, Cox, Ludbrook, Yochelson and Smith1960), which has an appreciable bias toward larger taxa (McGowan et al. Reference McGowan, Smith and Taylor2009; Brown et al. Reference Brown, Evans, Campione, O’Brien and Eberth2013; Payne and Heim Reference Payne and Heim2020). These data are likely dominated by surface-collected material, whereas collection methods that are superior at recovering small specimens have been increasingly employed in recent decades (e.g., careful disaggregation of bulk samples, extraction of silicified or phosphatized fossils) (Nützel and Kaim Reference Nützel and Kaim2014; Dominici et al. Reference Dominici, Forli, Bogi, Guerrini and Benvenuti2020, Reference Dominici, Danise and Tintori2024; Hausmann et al. Reference Hausmann, Nützel, Roden and Reich2021; Karapunar et al. Reference Karapunar, Nützel, Seuss and Mapes2022).
Here, we investigate in greater detail the relationship between preservational quality and body size in marine gastropods based on a new compilation of literature data from the Cretaceous and Paleogene periods, an interval that includes substantial changes in diversity and size (Fig. 1). More specifically, we examine (1) how preservational quality affects the size–frequency distribution of gastropods in the paleontological literature, and (2) how preservational quality and body-size distribution change through time, potentially introducing biases in the measurement of biodiversity. We chose to focus specifically on published illustrations, in part because description and illustration are key prerequisites for a taxon to be incorporated into the large-scale databases used for biodiversity analysis (e.g., Sepkoski et al. Reference Sepkoski, Bambach, Raup and Valentine1981; Heim et al. Reference Heim, Knope, Schaal, Wang and Payne2015). To gauge preservation, we define a set of semiquantitative metrics that can be applied to illustrations of fossils in the paleontological literature. These general methods could be applied to other taxa or time intervals in the fossil record.
The effects of preservational heterogeneity on the tabulation of molluscan diversity have been discussed extensively and quantified at local and regional scales (Koch and Sohl Reference Koch and Sohl1983; Cherns and Wright Reference Cherns and Wright2000; Kowalewski et al. Reference Kowalewski, Kiessling, Aberhan, Fürsich, Scarponi, Wood and Hoffmeister2006; Sessa et al. Reference Sessa, Patzkowsky and Bralower2009; Nawrot Reference Nawrot2012; Sanders et al. Reference Sanders, Merle and Villier2015; Hawkins et al. Reference Hawkins, Kowalewski and Xiao2018; Daley and Bush Reference Daley and Bush2020). We seek to build on these efforts with a new approach designed for analyzing patterns at larger geographic and temporal scales, with the caveat that preservation cannot be assessed in as much detail. In part, this project is intended as a test of this approach—that is, can general assessments of invertebrate fossil preservation based on illustrations provide useful information for assessing long-term trends in preservation and their potential effects on measurements of biodiversity?
Materials and Methods
Data were drawn from illustrations accompanying more than 200 published monographs, journal articles, and books spanning the Early Cretaceous to Oligocene, encompassing previously discussed changes in the preservational quality and diversity of gastropods. Publications were identified through various means, including online databases, reference lists of other publications, and recommendations from other paleontologists.
The most complete individual specimen for each species from each formation was included in the dataset. If the same species from the same formation was depicted in multiple sources, only the most complete specimen was included; however, occurrences of the same species in different formations were counted as separate data points. Specimens with a definite genus/subgenus assignment but an uncertain species assignment were included (e.g., a species name marked only as “sp.” or “indet.,” or accompanied by “?,” etc.), although only one undefined species per genus per formation was included to prevent double counting. Species that were distinguished as separate but not named (e.g., “sp. 1,” “sp. 2”) were treated as distinct. Monographs that primarily listed fossils from nonmarine assemblages were not used, although we did not attempt to remove individual instances of freshwater and terrestrial shells that may have been washed into marine depositional environments.
Efforts were made to maximize geographic coverage; however, North America and Europe were relatively oversampled, and Africa and Asia were undersampled (Fig. 2), as is common in studies based on the paleontological literature. In total, 7836 species-level occurrences representing 7135 distinct species and 1516 distinct genera were included in the dataset.
Sampled locations on a map of modern-day Earth. Locations determined based on approximate geo-coordinates of each formation; for unknown formations, the nearest town/landmark listed in the original source was used instead. Point size at each location indicates the number of specimens originating from that formation. A, Early Cretaceous; B, Late Cretaceous; C, Paleocene; D, Eocene; and E, Oligocene.

Figure 2 Long description
For each epoch, dots represent formations and the size of the dot represents the number of specimens from that formation. In the Early Cretaceous, dots are primarily clustered in western North American and in Europe. In the Late Cretaceous, dots are primarily clustered across North America and in Europe. In the Paleocene, dots are primarily clustered in Europe and the American coastlines, with significant dots in western Africa and in Greenland. In the Eocene, dots are more evenly dispersed across continents, though Central Asia and Africa are not strongly represented. In the Oligocene, dots are primarily clustered in the Americas and in Europe.
Taxonomy was recorded from the subclass to species level as given in the original source, and the subclass, superfamily, and family were subsequently standardized using MolluscaBase (https://www.molluscabase.org/) and the Paleobiology Database (https://paleobiodb.org/). Similarly, the formation and age were recorded as given and the formation age was subsequently updated and simplified to epoch level: Early Cretaceous (143.1–100.5 Ma), Late Cretaceous (100.5–66 Ma), Paleocene (66–56 Ma), Eocene (56–33.9 Ma), and Oligocene (33.9–23.04 Ma). For each specimen, we also recorded the country or state of origin and the specific collection location, if given.
Preservational Quality
Literature sources did not consistently describe the preservational condition of fossils and methods of preparation; in particular, it was often not reported whether the sedimentary matrix was lithified. Therefore, we evaluated preservational quality directly from the photographs of the specimens. Although this approach offers less detail than would be available in a specimen-based study, it could be consistently applied to a large database when more detailed information was lacking. Likewise, literature sources often did not report the method of collection (e.g., bulk sampled vs. surface sampled), so we did not analyze that factor, although it can also affect size distribution.
The illustrated fossils measured for this study likely represent the most complete and best-preserved specimens available at the time the primary sources were published, so our assessments of preservational quality are likely higher than would be seen for, say, bulk-sampled material. However, the bias toward the illustration of well-preserved specimens is expected to be consistent through time, so comparisons of time bins should be valid.
Preservational quality was scored based on three factors: shell completeness, pristineness of shell surface, and degree of lithification and dissolution. All three factors were scored on a semiquantitative three-point scale. For shell completeness, a score of three indicated the most complete specimens, a two indicated intermediate completeness, and a one indicated the least complete (i.e., most fragmentary) specimens (Fig. 3A). We did not distinguish among breakage that occurred before burial, after burial, during collection, or during preparation. Surface pristineness described the degree to which a shell’s surface details could be discerned, with a score of three applied to the most pristine shells, a two to intermediate shells, and a one to the least pristine specimens (Fig. 3B). The most pristine shells generally had an outer surface free of sediment, with the external layers intact and not subject to extensive peeling. A value of one typically indicated that substantial quantities of sediment were stuck to the shell, which presumably could not be easily removed. Most internal and external molds were assigned a one, but those which had no excess sediment and captured an exceptionally high amount of shell detail could score higher.
Representative specimens for the preservational categories utilized in this study. A, Shell completeness; B, pristineness of shell surface; and C, degree of lithification and dissolution. Maximum shell length and width are illustrated on one specimen in C. D, The “taphocube” shows the 27 distinct combinations of these three variables. Scale bars, 5 mm. Specimen images reproduced from Stephenson (Reference Stephenson1952; credit: U.S. Geological Survey).

Figure 3 Long description
Part A shows completeness, from C1 to C3. C1 shows a fossil snail that is missing the top half of the shell. C2 shows a fossil snail that is mostly complete, but the top ~25% of the shell is missing. C3 shows a fossil snail that is almost entirely complete. Part B shows pristineness, from P1 to P3. P1 shows a fossil snail where most of the outer surface details have been covered up with sediment. P2 shows a fossil snail where some surface details are present, but others have been covered by sediment. P3 shows a fossil snail where most surface details are present. Part C shows lithification & dissolution, from L1 to L3. L1 shows a fossil snail that is an internal mold. L2 shows a fossil snail that has retained its shell, but has its aperture filled with sediment. L3 shows a fossil snail that has retained its shell and has a clean aperture. On L2 perpendicular red lines cross the shell, to show how we measured maximum length and width. Part D shows a blank version of the "taphocube."
Our “lithification and dissolution” score is intended to describe aspects of lithification as well as shell dissolution. We assigned a score of three to non-moldic shells whose apertures were not filled with sediment; these fossils presumably came from the least lithified deposits, given that they were completely extracted and the matrix could be removed from the aperture. We assigned a score of two to non-molds with apertures filled by sedimentary matrix; such specimens were extracted from the matrix, but the matrix was sufficiently lithified that it could not easily be removed from the aperture. Molds were assigned a score of one (Fig. 3C), reflecting the combination of significant lithification and shell dissolution.
While diagenetic alteration does not follow a single simple gradient, this simplified scale provides a replicable method for roughly gauging the degree of diagenetic alteration in the absence of more detailed information. We expect that—on average—fossils with a score of three (aperture not filled) could be extracted from matrix more easily than fossils with a lithification score of two. Likewise, molds have suffered additional diagenetic alteration, and they present additional challenges in terms of collection, preparation, and identification. It is certainly likely that there are inaccuracies in how these categories are applied; for example, during specimen preparation, one might deliberately retain the sediment in the aperture of small and/or delicate specimens to help stabilize the specimen and lower the risk of breakage. However, these biases should apply to some extent to all time intervals, so they should not impede comparisons through time.
Our scoring system does not encompass all possible taphonomic pathways; for example, shells that were lost to dissolution before sediment lithification would not be included. We also could not distinguish recrystallized shells from photographs, so this factor was not considered explicitly. Likewise, we have not included categories for silicification or phosphatization, because these modes were not included in the dataset or analysis. However, one could include categories for these modes of preservation, particularly in an analysis of earlier time periods when silicification was more common.
Size Measurements
Maximum shell length and width were measured to the nearest 1/100th of a millimeter, using either digital calipers or the software program ImageJ (https://ij.imjoy.io/; Schneider et al. Reference Schneider, Rasband and Eliceiri2012). Length and width were measured perpendicular to each other (see example in Fig. 3C). Measurements were not extrapolated for broken shells. “Not in view” was recorded if a particular dimension was not visible. Given that no specimens were physically examined for this study, all measurements are reliant upon the accuracy of the available literature.
Analytical Methods
To visualize preservational quality in the data, we arranged our three variables into a 3D heat map (the “taphocube”; Fig. 3D). Each box of the cube represents a specific combination of values for our three semiquantitative metrics, which we refer to by combining the letter and number codes from Figure 3A–C (e.g., C3L3P3 stands for completeness = three, lithification = three, pristineness = three). For a small percentage of species occurrences, the aperture was not visible in any photograph, so we could not distinguish between a lithification score of two and three. For the heat maps, these specimens were distributed among these two lithification categories proportionate to their relative frequency in the rest of the dataset, but they were excluded from the size–frequency analyses.
For size–frequency analyses, we focused only on specimens with a completeness score of three, which encompasses the majority of the specimens in the dataset while avoiding the effects of shell breakage on body size. To simplify our size–frequency analyses and increase sample sizes, we later combined the nine preservational categories with a completeness of three (i.e., the nine boxes on the front face of the cube) into four simplified categories (“excellent” includes L3P3, “good” includes L2P3 and L3P2, “fair” includes L2P2 and L3P1, and “poor” includes all others). Although the nine categories could be combined in other ways, this approach combines categories with similar mean scores and maintains adequate sample sizes after dividing the data by epoch.
To examine body-size distributions, we calculated the base10 logarithm of the geometric mean of shell length and width. Data were analyzed and plotted using RStudio (R Core Team 2023) and the ggplot2 (Wickham Reference Wickham2016), divDyn (Kocsis et al. Reference Kocsis, Reddin, Alroy and Kiessling2019), tidyverse (Wickham et al. Reference Wickham, Averick, Bryan, Chang, McGowan, François and Grolemund2019), and viridis (Garnier et al. Reference Garnier, Ross, Rudis, Carmago, Sciaini and Scherer2024) packages.
Results
Preservational Quality
Most specimens were fairly complete, with 76.0% receiving a completeness score of three (Fig. 4). Lithification and pristineness values varied more, but most specimens received scores of two or three. Across all epochs, 38.2% of specimens scored a three for all preservation metrics (i.e., C3L3P3), representing the best preservation. However, preservational quality increased considerably through time, with the percentage of C3L3P3 specimens increasing from 20.1% in the Early Cretaceous to 54.5% in the Oligocene (Fig. 4). Conversely, the proportion of less well preserved specimens decreased through time.
Preservational quality through time, illustrated on the taphocube as the proportion of specimens in each preservational category in each epoch. Darker hues indicate greater proportions of specimens. A, Early Cretaceous; B, Late Cretaceous; C, Paleocene; D, Eocene; and E, Oligocene.

Figure 4 Long description
The "taphocube" is a cuboidal representation of preservational quality in the dataset. It consists of 27 boxes arranged into a cube, with the x-axis representing pristineness, the y-axis representing lithification, and the z-axis representing completeness. In all epochs the darkest box is at the top front right (C3L3P3), though it gets darker with progressing time. The second darkest box (C3L2P3) gets lighter with progressing time.
Body Size and Preservational Quality
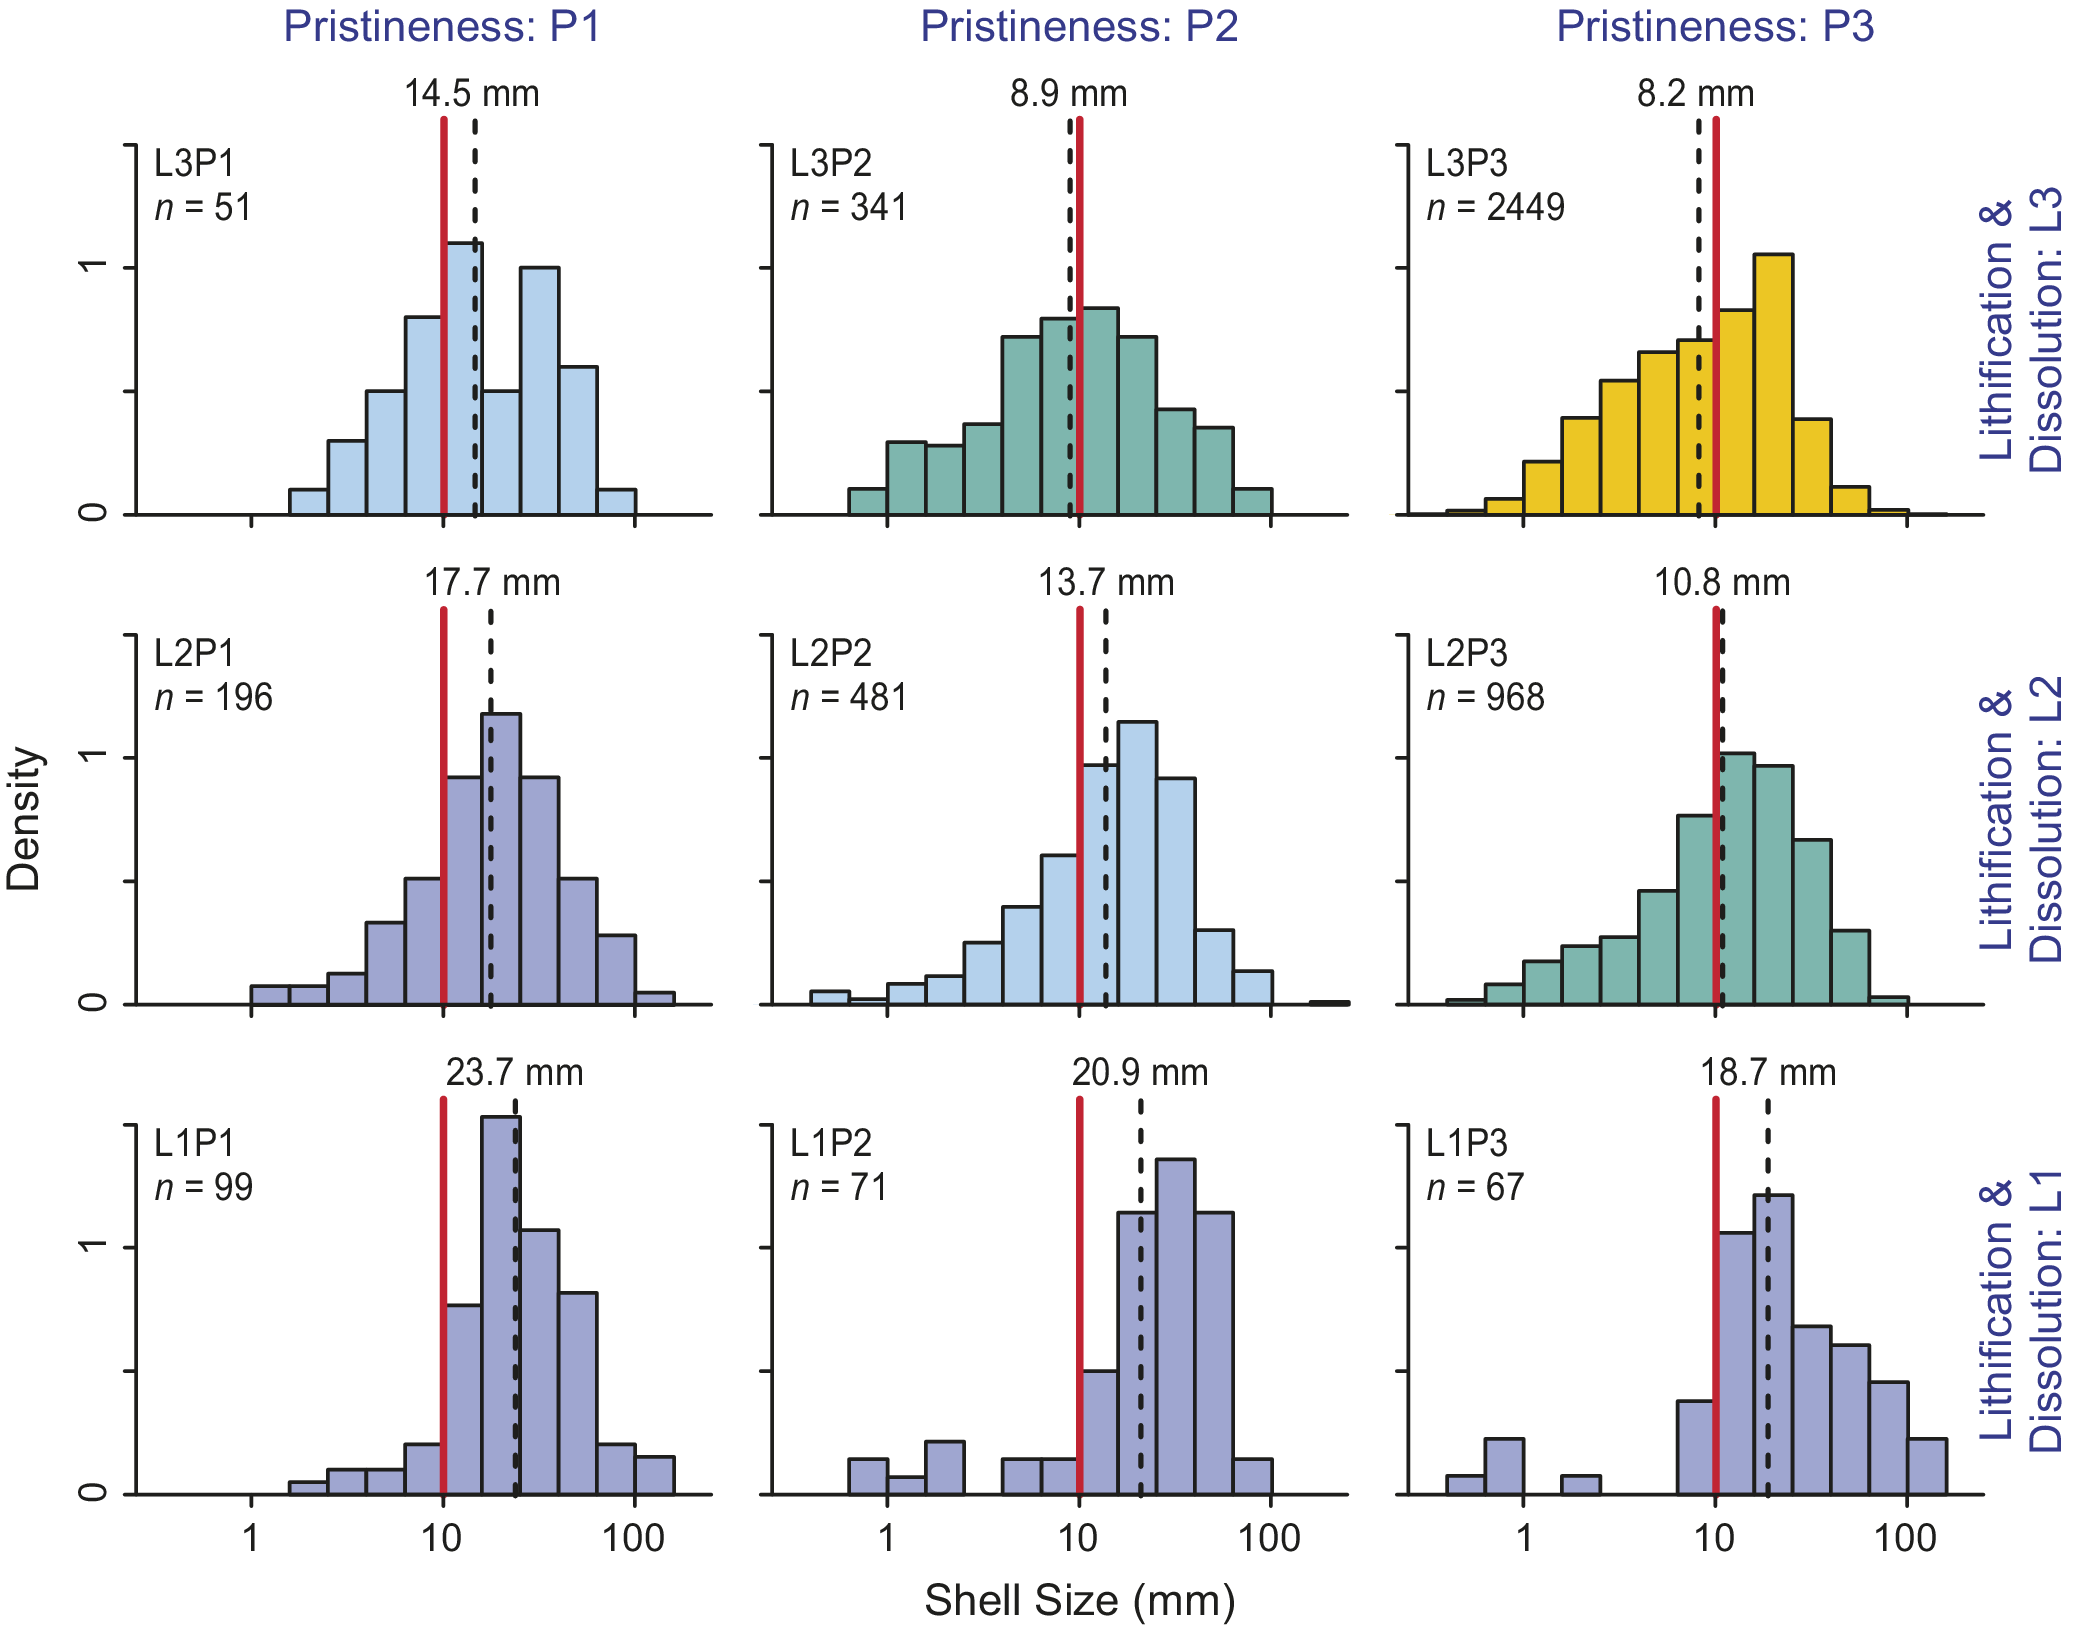
On the taphocube, nine categories represent all combinations of the three lithification and three pristineness values within the most complete specimens (Fig. 3D). In the aggregated data (all epochs combined), the best-preserved specimens (L3P3, upper right in Fig. 5) have the lowest mean size, and the worst-preserved specimens (L1P1, lower left in Fig. 5) have the highest mean. In particular, it appears that smaller specimens (<10 mm) become less common as preservational quality decreases.
Body-size histograms at logarithmic scale for all specimens from all epochs with a completeness score of three, separated by lithification and pristineness scores (i.e., the nine categories from the front face of the “taphocube” in Fig. 3D). Shell size was calculated as the geometric mean of length and width, and the red lines mark a value of 10 mm. Means (dashed black lines) were calculated on the logged data, although the values are reported in linear units for ease of interpretation. For further analyses, the purple categories were grouped as “poor” preservation, the blue categories as “fair” preservation, the green as “good” preservation, and the gold as “excellent” preservation (see text).

Figure 5 Long description
All 9 histograms represent completeness values of 3. The top row is L3, the middle row is L2, and the bottom row is L1. The lefthand column is P1, the middle column is P2, and the righthand column is P3. The bottom row is colored purple (poor preservation). The middle row is purple on the left, then blue (fair preservation) and then green (good preservation). The top row is blue on the left, then green, then gold (excellent preservation). Notably, the gold and green histograms look more evenly distributed than the blue histograms, which in turn look more evenly distributed than the purple histograms.
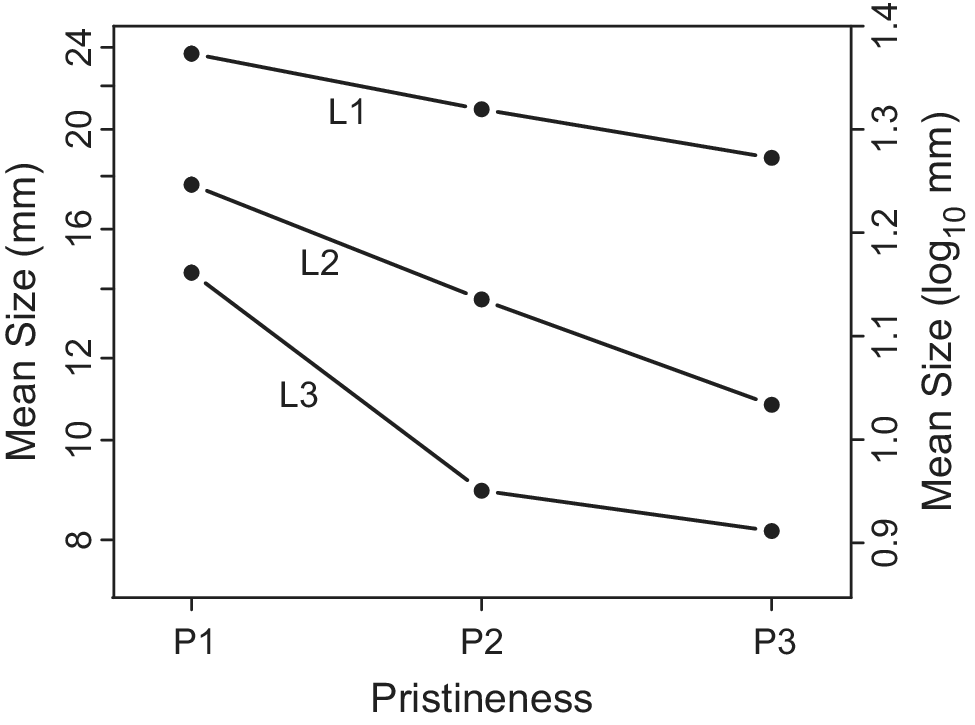
The mean size values from Figure 5 are plotted in Figure 6, indexed by pristineness and lithification scores. In all cases, mean size decreases as either pristineness or lithification score increases (Fig. 6).
Mean shell size for each combination of the pristineness and lithification metrics (from Fig. 5). Means calculated on the logged data.

Figure 6 Long description
Mean size is shown on the x-axis; in millimeters on the left and in a log10 scale on the right. The y-axis records pristineness values, from P1 to P3. There are three lines plotted - the top line represents L1 and the three points go downwards in a fairly regular fashion. The middle line represents L2 and shows a similar pattern to L1, with a more steeply negative slope. The bottom line represents L3 and features a steep drop from P1 to P2, with a less extreme drop from P2 to P3.
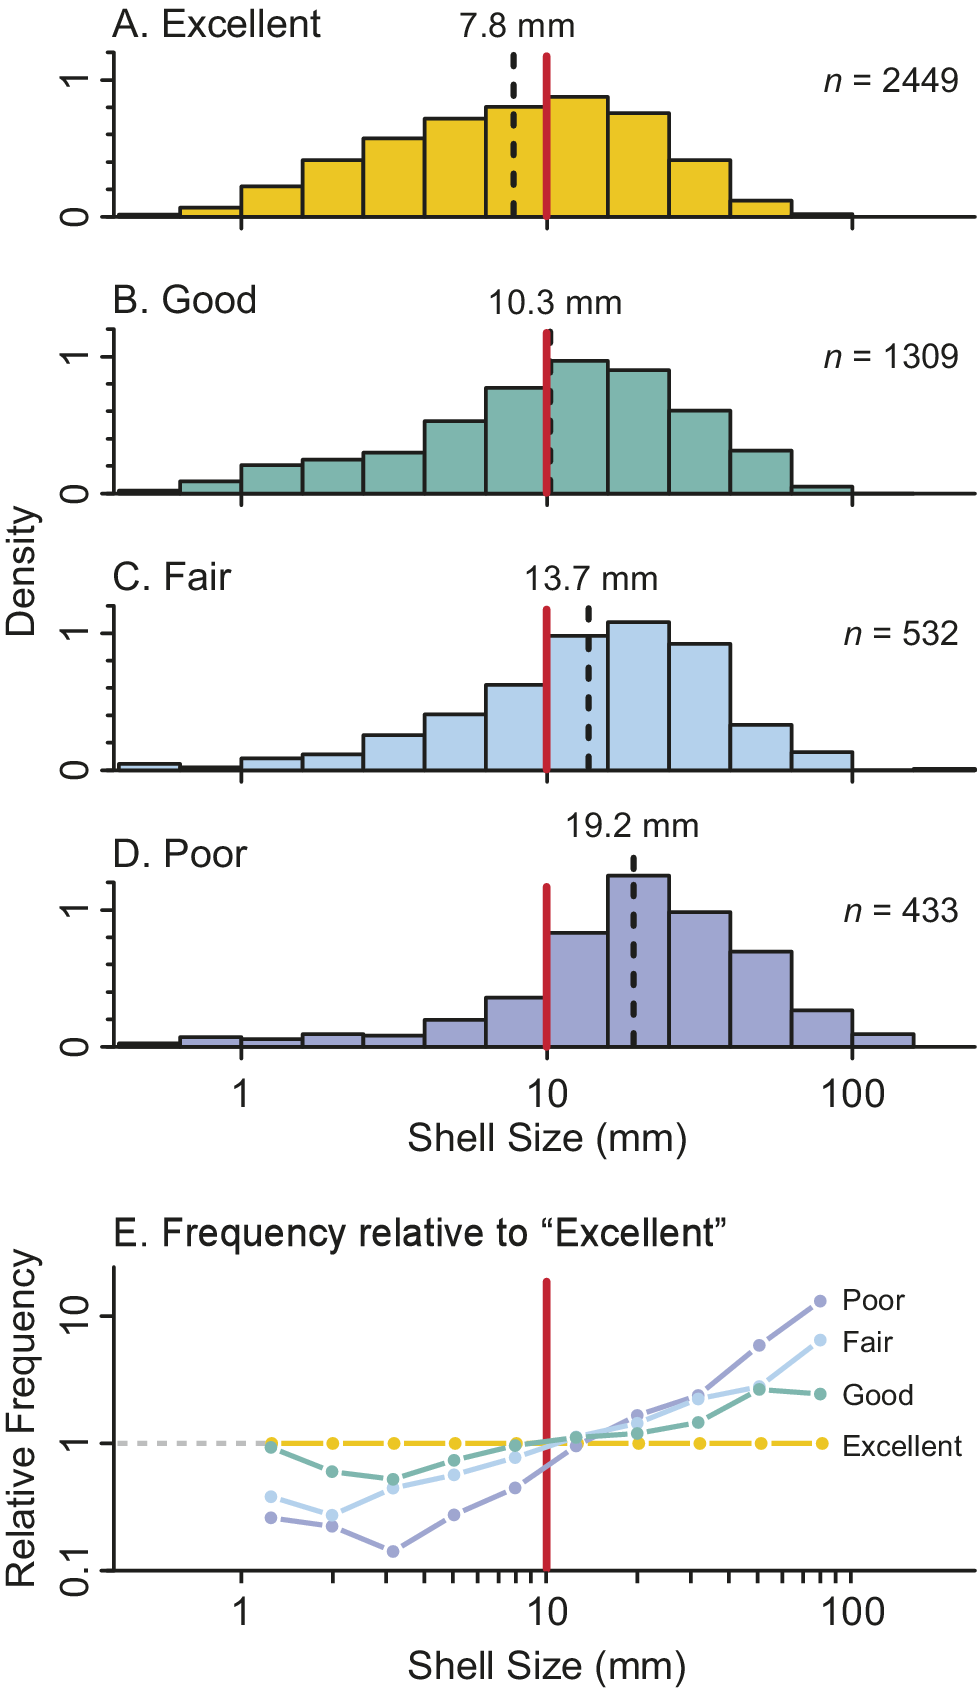
Using the simplified preservation categories, mean size increases as preservational quality declines (Fig. 7A–D); excellent specimens have a mean of 0.89 in log10 units (7.8 mm when converted to linear units), whereas poor specimens have a mean of 1.28 (19.2 mm). Likewise, specimens smaller than 10 mm are increasingly underrepresented as preservation declines, whereas large specimens become overrepresented; notably, specimens larger than 100 mm are unusually common in the poorly preserved material.
Effect of preservational quality on gastropod body-size distributions in the full dataset (all epochs combined). A, Excellent preservation; B, good preservation; C, fair preservation; and D, poor preservation. Shell size refers to the geometric mean of a shell’s length and width. The red lines mark a size of 10 mm. Means (dashed black lines) were calculated on the logged data, although the values are reported in linear units for ease of interpretation. E, Over- or underrepresentation of different size classes relative to their frequency in the excellently preserved material. Values above the horizontal line at y = 1.0 indicate that a size class is overrepresented, and values below the line indicate that it is underrepresented. Plot generated by dividing the frequency of each size class in the poor (or fair, or good) material by the frequency of that same size class in the excellent material and plotting values against the midpoints of the histogram bins.

Figure 7 Long description
The histograms are similar in shape, but values are pushed towards the right as preservational quality gets worse. Shell size is on the x-axis and density is on the y-axis. In part E, shell size on a log10 scale is shown on the x-axis, and relative frequency is shown on the y-axis. There is a horizontal grey line at 1.0, and a horizontal gold line to represent the excellently preserved specimens. Green, blue, and purple lines cross the horizontal line at different points. The green line crosses the horizontal line at a lower value than the blue line, which crosses at a lower value than the purple line.
To assess changes in the frequency of fossils in each size class (Fig. 7E), the frequency of specimens in each size bin in each histogram was divided by the frequency of that size class in the excellently preserved material (i.e., in Fig. 7A). Assuming that the size–frequency distributions were originally similar for all preservational categories, then this approach shows the degree to which a particular size class is over- or underrepresented in the literature as preservational quality declines (Fig. 7E). As preservation decreases from excellent to good to fair to poor, small specimens become increasingly underrepresented and large specimens become increasingly overrepresented. The crossover point between under- and overrepresentation is fairly consistent, ranging from ~9 mm for good preservation to ~14 mm for poor preservation. Shells less than ~5 mm have the greatest degree of underrepresentation.
Patterns through Time
When all specimens are included regardless of preservational condition, mean body size fluctuates through time (Fig. 8A). However, in all epochs, average body size increases as preservational quality declines (Fig. 8B), and the proportion of specimens smaller than 10 mm decreases (Fig. 8C).
Gastropod body size through the Cretaceous and Paleogene. A, Mean body size, all preservational categories combined (means calculated on logged data). Pie charts indicate the proportional abundance of each preservational category in each epoch. B, Mean body size, preservational categories separated. C, Proportion of specimens less than 10 mm in size, preservational categories separated. Error bars on A and B mark 95% confidence intervals around mean values.

Figure 8 Long description
Part A is a line graph showing mean body size through time. The line rises in the Late Cretaceous, then drops in the Paleogene. There are also pie charts showing how preservational quality has changed through time; over time a greater piece of the pie chart becomes gold, while the proportions of blue and purple shrink. The proportion of green stays approximately the same. Part B shows the same line graph as A, but split into different lines that represent our preservational categories. Points on the gold line are lower than points on the green line, which are lower than points on the blue line, which are lower than points on the blue line. Part C is another series of line graphs showing the proportion of specimens <10mm through time, split by preservational quality. The gold line shows a higher percentage than the green line, which is higher than the blue line, which is higher than the purple line.
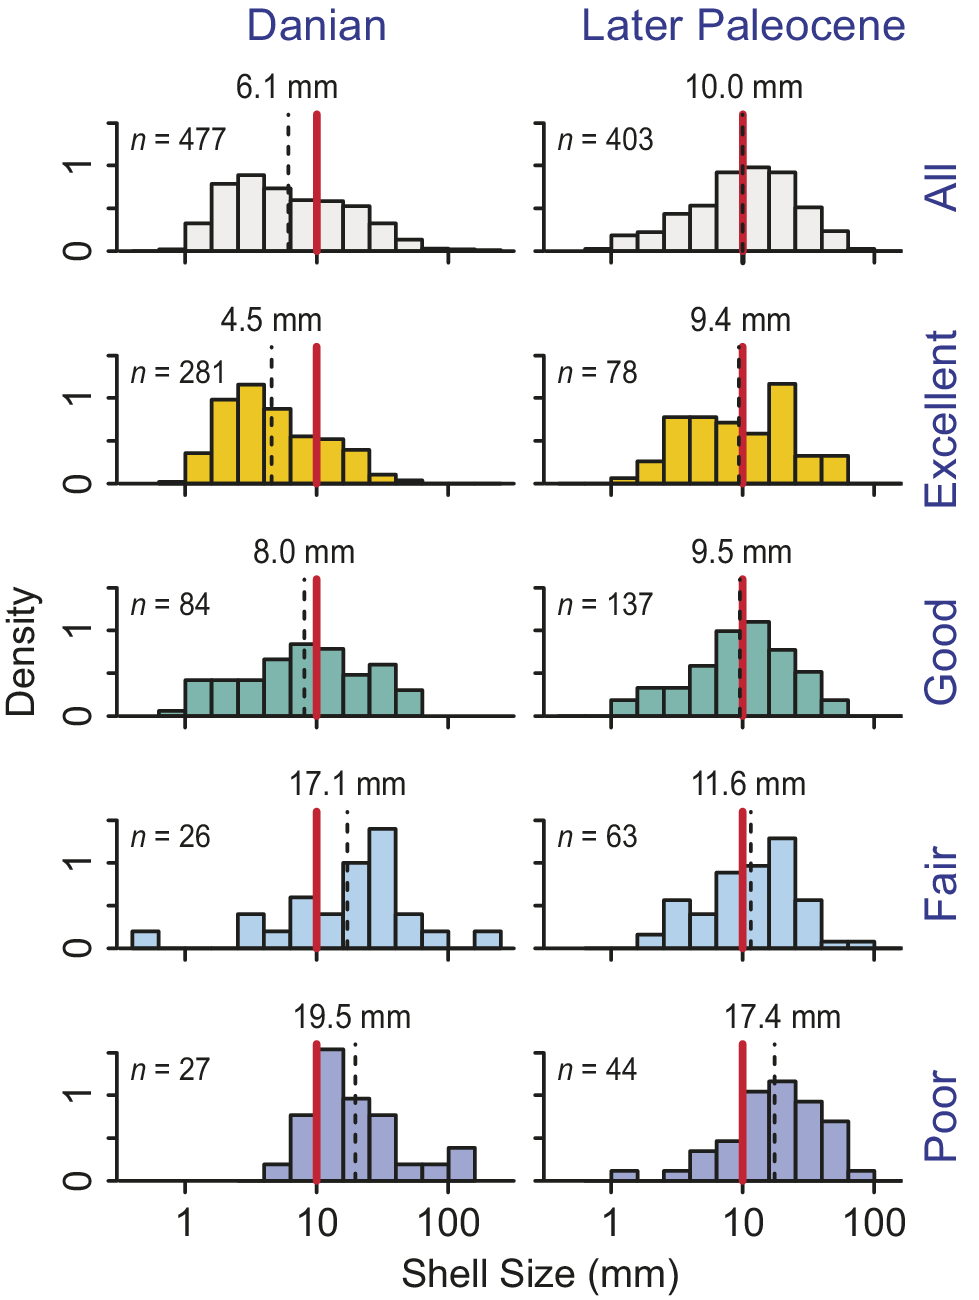
In the excellently preserved material, mean size and the proportion of specimens <10 mm both fluctuate through time with no apparent trend (Fig. 8B,C). The other preservation categories also fail to show clear trends through time, although some details differ from the excellent material. For example, mean size decreases from the Eocene to the Oligocene when preservation is good or excellent, but increases when it is poor or fair (Fig. 8B). Similarly, in the excellent material, mean body size declines from the Late Cretaceous to the Paleocene, then rises in the Eocene (Fig. 8B), and the proportion of shells less than 10 mm also peaks in the Paleocene (Fig. 8C). This pattern is greatly muted in the fair and poor material. Splitting the Paleocene data into the Danian (66.0–61.66 Ma) and the later Paleocene (Selandian and Thanetian; 61.66–56.0 Ma) also reveals that smaller specimens were only particularly abundant in the excellent material in the Danian (Fig. 9).
Body-size histograms of Paleocene specimens with a completeness of three, with the Danian separated from the later Paleocene (Selandian and Thanetian). Shell size refers to the geometric mean of length and width. The red lines mark a size of 10 mm. Means (dashed black lines) were calculated on the logged data, although the values are reported in linear units for ease of interpretation.

Figure 9 Long description
Shell size is on the x-axis in millimeters, while density is on the y-axis. For the grey (all) and gold (excellent) histograms, sizes are noticeably smaller in the Danian compared to the Later Paleocene. For the blue (fair) and purple (poor) histograms, the Danian has means that are larger than the Later Paleocene.
Excellently preserved material became more common through time, whereas poor- and fair-quality preservation became less common (pie charts in Fig. 8A). Good-quality preservation declined slightly.
Taxonomic Identifiability
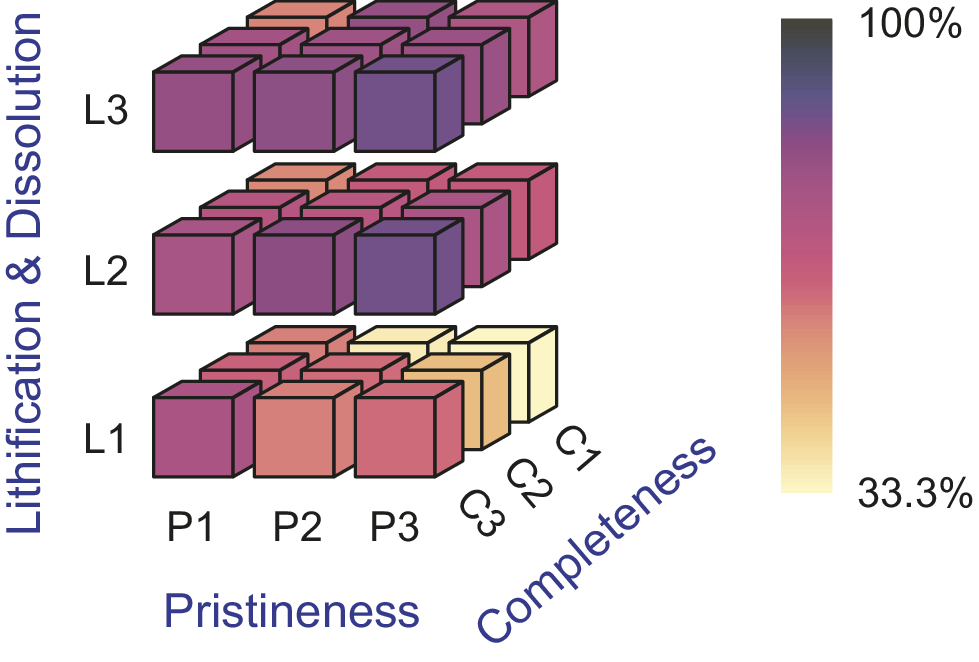
Of the 7836 specimens included in this study, 1475 were either unidentified at the species level or only provisionally identified. Typically, a high degree of lithification/dissolution (particularly mold status, L1) or low completeness are associated with a higher percentage of uncertain species identifications (Fig. 10). The category C1L1P3 had the lowest percentage of specimens identified to the species level, at 33.3%. Conversely, complete specimens with high to medium scores for lithification and pristineness (L2 or L3, P2 or P3) had the highest percentage of specimens that were confidently identified to the species level (maximum = 86.3% for C3L2P3 and C3L3P3).
Percentage of specimens that were identified to the species level. All epochs combined.

Figure 10 Long description
The darkest boxes are in the top two rows of the front face of the cube. In particular, the top front right and the middle front right are darkest. The lightest boxes are on the back of the bottom face.
Discussion
Body Size and Preservational Quality
Our simple scorings for preservational quality reveal a strong relationship with gastropod body-size distributions (Figs. 5, 6). For complete specimens, an increase in either the lithification or pristineness score results in a decrease in mean fossil size, with the two metrics having additive effects. These results support the previous statements that preservational status impacts biodiversity assessments by selectively removing or concealing smaller specimens (e.g., Cooper et al. Reference Cooper, Maxwell, Crampton, Beu, Jones and Marshall2006; Kowalewski et al. Reference Kowalewski, Kiessling, Aberhan, Fürsich, Scarponi, Wood and Hoffmeister2006; Sessa et al. Reference Sessa, Patzkowsky and Bralower2009; Hendy Reference Hendy2011; Karapunar et al. Reference Karapunar, Nützel, Seuss and Mapes2022). They also suggest that our assessments of preservational quality from illustrations provide useful information, although not as much as would be available in field- and specimen-based studies.
Prior specimen-based studies indicate that mollusk shells under ~5 mm in size are most vulnerable to diagenetic loss (Cooper et al. Reference Cooper, Maxwell, Crampton, Beu, Jones and Marshall2006; Sessa et al. Reference Sessa, Patzkowsky and Bralower2009; Finnegan et al. Reference Finnegan, McClain, Kosnik and Payne2011; Hendy Reference Hendy2011; Nawrot Reference Nawrot2012; Sanders et al. Reference Sanders, Merle and Villier2015; Daley and Bush Reference Daley and Bush2020). Our analysis suggests that poorly preserved specimens in this size class are indeed underrepresented in the paleontological literature, but we also find that shells up to 14 mm are less likely to be reported (Fig. 7E). This finding may reflect differences in methodology; previous specimen-based studies may have only identified and quantified biases introduced by fossilization and diagenesis, whereas literature data are also affected by other processes that have the potential to affect fossil size distribution, such as paleontologists’ decisions on which fossils to collect, prepare, describe, and illustrate. The extra time and effort needed to work with small specimens from lithified sediments may discourage interest when “easier” fossils are available (Sessa et al. Reference Sessa, Patzkowsky and Bralower2009; Hendy Reference Hendy2011; Daley and Bush Reference Daley and Bush2020; Edie et al. Reference Edie, Collins and Jablonski2023).
However, biases introduced by paleontological interest and methods are not fixed, and paleontologists have worked hard to overcome them in recent decades with improved collection methods and increased focus on small species. The effects of these efforts can be seen by comparing our data with older compilations; we do not observe a dramatic increase in small gastropods reported from the Cretaceous to the Paleogene (Fig. 8), in contrast with Heim et al.’s (Reference Heim, Knope, Schaal, Wang and Payne2015) data (Fig. 1B), which were based on compilations published in the 1930s and 1960s (Wenz Reference Wenz and Schindewolf1938; Knight et al. Reference Knight, Keen, Moore, Yonge, Batten, Robertson, Cox, Ludbrook, Yochelson and Smith1960).
Given the number of preservational and methodological filters that can affect body-size distributions, the excellently preserved material is probably not a perfect representation of either the living community or the preserved fossil record. For example, small, excellently preserved fossils may simply be ignored in some studies (particularly older studies). However, our results support the idea that small fossils are, at the least, more likely to be studied in excellently preserved material (cf. Cooper et al. Reference Cooper, Maxwell, Crampton, Beu, Jones and Marshall2006; Hawkins et al. Reference Hawkins, Kowalewski and Xiao2018).
Declining preservational quality is associated with undersampling of small gastropods in all epochs of the Cretaceous and Paleogene (Fig. 8B,C). However, the strength of the effect appears to vary slightly among time intervals; for example, preservational condition has relatively less effect on size for the Late Cretaceous and Eocene. The causes of this variation are not known.
Trends in Body Size
Changes through time in average preservational condition impart only a minor bias in the measurement of body-size trends in these data. When all preservational classes are combined (Fig. 8A), the temporal trend in mean shell size is fairly similar to that seen in the excellently preserved material (Fig. 8B). However, in the combined data (Fig. 8A), the Cretaceous points are shifted slightly higher relative to the Paleogene points, reflecting the greater contribution of fair and poor material.
The decline in mean body size from the Late Cretaceous to the Danian, most obvious in the well-preserved material (Figs. 8, 9), is consistent with similar size reductions observed in other groups at this time (e.g., Jablonski Reference Jablonski, Jablonski, Erwin and Lipps1996; Gardin and Monechi Reference Gardin and Monechi1998; Lockwood Reference Lockwood2005; Keller and Abramovich Reference Keller and Abramovich2009; Łaska et al. Reference Łaska, Rodríguez-Tovar and Uchman2017; Wiest et al. Reference Wiest, Lukens, Peppe, Driese and Tubbs2018). However, we have not investigated this question in detail.
Implications for Diversity Analysis
In these data, the average preservational quality of gastropods improves substantially between the Early Cretaceous and Oligocene, with a notable shift from the Cretaceous to the Paleogene (Fig. 4). Given that small species are undersampled as preservation declines, these results support suggestions that secular trends in preservation likely complicate the measurement of diversity trends in gastropods, and possibly other taxa as well (Kowalewski Reference Kowalewski, Copper and Jisuo1996; Cooper et al. Reference Cooper, Maxwell, Crampton, Beu, Jones and Marshall2006; Kowalewski et al. Reference Kowalewski, Kiessling, Aberhan, Fürsich, Scarponi, Wood and Hoffmeister2006; Sessa et al. Reference Sessa, Patzkowsky and Bralower2009; Finnegan et al. Reference Finnegan, McClain, Kosnik and Payne2011; Hendy Reference Hendy2011; Nawrot Reference Nawrot2012; Sanders et al. Reference Sanders, Merle and Villier2015; Hawkins et al. Reference Hawkins, Kowalewski and Xiao2018; Daley and Bush Reference Daley and Bush2020). A number of authors have suggested that preservational biases have limited effects on global diversity patterns, even if they may strongly affect local studies of diversity, but the exact magnitude of this bias is not known (Bush and Bambach Reference Bush and Bambach2004; Kidwell Reference Kidwell2005; Kowalewski et al. Reference Kowalewski, Kiessling, Aberhan, Fürsich, Scarponi, Wood and Hoffmeister2006; Cherns et al. Reference Cherns, Wheeley and Wright2008; Hawkins et al. Reference Hawkins, Kowalewski and Xiao2018). Notably, the apparently strong effects of pristineness and lithification on body size suggest that declining preservational quality may have a predictable relationship with biased inferences of diversity in gastropods.
A similar approach could be applied to other types of fossils, although the details of the method might need to be modified. Most obviously, bivalves could be examined in a similar manner, and one might predict that aragonitic bivalves should show similar relationships between preservation and body size, as well as similar trends through time in preservational quality. Analyses of other taxa, such as those with multipart skeletons, could incorporate other relevant taphonomic information (e.g., Brown et al. Reference Brown, Campione, Mantilla and Evans2022). As noted earlier, the system used here for evaluating taphonomy would have to be expanded to extend the analysis to time periods in which modes of preservation like silicification are common.
Taxonomic Identifiability
Lithification and other diagenetic processes may destroy fine morphologies unique to species, decreasing specimen identifiability; shells from lithified sediments, when preserved, are generally less reliably and/or more superficially identified (Koch and Sohl Reference Koch and Sohl1983; Kidwell Reference Kidwell2005; Cherns and Wright Reference Cherns and Wright2009; Sessa et al. Reference Sessa, Patzkowsky and Bralower2009; Hendy Reference Hendy2011; Hausmann and Nützel Reference Hausmann and Nützel2015; Hawkins et al. Reference Hawkins, Kowalewski and Xiao2018; Edie et al. Reference Edie, Collins and Jablonski2023). In our data, unsurprisingly, decreased quality of preservation is indeed associated with a lack of taxonomic identifiability (Fig. 10). Molds (L1) are particularly challenging to identify to a low taxonomic level (Nawrot Reference Nawrot2012; Foote et al. Reference Foote, Crampton, Beu and Nelson2015), but breakage or a loss of surface detail (i.e., lower scores for completeness or pristineness) can also impede precise identification (e.g., Kidwell et al. Reference Kidwell, Rothfus and Best2001; Rothfus Reference Rothfus2005).
Conclusions
It is widely recognized that variation in preservational quality can affect the observed biodiversity of a fossil assemblage and widely considered that secular trends in preservation can affect observed biodiversity history. Here, we have examined the published literature on Cretaceous and Paleogene gastropods to better understand the effects of preservational biases such as lithification. Our results include the following:
-
1. Average preservational quality increased from the Cretaceous to the Paleogene. In particular, the average pristineness of shell surfaces increased, and there was less evidence of lithification and dissolution.
-
2. Gastropod body-size distributions vary with preservational quality in the paleontological literature. A decrease in preservation from “excellent” to “good” was associated with the underrepresentation of shells smaller than 9 mm, and a further decrease to “poor” preservation was associated with the underrepresentation of shells smaller than 14 mm.
-
3. When preservation is held constant, mean gastropod body size fluctuates without trend during the Cretaceous and Paleogene.
-
4. Small shells are extremely common in the excellently preserved Danian material.
-
5. Shells with the most severe lithification/dissolution (particularly internal/external molds) and poorest completeness tended to be more difficult to identify to the species level. More than 85% of shells with very high preservation quality (C3L2P3 and C3L3P3) were identified to the species level, whereas less than half of specimens with the worst preservation (e.g., incomplete molds) were identified to species level.
-
6. The semiquantitative metrics used to describe gastropod preservation had a strong relationship with mean gastropod body size, suggesting that preservational quality may have predictable effects on observed size distributions. More generally, our results suggest that these metrics, while simple, can provide a useful tool for better understanding secular trends in preservation.
Taken together, our results support the contention that preservational biases do affect inferred biodiversity patterns in fossil gastropods. On a positive note, the relationship between body size and preservation documented here may provide opportunities for more precise quantitative estimates of these effects.
Data Availability Statement
All supplementary datasets are available from the Dryad Digital Repository (https://doi.org/10.5061/dryad.t76hdr8gd). Additional Supplementary Material (including an R script file, citations of all literature used in the collection of the dataset, and a Supplementary Table of the number of species in each element of the taphocube in Fig. 4) are archived through Zenodo: https://doi.org/10.5281/zenodo.20172408; https://doi.org/10.5281/zenodo.20172409.
Acknowledgments
We acknowledge the many paleontologists whose work collecting and documenting fossil gastropods made this analysis possible. Thanks to T. D. Frank, J. N. Caira, S. K. Brisson, I. Justice, D. H. Goldstein, and J. P. Kerr for their helpful comments and suggestions. For thoughtful reviews of the manuscript, our thanks to Associate Editor A. Tomašových, A. Hendy, B. Karapunar, and two anonymous reviewers.
Competing Interests
The authors declare no competing interests.




 Open access

