


%20--%3e%3c!DOCTYPE%20svg%20PUBLIC%20'-//W3C//DTD%20SVG%201.0//EN'%20'http://www.w3.org/TR/2001/REC-SVG-20010904/DTD/svg10.dtd'%3e%3csvg%20version='1.0'%20id='Layer_1'%20xmlns='http://www.w3.org/2000/svg'%20xmlns:xlink='http://www.w3.org/1999/xlink'%20x='0px'%20y='0px'%20width='64px'%20height='64px'%20viewBox='5.5%20-3.5%2064%2064'%20enable-background='new%205.5%20-3.5%2064%2064'%20xml:space='preserve'%3e%3cg%3e%3ccircle%20fill='%23FFFFFF'%20fill-opacity='0'%20cx='37.785'%20cy='28.501'%20r='28.836'/%3e%3cpath%20fill='%23595959'%20d='M37.441-3.5c8.951,0,16.572,3.125,22.857,9.372c3.008,3.009,5.295,6.448,6.857,10.314%20c1.561,3.867,2.344,7.971,2.344,12.314c0,4.381-0.773,8.486-2.314,12.313c-1.543,3.828-3.82,7.21-6.828,10.143%20c-3.123,3.085-6.666,5.448-10.629,7.086c-3.961,1.638-8.057,2.457-12.285,2.457s-8.276-0.808-12.143-2.429%20c-3.866-1.618-7.333-3.961-10.4-7.027c-3.067-3.066-5.4-6.524-7-10.372S5.5,32.767,5.5,28.5c0-4.229,0.809-8.295,2.428-12.2%20c1.619-3.905,3.972-7.4,7.057-10.486C21.08-0.394,28.565-3.5,37.441-3.5z%20M37.557,2.272c-7.314,0-13.467,2.553-18.458,7.657%20c-2.515,2.553-4.448,5.419-5.8,8.6c-1.354,3.181-2.029,6.505-2.029,9.972c0,3.429,0.675,6.734,2.029,9.913%20c1.353,3.183,3.285,6.021,5.8,8.516c2.514,2.496,5.351,4.399,8.515,5.715c3.161,1.314,6.476,1.971,9.943,1.971%20c3.428,0,6.75-0.665,9.973-1.999c3.219-1.335,6.121-3.257,8.713-5.771c4.99-4.876,7.484-10.99,7.484-18.344%20c0-3.543-0.648-6.895-1.943-10.057c-1.293-3.162-3.18-5.98-5.654-8.458C50.984,4.844,44.795,2.272,37.557,2.272z%20M37.156,23.187%20l-4.287,2.229c-0.458-0.951-1.019-1.619-1.685-2c-0.667-0.38-1.286-0.571-1.858-0.571c-2.856,0-4.286,1.885-4.286,5.657%20c0,1.714,0.362,3.084,1.085,4.113c0.724,1.029,1.791,1.544,3.201,1.544c1.867,0,3.181-0.915,3.944-2.743l3.942,2%20c-0.838,1.563-2,2.791-3.486,3.686c-1.484,0.896-3.123,1.343-4.914,1.343c-2.857,0-5.163-0.875-6.915-2.629%20c-1.752-1.752-2.628-4.19-2.628-7.313c0-3.048,0.886-5.466,2.657-7.257c1.771-1.79,4.009-2.686,6.715-2.686%20C32.604,18.558,35.441,20.101,37.156,23.187z%20M55.613,23.187l-4.229,2.229c-0.457-0.951-1.02-1.619-1.686-2%20c-0.668-0.38-1.307-0.571-1.914-0.571c-2.857,0-4.287,1.885-4.287,5.657c0,1.714,0.363,3.084,1.086,4.113%20c0.723,1.029,1.789,1.544,3.201,1.544c1.865,0,3.18-0.915,3.941-2.743l4,2c-0.875,1.563-2.057,2.791-3.541,3.686%20c-1.486,0.896-3.105,1.343-4.857,1.343c-2.896,0-5.209-0.875-6.941-2.629c-1.736-1.752-2.602-4.19-2.602-7.313%20c0-3.048,0.885-5.466,2.658-7.257c1.77-1.79,4.008-2.686,6.713-2.686C51.117,18.558,53.938,20.101,55.613,23.187z'/%3e%3c/g%3e%3c/svg%3e)
%20--%3e%3c!DOCTYPE%20svg%20PUBLIC%20'-//W3C//DTD%20SVG%201.0//EN'%20'http://www.w3.org/TR/2001/REC-SVG-20010904/DTD/svg10.dtd'%3e%3csvg%20version='1.0'%20id='Layer_1'%20xmlns='http://www.w3.org/2000/svg'%20xmlns:xlink='http://www.w3.org/1999/xlink'%20x='0px'%20y='0px'%20width='64px'%20height='64px'%20viewBox='5.5%20-3.5%2064%2064'%20enable-background='new%205.5%20-3.5%2064%2064'%20xml:space='preserve'%3e%3cg%3e%3ccircle%20fill='%23FFFFFF'%20fill-opacity='0'%20cx='37.637'%20cy='28.806'%20r='28.276'/%3e%3cg%3e%3cpath%20fill='%23595959'%20d='M37.443-3.5c8.988,0,16.57,3.085,22.742,9.257C66.393,11.967,69.5,19.548,69.5,28.5c0,8.991-3.049,16.476-9.145,22.456%20C53.879,57.319,46.242,60.5,37.443,60.5c-8.649,0-16.153-3.144-22.514-9.43C8.644,44.784,5.5,37.262,5.5,28.5%20c0-8.761,3.144-16.342,9.429-22.742C21.101-0.415,28.604-3.5,37.443-3.5z%20M37.557,2.272c-7.276,0-13.428,2.553-18.457,7.657%20c-5.22,5.334-7.829,11.525-7.829,18.572c0,7.086,2.59,13.22,7.77,18.398c5.181,5.182,11.352,7.771,18.514,7.771%20c7.123,0,13.334-2.607,18.629-7.828c5.029-4.838,7.543-10.952,7.543-18.343c0-7.276-2.553-13.465-7.656-18.571%20C50.967,4.824,44.795,2.272,37.557,2.272z%20M46.129,20.557v13.085h-3.656v15.542h-9.944V33.643h-3.656V20.557%20c0-0.572,0.2-1.057,0.599-1.457c0.401-0.399,0.887-0.6,1.457-0.6h13.144c0.533,0,1.01,0.2,1.428,0.6%20C45.918,19.5,46.129,19.986,46.129,20.557z%20M33.042,12.329c0-3.008,1.485-4.514,4.458-4.514s4.457,1.504,4.457,4.514%20c0,2.971-1.486,4.457-4.457,4.457S33.042,15.3,33.042,12.329z'/%3e%3c/g%3e%3c/g%3e%3c/svg%3e)
%20--%3e%3c!DOCTYPE%20svg%20PUBLIC%20'-//W3C//DTD%20SVG%201.0//EN'%20'http://www.w3.org/TR/2001/REC-SVG-20010904/DTD/svg10.dtd'%3e%3csvg%20version='1.0'%20id='Layer_1'%20xmlns='http://www.w3.org/2000/svg'%20xmlns:xlink='http://www.w3.org/1999/xlink'%20x='0px'%20y='0px'%20width='64px'%20height='64px'%20viewBox='5.5%20-3.5%2064%2064'%20enable-background='new%205.5%20-3.5%2064%2064'%20xml:space='preserve'%3e%3cg%3e%3ccircle%20fill='%23FFFFFF'%20fill-opacity='0'%20cx='36.924'%20cy='28.403'%20r='28.895'/%3e%3cpath%20fill='%23595959'%20d='M37.442-3.5c8.99,0,16.571,3.085,22.743,9.256C66.393,11.928,69.5,19.509,69.5,28.5c0,8.992-3.048,16.476-9.145,22.458%20C53.88,57.32,46.241,60.5,37.442,60.5c-8.686,0-16.19-3.162-22.513-9.485C8.644,44.728,5.5,37.225,5.5,28.5%20c0-8.762,3.144-16.343,9.429-22.743C21.1-0.414,28.604-3.5,37.442-3.5z%20M12.7,19.872c-0.952,2.628-1.429,5.505-1.429,8.629%20c0,7.086,2.59,13.22,7.77,18.4c5.219,5.144,11.391,7.715,18.514,7.715c7.201,0,13.409-2.608,18.63-7.829%20c1.867-1.79,3.332-3.657,4.398-5.602l-12.056-5.371c-0.421,2.02-1.439,3.667-3.057,4.942c-1.622,1.276-3.535,2.011-5.744,2.2%20v4.915h-3.714v-4.915c-3.543-0.036-6.782-1.312-9.714-3.827l4.4-4.457c2.094,1.942,4.476,2.913,7.143,2.913%20c1.104,0,2.048-0.246,2.83-0.743c0.78-0.494,1.172-1.312,1.172-2.457c0-0.801-0.287-1.448-0.858-1.943l-3.085-1.315l-3.771-1.715%20l-5.086-2.229L12.7,19.872z%20M37.557,2.214c-7.276,0-13.428,2.571-18.457,7.714c-1.258,1.258-2.439,2.686-3.543,4.287L27.786,19.7%20c0.533-1.676,1.542-3.019,3.029-4.028c1.484-1.009,3.218-1.571,5.2-1.686V9.071h3.715v4.915c2.934,0.153,5.6,1.143,8,2.971%20l-4.172,4.286c-1.793-1.257-3.619-1.885-5.486-1.885c-0.991,0-1.876,0.191-2.656,0.571c-0.781,0.381-1.172,1.029-1.172,1.943%20c0,0.267,0.095,0.533,0.285,0.8l4.057,1.83l2.8,1.257l5.144,2.285l16.397,7.314c0.535-2.248,0.801-4.533,0.801-6.857%20c0-7.353-2.552-13.543-7.656-18.573C51.005,4.785,44.831,2.214,37.557,2.214z'/%3e%3c/g%3e%3c/svg%3e)
%20--%3e%3c!DOCTYPE%20svg%20PUBLIC%20'-//W3C//DTD%20SVG%201.1//EN'%20'http://www.w3.org/Graphics/SVG/1.1/DTD/svg11.dtd'%3e%3csvg%20version='1.1'%20id='Layer_1'%20xmlns='http://www.w3.org/2000/svg'%20xmlns:xlink='http://www.w3.org/1999/xlink'%20x='0px'%20y='0px'%20width='64.000977px'%20height='64px'%20viewBox='0%200%2064.000977%2064'%20enable-background='new%200%200%2064.000977%2064'%20xml:space='preserve'%3e%3cg%3e%3ccircle%20fill='%23FFFFFF'%20fill-opacity='0'%20cx='32.064453'%20cy='31.788086'%20r='29.012695'/%3e%3cg%3e%3cpath%20fill='%23595959'%20d='M31.943848,0C40.896484,0,48.476562,3.105469,54.6875,9.314453C60.894531,15.486328,64.000977,23.045898,64.000977,32%20s-3.048828,16.457031-9.145508,22.513672C48.417969,60.837891,40.779297,64,31.942871,64%20c-8.648926,0-16.152832-3.142578-22.513672-9.429688C3.144043,48.286133,0,40.761719,0,32.000977%20c0-8.723633,3.144043-16.285156,9.429199-22.68457C15.640137,3.105469,23.14502,0,31.943848,0z%20M32.060547,5.771484%20c-7.275391,0-13.429688,2.570312-18.458496,7.714844C8.381836,18.783203,5.772949,24.954102,5.772949,32%20c0,7.125,2.589844,13.256836,7.77002,18.400391c5.181152,5.181641,11.352051,7.770508,18.515625,7.770508%20c7.123047,0,13.332031-2.608398,18.626953-7.828125C55.713867,45.466797,58.228516,39.353516,58.228516,32%20c0-7.3125-2.553711-13.484375-7.65625-18.513672C45.504883,8.341797,39.333984,5.771484,32.060547,5.771484z%20M44.117188,24.456055%20v5.485352H20.859863v-5.485352H44.117188z%20M44.117188,34.743164v5.481445H20.859863v-5.481445H44.117188z'/%3e%3c/g%3e%3c/g%3e%3c/svg%3e)
Introduction
Hospital antimicrobial stewardship programs (ASPs) are a key strategy in addressing antibiotic overuse and the growing threat of antimicrobial resistance. Since 2013, antimicrobial stewardship has been an accreditation requirement in Canada for inpatient healthcare institutions. 1 Around the same time, the CDC released its Core Elements framework, which defined essential program components such as leadership commitment, accountability, and drug expertise. 2 Since then, the antimicrobial stewardship landscape has evolved, shifting away from localized adoption of interventions to a focus on improving program impact and integration into broader system-level efforts such as benchmarking. Reference Cosgrove and Srinivasan3 This is aligned with updated guidance from the CDC, which emphasizes formalized stewardship roles, high-impact interventions such as prospective audit and feedback, and antimicrobial use tracking and benchmarking. 4 In 2023, the Pan-Canadian Antimicrobial Resistance (AMR) Action Plan was released, which reinforced the importance of antimicrobial stewardship as part of an overarching national strategy to address AMR. 5
Previous studies of ASPs in Ontario hospitals reflect these broader trends. Early evaluations revealed considerable heterogeneity in program structure, particularly related to resources and the ability to track antimicrobial use. Reference Leung, Wu, Langford and Garber6 As ASPs matured, more consistency was observed for some aspects such as implementation of high-impact interventions and capacity to track antimicrobial use; however, program resourcing continues to be suboptimal when compared to national and international recommendations. Reference Langford, Wu and Lo7–Reference Greene, Nesbitt and Nelson9 This is a significant limitation as increased ASP resourcing is linked with improved antimicrobial use, process, and cost outcomes. Reference Langford, Kang and Ji10 In Ontario, hospitals with greater ASP funding and staffing have more appropriate prescribing patterns, including reduced use of broad-spectrum antibiotics and are more likely to participate in provincial antimicrobial use surveillance efforts. Reference Tu, Shi and Leung11,Reference Langford, Thomas, Brown, Daneman, Schwartz and Leung12
Accreditation Canada has recently adopted new criteria for ASPs, which emphasize continuous quality improvement and the role of benchmarking and has expanded the scope to include all organizations that prescribe antimicrobials. 13 The objective of this cross-sectional study is to characterize the current state of hospital ASP resourcing and strategy implementation with a focus on how high-impact interventions such as prospective audit and feedback (PAF) are operationalized.
Methods
The Ontario Hospital ASP Landscape Survey is a voluntary survey of inpatient hospitals about antimicrobial stewardship program structure, strategy implementation, and antimicrobial use that is conducted every 2–3 years by Public Health Ontario (PHO). Survey development was an iterative process with pretesting and piloting by antimicrobial stewardship practitioners. Reference Burns, Duffett and Kho14 Building on previous versions, the 2026 survey was expanded to include questions about how specific ASP strategies of interest are operationalized (Supplement 1). The online survey (Surveys@PHO) had 17 adaptive questions and was open from January 13 to March 13, 2026. A targeted dissemination strategy with reminder emails and telephone follow-up for non-responders was conducted. The intent was for organizations to submit one survey response unless site-specific responses were desired for organizations with multiple sites. There was no incentive for participation.
Descriptive statistics were calculated using Microsoft Excel for Microsoft 365 MSO (Version 2,604) enterprise and stratified by hospital type as defined by the Ministry of Health. 15 Inductive thematic analysis was performed for free-text comments. Reference Braun and Clarke16 For resourcing, full-time equivalents (FTE) per 100 beds were calculated for larger institutions (teaching, large, and medium hospitals) to enable comparison with Association of Medical Microbiology and Infectious Disease (AMMI) Canada recommendations which specify a minimum of 0.3 pharmacist, 0.1 physician, and 0.49 total ASP FTE per 100 beds. 17 Total FTE includes pharmacist, physician, and other positions that support the ASP (eg, IT/Data support, Program Administration, Nurse, Nurse Practitioner, Infection Control Practitioner) as reported by the responding organization. For smaller institutions defined as small and complex continuing care and rehabilitation hospitals (CCC/rehab), the recommendations specify a minimum level of 0.3 pharmacist, 0.1 physician, and 0.4 total FTE independent of number of beds.
This project was exempt from research ethics committee approval as the activities described in this manuscript were conducted in fulfillment of PHO’s legislated mandate “to provide scientific and technical advice and support to the health care system” (Ontario Agency for Health Protection and Promotion Act, SO 2007, c 10) and are therefore considered public health practice, not research.
Results
ASP structure, funding, and resources
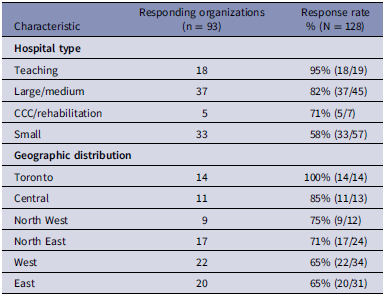
The participation rate was 73% (93/128 organizations) (see Table 1). Ninety-six percent of respondents (89/93) indicated they had a formal ASP or were in the process of implementing one in the next 12 months. Thirty-six percent of ASPs (32/89) reported formal inclusion of goals to improve antimicrobial stewardship practices or antimicrobial use into their organizational strategic plan or quality improvement plan. The proportions were similar across hospital types except for teaching which was slightly higher at 56% (10/18). Although 75% (70/93) of organizations track total hospital-wide antibiotic use, only 44% (41/93) distribute antibiotic use reports to prescribers annually. Five organizations explicitly cited transitioning to a new clinical information system as a barrier to obtaining antimicrobial utilization and other metrics. Metrics and benchmarking were identified by several organizations as an area for improvement efforts in the next year (17%, 16/93).
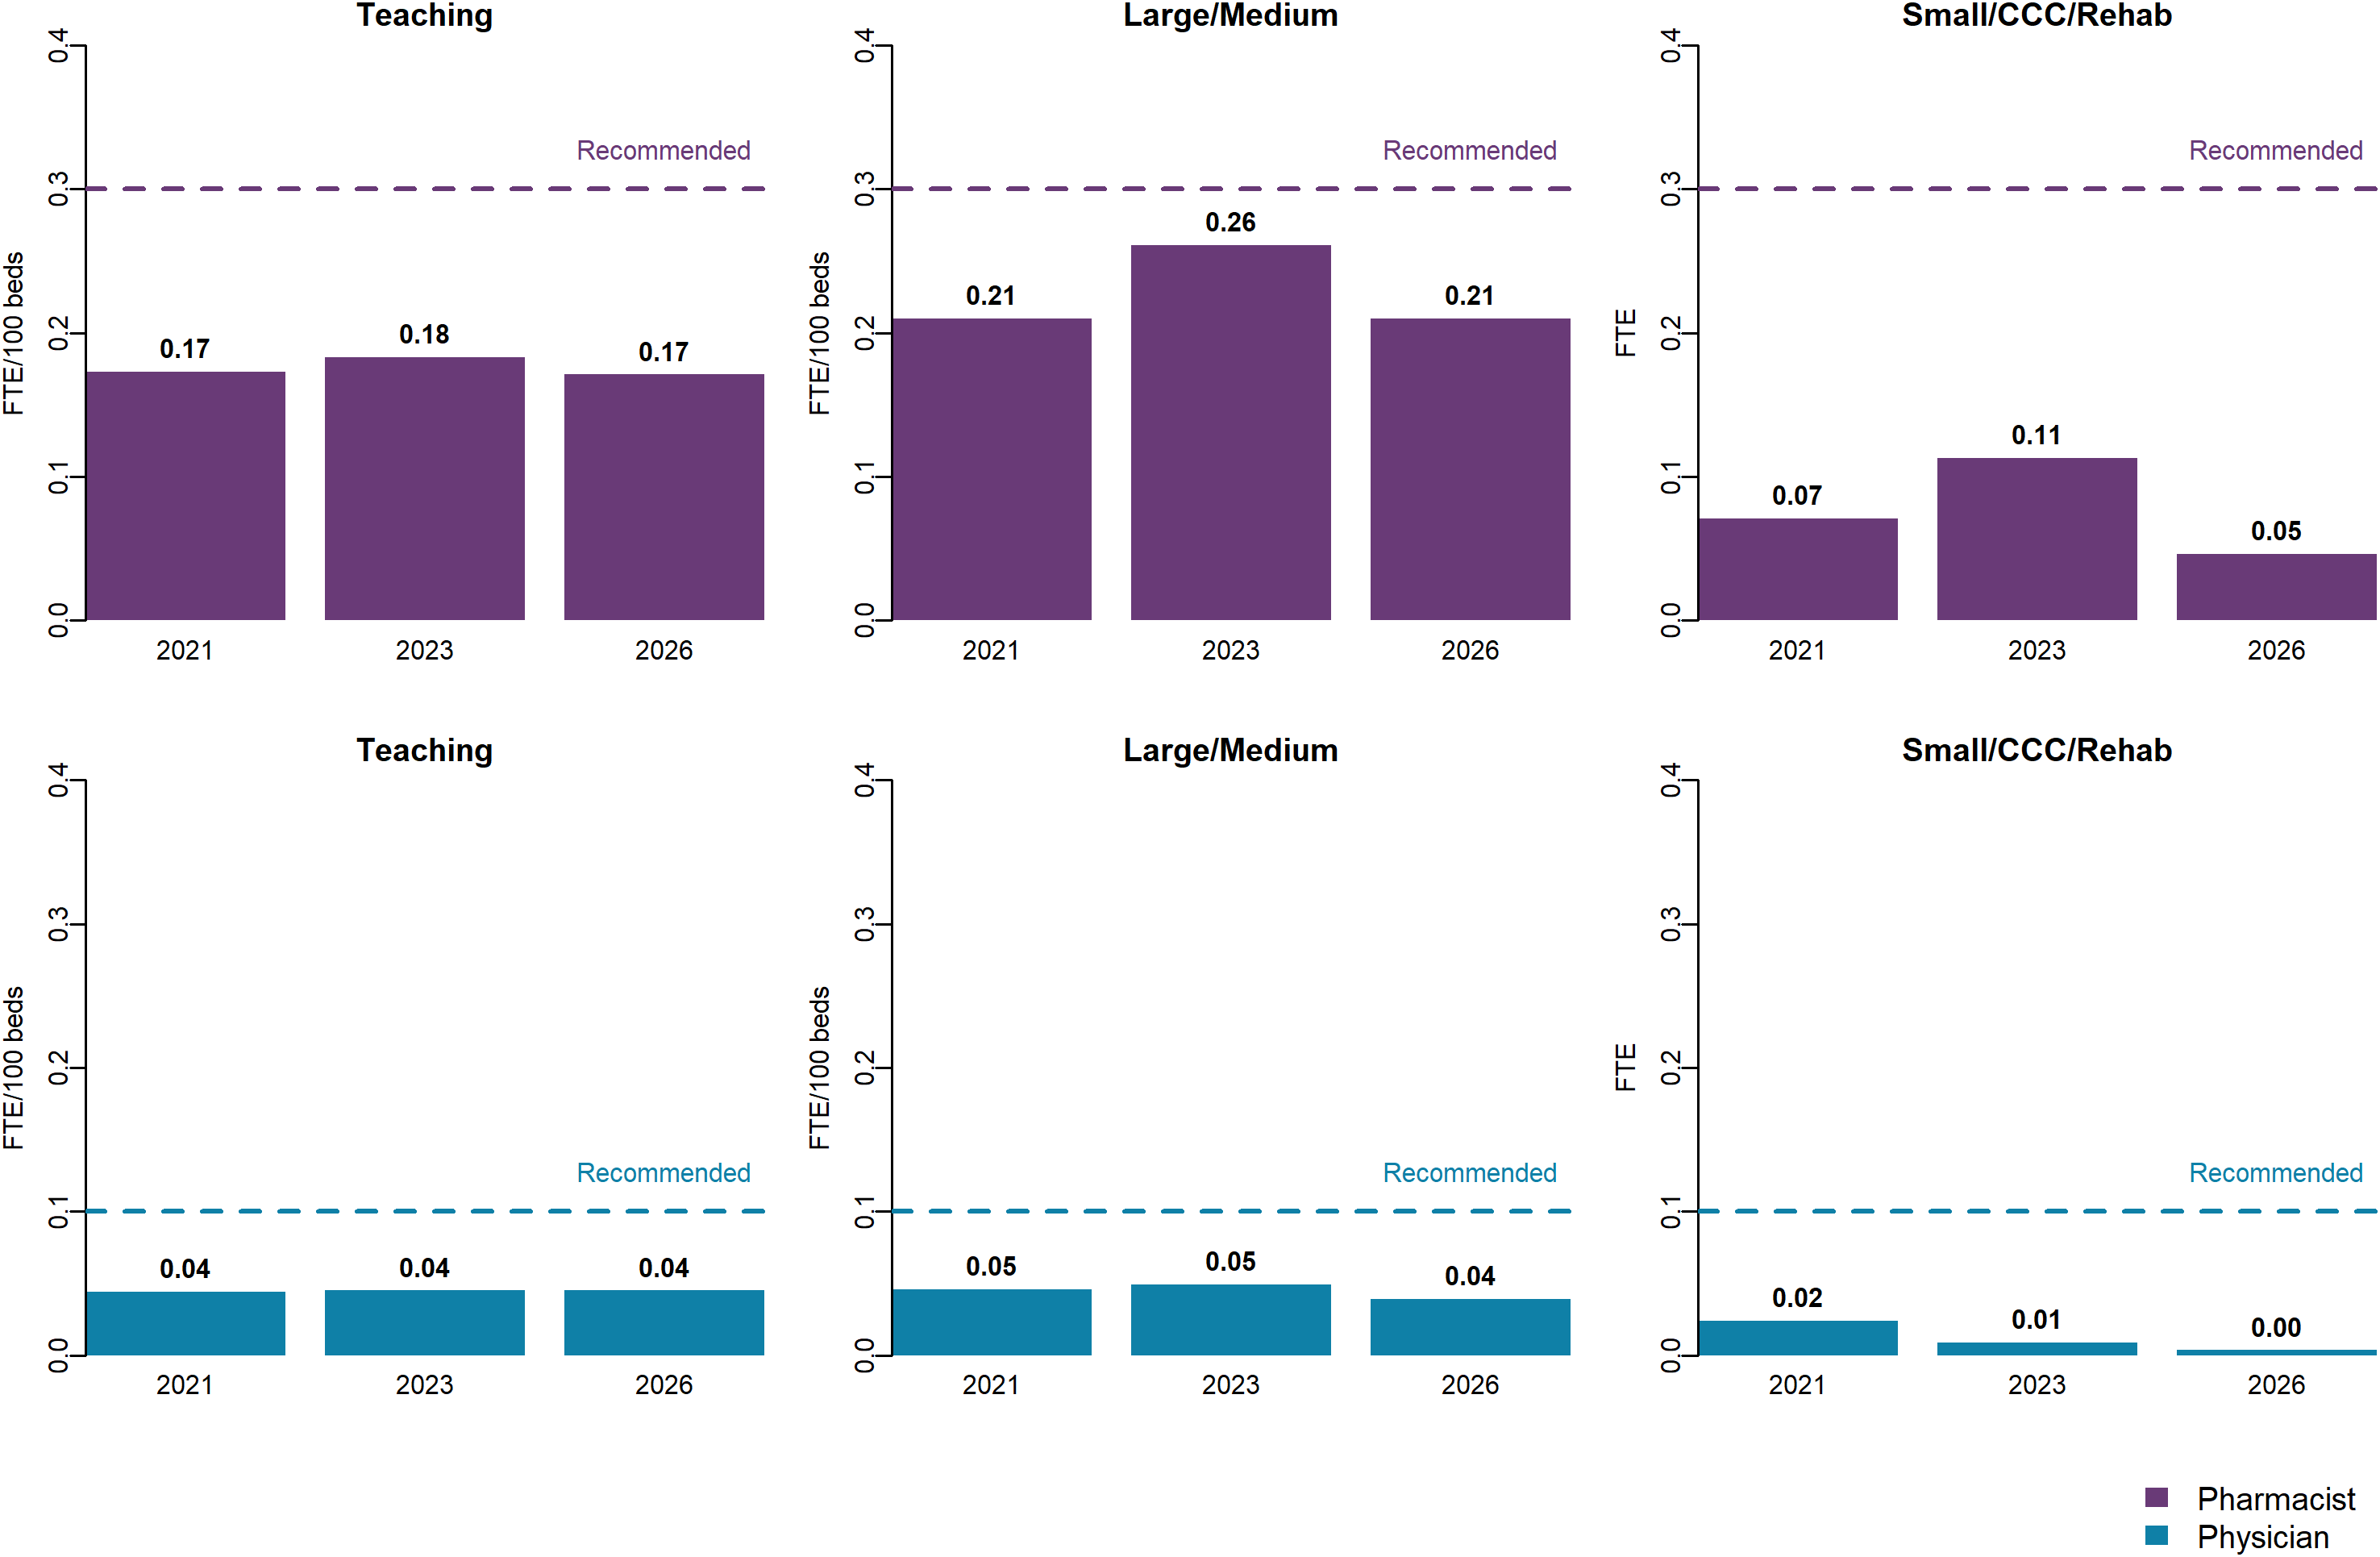
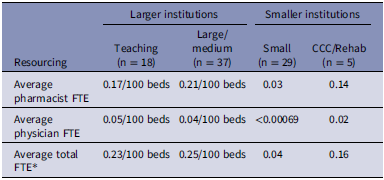
Overall, 63% (56/89) of ASPs indicated having any designated funding/resources; this was 89% (16/18) for teaching, 95% (20/21) for large, 63% (10/16) for medium, 21% (6/29) for small, and 60% (3/5) for CCC/rehab hospitals. For larger institutions (teaching, large and medium hospitals), the average FTE per 100 beds was 0.19 pharmacist, 0.04 physician, and 0.24 total ASP FTE, all below the AMMI Canada recommendations of 0.3 pharmacist, 0.1 physician, and total 0.49 FTE per 100 beds. For smaller institutions (small and CCC/Rehab hospitals) this was 0.05 for pharmacist FTE, 0.004 for physicians FTE and 0.06 for total ASP FTE which were also below the recommended minimum FTE of 0.3 pharmacist, 0.1 physician, and 0.4 total ASP staff. Table 2 provides a further breakdown. Figure 1 displays ASP FTE by discipline, hospital type and year. Lack of resources, particularly funding and staffing, was a prevailing theme amongst challenges cited by ASPs (72%, 67/93).
Full-time equivalents for antimicrobial stewardship program staffing by hospital type and year.

Figure 1. Long description
The image contains six bar graphs, each depicting the full-time equivalent (FTE) positions per 100 beds for pharmacists and physicians in different types of hospitals over the years 2021, 2023, and 2026. The graphs are divided into three categories: Teaching, Large/Medium, and Small/CCC/Rehab. Each category has two graphs, one for pharmacists and one for physicians. The recommended FTE levels are indicated by dashed lines. Panel A: Teaching Hospitals Pharmacists. The vertical bar graph shows the FTE per 100 beds for pharmacists in teaching hospitals for the years 2021, 2023, and 2026. The values are 0.17 for 2021, 0.18 for 2023, and 0.17 for 2026. The recommended FTE level is indicated by a dashed line at approximately 0.3. Panel B: Teaching Hospitals Physicians. The vertical bar graph shows the FTE per 100 beds for physicians in teaching hospitals for the years 2021, 2023, and 2026. The values are 0.04 for all three years. The recommended FTE level is indicated by a dashed line at approximately 0.05. Panel C: Large/Medium Hospitals Pharmacists. The vertical bar graph shows the FTE per 100 beds for pharmacists in large/medium hospitals for the years 2021, 2023, and 2026. The values are 0.21 for 2021, 0.26 for 2023, and 0.21 for 2026. The recommended FTE level is indicated by a dashed line at approximately 0.3. Panel D: Large/Medium Hospitals Physicians. The vertical bar graph shows the FTE per 100 beds for physicians in large/medium hospitals for the years 2021, 2023, and 2026. The values are 0.05 for 2021 and 2023, and 0.04 for 2026. The recommended FTE level is indicated by a dashed line at approximately 0.05. Panel E: Small/CCC/Rehab Hospitals Pharmacists. The vertical bar graph shows the FTE per 100 beds for pharmacists in small/CCC/rehab hospitals for the years 2021, 2023, and 2026. The values are 0.07 for 2021, 0.11 for 2023, and 0.05 for 2026. The recommended FTE level is indicated by a dashed line at approximately 0.3. Panel F: Small/CCC/Rehab Hospitals Physicians. The vertical bar graph shows the FTE per 100 beds for physicians in small/CCC/rehab hospitals for the years 2021, 2023, and 2026. The values are 0.02 for 2021, 0.01 for 2023, and 0.00 for 2026. The recommended FTE level is indicated by a dashed line at approximately 0.05.
Characteristics of responding organizations

Table 1. Long description
A table with two rows of grouped headings and seven columns. The first row of grouped headings is labeled ‘Characteristic’ and the second row is labeled ‘Responding organizations (n = 93)’ and ‘Response rate % (N = 128)’. The table has two main sections: Hospital type and Geographic distribution. Under Hospital type, the characteristics listed are Teaching, Large/medium, CCC/rehabilitation, and Small. The corresponding values for Responding organizations and Response rate % are: Teaching: 18, 95% (18/19); Large/medium: 37, 82% (37/45); CCC/rehabilitation: 5, 71% (5/7); Small: 33, 58% (33/57). Under Geographic distribution, the characteristics listed are Toronto, Central, North West, North East, West, and East. The corresponding values for Responding organizations and Response rate % are: Toronto: 14, 100% (14/14); Central: 11, 85% (11/13); North West: 9, 75% (9/12); North East: 17, 71% (17/24); West: 22, 65% (22/34); East: 20, 65% (20/31). CCC stands for complex continuing care.
CCC: complex continuing care.
Average full-time equivalent (FTE) by hospital type

Table 2. Long description
A table comparing average full-time equivalent (FTE) staffing by hospital type and size. The table has 4 rows and 5 columns. The columns are labeled Larger institutions, Teaching (n = 18), Large/medium (n = 37), Smaller institutions, Small (n = 29), and CCC/Rehab (n = 5). The rows are labeled Resource, Average pharmacist FTE, Average physician FTE, and Average total FTE. Row 1: Resource, Teaching (n = 18), Large/medium (n = 37), Small (n = 29), CCC/Rehab (n = 5). Row 2: Average pharmacist FTE, 0.17/100 beds, 0.21/100 beds, 0.03, 0.14. Row 3: Average physician FTE, 0.05/100 beds, 0.04/100 beds, <0.00069, 0.02. Row 4: Average total FTE, 0.23/100 beds, 0.25/100 beds, 0.04, 0.16.
CCC: complex continuing care.
* Total FTE includes pharmacist, physician plus other positions (e.g. IT/Data support, Program Administration, Nurse, Nurse Practitioner, Infection Control Practitioner) as reported by responding organization.
Strategy implementation
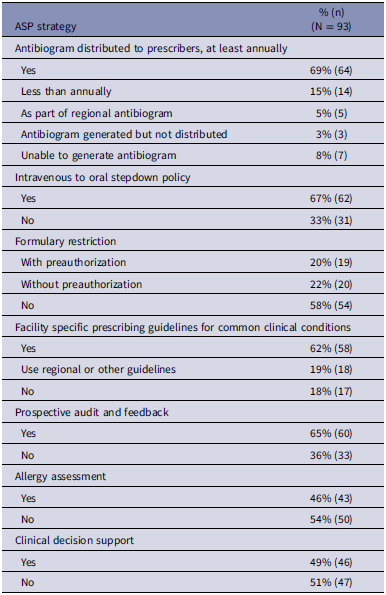
The most frequently implemented strategy was development and distribution of antibiograms (84%, 78/93), although only 69% (64/93) did so at least annually. Most organizations have implemented intravenous-to-oral conversion (67%, 62/93), PAF (65%, 60/93) and facility-specific prescribing guidelines for common clinical conditions (62%, 58/93). Formulary restriction, systematic allergy assessment, and clinical decision support were implemented in roughly 40%–50% of organizations. (See Table 3) The most common strategies identified for future implementation or improvement were facility-specific guidelines (18%, 17/93) and IV-to-PO conversion (13%, 12/93).
ASP strategy implementation

Table 3. Long description
A table summarizing the implementation of various antimicrobial stewardship program strategies across 93 organizations. The table has 10 rows and 3 columns. The columns are labeled ASP strategy, % (n), and (N = 93). The rows list different strategies and their implementation percentages and counts. Row 1: Antibiogram distributed to prescribers, at least annually, 69% (64). Row 2: Less than annually, 15% (14). Row 3: As part of regional antibiogram, 5% (5). Row 4: Antibiogram generated but not distributed, 3% (3). Row 5: Unable to generate antibiogram, 8% (7). Row 6: Intravenous to oral stepdown policy, 67% (62). Row 7: Formulary restriction with preauthorization, 20% (19). Row 8: Formulary restriction without preauthorization, 22% (20). Row 9: Facility specific prescribing guidelines for common clinical conditions, 62% (58). Row 10: Use regional or other guidelines, 19% (18). Row 11: Prospective audit and feedback, 65% (60). Row 12: Allergy assessment, 46% (43). Row 13: Clinical decision support, 49% (46).
Allergy assessment
Interventions related to antibiotic allergy assessment are present in 46% (4393) of organizations. Of these, many organizations have established a process to clarify allergy history as part of routine medication history taking (26%, 11/43) and/or have implemented a standardized risk assessment and de-labeling process for beta-lactam allergies (60%, 26/43), often including the use of PEN-FAST score (27%, 7/26) and oral challenge when indicated (42%, 11/26). Reference Trubiano, Vogrin and Chua18 Efforts to promote the use of cefazolin in penicillin-allergic patients typically in the context of optimizing surgical prophylaxis were also common (37%,16/43).
Clinical decision support (CDS)
About half (49%, 46/93) of organizations indicated that they had implemented one or more clinical decision support features to advance antimicrobial stewardship strategies, with the majority being larger institutions (70%, 32/46). About a third (33%, 31/93) of organizations implemented CDS to support documentation of prescribing indication with 48% (15/31) requiring mandatory indication at the time of prescribing for selected or all antimicrobials and 45% (14/31) implementing functions to enforce formulary restrictions (eg, documenting criteria for use). Similarly, 30% (28/93) reported implementing CDS related to documenting duration of therapy most commonly through automatic stop orders (50%, 14/28), requiring mandatory duration at the time of prescribing (25%, 7/28) and embedding predefined durations for specific indications into the prescribing process using order sentences and/or order sets (25%, 7/28). Several organizations also mentioned the use of CDS to support allergy assessment (8%, 7/93).
Prospective audit and feedback (PAF)
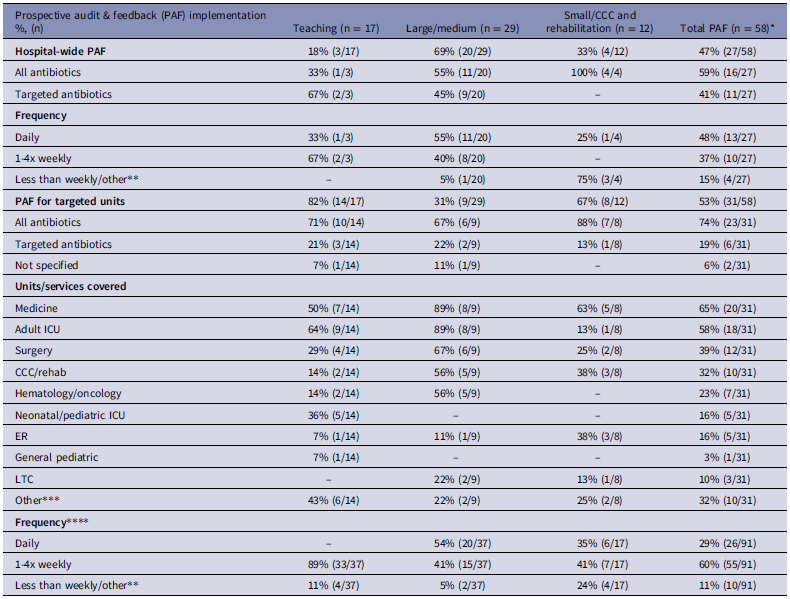
While 65% (60/93) of organizations have implemented PAF, this differs across hospital types, with 94% of teaching hospitals (17/18), 81% (30/37) of large/medium hospitals, and 38% (13/34) of small hospitals and CCC/rehab hospitals having implemented this strategy. All sites except for 1 medium and 1 small hospital (97%, 58/60) provided details on the operationalization of PAF which is also variable. Most teaching and small hospitals conduct PAF on targeted patient care units while most large/medium hospitals conduct hospital-wide PAF. For those conducting PAF on targeted units (53%, 31/58), the most common locations covered are medicine (65%, 20/31) and adult ICU (58%, 18/31), followed by surgery (39%, 12/31) and CCC/rehab (32%, 10/31). In general, PAF is typically performed for all antibiotics (59%, 16/27 for hospital-wide PAF, 74%, 23/31 for targeted units) and performed daily or several times a week (85%, 23/27 for hospital-wide PAF, 89%, 81/91 for targeted units). A small minority reported performing PAF less than weekly or at another interval (15%, 4/27 for hospital-wide PAF, 11%, 10/91 for targeted units). It is important to note that the denominator for frequency at the unit level is higher than the total number of organizations performing PAF because sites reported different frequencies for different targeted units covered (Table 4 provides a breakdown).
Characteristics of prospective audit & feedback implementation

Table 4. Long description
A table comparing prospective audit and feedback implementation across different hospital types. The table has 17 rows and 5 columns. Column headers are: Prospective audit & feedback implementation (PAF) %, (n), Teaching (n = 17), Large/medium (n = 29), Small/CCC and rehabilitation (n = 12), Total PAF (n = 58). Row labels include Hospital-wide PAF, All antibiotics, Targeted antibiotics, Frequency, Daily, 1-4x weekly, Less than weekly/other, PAF for targeted units, All antibiotics, Targeted antibiotics, Not specified, Units/services covered, Medicine, Adult ICU, Surgery, CCC/rehab, Hematology/oncology, Neonatal/pediatric ICU, ER, General pediatric, LTC, Other, Frequency. Row 1: Hospital-wide PAF, Teaching, 18 percent (3/17), Large/medium, 69 percent (20/29), Small/CCC and rehabilitation, 33 percent (4/12), Total PAF, 47 percent (27/58). Row 2: All antibiotics, Teaching, 33 percent (1/3), Large/medium, 55 percent (11/20), Small/CCC and rehabilitation, 100 percent (4/4), Total PAF, 59 percent (16/27). Row 3: Targeted antibiotics, Teaching, 67 percent (2/3), Large/medium, 45 percent (9/20), Small/CCC and rehabilitation, Not applicable, Total PAF, 41 percent (11/27). Row 4: Frequency, Teaching, Not applicable, Large/medium, Not applicable, Small/CCC and rehabilitation, Not applicable, Total PAF, Not applicable. Row 5: Daily, Teaching, 33 percent (1/3), Large/medium, 55 percent (11/20), Small/CCC and rehabilitation, 25 percent (1/4), Total PAF, 48 percent (13/27). Row 6: 1-4x weekly, Teaching, 67 percent (2/3), Large/medium, 40 percent (8/20), Small/CCC and rehabilitation, Not applicable, Total PAF, 37 percent (10/27). Row 7: Less than weekly/other, Teaching, Not applicable, Large/medium, 5 percent (1/20), Small/CCC and rehabilitation, 75 percent (3/4), Total PAF, 15 percent (4/27). Row 8: PAF for targeted units, Teaching, 82 percent (14/17), Large/medium, 31 percent (9/29), Small/CCC and rehabilitation, 67 percent (8/12), Total PAF, 53 percent (31/58). Row 9: All antibiotics, Teaching, 71 percent (10/14), Large/medium, 67 percent (6/9), Small/CCC and rehabilitation, 88 percent (7/8), Total PAF, 74 percent (23/31). Row 10: Targeted antibiotics, Teaching, 21 percent (3/14), Large/medium, 22 percent (2/9), Small/CCC and rehabilitation, 13 percent (1/8), Total PAF, 19 percent (6/31). Row 11: Not specified, Teaching, 7 percent (1/14), Large/medium, 11 percent (1/9), Small/CCC and rehabilitation, Not applicable, Total PAF, 6 percent (2/31). Row 12: Units/services covered, Teaching, Not applicable, Large/medium, Not applicable, Small/CCC and rehabilitation, Not applicable, Total PAF, Not applicable. Row 13: Medicine, Teaching, 50 percent (7/14), Large/medium, 89 percent (8/9), Small/CCC and rehabilitation, 63 percent (5/8), Total PAF, 65 percent (20/31). Row 14: Adult ICU, Teaching, 64 percent (9/14), Large/medium, 89 percent (8/9), Small/CCC and rehabilitation, 13 percent (1/8), Total PAF, 58 percent (18/31). Row 15: Surgery, Teaching, 29 percent (4/14), Large/medium, 67 percent (6/9), Small/CCC and rehabilitation, 25 percent (2/8), Total PAF, 39 percent (12/31). Row 16: CCC/rehab, Teaching, 14 percent (2/14), Large/medium, 56 percent (5/9), Small/CCC and rehabilitation, 38 percent (3/8), Total PAF, 32 percent (10/31). Row 17: Hematology/oncology, Teaching, 14 percent (2/14), Large/medium, 56 percent (5/9), Small/CCC and rehabilitation, Not applicable, Total PAF, 23 percent (7/31). Row 18: Neonatal/pediatric ICU, Teaching, 36 percent (5/14), Large/medium, Not applicable, Small/CCC and rehabilitation, Not applicable, Total PAF, 16 percent (5/31). Row 19: ER, Teaching, 7 percent (1/14), Large/medium, 11 percent (1/9), Small/CCC and rehabilitation, 38 percent (3/8), Total PAF, 16 percent (5/31). Row 20: General pediatric, Teaching, 7 percent (1/14), Large/medium, Not applicable, Small/CCC and rehabilitation, Not applicable, Total PAF, 3 percent (1/31). Row 21: LTC, Teaching, Not applicable, Large/medium, 22 percent (2/9), Small/CCC and rehabilitation, 13 percent (1/8), Total PAF, 10 percent (3/31). Row 22: Other, Teaching, 43 percent (6/14), Large/medium, 22 percent (2/9), Small/CCC and rehabilitation, 25 percent (2/8), Total PAF, 32 percent (10/31). Row 23: Frequency, Teaching, Not applicable, Large/medium, Not applicable, Small/CCC and rehabilitation, Not applicable, Total PAF, Not applicable. Row 24: Daily, Teaching, Not applicable, Large/medium, 54 percent (20/37), Small/CCC and rehabilitation, 35 percent (6/17), Total PAF, 29 percent (26/91). Row 25: 1-4x weekly, Teaching, 89 percent (33/37), Large/medium, 41 percent (15/37), Small/CCC and rehabilitation, 41 percent (7/17), Total PAF, 60 percent (55/91). Row 26: Less than weekly/other, Teaching, 11 percent (4/37), Large/medium, 5 percent (2/37), Small/CCC and rehabilitation, 24 percent (4/17), Total PAF, 11 percent (10/91).
CCC: complex continuing care.
* A total of 60 sites indicated PAF implemented, however 2 responses (1 medium, 1 small) did not specify whether PAF is hospital-wide or for targeted units therefore the denominator for this breakdown is 58.
*** Other includes: not specified, cardiology, GI, Medical Stepdown, transplant, Mental Health.
**** Denominator for frequency exceeds the total number organizations performing PAF as some sites reported different frequencies for different targeted units covered.
Discussion
This cross-sectional study of 93 organizations with a survey response rate of 73% describes the current state of hospital antimicrobial stewardship programs in 2026, more than a decade after becoming an accreditation requirement and in the context of evolving national and international guidance. A significant proportion of programs continue to lack designated resources; 50% of ASPs had no dedicated funding in 2016, compared to 37% in 2026. Reference Leung, Wu, Langford and Garber6 When comparing ASP strategy implementation in 2016–2026, the extent appears to be similar for most interventions: antibiograms (81% vs 84%), IV-to-PO conversion (71% vs 67%), PAF (65% vs 65%), prescribing guidelines (63% vs 62%), and formulary restriction with preauthorization (29% vs 20%). Reference Leung, Wu, Langford and Garber6
That said, there was a large increase for systematic allergy assessment (6% vs 46%) and clinical decision support (12% vs 50%) reflecting advances in evidence and technology. Reference Leung, Wu, Langford and Garber6 Aligning with newer literature recognizing penicillin allergy labels as a modifiable driver of inappropriate antibiotic use, almost half of ASPs reported implementing interventions targeting this. The development of validated risk stratification tools such as PEN-FAST and evidence supporting direct oral challenge in low-risk patients has facilitated integration of penicillin allergy assessment and de-labeling into ASP workflows. Reference Trubiano, Vogrin and Chua18 Additionally, a better understanding of β-lactam cross-reactivity has improved the use of first-line agents in patients with penicillin allergy, with many ASPs reporting implementation of policies and clinical decision support to optimize the use of cefazolin for peri-operative prophylaxis. Reference Jeimy, Ben-Shoshan, Abrams, Ellis, Connors and Wong19
About two-thirds of organizations reported conducting PAF; however, a wide variety of models were reported. In this study, there were differences in the scope of PAF being performed. Medium and large hospitals tend to perform hospital-wide PAF, while teaching and smaller hospitals frequently conduct PAF for targeted services/units typically covering ICU, general medicine, and general surgery. For smaller hospitals, this most likely reflects lack of resources but for teaching hospitals the presence of specialty services requiring tailored approaches may also limit the scope of PAF. Conversely, some ASPs may leverage clinical pharmacists to support PAF activities on their units. Frequency of review was also quite variable; it was most common to perform PAF daily or several times per week, but a small number reported PAF being performed less frequently. While generally regarded as a high-impact intervention, previous literature has shown that the intensity of PAF interventions can influence outcomes; the variation in this study raises the opportunity to explore the role of more clear terminology when describing PAF, further evaluation of different PAF models, and potentially a more standardized approach to PAF in the future. Reference Langford, Brown, Chan and Downing20,Reference Chung, Wu, Yeo, Chan and Hsu21
As an increasing number of organizations adopt Computerized Provider Order Entry (CPOE), CDS functions are also being deployed to amplify other stewardship strategies and to address historical gaps in documentation. In this survey, many organizations are using CDS to implement mandatory indication and duration documentation and/or eligibility criteria to support formulary restriction at the time of prescribing which were historically more difficult interventions to deploy using a paper system. However, transitions to new clinical information systems were also frequently cited as barriers to accessing antimicrobial use metrics and a strain on already limited resources, suggesting that newer clinical information systems may not necessarily reduce workload in the short term.
Inadequate ASP resourcing remains the dominant challenge across Ontario hospitals and continues to constrain program scope and limit the potential impact. Firstly, many ASPs, mainly those in medium, small, and CCC/rehab hospitals, still report having no dedicated resources or funding for their ASPs. This is in contrast with a recent national survey of Canadian hospitals belonging to a sentinel surveillance network which found that 93% had dedicated pharmacist resources. Reference McGill, Neitzel and Bartoszko22 Across all hospital types, the average FTE for pharmacist, physician, and total ASP staff in Ontario continues to be less than AMMI Canada recommendations, international recommendations and, in some cases, lower than historical averages (See Figure 1). Reference Leung, Thomas, Brown, Daneman, Schwartz and Langford8,Reference Greene, Nesbitt and Nelson9 Even for larger institutions which tend to be better resourced, pharmacist FTE per 100 beds is 0.19 (vs 0.17–0.26 in 2021 and 2023) and physician FTE per 100 beds is 0.04 (vs 0.05 per 100 beds in 2021 and 2023). Reference Leung, Thomas, Brown, Daneman, Schwartz and Langford8 This may reflect that while 56% of organizations included appropriate antibiotic use in strategic or quality plans in 2016, only one-third reported doing so in 2026, potentially signaling ASPs being viewed as less of an organizational priority. Reference Leung, Wu, Langford and Garber6
While hospital ASPs in Ontario continue to operate with limited resources, expectations for programs have evolved over time shifting away from foundational interventions towards high-impact but more resource-intensive interventions. 4 This, combined with new accreditation criteria that emphasize benchmarking and quality improvement, presents significant challenges. In 2026, although most organizations indicate that they are tracking hospital-wide AMU, fewer than half are routinely disseminating antimicrobial use reports to prescribers and only about half submit these data for provincial benchmarking purposes. 23 Optimization of provincial data infrastructure and scaled or regionalized stewardship models may help hospital ASPs play a greater role within an overarching AMR mitigation strategy; however, without additional investment in hospital ASPs, it will be difficult for programs to advance beyond compliance with accreditation criteria to have significant program impact. Reference Langford, Kang and Ji10
A strength of this survey is its high response rate of 73%, which exceeds the generally accepted benchmark of 60%–70%. Reference Burns, Duffett and Kho14 However, as with previous surveys, this was a voluntary questionnaire relying on self-reported, organization-level data. Consequently, the findings may be biased toward more established programs with dedicated funding and resources, as these are more likely to have the capacity to participate. Comparison with survey results may also be imprecise as participation by specific organizations can vary from year to year; however, with a consistent response rate of over 70%, this is minimized. Reference Leung, Wu, Langford and Garber6,Reference Leung, Quirk, Muir, Daneman, Schwartz and Langford24
In conclusion, while antimicrobial stewardship programs in Ontario hospitals have advanced in areas such as allergy assessment and clinical decision support, persistent gaps in funding continue to limit their scope and potential impact, particularly for smaller organizations. It will be challenging for most hospital ASPs to incorporate benchmarking and adopt a quality improvement approach without more dedicated resources and organizational prioritization.
Supplementary material
The supplementary material for this article can be found at https://doi.org/10.1017/ash.2026.10832.
Financial support
This study was conducted as part of the authors’ routine work.
Competing interests
The authors declare no conflict of interest.
Declarations
None to declare.


 Open access

