Introduction
Metallic multilayers have fascinated researchers with their extraordinary mechanical properties by controlling its layer thickness, the number of constituents, and the type of materials from metal–metal [Reference Misra and Hoagland1, Reference Wang, Zhou, Shao and Misra2] to metal–ceramics [Reference Deng, Chawla, Chawla, Koopman and Chu3, Reference Lotfian, Mayer, Chawla, Llorca, Misra, Baldwin and Molina-Aldareguía4] and recently metal–graphene [Reference Hwang, Kim, Kim, Lee, Lim, Kim, Oh, Ryu and Han5, Reference Kim, Lee, Yeom, Shin, Kim, Cui, Kysar, Hone, Jung, Jeon and Han6]. These combinations have resulted in enhanced mechanical properties such as ultrahigh strength [Reference Misra7], thermal stability [Reference Baumann, Liebemann, Simon and Bucher8, Reference Misra, Hoagland and Kung9, Reference Moszner, Cancellieri, Chiodi, Yoon, Ariosa, Janczak-Rusch and Jeurgens10], resistance to radiation extremes [Reference Misra, Demkowicz, Zhang and Hoagland11, Reference Beyerlein, Caro, Demkowicz, Mara, Misra and Uberuaga12], and linear resistivity versus strain relationship [Reference Anwar Ali, Radchenko, Zhou, Qing and Budiman13]. These properties have been associated with the dislocation strengthening mechanisms [Reference Misra, Hirth and Hoagland14] that occur at the interface of multilayers at different length scales. In this paper, we will be focusing on the metal–metal multilayers of Al/Nb and Cu/Nb with the face-centered cubic (FCC)/body-centered cubic (BCC) interface.
The FCC/BCC interface can have a range of coherency depending on the lattice mismatch of the two constituents. The strain due to incoherency is partially relieved by misfit dislocations with the residual compressive strain present in the film. Al/Nb multilayers have a coherent interface with a very low lattice mismatch of 0.4% because of their close match in their interplanar spacings of Al(111) (d o = 0.234 nm) and Nb(110) (d o = 0.233 nm). They have a negative heat of mixing of −18 kJ/mol [Reference de Boer, Boom, Mattens, Miedema and Niessen15] with a strong affinity to intermix. Cu/Nb multilayers, on the other hand, have an incoherent interface with a larger lattice mismatch of 11.2% with Cu(111) (d o = 0.208 nm) not closely matched with Nb(110). They have a small positive heat of mixing of +3 kJ/mol [Reference de Boer, Boom, Mattens, Miedema and Niessen15] resulting in the two materials, not likely to mix at all.
Besides their fundamental differences, these two material systems have been studied extensively for their mechanical properties because of their unique interfaces. Through nanoindentation, Fu et al. [Reference Fu, Li, Misra, Hoagland, Wang and Zhang16] found that Al/Nb multilayers had a lower interface barrier strength, peak hardness, and indentation moduli values as compared to Cu/Nb multilayers. Kim et al. [Reference Kim, Budiman, Baldwin, Mara, Misra and Han17] performed micropillar compressions of Al/Nb multilayers of two individual layer thicknesses, 5 nm and 50 nm, and compared the results with Cu/Nb micropillars performed by Mara et al. [Reference Mara, Bhattacharyya, Dickerson, Hoagland and Misra18, Reference Mara, Bhattacharyya, Hirth, Dickerson and Misra19]. Al/Nb micropillars were prone to lower flow stresses than Cu/Nb micropillars for the same layer thickness because of the difference in the interfacial shear strength values between Al/Nb and Cu/Nb interfaces [Reference Wang, Hoagland, Hirth and Misra20, Reference Wang, Misra, Hoagland and Hirth21]. A distinct macro shear in the pillars and a small 2–3.5 nm layer of intermixing at the Al/Nb interfaces showed the effect of Al/Nb interface being stronger in shear and having a limited ability to absorb dislocations [Reference Kim, Budiman, Baldwin, Mara, Misra and Han17]. The plasticity behavior was further confirmed with in situ transmission electron microscope (TEM) nanoindentation experiments by Li et al. [Reference Li, Wang, Huang, Misra and Zhang22] where the dislocations tend to accumulate in the Al/Nb interface instead of remaining in the lattice. Thus, Al/Nb multilayers are known to have a strong interface to shear, a lower barrier to slip transmission, resulting in low flow stresses [Reference Fu, Li, Misra, Hoagland, Wang and Zhang16, Reference Kim, Budiman, Baldwin, Mara, Misra and Han17].
In comparison, it has been established through experiments [Reference Kim, Budiman, Baldwin, Mara, Misra and Han17, Reference Mara, Bhattacharyya, Dickerson, Hoagland and Misra18, Reference Mara, Bhattacharyya, Hirth, Dickerson and Misra19, Reference Li, Wang, Misra and Huang23] and molecular dynamic (MD) simulations [Reference Wang, Hoagland, Hirth and Misra20, Reference Wang, Misra, Hoagland and Hirth21, Reference Demkowicz and Hoagland24, Reference Demkowicz, Hoagland and Hirth25, Reference Wang, Hoagland, Hirth and Misra26] that Cu/Nb multilayers have a weak interface to shear [Reference Wang, Hoagland, Hirth and Misra20] and a higher barrier to slip transmission because of core spreading at the interface [Reference Hoagland, Hirth and Misra27], providing a strong trap for the glide dislocations. Budiman et al. [Reference Budiman, Narayanan, Li, Wang, Tamura, Kunz and Misra28, Reference Radchenko, Tippabhotla, Tamura and Budiman29] further reported an accumulation of dislocation density in the Cu/Nb interfaces followed by saturation indicating crystal recovery using synchrotron X-ray microdiffraction through ex situ pillar compressions of Cu/Nb multilayers.
The presence of interfaces in a multilayered system can influence its fracture properties. This interface restricts the expansion of the plastic zone, resulting in the increase of tensile stresses at the crack tip. Its interaction with this and the subsequent interfaces may result in an enhanced fracture toughness or “cracking resistance” of multilayer by deflection of the crack in the multilayers or even blunting of the crack at one of the interface [Reference Zechner and Kolednik30, Reference Wiklund, Hedenqvist and Hogmark31, Reference Voevodin, Iarve, Ragland, Zabinski and Donaldson32]. Examples of fracture in Cu/Nb multilayers were observed mainly as a byproduct during the tensile dog-bone testing [Reference Wu, Zhang, Liu, Zhang, Cheng, Li, Zhang and Sun33, Reference Zhang, Zhang, Wang, Lei, Zhang, Niu, Liu, Zhang and Sun34] and in situ TEM straining [Reference Hattar, Misra, Dosanjh, Dickerson, Robertson and Hoagland35, Reference Mara, Bhattacharyya, Hoagland and Misra36] experiments. Zhang et al. [Reference Zhang, Zhang, Wang, Lei, Zhang, Niu, Liu, Zhang and Sun34] performed uniaxial tensile tests of Cu/Nb multilayers on polyimide substrates from 5 to 125 nm layer thickness up to 10% strain. There was a transition in the fracture profile from the opening mode to shear mode with decreasing individual layer thickness. Ductile fracture with little necking was also evident during tensile testing of Cu/Nb physical vapor deposition (PVD) 40 nm freestanding multilayered films with cracks along the grain boundaries within the layers [Reference Mara, Bhattacharyya, Hoagland and Misra36]. Hattar et al. [Reference Hattar, Misra, Dosanjh, Dickerson, Robertson and Hoagland35] observed four crack hindrance mechanisms of microvoid formation, crack deviation, layer necking, and crack blunting during the in situ TEM straining of Cu/Nb 60 nm/150 nm multilayered films. He credited this because of confined layer slip (CLS) within the Cu/Nb layers containing and preceding the crack tip. In contrast, there is no existing work detailing the study of fracture of the Al/Nb multilayered films. A close comparison was the tensile testing of Al/Ti thin films from 6 to 45 nm where a transition from a brittle intergranular fracture to ductile transgranular fracture following plasticity was evident with little suggestion that it was due to the influence of the interfaces [Reference Josell, Van Heerden, Read, Bonevich and Shechtman37].
These experimental studies have shown that the multilayer interface plays a crucial role in the resulting mechanical deformation and fracture depending on the individual layer thickness of the multilayers. However, real-time observations of a crack or notch propagating across the metallic multilayers in a controlled setting are limited to metal/ceramic multilayered systems [Reference Jaya, Jayaram and Biswas38, Reference Kumar, Zhuo, Wolfe, Eades and Haque39, Reference Mayer, Li, Mara and Chawla40]. By studying Al/Nb and Cu/Nb PVD multilayers of similar FCC/BCC interface, it would be insightful to observe and learn through direct observations of how fracture interacts with these interfaces. The effects of the constituent layer interfaces and grain boundaries on plasticity and fracture of the multilayers were examined experimentally and evaluated theoretically. In situ microfracture bending tests of the multilayers of clamped beam geometry with a notch across the layers are proposed to observe the crack propagation events of the different FCC/BCC interfaces together with the synchronous recording of the load–displacement information using the scanning electron microscope (SEM) [Reference Jaya, Jayaram and Biswas38, Reference Jaya, Kirchlechner and Dehm41]. This experimental method has been adopted for Cu/Nb Accumulative roll bonded (ARB) beams by Radchenko et al. [Reference Radchenko, Anwar Ali, Tippabhotla and Budiman42] to understand the role of interface shear strength in the rolling and transverse directions that matched previous MD simulations. Displacement control is used in a controlled mode I or mixed mode loading setting to ensure a stable crack growth in the beam [Reference Jaya, Jayaram and Biswas38, Reference Jaya, Kirchlechner and Dehm41]. Thus, through the direct observation of the fracture events, we aim to understand how the interface, among other important microstructural features, influences the fracture profile of Al/Nb and Cu/Nb PVD multilayers.
Results and discussion
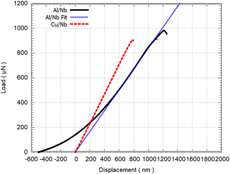
Cu/Nb and Al/Nb beams exhibit different fracture behavior during the in situ microfracture clamped beam bending experiments. Figure 1 shows the load–displacement curves of the Cu/Nb and Al/Nb beams. Because of the clamped beam configuration, the initial elastic regime can be linear or nonlinear depending on the constituents in the multilayered beams [Reference Heidelberg, Ngo, Wu, Phillips, Sharma, Kamins, Sader and Boland44]. Cu/Nb beams’ load–displacement curves were linear with no sign of plasticity. However, both Al/Nb beams exhibited a nonlinear load–displacement slope because of the additional tensile stretching force on the beams. This could also be due to the conical indenter tip becoming in gradual contact with the top surface as the load is exerted onto the beam. A generalized equation of clamped beam configuration, inclusive of the effect of tensile forces on the beam [Reference Heidelberg, Ngo, Wu, Phillips, Sharma, Kamins, Sader and Boland44], was used to determine the elastic moduli of both Al/Nb and Cu/Nb beams. The average elastic moduli were about 83.5 GPa for the Al/Nb beams and 110 GPa for the Cu/Nb beams. These values fall within the range of existing literature values [Reference Fu, Li, Misra, Hoagland, Wang and Zhang16, Reference Budiman, Narayanan, Li, Wang, Tamura, Kunz and Misra28, Reference Mara, Bhattacharyya, Hoagland and Misra36]. For a more accurate comparison between Al/Nb and Cu/Nb beams, a straight line fit (in dotted blue) is drawn through the steepest portion of the linear region of the Al/Nb curve with an x-offset.
Load–displacement representative graph of Cu/Nb (in dashed red line) versus Al/Nb multilayered beam (in solid black line). A linear fit (in dotted blue) is performed along the steepest portion of the Al/Nb curve for a more accurate comparison between Cu/Nb and Al/Nb beams.

Figure 2 shows the key frames from the in situ microfracture clamped beam bending videos of one of the Cu/Nb [Figs. 2(a)–2(c)] (Supplementary material Video S1) and Al/Nb [Figs. 2(d)–2(f)] beams (Supplementary material Video S2). Both Al/Nb and Cu/Nb beams experienced relatively little or no plastic deformation with the shape of the notch remained the same throughout the experiment as evident from Figs. 2(b) and 2(e). However, the main difference lies in the events leading to final fracture.
The sequence of video stills for Cu/Nb, and Al/Nb PVD beams from the Supplementary material Video S1 and Supplementary material Video S2: (a) Initial stage of Cu/Nb beam before the experiment with a sharp notch. (b) State of the Cu/Nb beam at the maximum load just before the fracture. No visible crack was observed. (c) Catastrophic fracture observed at the end of the test with the crack propagating nearly parallel to the direction of the applied load across the full beam. (d) The initial stage of Al/Nb beam before the experiment with a sharp notch. (e) Crack formation at the tip of the notch at peak load for Al/Nb beam and (f) crack propagating parallel to the direction of applied load across the full beam.

A sudden, catastrophic fracture event was observed for the Cu/Nb PVD beams when they were being bent. At its peak load, the beam immediately broke into two. There were no signs of strain softening or dislocation bursts throughout the experiment, which suggests plasticity because of the presence of Cu/Nb interfaces as seen in previous Cu/Nb in situ TEM tensile experiments [Reference Hattar, Misra, Dosanjh, Dickerson, Robertson and Hoagland35, Reference Mara, Bhattacharyya, Hoagland and Misra36] and micropillar compressions [Reference Mara, Bhattacharyya, Hirth, Dickerson and Misra19, Reference Budiman, Narayanan, Li, Wang, Tamura, Kunz and Misra28]. Further, there was no sign of slip band or shear instability being formed before fracture unlike what was observed in the Cu/Nb ex situ micropillar compressions of the similar layer thickness [Reference Mara, Bhattacharyya, Dickerson, Hoagland and Misra18, Reference Mara, Bhattacharyya, Hirth, Dickerson and Misra19]. The resultant fractured Cu/Nb beam surfaces seemed to suggest intergranular brittle shearing, preferentially along the columnar grain boundaries [Fig. 3(a)].
Fractography of the broken (a) Cu/Nb and (b) Al/Nb PVD beams from the Supplementary material Video S1 and Supplementary material Video S2.

A gradual, ductile event was observed for the Al/Nb multilayered beams. The Al/Nb notch width size remained the same for a much longer displacement until the test reached a higher max load. At this point, a crack was formed, propagating from the tip of the notch of the Al/Nb beam as shown in Figs. 2(e) and 2(f). This crack grew perpendicular to the interfaces with signs of small dislocation bursts along the load–displacement curve till its final fracture. These dislocation bursts are the spikes found in the load–displacement curve, which signify possible dislocation plasticity behavior at the interface such as nucleation, gliding, or transmission across the interface during the bending. The resultant fractured Al/Nb beam surfaces seemed to suggest a ductile fracture of Al/Nb multilayers [Fig. 3(b)].
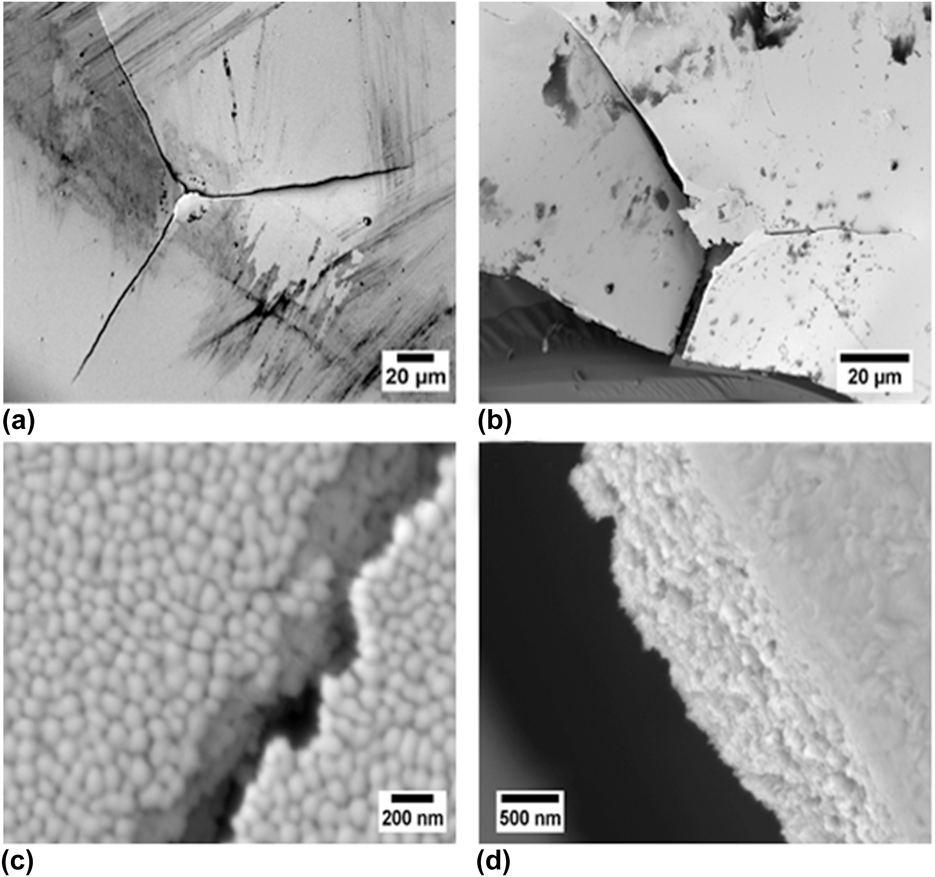
To confirm these observations, we did microindentation experiments at large displacements (>1 μm) on the Cu/Nb and Al/Nb multilayers on silicon substrates with a Berkovich indenter using the Hysitron TI 950 nanoindenter by Bruker Inc. The indents on the Cu/Nb multilayered film attached to the substrate observed extensive plastic deformation as seen in previous publications. However, when indented on a delaminated Cu/Nb film area, the film fractured in a brittle matter as shown in Fig. 4(a). Figure 4(c) exhibits the crack propagation path of the indentation crack along the grain boundaries of Cu/Nb multilayers similar to what was observed for the in situ bending test. For the Al/Nb multilayers, almost all the indents observed extensive plastic deformation. We could only break the multilayered film on the edge of the film–substrate boundary while including the fracture of the substrate as shown in Fig. 4(b). Figure 4(d) shows the crack from the Al/Nb microindent traveling transgranularly across the grains—a sign of ductility of the Al/Nb films.
Microindents on the (a) Cu/Nb and (b) Al/Nb PVD multilayered films with the resulting broken surfaces on (c) Cu/Nb and (d) Al/Nb multilayers, respectively.

These comparisons in the results have revealed that the fracture mode of the multilayered beams was strongly dependent on the interface/boundary of the multilayers. Three possible key factors are discussed: (i) effect of FCC constituents and their coupling with Nb, (ii) influence of the multilayer interface, and (iii) the columnar grain boundary effect on fracture mode.
Effect of FCC constituents and their coupling with Nb
The fracture of material is intrinsically a multiscale phenomenon starting with a close examination of the constituent elements, in particular, the FCC materials. Cu and Al have very different stacking fault energies [Reference Devlin45] of 71 mJ/m2 versus 145 mJ/m2. The increased resistance to crack growth can be correlated to lower stacking fault energy with the increased tendency to fracture by intergranular or twin boundary cracking [Reference McEvily and Boettner46]. Cui et al. [Reference Cui and Beom47] did MD simulations of Cu versus Al single crystal {100}(011) edge crack fracture under Mode I loading. They observed that for Cu system, the onset of cleavage fracture occurred immediately after maximum stress and dislocation emissions were not found at the crack tip. The concentration of stress was restrained near the crack tip. However, for the Al single crystal, a nanocrack was formed on the {111} plane from the original crack tip where the crack propagated via void nucleation and coalescence, leaving behind a zigzag step pattern. Although we are focused on Cu/Nb versus Al/Nb multilayer system, the brittle cleavage of Cu/Nb multilayers versus a ductile fracture with a crack formation of Al/Nb multilayers seems to be influenced by the FCC constituent.
Together with BCC Nb, the crystallographic relationship between these two elements affects the dislocation behavior across the interface. There are three {111} planes in Cu and five {110} planes in Nb that are nonparallel to the Cu/Nb interface plane. Only one set of {111} Cu and {110} Nb glide planes have a common intersection [i.e.,  ${\rm{Cu}}\left( {1\bar{1}1} \right)$ and Nb(101)] [Reference Wang, Hoagland, Hirth and Misra20] in the interface plane. Transmission of dislocations across the interface is tough with this slip discontinuity. A single mixed dislocation cannot cross the Cu/Nb interface at resolved shear stresses in excess of 1 GPa [Reference Wang, Hoagland, Hirth and Misra20, Reference Wang and Misra48]. Because of its low interfacial shear resistance, the Cu/Nb interfaces are sheared easily under the stress field of a glide lattice dislocation. These dislocations get attracted and trapped easily in the interface and spread.
For the Al/Nb interface, there is one parallel continuous slip plane in Al{111} and Nb{110} at 70.5° and 60° angles, respectively, because of the very small lattice mismatch of 0.05%. The dislocations in the Al/Nb multilayers will see less distortion as the dislocations propagate from one layer to the next layer. Al/Nb interfaces are found to be bad sinks for vacancies [Reference Kang, Wang and Beyerlein49] that allow dislocations to be easily transmitted through the interface. Thus, the plasticity of the Al/Nb multilayer beams during in situ beam bending fracture is more prevalent than that of the Cu/Nb multilayer.
Influence of multilayer interface
The plastic flow behavior of multilayers is controlled by the interactions of dislocations with the layer interface. Simulations performed by Hoagland et al. [Reference Hoagland, Hirth and Misra27, Reference Hoagland, Kurtz and Henager50] suggest that incoherent interfaces such as FCC–BCC multilayer systems present a strong barrier for slip transmission as compared to coherent interfaces. This strong barrier can be explained by the weak interface to shear or the geometric discontinuity of the slip systems. A gliding dislocation shears the interface easily, generating an attractive force on other glide dislocations. These dislocations spontaneously enter the interface, resulting in the dislocation core spreading. This description matches that of the Cu/Nb interface that has been proven from experiments [Reference Mara, Bhattacharyya, Dickerson, Hoagland and Misra18, Reference Mara, Bhattacharyya, Hirth, Dickerson and Misra19, Reference Budiman, Narayanan, Li, Wang, Tamura, Kunz and Misra28, Reference Mara, Bhattacharyya, Hoagland and Misra36] and simulations [Reference Wang, Misra, Hoagland and Hirth21, Reference Wang and Misra48, Reference Wang, Hoagland and Misra51]. However, for the FCC–BCC multilayer system with a very small lattice mismatch like Al/Nb multilayers, it behaves more like a coherent multilayer system with a strong interface to shear.
There is also the effect of the heat of mixing. From nanoindentation, it was found that the interface shear strength of FCC/BCC multilayers is increased with decreasing heat of mixing [Reference Anwar Ali and Budiman52]. Similarly, Wang et al. [Reference Wang, Misra, Hoagland and Hirth21, Reference Wang, Hoagland, Liu and Misra53] used tunable atomic potentials to simulate varied dilute heat of mixing on Cu/Nb multilayered system with the results of increasing interfacial shear strength with decreasing heat of mixing. Al/Nb multilayers have an estimated higher interfacial shear strength of 0.75 GPa over Cu/Nb multilayers of 0.5 GPa because of lower heat of mixing and flow strength [Reference Wang, Misra, Hoagland and Hirth21].
Based on these two factors, we have to consider the plasticity behavior of Cu/Nb and Al/Nb multilayers at the 20–25 nm length scale. At this length scale, single dislocation loops are confined along the individual nanolayers that deposit misfit-type dislocations at the interface and transfer load to the other, elastically deforming layer called the CLS [Reference Misra, Hirth and Hoagland14, Reference Misra and Hoagland54]. This process of forming arrays of Orowan-type single dislocation loops on one side of the interface before slip transfer in effect spreads the slip homogeneously in the layer and also leads to high work hardening.
During the in situ microfracture clamping beam bending experiment, all dislocations had to overcome a crack tip plastic zone, referred to a region ahead of the crack tip in which dislocations may be attracted back to the crack because of the image stress originated from the presence of the crack-free surface [Reference Hutchinson and Suo55, Reference Was and Foecke56]. The size and shape of the predefined notch or crack tip in the beams are small enough to be considered as ideal cracks [Reference Alfreider, Kozic, Kolednik and Kiener57, Reference Iqbal, Ast, Göken and Durst58, Reference Wurster, Motz and Pippan59]. This crack tip plastic zone area can be limited or large depending on the interface shear and barrier strength of the multilayered interface.
The dislocations at the crack tip front in the Al/Nb beams interact with the Al and Nb nanolayers easily without any hindrance by the neighboring interface. The slip continuity across the Al/Nb interface and lower interface barrier strength provided more opportunities for dislocation transmission. This results in little or no reduction in the plastic region ahead of the crack tip, limited only by the effective interface shield effect. This was seen for Cu/Ru multilayers [Reference Zhou, Zhang, Wei, Wang, Huang and Xu60]. Thus, the Al/Nb multilayers exhibit some signs of plasticity at the interface because of CLS dislocation plasticity mechanisms with displacement bursts, crack propagation before the final failure as seen in the Fig. SP1 before the final fracture.
On the other hand, the Cu/Nb beams exhibit a contrasting behavior. The Cu/Nb multilayer interface has a weak interface to shear and encourages dislocations to be “trapped” at the interface because of its large dislocation core spreading. If the first emitted dislocation is stopped at an adjacent interface located very close to the crack tip, it could exert a back stress on the next dislocation, effectively eliminating the plastic region ahead of the crack tip [Reference Hutchinson and Suo55, Reference Was and Foecke56]. As a result, the emission of the next dislocation becomes harder. Dislocations get annihilated, reducing the number of dislocations and prevents the crack from starting to blunt at the interface. This is observed in Figure 2(c) where the crack immediately propagated from the tip of the notch to across the full beam before the composite yield was reached. This behavior was also observed for Cu/Cr beams [Reference Zhang, Zhang, Liu, Zhang and Sun61, Reference Zhang, Liu, Zhang, Zhang, Sun and Ma62].
Influence of columnar grain boundary
The above factors assume that there is little or no influence of grain boundaries in the fracture. However, this is not the case. Grain boundaries become the main source of cracking when the strength of the grain boundaries is weak.
The Cu/Nb and Al/Nb PVD multilayers have mostly a columnar grain structure with their individual in-plane grain size roughly equal to the nanolayer thickness of 20 and 25 nm [Reference Misra and Hoagland1]. This value is small compared with the notch width of 120 nm. The fractography of Cu/Nb PVD multilayered film in Fig. 3(a) shows the availability of grain boundaries for the crack to extend. Both Cu and Nb layers had a small grain size, making it difficult to deform by dislocation sliding. The columnar grains in Cu and Nb layers are aligned, forming an almost perpendicular fracture path to the tip loading condition [Reference Mara, Bhattacharyya, Hoagland and Misra36]. Because of the stress concentration and a loss of the interface barrier at the crack tip, the deformation was confined to a local area, which severely limited the plasticity of both Cu and Nb layers. Because of the nonuniform cohesive strength of these boundaries, the sites of crack initiation became random, forming cavities at the fracture surface of the Cu/Nb beams as seen for Cu/Cr multilayered films [Reference Li and Zhang63].
Al/Nb has a higher stacking fault energy [Reference Li, Wang, Huang, Misra and Zhang22] of 165 mJ/m2 with a stronger interface to shear. Recent work by Xu et al. [Reference Xu and Dávila64] observed that there is no significant change in the mechanical properties of nanocrystalline Al influenced by grain boundaries and individual grain size above 13 nm. At the individual layer thickness of 25 nm in the present study, there is thus the minimal influence of the individual grains for the fracture of Al/Nb multilayers, which is evident from the fractography of the Al/Nb beams in Figs. 3(b) and 3(d). Instead, the dislocation plasticity mechanisms at the Al/Nb interface played a significant role in the formation of a crack at a much larger load with signs of small dislocation bursts till the final fracture.
The sputtering process may have introduced cavities and impurities along the grain boundaries [Reference Kern65]. Under an applied load, nanovoids from these cavities and impurities may nucleate and grow at the grain boundaries and triple junctions [Reference Ovid’Ko66, Reference Yang and Yang67]. The coalescence of these voids form microcracks that may connect to the main crack, resulting in a fracture. However, TEM observations of Cu/Nb [Reference Misra, Hirth and Hoagland14] and Al/Nb [Reference Li, Martin, Anderoglu, Misra, Shao, Wang and Zhang68] PVD multilayered films did not observe any grain boundary voids in the as-deposited films.
Conclusions
The investigation into the fracture behavior of Cu/Nb and Al/Nb multilayers made by PVD through in situ microfracture beam bending experiments has provided new insights into the influence of the interface on the mechanisms of plasticity and fracture. A brittle fracture was observed from the Cu/Nb PVD multilayered beams from a sudden catastrophic event, whereas a gradual ductile fracture was observed from the Al/Nb PVD multilayered beams. The slip systems between Cu/Nb and Al/Nb and their resulting interface played a role in the ease of dislocation transmission across the interface, influencing the fracture behavior. The Cu/Nb interface is a sink for dislocations, whereas the Al/Nb interface allows dislocations to flow freely across the interface.
Both Cu/Nb and Al/Nb multilayers have been shown to plastically deform through the CLS phenomenon at 20–25 nm individual layer thicknesses from previous experiments. However, in our experiments, the plasticity and fracture mode were modulated by the competition between the interface shear strength of the interface and grain boundaries. The plasticity mechanisms were activated only for Al/Nb multilayers as observed by the dislocation bursts before fracture. The presence of the weak columnar grain boundaries of Cu/Nb multilayers dominated the sudden brittle fracture of its beams. The present study provides useful insights into the influence of the constituent layer interface and grain boundaries to provide an optimum balance between high strength and resistance to fracture of metallic multilayers.
Experimental procedure
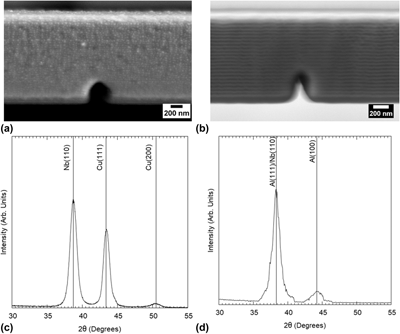
Direct current magnetron sputtering technique was used to synthesize the Cu/Nb and Al/Nb PVD multilayers on silicon substrates at room temperature [Reference Fu, Li, Misra, Hoagland, Wang and Zhang16, Reference Li, Wang, Huang, Misra and Zhang22, Reference Li, Wang, Misra and Huang23, Reference Mitchell, Lu, Nastasi and Kung43]. Alternating layers of Cu (or Al) and Nb of similar layer thickness (20 nm for Cu/Nb and 25 nm for Al/Nb) were grown up to the total film thickness of ∼1.5 µm (for Al/Nb) and 3 µm (for Cu/Nb). Both PVD multilayers were observed to have a good surface quality by SEM as shown in Figs. 5(a) and 5(b). X-ray diffraction (XRD) measurements were performed on the as-deposited multilayers using the Bruker D8 Discover by Bruker Inc. (Billerica, Massachusetts, USA) with Cu kα radiation. The resulting crystallographic orientation as shown in Figs. 5(c) and 5(d) is the Kurdjumov–Sachs (K–S) {111} Cu (or Al)‖{110} Nb [Reference Fu, Li, Misra, Hoagland, Wang and Zhang16].
A cross-sectional view of the (a) Cu/Nb multilayers and (b) Al/Nb multilayers by SEM after the fabrication of the microbeams. The notch dimensions are slightly varied because of FIB fabrication but are still within the acceptable dimensions for beam bending experiments. XRD spectra of the (c) Cu/Nb and (d) Al/Nb multilayers are measured, indicating the Kurdjumov-Sachs (K-S) orientation at the interface.

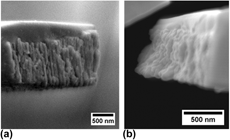
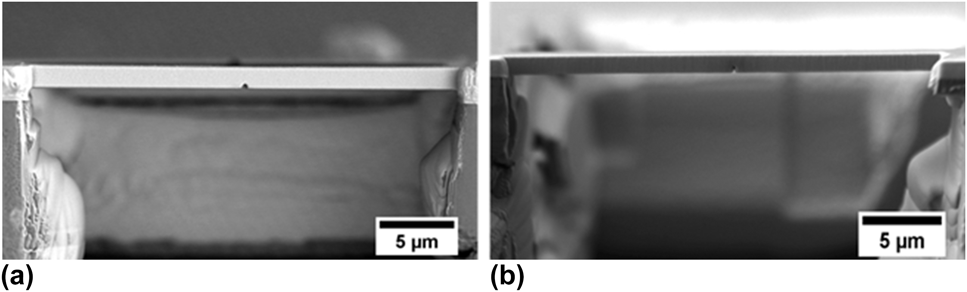
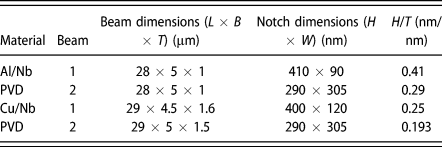
The microbeams were fabricated using the FEI Nova NanoLab dual-beam focused ion beam (FIB) tool at the Nanyang Technological University (NTU), Singapore. A clamped beam geometry was chosen for easy fabrication and preference for a controlled fracture under plane strain conditions with the maximum principal stress acting along the line connecting the notch tip and indenter. The silicon substrate was first milled from the edge to free the film from the substrate. A 30 kV beam with a higher current for rough cuts and lower current for finer cuts was used to mill the sample further to the original beams. Quick milling across the beam was done to create the center notches at 10 pA. Figure 6 shows the final Al/Nb and Cu/Nb beams after FIB milling. The dimensions of the beams were measured using the JEOL field emission scanning electron microscope (FESEM) (JSM-7600F, JEOL Ltd., Tokyo, Japan). The resulting dimensions of both fabricated Al/Nb beams (L × B × T) are 28 × 5 × 1 µm. Slight differences in the beam dimensions of 29 × 4.5 × 1.6 µm (Beam 1) and 29 × 5 × 1.5 µm (Beam 2) were seen for the Cu/Nb beams. These dimensions are also summarized together with the notch dimensions in Table I.
Cross-sectional view of the (a) Cu/Nb and (b) Al/Nb PVD beams with the dimensions of (a) L = 29 µm, W = 5 µm, and T = 1.5 µm and (b) L = 28 µm, W = 5 µm, and T = 1 µm.

Geometries of the beams used in this study.

The in situ microfracture experiments of clamped beam bending were performed inside the JEOL FESEM (JSM-7600F) using the Hysitron PI 85 SEM PicoIndenter (Bruker Inc.) with a 20 mN maximum load transducer. Two beams were tested for each material system and were loaded using a conical flat tip of 5 µm diameter at a constant displacement rate of 5 nm/s. Care was taken to consider thermal drift in the measurements. The final load–displacement data and the real-time video of the experiments were synchronized using a frame grabber with the Hysitron TriboScan software (Bruker Inc., USA).
Supplementary material
To view supplementary material for this article, please visit https://doi.org/10.1557/jmr.2018.449.
Acknowledgments
The authors would like to thank Dr. Liu Qing of Temasek Labs, Nanyang Technological University (NTU), Singapore, for his services with the fabrication of the microbeams for the experiments. The PVD samples were made, in part, at the Center for Integrated Nanotechnologies, an Office of Science User Facility operated for the U.S. Department of Energy (DOE) Office of Science. Los Alamos National Laboratory, an affirmative action equal opportunity employer, is managed by Triad National Security, LLC for the U.S. Department of Energy's NNSA, under contract 89233218CNA000001. This work is also funded by the Singapore-MIT International Design Center (IDC), Singapore, under contract IDG31400102.