Introduction
Sarvodaite, Al2(SO4)3·5H2O, a new mineral, was discovered in the sublimates of a natural underground coal fire in the upper reaches of the Kukhi-Malik tract in the Ravat area of the Fan-Yagnob coal deposit, Tajikistan. The new mineral is named after the ancient Sarvoda fortress, the remains of which are situated in the vicinity of the place where sarvodaite was found, the village of Zeravshan-Sarvoda. In the Middle Ages, this fortress served as an outpost on the route to the ‘burning mines’, which were referred to by various names at different eras (Kan-Tag, Ravat, Kukhi-Malik). The region was the source of the extraction of ammonia, native sulphur, potassium nitrate, alum, and iron sulfate from ancient times until the mid-40s of the 20th Century. These minerals were employed in the production of gunpowder, the fertilisation of vineyards, the processing of leather, and the production of medicine. In the Sarvoda fortress, the sublimations were processed by local residents (Ermakov, Reference Ermakov1935; Novikov and Suprychev, Reference Novikov and Suprychev1986). The mineral and its name (symbol Svd) were approved by the Commission on New Minerals, Nomenclature and Classification of the International Mineralogical Association (CNMNC IMA) (IMA 2023-073, Makhmadsharif et al., Reference Makhmadsharif, Pautov, Siidra, Mirakov, Karpenko and Shodibekov2024). The holotype of the sarvodaite under investigation is housed in the collections of the Fersman Mineralogical Museum (Moscow), with the reference number 6041/1.
A comprehensive analysis of crystallographic characteristics of all known hydrated aluminium sulfates, including those containing OH groups, was recently described in Mauro et al. (Reference Mauro, Biagioni, Sejkora, Dolníček and Škoda2023). Alunogen, Al2(SO4)3·17H2O and meta-alunogen, Al2(SO4)3·12H2O are the only two known to date natural hydrous aluminium sulfates that do not contain additional cations and anions. Monoclinic Al2(SO4)3·5H2O is a synthetic analogue of sarvodaite that was synthesized by evaporating a mixture of Al2(SO4)3·7H2O with sulfuric acid and subsequently subjecting the products to hydrothermal treatment in an autoclave at a temperature of 180°C (Fischer et al., Reference Fischer, Eisenmann and Kniep1996). Witzke et al. (Reference Witzke, de Wit, Kolitsch, Blass, Stracher, Prakash and Sokol2015) reported the discovery of a phase with the composition Al2(SO4)3·5H2O in a dense, white, pumice-like aggregate of godovikovite–millosevichite from the dumps of the Burning Anna I Coal Mine Dump in Alsdorf, Germany.
Occurrence
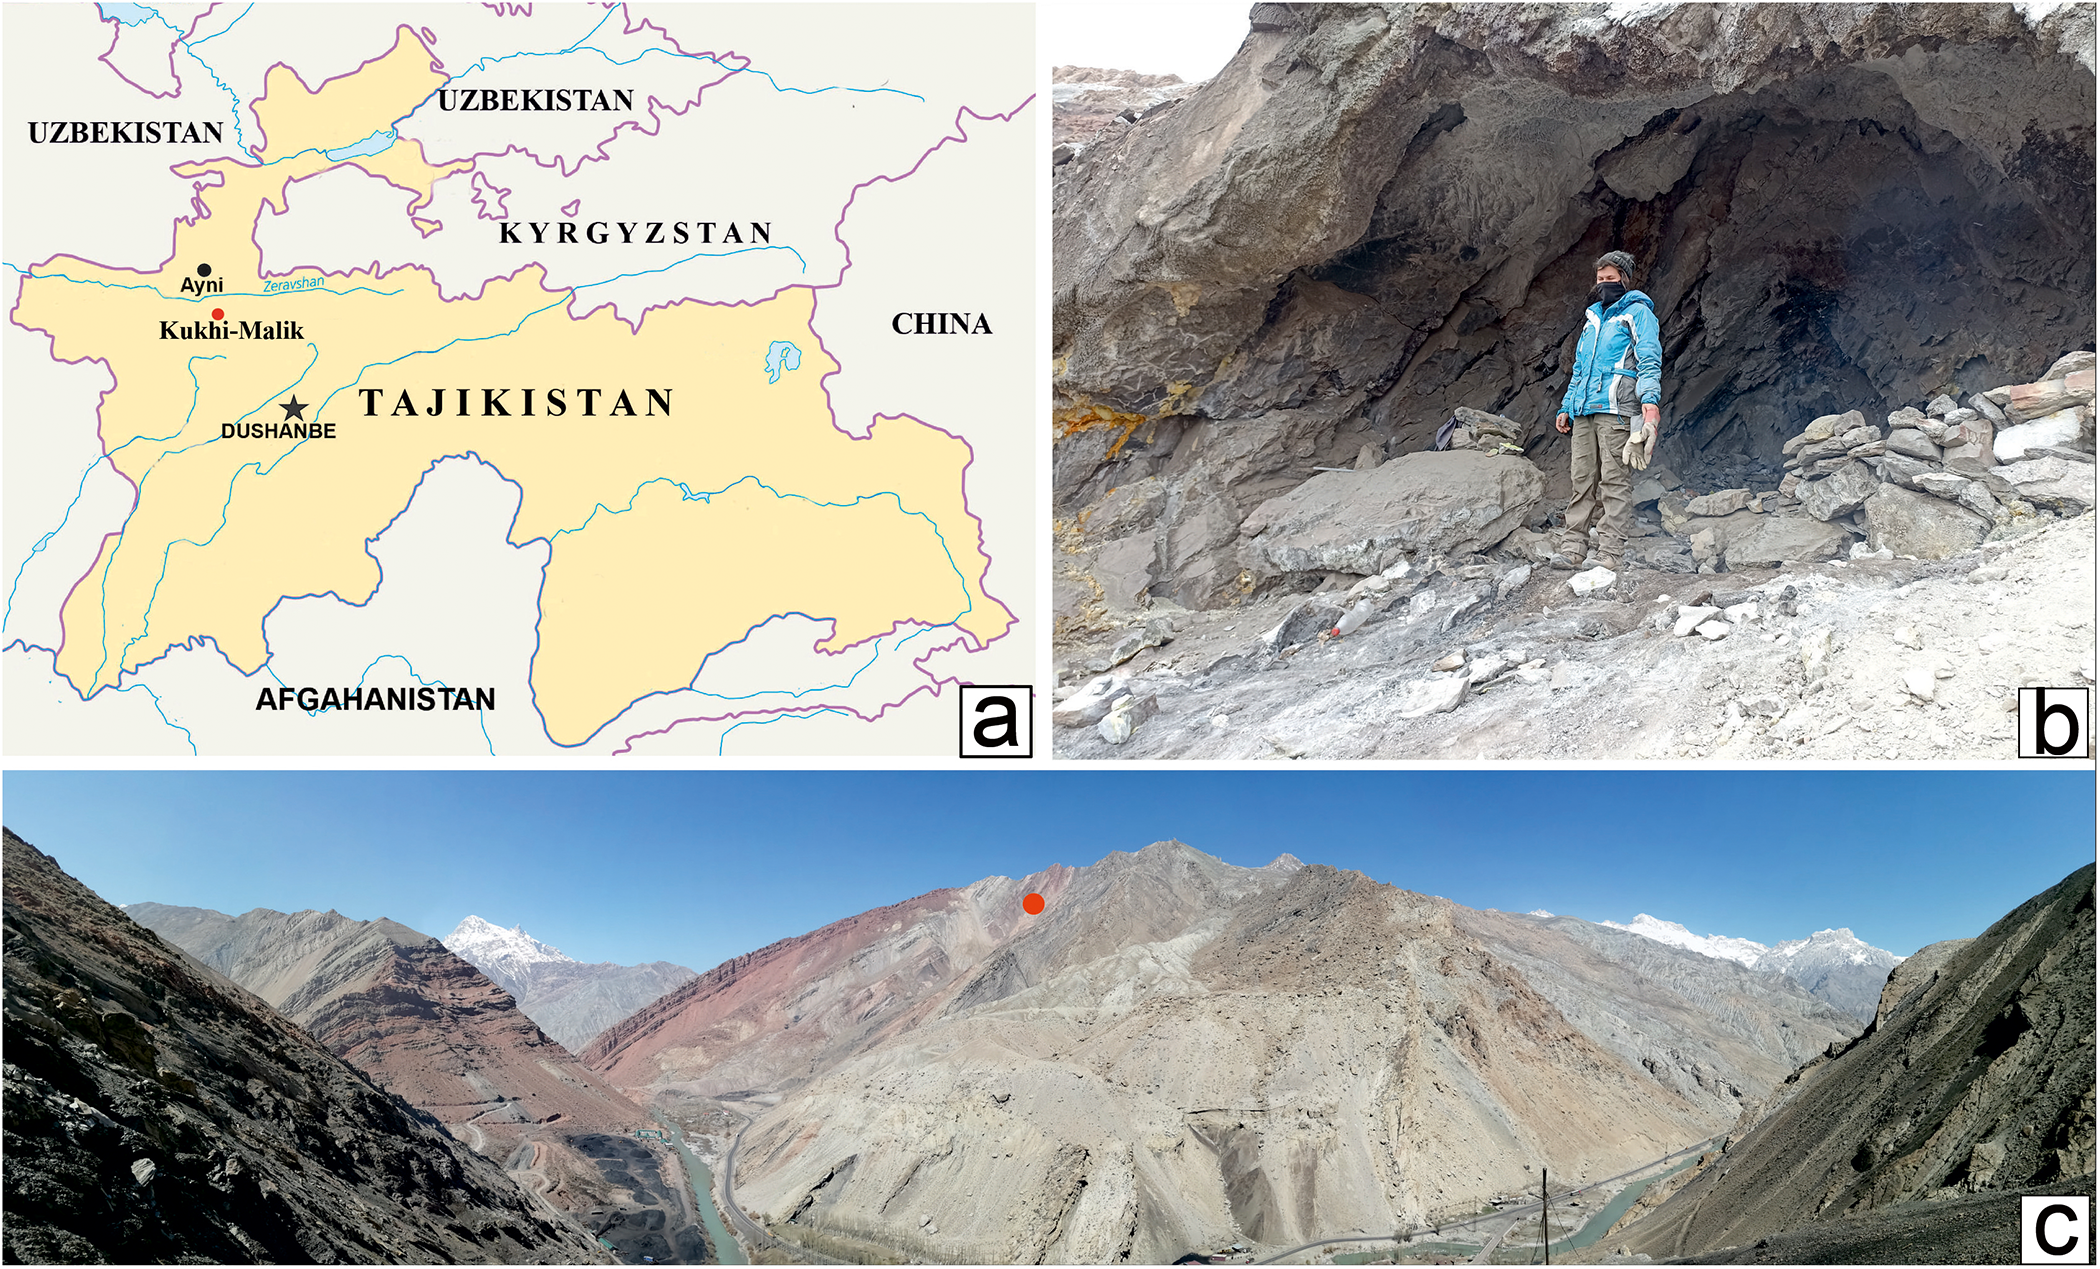
Sarvodaite was found in sublimates during fieldwork in 2023. The mineral was discovered in the upper reaches of the Kukhi-Malik tract (Fig.1a-c) on the right bank of the Fan Darya River (39°12′25”N, 68°33′59”E) in the contours of the Fan-Yagnob coal deposit, where hot coal gases were released from an underground fire in the ‘Big Grotto’ gas vent (Fig. 1b). Sarvodaite was discovered on the walls of a crack in burnt sandstones. The temperature of the gas flow was in the range from 100 to 220°C. All samples were immediately sealed in glass tubes upon their collection to prevent any potential exposure to the external environment. Within the Fan-Yagnob coal deposit, which spans ∼10 hectares on both the left and right banks of the Fan Darya River, natural underground coal fires are common. Along with the over 200 gas vents that are currently active, there are numerous outlets for coal combustion products, as well as new fire areas that are established annually. The natural underground fire at Ravat is believed to have been ongoing for over 2000 years (Novikov and Suprychev, Reference Novikov and Suprychev1986). Presently, industrial coal mining is conducted on the left riverbank, while manual mining is conducted on the right side, with a length of 400 metres. Predominantly, low-temperature sublimations associated with a near-surface coal fire are observed on the left bank of the river. The primary products are sulphur, ammonia, alum, sulfuric acid that impregnates the soil, and a variety of organic compounds with relatively low crystallization temperatures, such as ravatite (Nasdala and Pekov, Reference Nasdala and Pekov1993), which produce a distinctive pungent odour in sublimates. Areas on the right bank of the Fan-Darya River in the upper reaches of the Kukhi-Malik tract are characterized by the higher sublimate formation temperatures. Paralavas, sedimentary rock melting products, are abundant in the Ravat area of the deposit (Sharygin et al., Reference Sharygin, Sokol and Belakovski2009). Numerous publications have reported the mineralogy of sublimates from natural underground coal fires at the Fan-Yagnob deposit (Ermakov, Reference Ermakov1935; Novikov et al., Reference Novikov, Suprychev and Babayev1979; Belakovski, Reference Belakovski1990; Mirakov et al., Reference Mirakov, Pautov, Karpenko, Faiziev and Mahmadsharif2019; Pautov et al., Reference Pautov, Mirakov, Siidra, Faiziev, Nazarchuk, Karpenko and Makhmadsharif2020; Karpenko et al., Reference Karpenko, Pautov, Siidra, Mirakov, Zaitsev, Plechov and Makhmadsharif2023; Mirakov et al., Reference Mirakov, Pautov, Siidra, Makhmadsharif, Karpenko and Plechov2023).
(a) Location of Kukhi-Malik. (b) The ‘Big Grotto’ gas vent where sarvodaite was found. (c) The panorama depicts the right side of the river Fan-Darya, with a view of Kukhi-Malik (marked with a red circle). The village of Ravat is visible below, and the snow-covered Fann Mountains are in the background.

Figure 1 Long description
A) A map of Central Asia highlighting Tajikistan, with Kukhi-Malik and Dushanbe marked. Surrounding countries include Uzbekistan, Kyrgyzstan, China and Afghanistan. B) A person stands at the entrance of a rocky cave, identified as the ′Big Grotto′ gas vent. C) A panoramic view of the Fan-Darya River area, showing rugged terrain with a red circle marking Kukhi-Malik. Snow-covered mountains are visible in the background.
Associated minerals and physical properties
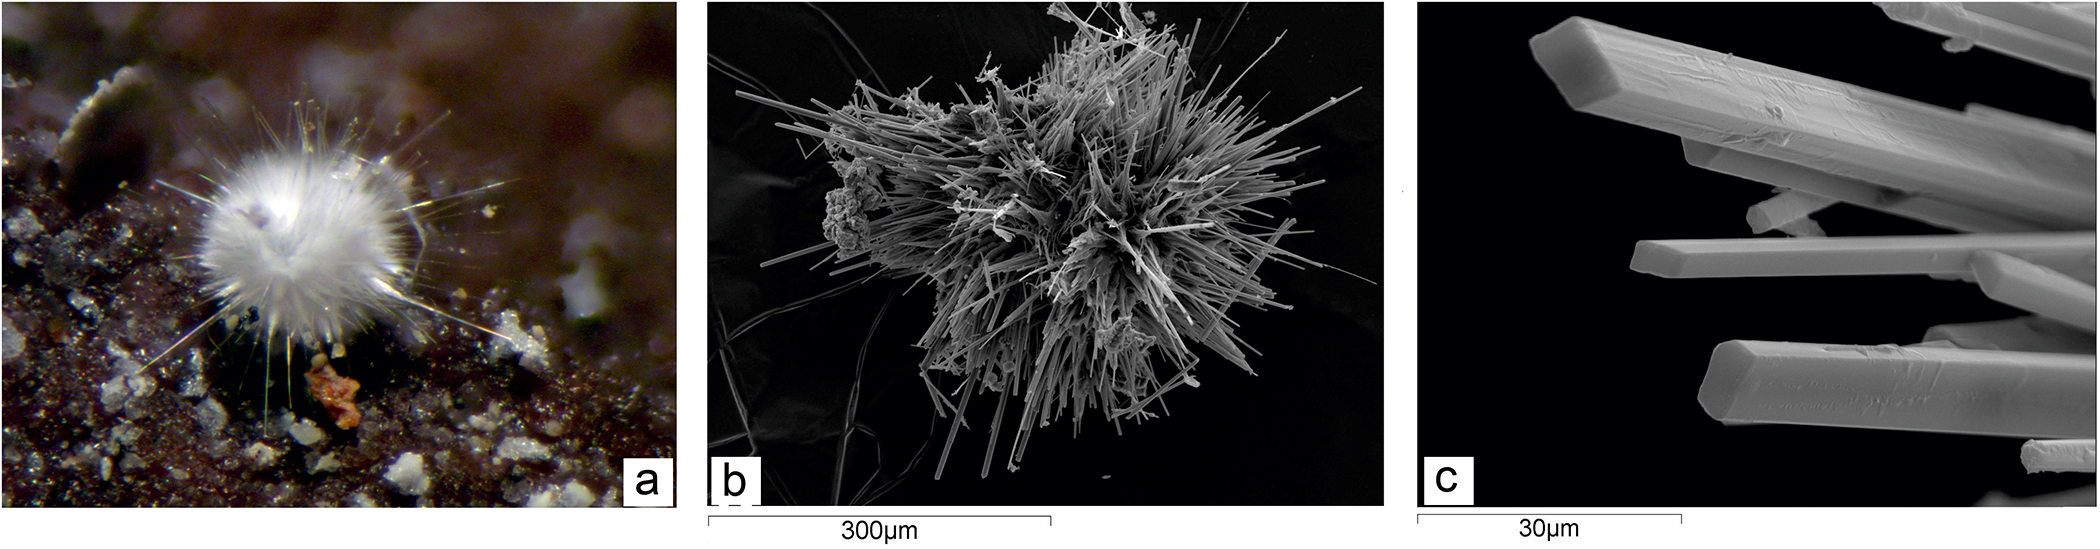
Associated minerals are anhydrite, realgar, native selenium and several unknown phases. Sarvodaite typically occurs as white spherulites (Fig. 2a,b) of thin colourless prismatic crystals (Fig. 2c) up to 500 μm in maximum dimension. The streak is white. The lustre is vitreous. Sarvodaite is brittle. Cleavage is perfect on {100}. The fracture is splintery. Hardness is 1–1½. The tiny size of the crystals makes it impossible to measure the microhardness. Tiny sarvodaite crystals display cracks that are parallel to their elongation; these cracks may be misinterpreted as the intergrowth planes of multiple crystals or a cleavage.
A white sarvodaite spherulite (field of view 1.8 mm) (a). SEM images of a sarvodaite spherulite (b) and prismatic crystals (c).

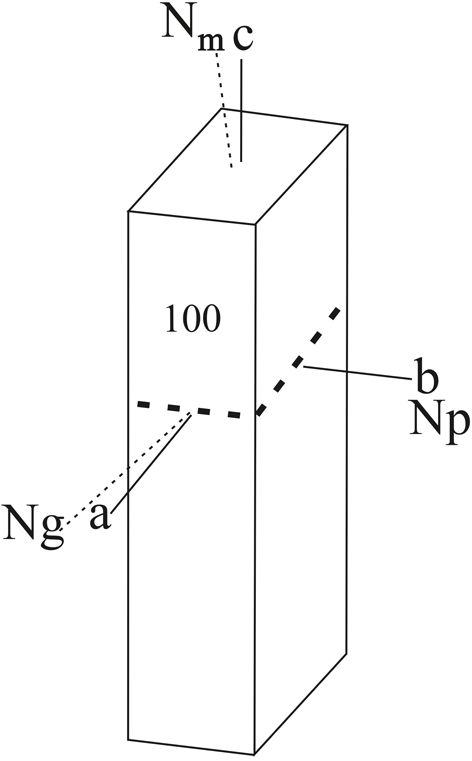
Sarvodaite is optically biaxial (–/+ unclear) (Fig. 3), α = 1.529(2), β = 1.537(2), γ(calc.) = 1.545(3) (590 nm), and the measured 2V is 90(3)°. The mineral shows straight extinction on sections with positive elongation, while the extinction is oblique on sections with negative elongation (C:Nm = 10°). Dispersion is weak, r > v. The mineral is non-pleochroic under the microscope. The measured density is 2.33(2) g/cm3. The density calculated based on the empirical formula of the holotype is 2.349 g/cm–3. The Gladstone-Dale compatibility index, 1 – (Kp/Kc) = –0.010, is superior.
The optical orientation of the sarvodaite crystal. The plane of the optical axes is depicted by the dotted line.

Infrared and Raman spectroscopy
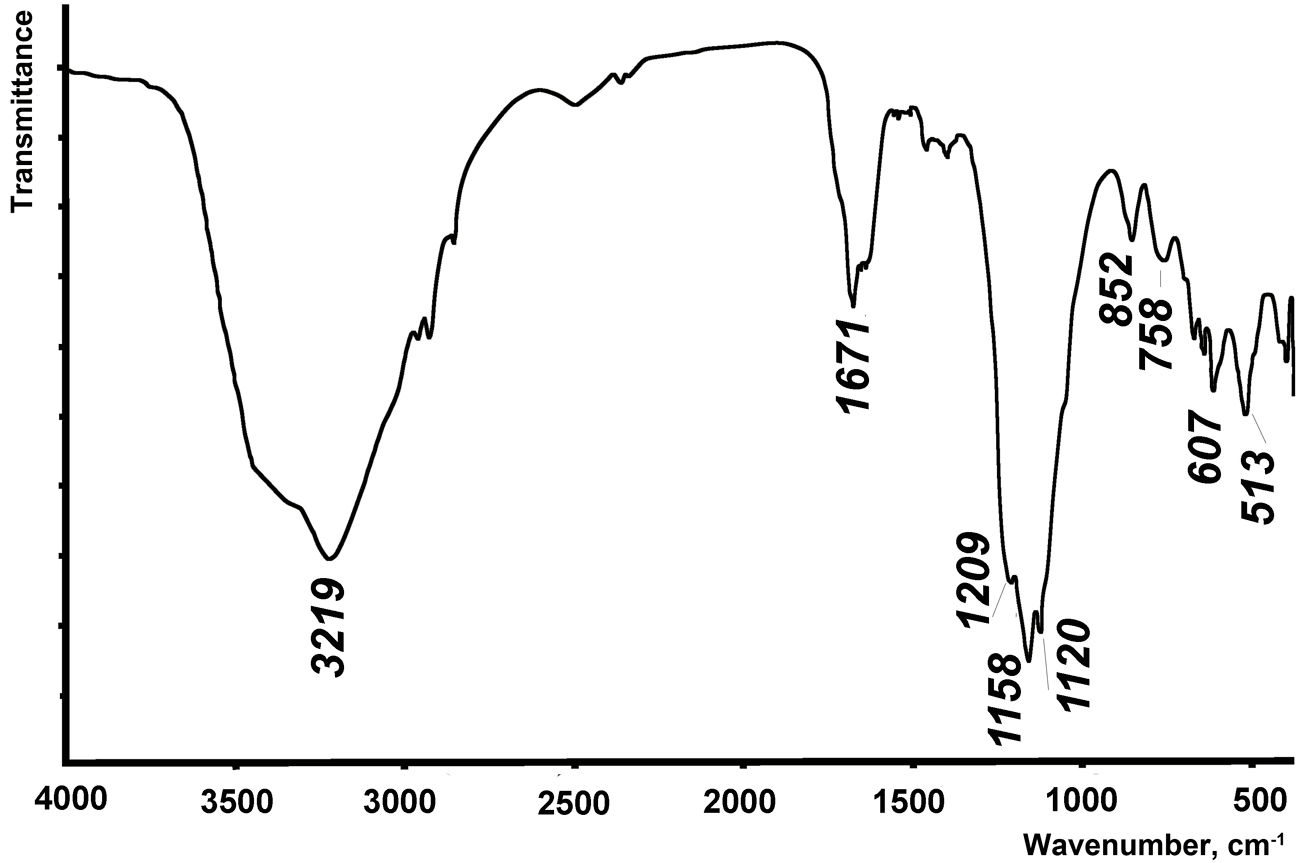
The IR spectrum of sarvodaite (Fig. 4) was obtained from a KBr microtablet using an FSM 2201 Fourier transform IR spectrometer (Infraspec, Russia). Four regions of bands are observed in the IR spectra of sarvodaite: (1) an intensive and broad absorption band with many shoulders in the 2900–3500 cm–1 region corresponding to stretching vibrations of water molecules; (2) an intense band at 1600–1700 cm–1 corresponding to deformation vibrations in water molecules; (3) several intensive bands in the 900–1300 cm–1 range associated with stretching vibrations of the sulfate group; and (4) a number of bands in the 400–700 cm–1 region associated with deformation vibrations of the sulfate group, respectively. Bands at 758 and 852 cm–1 may be attributed to Al–O vibrations (Kloprogge et al., Reference Kloprogge, Ruan and Frost2001; Košek et al., Reference Košek, Culka, Žáček, Laufek, Škoda and Jehlička2018).
IR spectra of sarvodaite. Peaks are labelled at 3219, 1671, 1209, 1158, 1120, 852, 758, 607 and 513 cm–1.

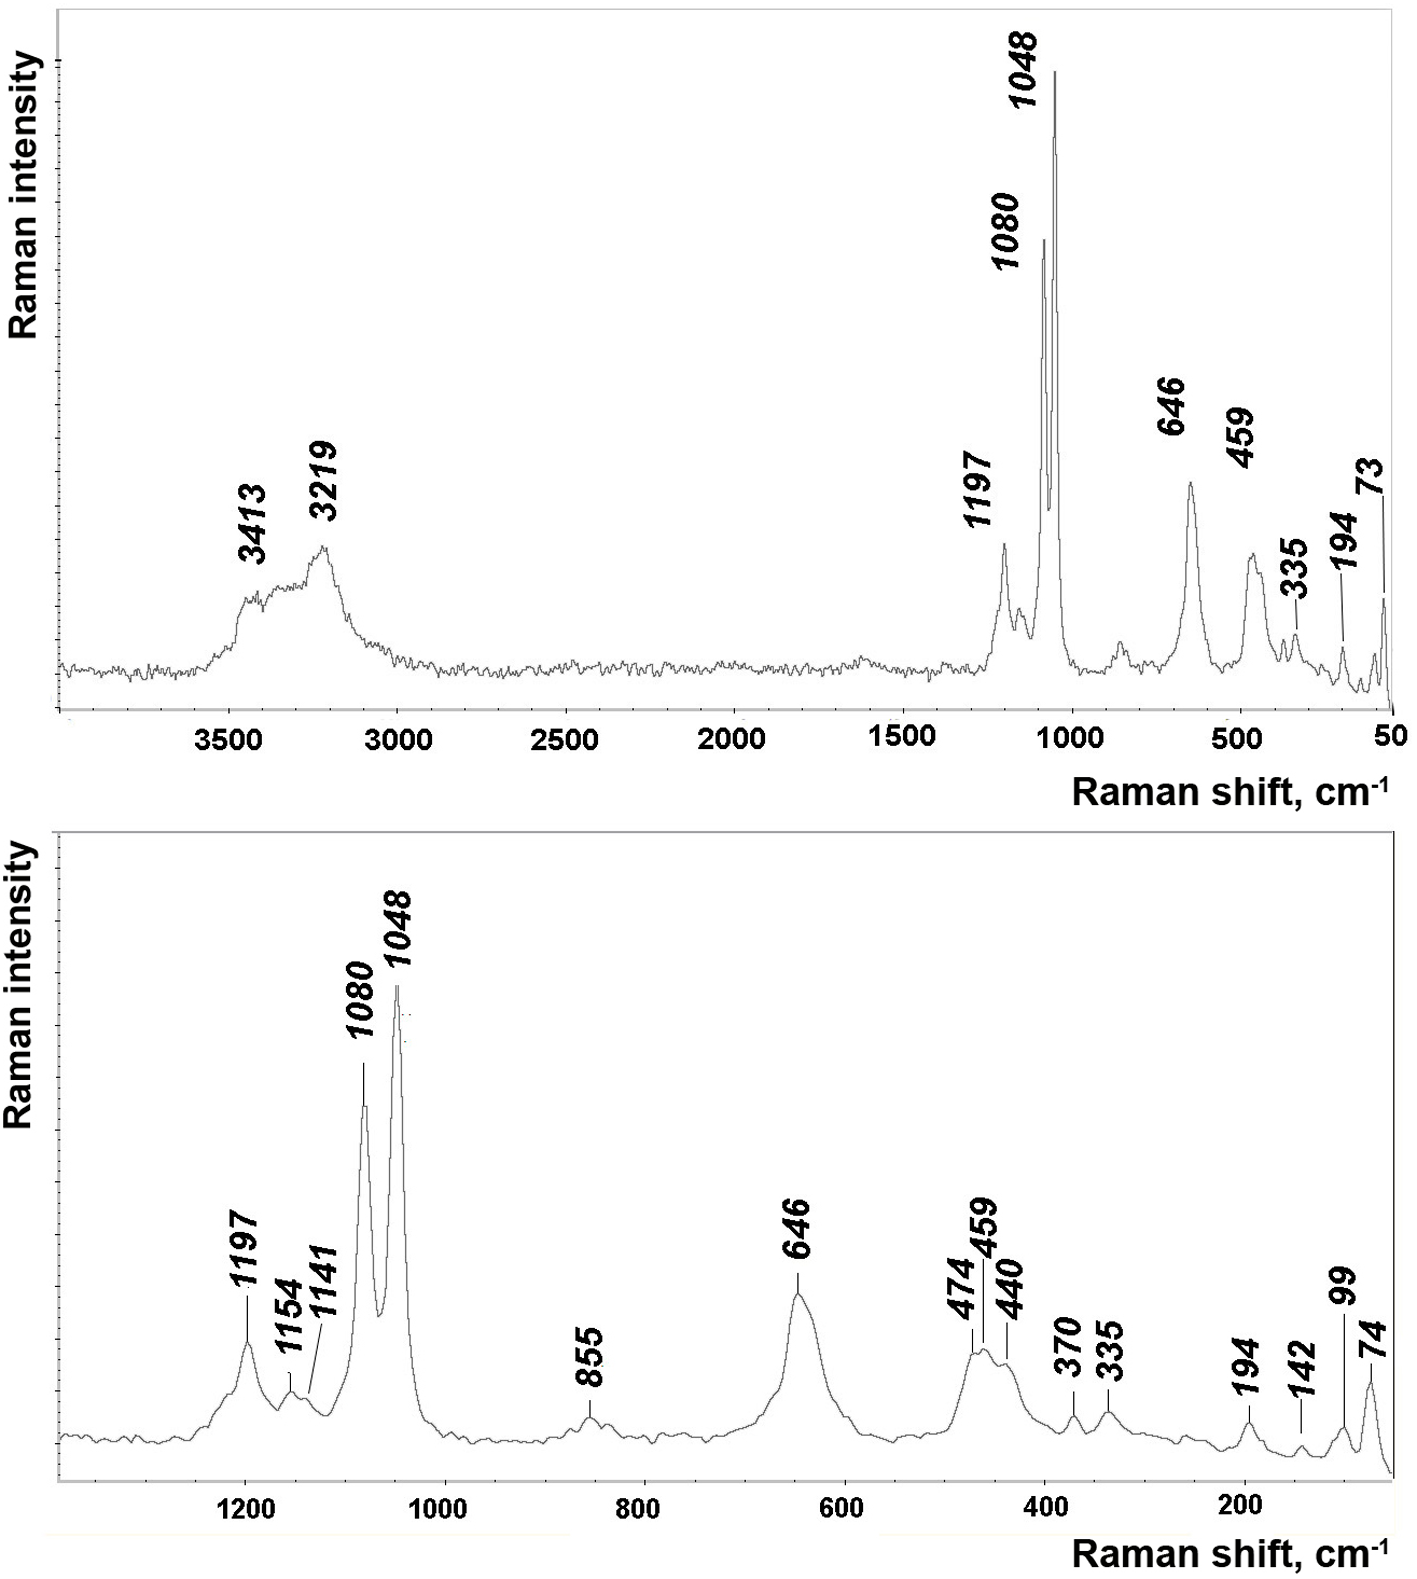
The Raman spectra (Fig. 5) were obtained on a sarvodaite single crystal that was extracted from the sample for the single-crystal X-ray study. The following are the instruments and analysis parameters: DXR2xi Thermo Scientific Raman Imaging Microscope in the range of 6000 cm–1 to 50 cm–1 using 2 cm–1 resolution, 25 µm pinhole aperture, grating of 400 lines/mm, and scan time of 0.5 s with 40 scans. In order to protect the sample from destruction, a laser with a wavelength of 532 nm was used at 70% power at the sample (7 mW). The sample surface did not sustain any damage. Identical Raman spectra were obtained from four different areas of the crystal surface. The Si standard was used for the calibration. The tentative assignment of Raman bands was performed using available data for alunogen Al2(SO4)3·17H2O and other Al-sulfates (Frost et al., Reference Frost, Scholz, Lima and López2015; Košek et al., Reference Košek, Culka, Žáček, Laufek, Škoda and Jehlička2018, Reference Košek, Culka, Rousaki, Vandenabeele and Jehlička2022). Bands in the region 3200–3450 cm–1 can be assigned as O-H stretching vibrations of water molecules. In the obtained Raman spectra, the ν1 and ν3 sulfate modes are assigned to narrow bands in the range 1200–1000 cm–1, the ν4 sulfate mode is assigned to 646 cm–1, and the ν2 modes are assigned to a series of non-intensive bands in the range 400–500 cm–1. Lattice vibrations are responsible for weaker bands in the range of less than 400 cm–1.
Raman spectra of sarvodaite. Detail for peaks in the range 1200-100 cm–1 is given in the lower graph.

Chemistry
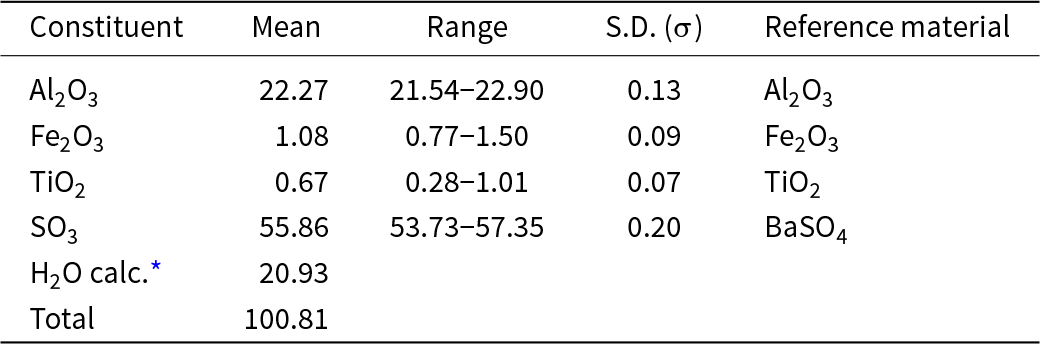
Crystals of sarvodaite were mounted in epoxy resin and polished. The composition of sarvodaite (Table 1) was studied using a Superprobe JCXA-733 scanning electronic microscope equipped with an Oxford Instruments INCA Energy Dispersive Spectrometer (EDS) and JCXA-733 (JEOL) analyser with a Si-(Li) detector with ATW2 ultrathin window and INCA Energy 350 analysis system (20 kV accelerating voltage, 0.5 nA electron beam current measured with a Faraday cup and a beam of 10 μm were used for the analysis). BaSO4 (SKα), TiO2 (TiKα), Fe2O3 (FeKα) and Al2O3 (AlKα) were used as standards.
Chemical data (in wt.%) for sarvodaite

Table 1 Long description
Chemical constituents are reported in weight percent with columns for Mean, Range, S. D. sigma, and Reference material. Al2O3 has a mean of 22.27 with a range from 21.54 to 22.90 and S. D. 0.13, reference material, Al2O3. Fe2O3 has a mean of 1.08 with a range from 0.77 to 1.50 and S. D. 0.09, reference material, Fe2O3. TiO2 has a mean of 0.67 with a range from 0.28 to 1.01 and S. D. 0.07, reference material, TiO2. SO3 has a mean of 55.86 with a range from 53.73 to 57.35 and S. D. 0.20, reference material, BaSO4. H2O calc. marked with an asterisk has a mean of 20.93 with no range, no S. D., and no reference material listed. Total has a mean of 100.81 with no range, no S. D., and no reference material listed.
* based on structural data; S.D. – standard deviation
The empirical formula calculated on the basis of 17 O atoms per formula unit is (Al1.88Fe0.06Ti0.04)Σ1.98S3.01O12·5H2O. The simplified formula is (Al,Fe)2(SO4)3·5H2O. The ideal formula is Al2(SO4)3·5H2O, which requires Al2O3 23.59; SO3 55.57; H2O 20.84; total 100 wt.%.
The mineral is non-soluble in water and ethanol. Sarvodaite dissolves slowly at room temperature in HCl 1:1.
Crystallography
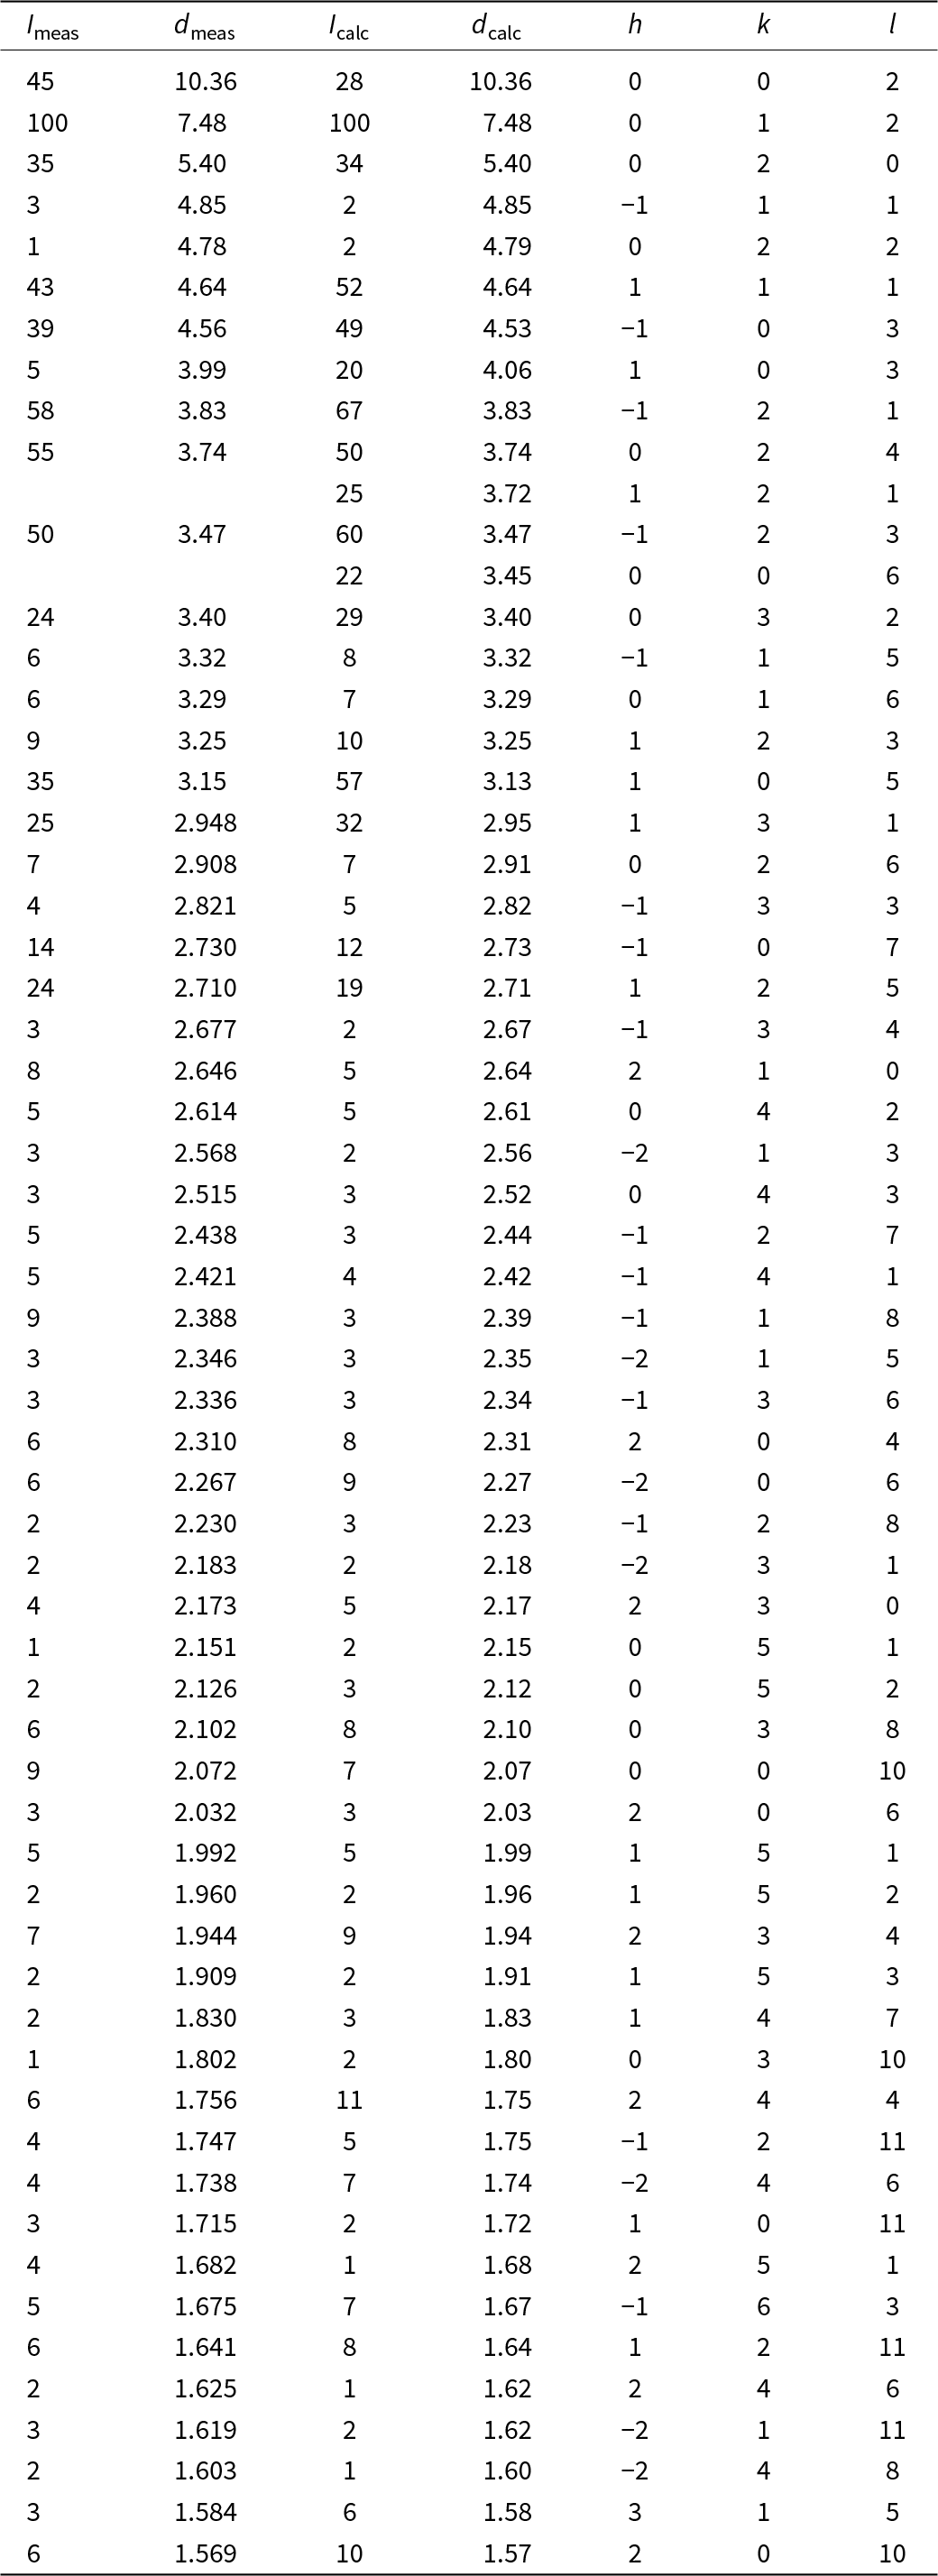
Powder X-ray diffraction data were collected using CrKα radiation with a V-filter in a RKU-86 camera; Ge was used as an internal standard. The results are given in Table 2. Unit-cell parameters refined from the powder data are as follows: monoclinic, a = 5.48(2), b = 10.803(5), c = 20.84(1) Å, β = 96.42(3), and V = 1227(1) Å3. MID-2 software was used to refine the unit-cell parameters.
X-ray powder diffraction data (d in Å) for sarvodaite. Seven strongest lines are marked in bold

Table 2 Long description
Columns list Imeas and dmeas, plus Icalc and dcalc, with Miller indices h, k, and l for each line. Measured intensities range from 1 to 100, and measured d spacings run from 10.36 to 1.569 angstroms. The highest Imeas is 100 at dmeas 7.48 angstroms with Icalc 100 and dcalc 7.48, indexed h 0, k 1, l 2. Other high Imeas values include 58 at dmeas 3.83 with Icalc 67 and indices minus 1, 2, 1; 55 at dmeas 3.74 with Icalc 50 and indices 0, 2, 4; 50 at dmeas 3.47 with Icalc 60 and indices minus 1, 2, 3; 45 at dmeas 10.36 with Icalc 28 and indices 0, 0, 2; and 43 at dmeas 4.64 with Icalc 52 and indices 1, 1, 1. Two rows provide only calculated values: Icalc 25 at dcalc 3.72 with indices 1, 2, 1, and Icalc 22 at dcalc 3.45 with indices 0, 0, 6. Across the rows, dmeas and dcalc are often identical or close, such as 4.85 matching 4.85 and 2.710 matching 2.71, with some small differences like dmeas 4.56 versus dcalc 4.53 and dmeas 3.99 versus dcalc 4.06. The smallest listed spacing is dmeas 1.569 angstroms with Imeas 6, Icalc 10, dcalc 1.57, and indices 2, 0, 10.
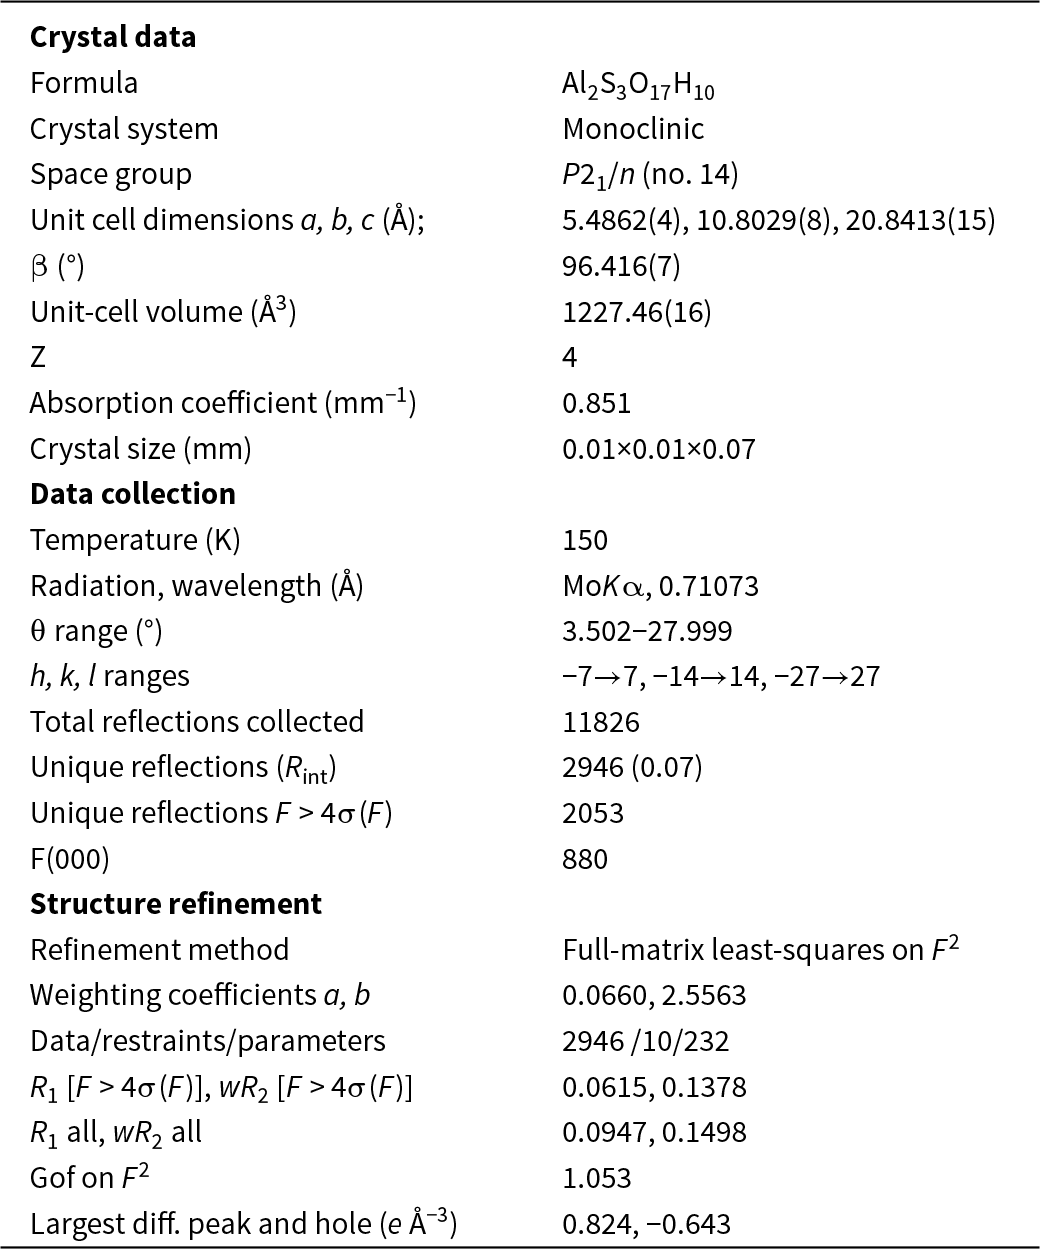
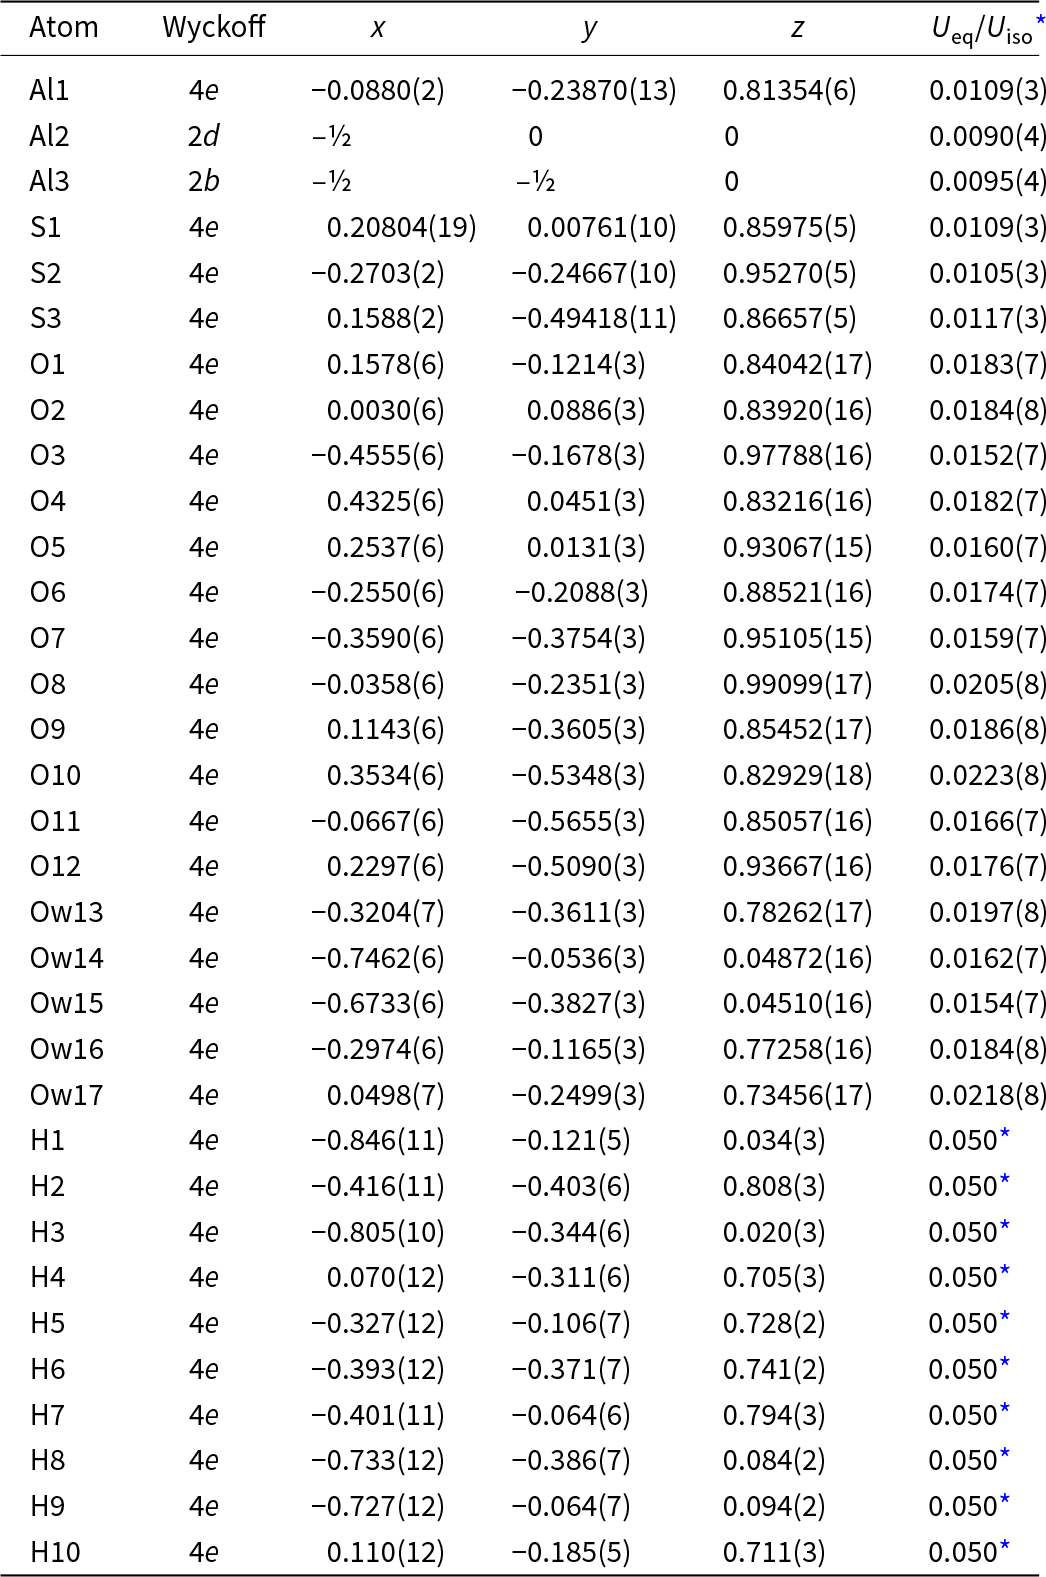
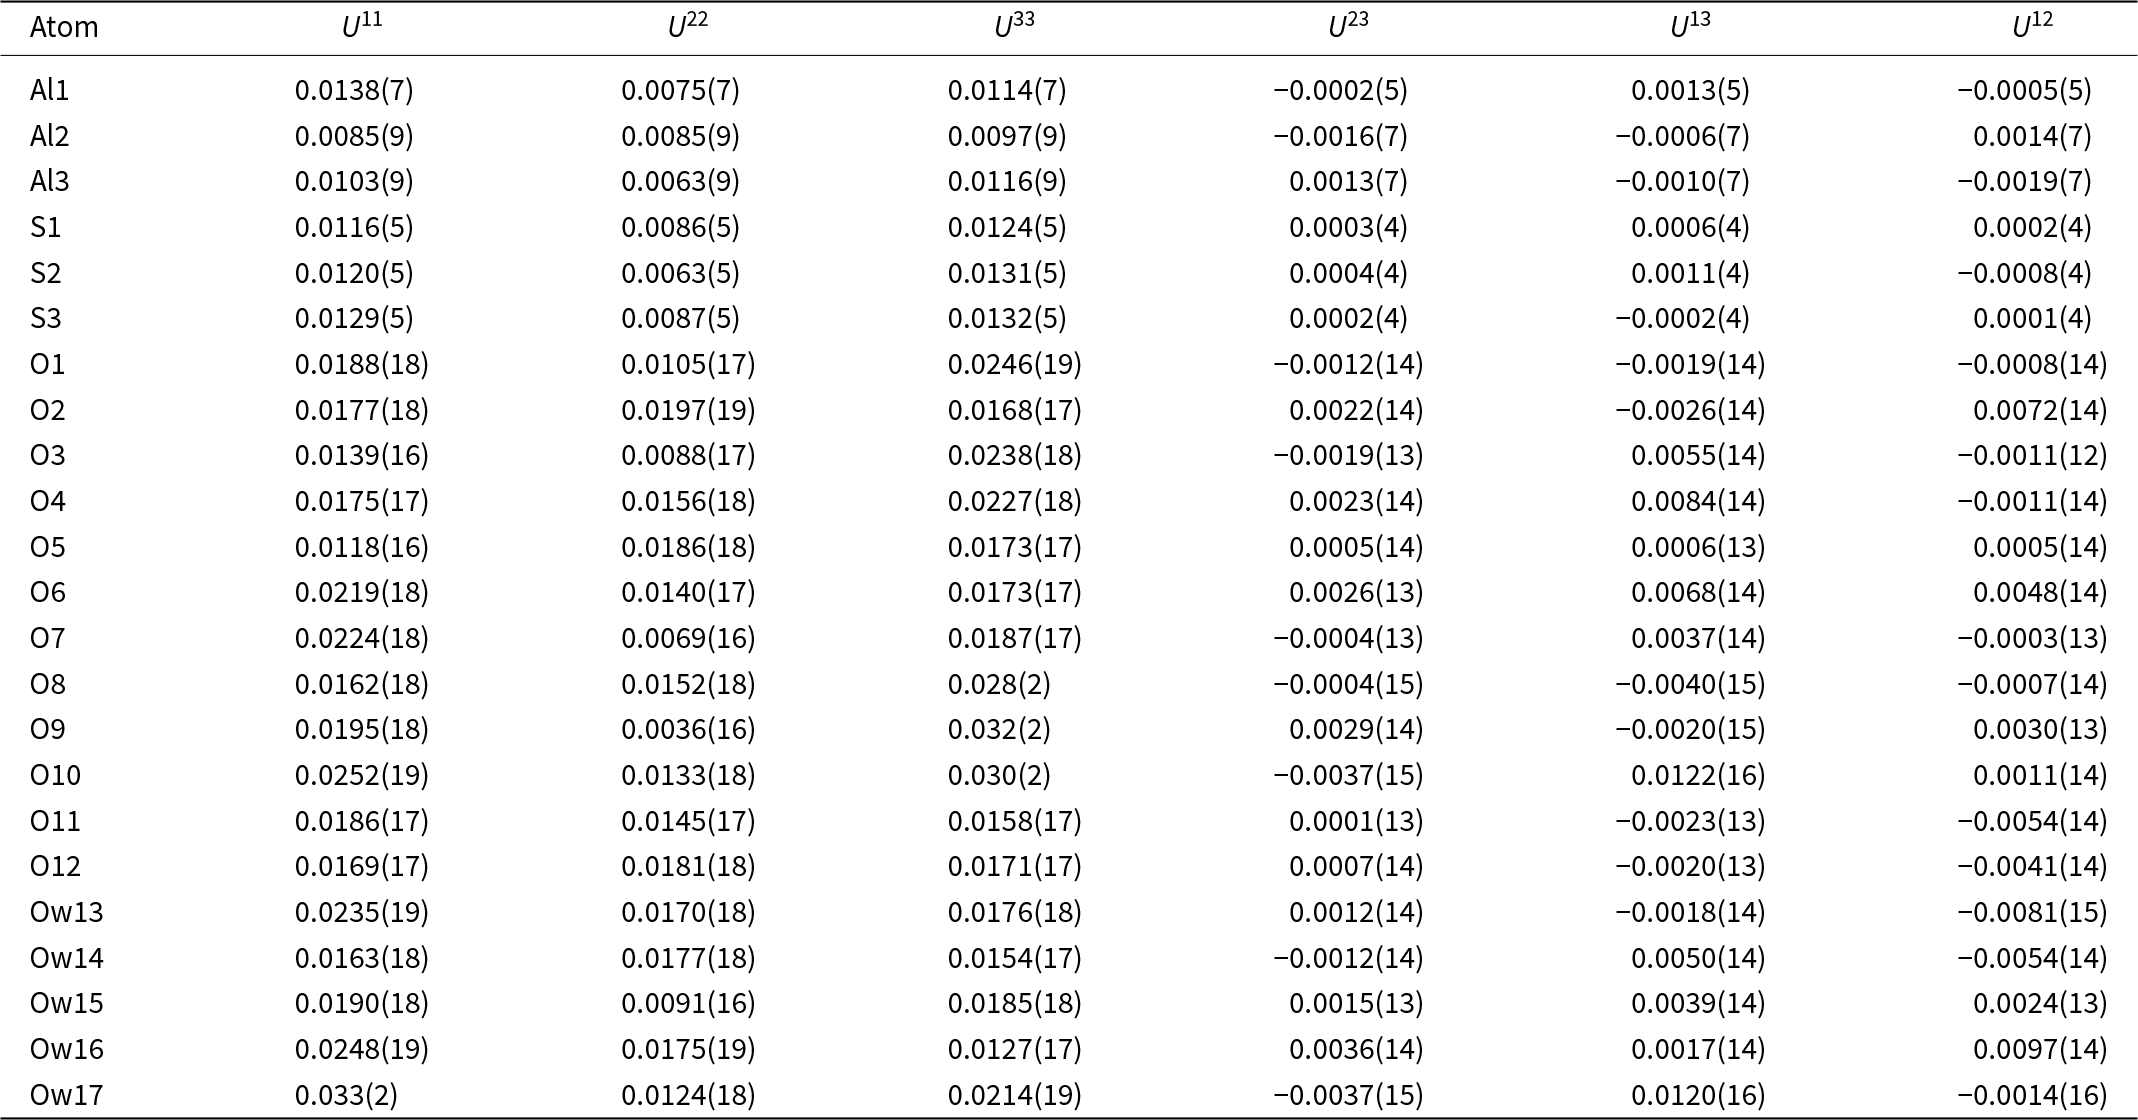
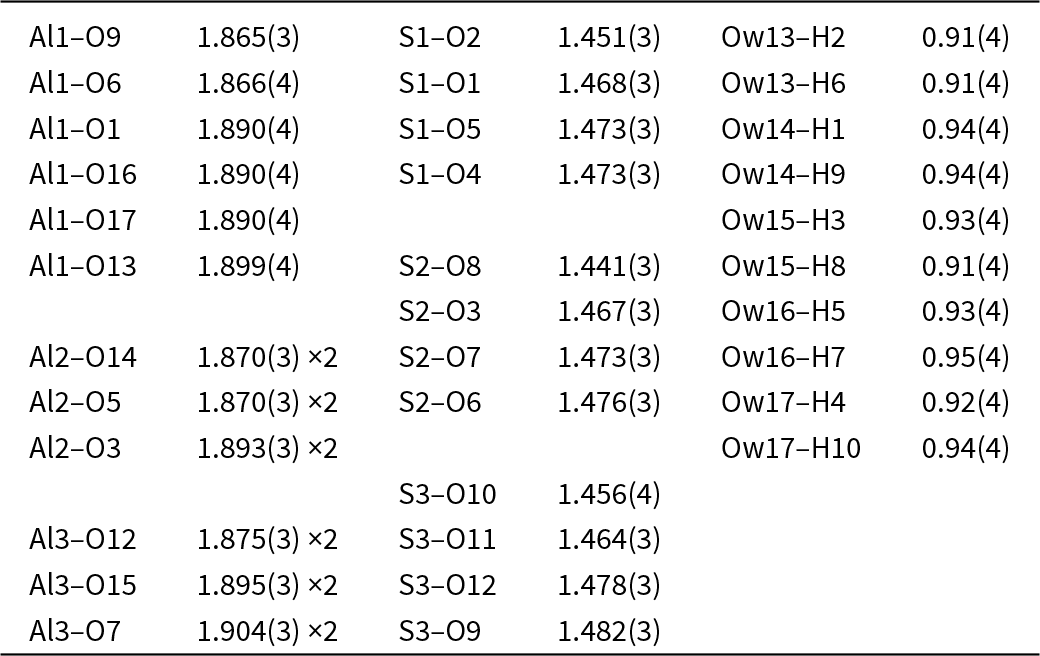
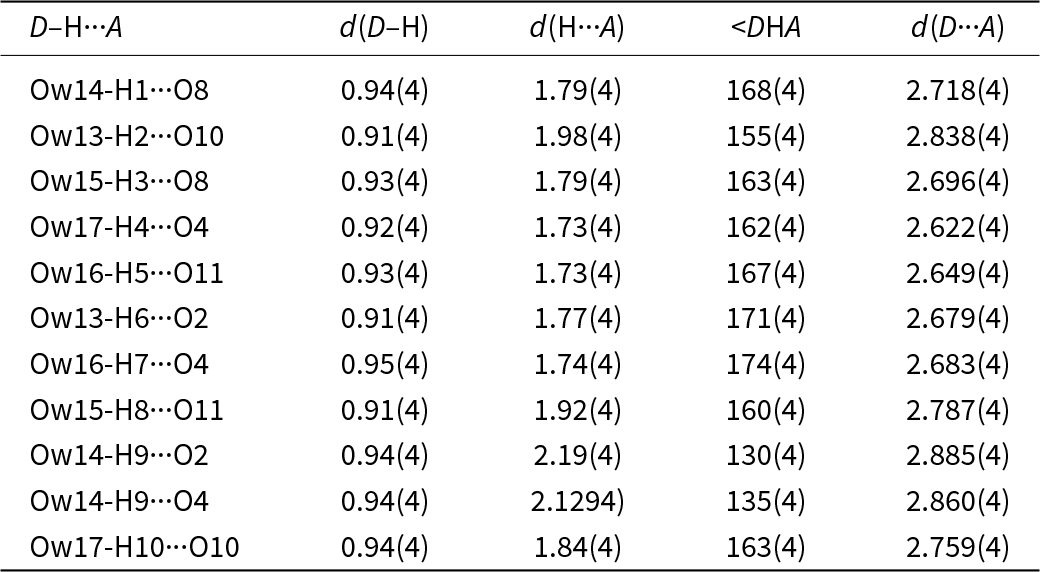
A crystal of sarvodaite (Table 3) was mounted on a thin glass fibre for X-ray diffraction analysis using a Rigaku Synergy S diffractometer, with a micro-focus X-ray tube equipped with a CCD detector (MoKα radiation) operated at 50 kV and 1 mA at the Department of Crystallography, St. Petersburg State University. More than a hemisphere of three-dimensional XRD data was collected with 200 s count time for each frame. Fractional atom coordinates and atomic displacement parameters are listed in Tables 4 and 5. Selected interatomic distances are given in Table 6. Hydrogen bonds are provided in Table 7 and bond-valence calculations in Table 8. The crystallographic information file has been deposited with the Principal Editor of Mineralogical Magazine and is available as Supplementary material (see below).
Crystallographic data and refinement parameters for sarvodaite

Table 3 Long description
Crystal data list the formula Al2S3O17H10, crystal system monoclinic, space group P21 slash n number 14, unit cell dimensions a 5.4862, b 10.8029, c 20.8413 angstroms, and beta 96.416 degrees. Unit cell volume is 1227.46 cubic angstroms, Z is 4, absorption coefficient is 0.851 per millimeter, and crystal size is 0.01 by 0.01 by 0.07 millimeters. Data collection conditions include temperature 150 kelvin and radiation MoK alpha with wavelength 0.71073 angstroms. Theta range is 3.502 to 27.999 degrees, with h, k, l ranges from minus 7 to 7, minus 14 to 14, and minus 27 to 27. Total reflections collected are 11826, unique reflections are 2946 with Rint 0.07, and unique reflections with F greater than 4 sigma of F are 2053. F zero zero zero is 880. Structure refinement uses full matrix least squares on F squared, with weighting coefficients a 0.0660 and b 2.5563, and data restraints parameters 2946, 10, and 232. R1 and wR2 for F greater than 4 sigma of F are 0.0615 and 0.1378, and R1 all and wR2 all are 0.0947 and 0.1498. Goodness of fit on F squared is 1.053, and the largest difference peak and hole are 0.824 and minus 0.643 electrons per cubic angstrom.
Coordinates, equivalent isotropic (U eq) and isotropic (U iso) displacement parameters (Å2) of atoms in sarvodaite

Table 4 Long description
Atomic site information is given by columns for Atom, Wyckoff, x, y, z, and Ueq or Uiso with asterisk. Aluminum sites include Al1 at Wyckoff 4e with x minus 0.0880(2), y minus 0.23870(13), z 0.81354(6), and Ueq or Uiso 0.0109(3); Al2 at 2d with x minus one half, y 0, z 0, and 0.0090(4); and Al3 at 2b with x minus one half, y minus one half, z 0, and 0.0095(4). Sulfur sites S1, S2, and S3 are all 4e with Ueq or Uiso values 0.0109(3), 0.0105(3), and 0.0117(3), respectively, and their coordinates are listed in the x, y, and z columns. Oxygen sites O1 through O12 are all 4e with Ueq or Uiso values from 0.0152(7) at O3 up to 0.0223(8) at O10, with each row providing x, y, and z coordinates. Water oxygen sites Ow13 through Ow17 are all 4e with Ueq or Uiso values 0.0197(8), 0.0162(7), 0.0154(7), 0.0184(8), and 0.0218(8), respectively, with coordinates listed for each. Hydrogen sites H1 through H10 are all 4e and each has Ueq or Uiso shown as 0.050 with an asterisk, with x, y, and z coordinates given for each hydrogen row.
* fixed during the refinement
Anisotropic displacement parameters (Å2) of atoms in sarvodaite

Table 5 Long description
Rows list atoms Al1 to Al3, S1 to S3, O1 to O12, and Ow13 to Ow17, with anisotropic displacement parameters in columns U11, U22, U33, U23, U13, and U12. Aluminum entries range from 0.0085 to 0.0138 for U11, 0.0063 to 0.0085 for U22, and 0.0097 to 0.0116 for U33. Sulfur entries show U11 from 0.0116 to 0.0129, U22 from 0.0063 to 0.0087, and U33 from 0.0124 to 0.0132, with U23, U13, and U12 near zero in each sulfur row. Oxygen entries include higher U33 values, with O9 at 0.032 and O10 at 0.030, and the smallest U22 occurs at O9 with 0.0036. Water oxygen entries Ow13 to Ow17 include the largest U11 value at Ow17 with 0.033, and U12 values ranging from minus 0.0081 at Ow13 to 0.0097 at Ow16. Across all rows, U23 values span from minus 0.0037 at O10 and Ow17 to 0.0036 at Ow16, and U13 values span from minus 0.0040 at O8 to 0.0122 at O10.
Selected interatomic distances (Å) in sarvodaite

Table 6 Long description
Interatomic distances in angstroms are listed for Al to O, S to O, and Ow to H atom pairs, with values given in parentheses. Al1 to O distances are 1.865(3) for O9, 1.866(4) for O6, 1.890(4) for O1, O16, and O17, and 1.899(4) for O13. Al2 to O distances are 1.870(3) times 2 for O14 and O5, and 1.893(3) times 2 for O3. Al3 to O distances are 1.875(3) times 2 for O12, 1.895(3) times 2 for O15, and 1.904(3) times 2 for O7. S1 to O distances are 1.451(3) for O2, 1.468(3) for O1, and 1.473(3) for O5 and O4. S2 to O distances are 1.441(3) for O8, 1.467(3) for O3, 1.473(3) for O7, and 1.476(3) for O6. S3 to O distances are 1.456(4) for O10, 1.464(3) for O11, 1.478(3) for O12, and 1.482(3) for O9. Ow to H distances are 0.91(4) for Ow13 to H2 and H6 and for Ow15 to H8, 0.92(4) for Ow17 to H4, 0.93(4) for Ow15 to H3 and for Ow16 to H5, 0.94(4) for Ow14 to H1 and H9 and for Ow17 to H10, and 0.95(4) for Ow16 to H7.
Hydrogen bonds (D = donor, A = acceptor) in the structure of sarvodaite

Table 7 Long description
Columns list D H to A, d(D H), d(H to A), angle labeled less than DHA, and d(D to A). Eleven hydrogen bonds are given: Ow14 H1 to O8 has d(D H) 0.94(4), d(H to A) 1.79(4), angle 168(4), and d(D to A) 2.718(4). Ow13 H2 to O10 has 0.91(4), 1.98(4), 155(4), and 2.838(4). Ow15 H3 to O8 has 0.93(4), 1.79(4), 163(4), and 2.696(4). Ow17 H4 to O4 has 0.92(4), 1.73(4), 162(4), and 2.622(4). Ow16 H5 to O11 has 0.93(4), 1.73(4), 167(4), and 2.649(4). Ow13 H6 to O2 has 0.91(4), 1.77(4), 171(4), and 2.679(4). Ow16 H7 to O4 has 0.95(4), 1.74(4), 174(4), and 2.683(4). Ow15 H8 to O11 has 0.91(4), 1.92(4), 160(4), and 2.787(4). Ow14 H9 to O2 has 0.94(4), 2.19(4), 130(4), and 2.885(4). Ow14 H9 to O4 has 0.94(4), d(H to A) shown as 2.1294), angle 135(4), and d(D to A) 2.860(4). Ow17 H10 to O10 has 0.94(4), 1.84(4), 163(4), and 2.759(4).
Bond-valence analysis* (in valence units = vu) for the crystal structure of sarvodaite

Table 8 Long description
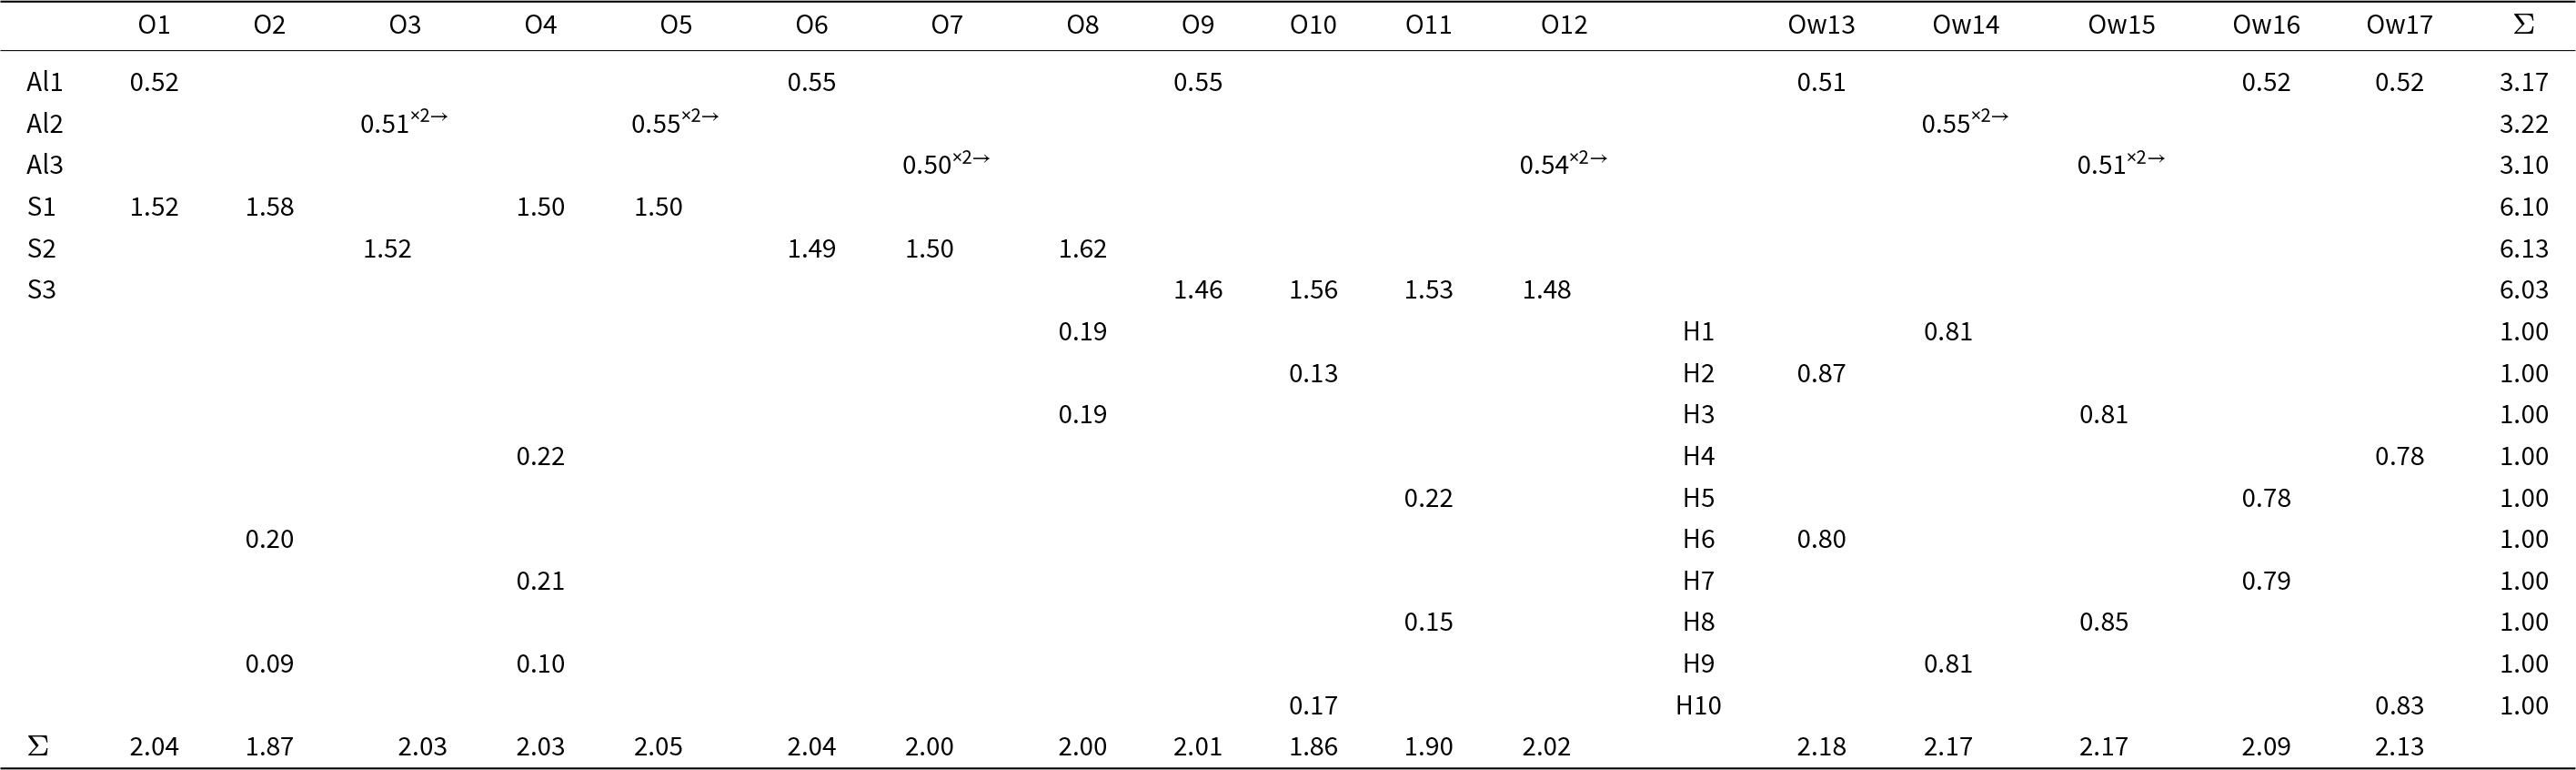
Bond valence values in valence units are listed by atom rows Al1, Al2, Al3, S1, S2, S3, then H1 through H10, across columns O1 to O12 and Ow13 to Ow17, with a final column giving row totals. Al1 has entries at O1 0.52, O6 0.55, O9 0.55, Ow14 0.51, Ow16 0.52, and Ow17 0.52, totaling 3.17. Al2 has O3 0.51 twice, O5 0.55 twice, and Ow15 0.55 twice, totaling 3.22. Al3 has O7 0.50 twice, O12 0.54 twice, and Ow16 0.51 twice, totaling 3.10. S1 lists O1 1.52, O2 1.58, O4 1.50, and O5 1.50, totaling 6.10; S2 lists O3 1.52, O6 1.49, O7 1.50, and O8 1.62, totaling 6.13; S3 lists O9 1.46, O10 1.56, O11 1.53, and O12 1.48, totaling 6.03. Hydrogen rows show smaller values that sum to 1.00 each: H1 has O8 0.19 and Ow14 0.81; H2 has O10 0.13 and Ow13 0.87; H3 has O8 0.19 and Ow15 0.81; H4 has O4 0.22 and Ow17 0.78; H5 has O11 0.22 and Ow16 0.78; H6 has O2 0.20 and Ow13 0.80; H7 has O4 0.21 and Ow16 0.79; H8 has O11 0.15 and Ow15 0.85; H9 has O2 0.09 and O4 0.10 and Ow14 0.81; H10 has O10 0.17 and Ow17 0.83. Column totals in the bottom row are O1 2.04, O2 1.87, O3 2.03, O4 2.03, O5 2.05, O6 2.04, O7 2.00, O8 2.00, O9 2.01, O10 1.86, O11 1.90, O12 2.02, Ow13 2.18, Ow14 2.17, Ow15 2.17, Ow16 2.09, and Ow17 2.13.
* B.V.S. were calculated using the parameters from Gagné and Hawthorne, Reference Gagné and Hawthorne2015.
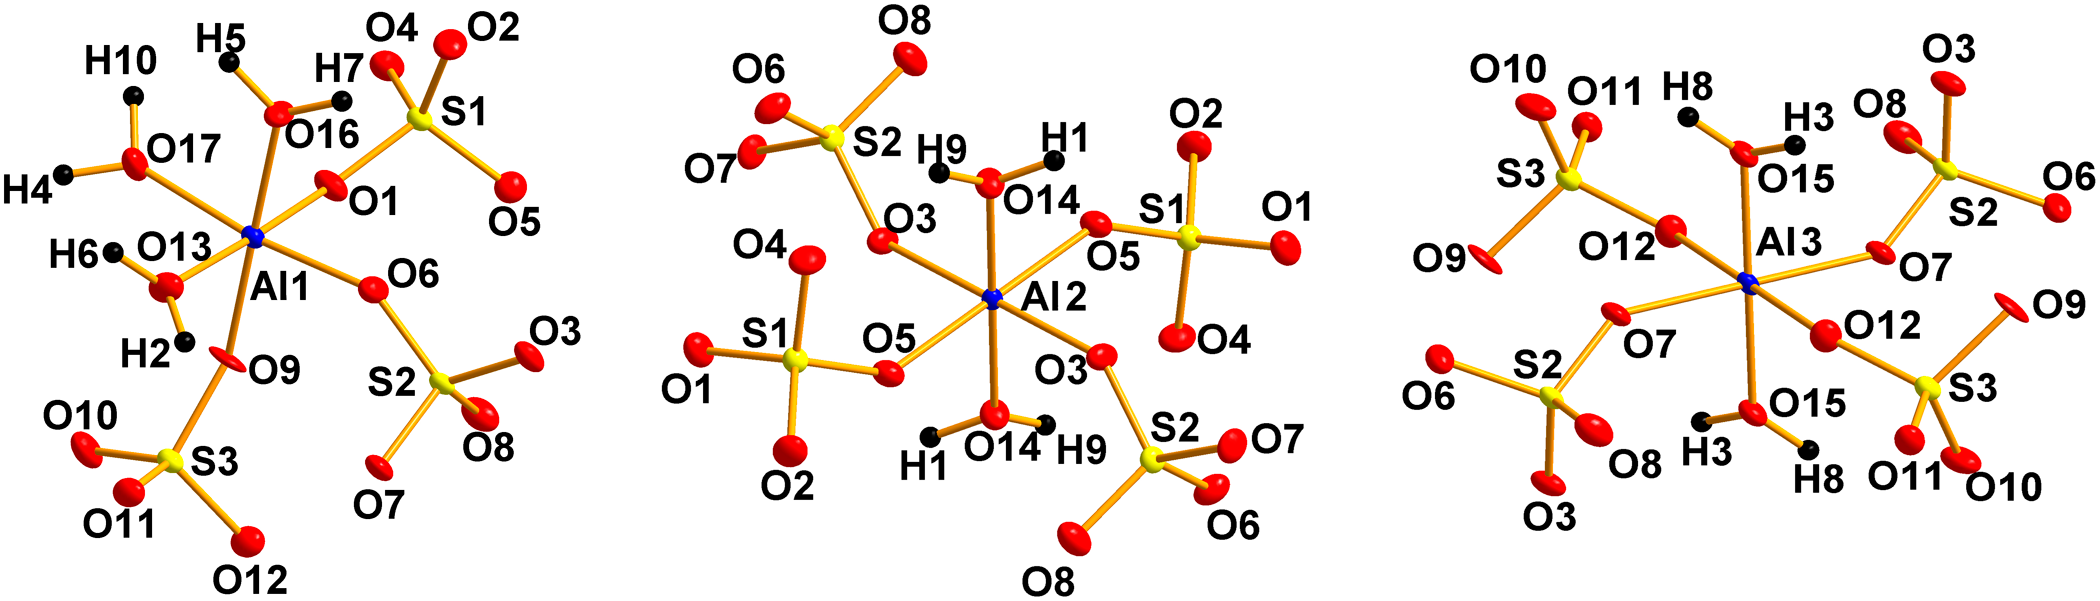
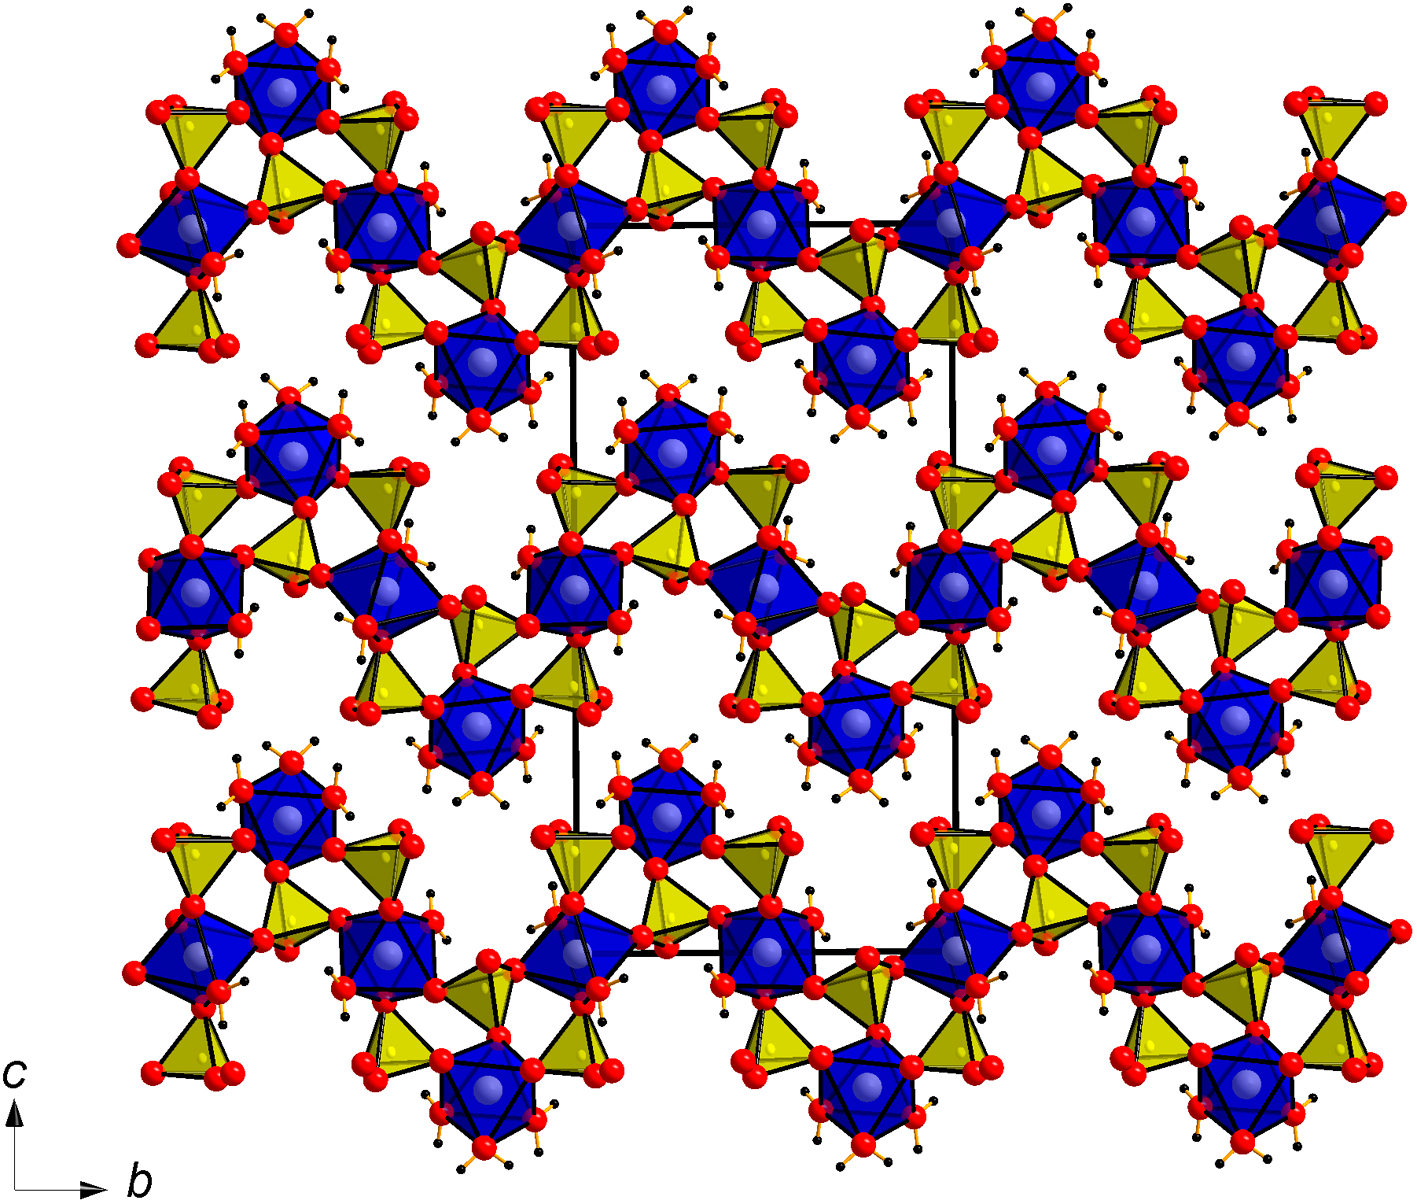
The unit-cell parameters of sarvodaite (Table 3) are nearly identical to those obtained for the synthetic analogue in Fischer et al. (Reference Fischer, Eisenmann and Kniep1996) (P21/n, a = 5.4843(2), b = 10.7958(3), c = 20.8427(4) Å, β = 96.44(8)°, V = 1226.26 Å)3. As an initial structure model, the atomic coordinates of Al, S and O atoms were taken from Fischer et al. (Reference Fischer, Eisenmann and Kniep1996). O–H distance restraints of 1.00 ± 0.005 Å were applied. The isotropic displacement parameters for hydrogen atoms were held constant at 0.05 Å2. The structure of sarvodaite contains three symmetrically independent Al sites and three S sites (Fig. 6). S6+ cations are tetrahedrally coordinated by four O atoms each. Al atoms have octahedral coordination environments. The Al1 atom is coordinated by three H2O molecules and three O atoms belonging to sulfate groups. Al2 and Al3 atoms have similar coordination environments thus forming regular AlO4(H2O)2 octahedra. The minor amounts of Fe and Ti detected by the microprobe (see above) could not be refined. Al-centred octahedra and sulfate groups form strongly corrugated layers stacked along [001] and shown in Fig. 7. The layers are interconnected via hydrogen bonding.
Coordination environments of Al and S atoms in the structure of sarvodaite. Ellipsoids are shown at 50% probability level. Drawn using Diamond (Crystal Impact, https://www.crystalimpact.de/diamond).

General projection of the crystal structure of sarvodaite (AlO6 = blue, SO4 = yellow, O atoms = red balls; H atoms = grey balls) along the a axis.

Concluding remarks
Sarvodaite, a novel aluminium sulfate pentahydrate mineral species, was discovered in the sublimates of an underground coal fire. The mineral is believed to undergo direct crystallization as a result of the interaction between a hot aerosol (sulfuric acid with water vapour) and the host rocks, which allows gases from the fire to escape to the surface. This is in contrast to the pseudomorphic formation of the Al2(SO4)3·5H2O phase in the dumps of the Anna1 coal mine after godovikovite (Witzke et al., Reference Witzke, de Wit, Kolitsch, Blass, Stracher, Prakash and Sokol2015). The absence of any indications of sarvodaite crystallization after any primary minerals and the automorphic form of sarvodaite segregations (spherulites of well-formed needle-shaped crystals) support this assumption. Crystallization of sarvodaite at Kukhi-Malik occurs in hot coal gas discharge zones where the temperature drops below 200°C but exceeds 100°C. The temperature range in which sarvodaite is formed is consistent with the readily available data on the synthesis of Al2(SO4)3·5H2O at 180°C (Fischer et al., Reference Fischer, Eisenmann and Kniep1996).
Supplementary material
The supplementary material for this article can
be found at https://doi.org/10.1180/mgm.2025.10165
Acknowledgements
We acknowledge Elena Zhitova for the editorial handling and four anonymous reviewers for their comments. Authors gratefully acknowledge A.R. Fayziyev, Yu.V. Gritsenko, P. Aminzoda, M.L. Gadoev and Sh.Yo. Yorov for the help and joint field works at the Fan-Yagnob deposit. This work was financially supported by the Russian Science Foundation through the grant 25–17-00157 (for OIS). Technical support by the SPbSU X-ray Diffraction Resource Center (project # 118201839) and Research center for ecology and environment of Central Asia (Dushanbe) is gratefully acknowledged.
Competing interests
The authors declare none.