


1. Introduction
Let U be a random variable that follows the uniform distribution on [0, 1], i.e.
 \begin{equation}{\mathbb{P}}(U\le {u}) = \begin{cases}0,&u<0\\u,&u\in[0,1]\\1,&u>1\end{cases}\quad =\!:\, V(u).\end{equation}
Let  $U^{(1)},U^{(2)},\dots$
be independent and identically distributed (i.i.d.) copies of U. Then, clearly, we have, for
 $x\le 0$
and large
 $n\in{\mathbb{N}}$
(natural set),
 \begin{align}{\textrm{P}}\Big(n\Big(\max_{1\le i\le n}U^{(i)}-1\Big)\le x \Big)&= {\textrm{P}}\left(U_i\le 1+\frac xn,\;1\le i\le n \right)\nonumber\\
&= V^n\left(1+\frac xn\right)\nonumber\\&= \left(1+\frac xn\right)^n\nonumber\\[3pt]&\to_{n\to\infty}G(x),\end{align}
where
 \begin{equation}G(x)=\begin{cases}\exp(x),&x\le 0\\[2pt] 1,&x>0\end{cases}\end{equation}
is the distribution function of the standard negative exponential distribution. Thus, we have established convergence in distribution of the suitably normalised sample maximum, i.e.
 \begin{equation*} n\big(M^{(n)}-1\big)\to_D\eta,\end{equation*}
where  $M^{(n)}\coloneqq \max_{1\le i\le n}U^{(i)}$
,
 $n\in{\mathbb{N}}$
, the arrow ‘
 $\to_D$
’ denotes convergence in distribution, and the random variable
 $\eta$
has distribution function G in (3).
Note that with  $v(x)\coloneqq V'(x)=1$
if
 $x\in[0,1]$
and zero elsewhere, we have
 \begin{align*}v_n(x)&\coloneqq \frac{\partial}{\partial x}\left(V^n\left(1+\frac xn\right)\right)= V^{n-1}\left(1+\frac xn \right) v\left(1+\frac xn \right)\\[3pt] &\to_{n\to\infty} g(x)\coloneqq G'(x) = \begin{cases}\exp(x),&x\le 0,\\0,&x>0 ,\end{cases} \end{align*}
i.e. we have pointwise convergence of the sequence of densities of the normalised maximum  $n\left(M^{(n)}-1\right)$
,
 $n\in{\mathbb{N}}$
, to that of
 $\eta$
. Scheffé’s lemma (see, e.g., [Reference Reiss24, Lemma 3.3.3]) now implies convergence in total variation:
 \begin{equation}\sup_{A\in\mathbb B}{\big\vert{\textrm{P}}\big(n\big(M^{(n)}-1\big)\in A \big)-{\textrm{P}}(\eta\in A)\big\vert}\to_{n\to\infty}0,\end{equation}
where  $\mathbb B$
denotes the Borel
 $\sigma$
-field in
 ${\mathbb{R}}$
.
Now let X be a random variable with arbitrary distribution function F and  $F^{-1}(q)\coloneqq {\left\{{t\in{\mathbb{R}}\,:\, F(t)\ge q}\right\}}$
, with
 $q\in (0,1)$
, be the usual quantile function or generalised inverse of F. Then, we can assume the representation
 \begin{equation*}X=F^{-1}(U).\end{equation*}
Let  $X^{(1)},X^{(2)},\dots$
be independent copies of X. Again, we can consider the representation
 \begin{equation*}X^{(i)}=F^{-1}\big(U^{(i)}\big),\qquad i=1,2,\dots \end{equation*}
The fact that each quantile function is a nondecreasing function yields
 \begin{align*}\max_{1\le i\le n}X^{(i)}&=\max_{1\le i\le n}F^{-1}\big(U^{(i)}\big) = F^{-1}\left(\max_{1\le i\le n}U^{(i)} \right)\\[3pt] &= F^{-1}\left(1+\frac 1n\left(n\left(\max_{1\le i\le n}U^{(i)}-1 \right) \right) \right)\!.\end{align*}
The strong convergence in equation (4) now implies the following convergence in total variation:
 \begin{equation}\sup_{A\in\mathbb B}{\left\vert{\textrm{P}}\bigg(\max_{1\le i\le n}X^{(i)}\in A\bigg)- {\textrm{P}}\left(F^{-1}\left(1+\frac 1n \eta\right)\in A\right)\right\vert}\to_{n\to\infty}0.\end{equation}
Finally, assume that F is a continuous distribution function with density  $f=F'$
. We denote the right endpoint of F by
 $x_0\coloneqq \sup\{x \in {\mathbb{R}}\,:\, F(x)<1\}$
. Assume also that
 $F\in\mathcal{D}(G_\gamma^{*})$
, i.e. F belongs to the domain of attraction of a generalised extreme-value distribution function
 $G_\gamma^{*}$
, e.g. [Reference Falk, Padoan and Wisheckel14, p. 21]. This means, for
 $n\in{\mathbb{N}}$
, there are norming constants
 $a_n>0, b_n\in{\mathbb{R}}$
such that
 \begin{equation}F^n(a_nx+b_n)\to_{n\to\infty} \exp\left({-}\left(1+\gamma x\right)_+^{-1/\gamma}\right)=\!:\,G^*_\gamma(x),\end{equation}
for all  $x\in{\mathbb{R}}$
, where
 ${(x)_+=\max(0,x)}$
and
 $\gamma\in{\mathbb{R}}$
is the so-called tail index. Such a coefficient describes the heaviness of the upper tail of the probability density function corresponding to
 $G^*_\gamma$
; see [Reference Falk, Padoan and Wisheckel14] for details. In this general case we also have pointwise convergence at the density level, i.e.
 \begin{align}f^{(n)}(x)\coloneqq \frac{\partial}{\partial x}F^n(a_nx +b_n)\to_{n \to \infty} \frac{\partial}{\partial x}G^*_\gamma(x) =\!:\,g^*_\gamma(x) ,\end{align}
for all  $x\in{\mathbb{R}}$
, if and only if
 \begin{align}&\lim_{x \to \infty} \frac{x f(x)}{1-F(x)}=1/\gamma, \quad &\text{if }\gamma>0,\end{align}
 \begin{align}&\lim_{x \uparrow x_0}\frac{(x_0-x)f(x)}{1-F(x)}=-1/\gamma, \quad &\text{if }\gamma<0,\end{align}
 \begin{align}&\lim_{x \uparrow x_0}\frac{f(x)}{(1-F(x))^2}\int_0^{x_0}\left(1-F(t)\right){\textrm{d}} t=1, &\text{if } \gamma=0 ,\end{align}
see, e.g., Proposition 2.5 in [Reference Resnick25]. In particular, if (7) holds true, Scheffé’s lemma entails that
 \begin{equation}\sup_{A\in\mathbb B}{\left\vert{\textrm{P}}\bigg(a_n^{-1}\bigg(\max_{1\le i\le n}X^{(i)}-b_n\bigg)\in A\bigg)- {\textrm{P}}\left(Y\in A\right)\right\vert}\to_{n\to\infty}0,\end{equation}
where Y is a random variable with distribution  $G_\gamma^{*}$
and
 $X^{(i)}$
,
 $i=1,\ldots,n$
, are independent copies of a random variable X with distribution F.
In this paper we extend the results in (4), (5), and (11) to higher dimensions. First, in Section 2 we consider copulas. In Theorem 2.2, we demonstrate that the strong convergence result holds for copulas that are in a differential neighbourhood of a multivariate generalised Pareto copula [Reference Falk12, Reference Falk, Padoan and Wisheckel14]. As a result of this, we also establish strong convergence of the copula of the maximum of n i.i.d. random vectors with arbitrary common distribution function to the limiting extreme-value copula (Corollary 2.1). Sklar’s theorem is then used in Section 3 to derive convergence in variational distance of the maximum of n i.i.d. random vectors with arbitrary common distribution function and, under restrictions (8)–(10) on the margins, of its normalised versions. These results address some still open problems in the literature on multivariate extremes.
Strong convergence for extremal order statistics of univariate i.i.d. random variables has been well investigated; see, e.g., Section 5.1 in [Reference Reiss24] and the literature cited therein. Strong convergence holds in particular under suitable von Mises type conditions on the underlying distribution function; see (8)–(11) for the univariate normalised maximum. Much less is known in the multivariate setup. In this case, a possible approach is to investigate a point process of exceedances over high thresholds and establish its convergence to a Poisson process. This is done under suitable assumptions on variational convergence for truncated point measures; see, e.g. Theorem 7.1.4 in [Reference Falk, Hüsler and Reiss13]. It is proven in [Reference Kaufmann and Reiss18] that strong convergence of such multivariate point processes holds if, and only if, strong convergence of multivariate maxima occurs. Differently from that, we provide simple conditions (namely (16) and (23)) under which strong convergence of multivariate maxima and their normalised versions actually holds. Furthermore, our strong convergence results for sample maxima are valid for maxima with arbitrary dimensions, unlike those in [Reference de Haan and Peng8], which are tailored to the two-dimensional case. Section 4 concludes the paper by illustrating how effective our variational convergence results are for statistical purposes. In particular, when the interest is on inferential procedures for sample maxima whose distribution function is in a neighborhood of some multivariate max-stable model, we show that, e.g., our results can be used to establish almost-sure consistency for the empirical copula estimator of the extreme-value copula. Similar results can also be achieved within the Bayesian inferential approach.
2. Strong results for copulas
Suppose that the random vector  ${\textbf{U}}=(U_1,\dots,U_d)$
follows a copula, say C, on
 ${\mathbb{R}}^d$
, i.e. each component
 $U_j$
has the distribution function
 $V_j$
given in (1). Let
 ${\textbf{U}}^{(1)},{\textbf{U}}^{(2)},\dots$
be independent copies of
 ${\textbf{U}}$
and put, for
 $n\in{\mathbb{N}}$
,
 \begin{equation}{\textbf{\textit{M}}}^{(n)}\coloneqq \left(M_1^{(n)},\dots,M_d^{(n)}\right)\coloneqq \bigg(\max_{1\le i\le n}U_1^{(i)},\dots,\max_{1\le i\le n}U_d^{(i)}\bigg).\end{equation}
In the following, the operations involving vectors are meant componentwise; furthermore, we set  ${\textbf{0}}=(0,\ldots,0)$
,
 ${\textbf{1}}=(1\ldots,1)$
, and
 ${\boldsymbol{\infty}} = (\infty,\ldots,\infty)$
. Finally, we denote the copula of the random vector in (12) by
 $C^{(n)}({\textbf{U}})\coloneqq C^n({\textbf{U}}^{1/n})$
,
 ${\textbf{U}} \in [0,1]^d$
.
Suppose that a convergence result analogous to (2) holds for the random vector  ${\textbf{\textit{M}}}^{(n)}$
of componentwise maxima, i.e. suppose there exists a nondegenerate distribution function
G on
 ${\mathbb{R}}^d$
such that, for
 ${\textbf{\textit{x}}}=(x_1,\dots,x_d)\le{\textbf{0}}\in{\mathbb{R}}^d$
,
 \begin{align}{\textrm{P}}\left(n\left({\textbf{\textit{M}}}^{(n)}-{\textbf{1}}\right)\le {\textbf{\textit{x}}}\right) &= {\textrm{P}}\left(n\left(M_1^{(n)}-1\right)\le x_1, \dots, n\left(M_d^{(n)}-1\right)\le x_d\right)\nonumber\\[3pt] &\to_{n\to\infty} G({\textbf{\textit{x}}}).\end{align}
Then, G is necessarily a multivariate max-stable or multivariate extreme-value distribution function, with extreme-value copula  $C_G$
and standard negative exponential margins
 $G_j$
,
 $j=1,\ldots,d$
; see (3). In the following we refer to the distribution function G in (13) as the standard multivariate max-stable distribution function. Precisely, the form of G is
 \begin{equation*}G({\textbf{\textit{x}}})=C_G(G_1(x_1),\ldots,G_d(x_d)),\end{equation*}
where the copula  $C_G$
can be expressed in terms of
 ${\left\Vert\cdot\right\Vert}_D$
, a D-norm on
 ${\mathbb{R}}^d$
, via
 \begin{equation}C_G({\textbf{U}})=\exp\left({-}{\left\Vert\log u_1,\ldots,\log u_d\right\Vert}_D\right)\!, \qquad {\textbf{U}}\in[0,1]^d,\end{equation}
while the margins  $G_j$
,
 $j=1,\ldots,d$
, are as in (3). Therefore, the distribution in (13) has the representation
 \begin{equation}G({\textbf{\textit{x}}})=\exp\left({-}{\left\Vert{\textbf{\textit{x}}}\right\Vert}_D\right)\!,\qquad {\textbf{\textit{x}}}\le{\textbf{0}}\in{\mathbb{R}}^d.\end{equation}
The convergence result in (13) implies that  $C^{(n)}({\textbf{U}}) \to_{n\to\infty}C_G({\textbf{U}})$
, for all
 ${\textbf{U}}\in[0,1]^d$
; see, e.g., [Reference Falk12, Corollary 3.1.12]. For brevity, with a little abuse of notation we also denote this latter fact by
 $C\in\mathcal{D}(C_G)$
.
By Theorem 2.3.3 in [Reference Falk12], there exists a random vector  ${\textbf{\textit{Z}}}=(Z_1,\dots,Z_d)$
with
 $Z_j\ge 0$
,
 $\textrm{E}(Z_j)=1$
,
 $1\le j\le d$
, such that
 \begin{equation*}{\left\Vert{\textbf{\textit{x}}}\right\Vert}_D= \textrm{E}\bigg(\max_{1\le j\le d}\left({\left\vert{x_j}\right\vert}Z_j\right) \bigg),\qquad {\textbf{\textit{x}}}\in{\mathbb{R}}^d.\end{equation*}
Examples of D-norms are the sup-norm  ${\left\Vert{\textbf{\textit{x}}}\right\Vert}_\infty=\max_{1\le j\le d}{\left\vert{x_j}\right\vert}$
, or the complete family of logistic norms
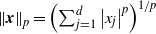 ${\left\Vert{\textbf{\textit{x}}}\right\Vert}_p=\left(\sum_{j=1}^d{\left\vert{x_j}\right\vert}^p\right)^{1/p}$
,
 $p\ge 1$
. For a recent account on multivariate extreme-value theory and D-norms we refer to [Reference Falk12]. In particular, Proposition 3.1.5 in [Reference Falk12] implies that the convergence result in (13) is also equivalent to the expansion
 \begin{equation}C({\textbf{U}}) = 1- {\left\Vert{\textbf{1}}-{\textbf{U}}\right\Vert}_D + o({\left\Vert{\textbf{1}}-{\textbf{U}}\right\Vert})\end{equation}
as  ${\textbf{U}}\to{\textbf{1}}\in{\mathbb{R}}^d$
, uniformly for
 ${\textbf{U}}\in[0,1]^d$
.
In a first step we drop the term  $o({\left\Vert{\textbf{1}}-{\textbf{U}}\right\Vert})$
in expansion (16) and require that there exists
 ${\textbf{U}}_0\in (0,1)^d$
such that
 \begin{equation}C({\textbf{U}})=1-{\left\Vert{\textbf{1}}-{\textbf{U}}\right\Vert}_D, \qquad {\textbf{U}}\in[{\textbf{U}}_0,{\textbf{1}}]\subset{\mathbb{R}}^d.\end{equation}
A copula that satisfies the above expansion is a generalised Pareto copula (GPC). The significance of GPCs for multivariate extreme-value theory is explained in [Reference Falk, Padoan and Wisheckel14] and in [Reference Falk12, Section 3.1].
Note that
 \begin{equation*}C({\textbf{U}})= \max\left(0,1-{\left\Vert{\textbf{1}}-{\textbf{U}}\right\Vert}_{D}\right)\!,\qquad {\textbf{U}}\in[0,1]^d,\end{equation*}
defines a multivariate distribution function only in dimension  $d = 2$
; see, e.g., [Reference McNeil and Nešlehová20, Examples 2.1, 2.2]. But one can find, for arbitrary dimension
 $d \ge 2$
, a random vector whose distribution function satisfies (17); see, e.g., [Reference Falk12, Equation (2.15)]. For this reason, we require the condition in (17) only on some upper interval
 $[{\textbf{U}}_0,{\textbf{1}}]\subset{\mathbb{R}}^d$
.
The distribution function of  $n ({\textbf{\textit{M}}}^{(n)}-{\textbf{1}})$
is, for
 ${\textbf{\textit{x}}}<{\textbf{0}}\in{\mathbb{R}}^d$
and n large so that
 ${\textbf{1}} +\break {\textbf{\textit{x}}}/n\ge{\textbf{U}}_0$
,
 \begin{equation*}P\big(n\big({\textbf{\textit{M}}}^{(n)}-{\textbf{1}}\big)\le{\textbf{\textit{x}}}\big) = \left(1-\frac 1n{\left\Vert{\textbf{\textit{x}}}\right\Vert}_D\right)^n =\!:\, F^{(n)}({\textbf{\textit{x}}}).\end{equation*}
Suppose that the norm  ${\left\Vert\cdot\right\Vert}_D$
has partial derivatives of order d. Then the distribution function
 $F^{(n)}({\textbf{\textit{x}}})$
has, for
 ${\textbf{1}} +{\textbf{\textit{x}}}/n\ge{{\textbf{U}}_0}$
, the density
 \begin{equation}f^{(n)}({\textbf{\textit{x}}})\coloneqq \frac{\partial^d}{\partial x_1\cdots\partial x_d}F^{(n)}({\textbf{\textit{x}}})= \frac{\partial^d}{\partial x_1\cdots\partial x_d} \left(1-\frac 1n{\left\Vert{\textbf{\textit{x}}}\right\Vert}_D\right)^n.\end{equation}
As for the standard multivariate max-stable distribution function G in (15), its density exists and is given by
 \begin{equation}g({\textbf{\textit{x}}})\coloneqq \frac{\partial^d}{\partial x_1\cdots\partial x_d}G({\textbf{\textit{x}}})= \frac{\partial^d}{\partial x_1\cdots\partial x_d} \exp\left({-}{\left\Vert{\textbf{\textit{x}}}\right\Vert}_D\right)\!,\qquad {\textbf{\textit{x}}}\le{\textbf{0}}\in{\mathbb{R}}^d.\end{equation}
We are now ready to state our first multivariate extension of the convergence in total variation in (4). For brevity, we occasionally denote with the same letter a Borel measure and its distribution function.
Theorem 2.1. Suppose the random vector  ${\textbf{U}}$
follows a generalised Pareto copula C with corresponding D-norm
 ${\left\Vert\cdot\right\Vert}_D$
, which has partial derivatives of order
 $d\ge 2$
. Then
 \begin{equation*}\sup_{A\in\mathbb B^d}{\left\vert{\textrm{P}}\big(n\big({\textbf{\textit{M}}}^{(n)}-{\textbf{1}}\big)\in A\big)-G(A)\right\vert}\to_{n\to\infty} 0,\end{equation*}
where  $\mathbb B^d$
denotes the Borel
 $\sigma$
-field in
 ${\mathbb{R}}^d$
.
Remark 2.1. Note that we can write a GPC
 \begin{equation*} C({\textbf{U}})=1-{\left\Vert{\textbf{1}}-{\textbf{U}}\right\Vert}_p= 1- \bigg(\sum_{j=1}^d(1-u_j)^p\bigg)^{1/p},\qquad {\textbf{U}}\in[{\textbf{U}}_0,{\textbf{1}}]\subset{\mathbb{R}}^d, \end{equation*}
where the D-norm  ${\left\Vert\cdot\right\Vert}_D$
is a logistic norm
 ${\left\Vert\cdot\right\Vert}_p$
,
 $p\ge 1$
, as an Archimedean copula
 \begin{equation*} C({\textbf{U}})=\varphi^{-1}\bigg(\sum_{j=1}^d\varphi(u_j)\bigg), \qquad {\textbf{U}}\in[{\textbf{U}}_0,{\textbf{1}}]\subset{\mathbb{R}}^d. \end{equation*}
The generator function  $\varphi\,:\,(0,1]\to[0,\infty)$
is in general strictly decreasing and convex, with
 $\varphi(1)=0$
; see, e.g., [Reference McNeil and Nešlehová20]. Just set here
 $\varphi(u)\coloneqq (1-u)^p$
,
 $u\in[0,1]$
. Note that we require the Archimedean structure of C only in its upper tail; this allows the incorporation of
 $\varphi(u)=(1-u)^p$
as a generator function in arbitrary dimension
 $d\ge 2$
, not only for
 $d=2$
. The partial differentiability condition on the D-norm in Theorem 2.1 now reduces to the existence of the derivative of order d of
 $\varphi(u)$
in a left neighbourhood of 1.
For the proof of Theorem 2.1 we establish the following auxiliary result.
Lemma 2.1. Choose  $\varepsilon\in(0,1)$
and
 ${\textbf{\textit{x}}}_\varepsilon<{\textbf{0}}\in{\mathbb{R}}^d$
with
 $G([{\textbf{\textit{x}}}_\varepsilon,{\textbf{0}}])\ge 1-\varepsilon$
. Then we have, for
 ${\textbf{\textit{x}}}\in[{\textbf{\textit{x}}}_\varepsilon,{\textbf{0}}]$
,
 \begin{equation} f^{(n)}({\textbf{\textit{x}}})\to_{n\to\infty} g({\textbf{\textit{x}}}). \end{equation}
Proof.  $G({\textbf{\textit{x}}})$
can be seen as the function composition
 $(\ell \circ \phi)({\textbf{\textit{x}}})$
, where we set
 $\ell(y)=\exp(y)$
and
 $\phi({\textbf{\textit{x}}})=-{\left\Vert{\textbf{\textit{x}}}\right\Vert}_D$
. Then, by Faá di Bruno’s formula, the density in (19) is equal to
 \begin{equation} g({\textbf{\textit{x}}})=\frac{\partial^d}{\partial x_1\cdots\partial x_d}\exp(\phi({\textbf{\textit{x}}}))= G({\textbf{\textit{x}}})\sum_{{\mathcal P} \in{\mathscr{P}}}\prod_{B\in{\mathcal P}}\frac{\partial^{|B|}\phi({\textbf{\textit{x}}})}{\partial^{B}{\textbf{\textit{x}}}}, \end{equation}
where  ${\mathscr{P}}$
is the set of all partitions of
 $\{1,\ldots,d\}$
and the product is over all blocks B of a partition
 ${\mathcal P}\in{\mathscr{P}}$
. In particular,
 $B=(i_1,\ldots,i_k)$
with each
 $i_j\in \{1,\ldots,d\}$
, and the cardinality of each block is denoted by
 $|B|=k$
. Finally, for a function
 $h\,:\,{\mathbb{R}}^d\rightarrow {\mathbb{R}}$
we define
 $\partial^{|B|}h(\textbf{\textit{x}})/\partial^{B}{\textbf{\textit{x}}}\coloneqq \partial^k h(\textbf{\textit{x}}) / \partial x_{i_1},\ldots, \partial x_{i_k}$
.
Similarly,  $F^{(n)}({\textbf{\textit{x}}})$
can be seen as the function composition
 $(\ell\circ \phi_n)({\textbf{\textit{x}}})$
, where we set
 $\phi_n({\textbf{\textit{x}}})\coloneqq -n\log(1/(1-n^{-1}{\left\Vert{\textbf{\textit{x}}}\right\Vert}_D))$
. Then,
 $F^{(n)}({\textbf{\textit{x}}})=\exp(\phi_n({\textbf{\textit{x}}}))$
and, once again by Faá di Bruno’s formula, the density in (18) is equal to
 \begin{align*} f^{(n)}({\textbf{\textit{x}}})=\frac{\partial^d}{\partial x_1\cdots\partial x_d}\exp(\phi_n({\textbf{\textit{x}}}))= F^{(n)}({\textbf{\textit{x}}})\sum_{{\mathcal P}\in{\mathscr{P}}}\prod_{B\in{\mathcal P}}\frac{\partial^{|B|}\phi_n({\textbf{\textit{x}}})}{\partial^{B}{\textbf{\textit{x}}}}. \end{align*}
Clearly,  $F^{(n)}({\textbf{\textit{x}}})\to_{n\to\infty}G({\textbf{\textit{x}}})$
for all
 ${\textbf{\textit{x}}}\in[{\textbf{\textit{x}}}_\varepsilon,{\textbf{0}}]$
. Next,
 $\phi_n({\textbf{\textit{x}}})$
can be seen as the function composition
 $(\sigma_n\circ \phi)({\textbf{\textit{x}}})$
, where we set
 $\sigma_n(y)=-n\log(1/(1+n^{-1}y))$
. Thus, again by Faá di Bruno’s formula, we have that, for each block B,
 \begin{align*} \frac{\partial^{|B|}\phi_n({\textbf{\textit{x}}})}{\partial^{B}{\textbf{\textit{x}}}}&= \sum_{{\mathcal P}_B\in{\mathscr{P}}_B}\frac{\partial^{|{\mathcal P}_B|}\sigma_n(y)}{\partial y^{|{\mathcal P}_B|}}\bigg|_{y=\phi({\textbf{\textit{x}}})}\prod_{b\in{\mathcal P}_B}\frac{\partial^{|b|}\phi({\textbf{\textit{x}}})}{\partial^{b}{\textbf{\textit{x}}}}, \end{align*}
where  ${\mathscr{P}}_B$
is the set of all partitions of
 $B=(i_1,\ldots,i_k)$
and the product is over all blocks b of a partition
 ${\mathcal P}_B\in{\mathscr{P}}_B$
. It is not difficult to check that
 \begin{equation*} \frac{\partial^{|{\mathcal P}_B|}\sigma_n(y)}{\partial y^{|{\mathcal P}_B|}}=({-}1)^{1+|{\mathcal P}_B|}\,(|{\mathcal P}_B|-1)!\left(1+y/n\right)^{-|{\mathcal P}_B|}\,n^{-|{\mathcal P}_B|+1}.\end{equation*}
Then,
 \begin{equation*} \frac{\partial^{|{\mathcal P}_B|}\sigma_n(y)}{\partial y^{|{\mathcal P}_B|}}\to_{n\to\infty} \begin{cases} 1, & \text{if } |{\mathcal P}_B|=1,\\[3pt] 0, & \text{if } |{\mathcal P}_B|>1. \end{cases} \end{equation*}
Notice that  $|{\mathcal P}_B|=1$
when
 ${\mathcal P}_B=B$
, and in this case
 $b=B$
. Consequently, for all
 ${\textbf{\textit{x}}}\in[{\textbf{\textit{x}}}_\varepsilon,{\textbf{0}}]$
, we have
 \begin{equation*} \frac{\partial^{|B|}\phi_n({\textbf{\textit{x}}})}{\partial^{B}{\textbf{\textit{x}}}}\to_{n\to\infty} \frac{\partial^{|B|}\phi({\textbf{\textit{x}}})}{\partial^{B}{\textbf{\textit{x}}}}. \end{equation*}
Therefore, the pointwise convergence in (20) follows.□
Proof of Theorem 2.1. It is sufficient to consider  $A\subset\mathbb B^d\cap({-}\infty,0]^d$
, where
 $\mathbb B^d$
denotes the Borel
 $\sigma$
-field in
 ${\mathbb{R}}^d$
. Moreover, choose
 $\varepsilon>0$
and
 ${\textbf{\textit{x}}}_\varepsilon<{\textbf{0}}\in{\mathbb{R}}^d$
with
 $G([{\textbf{\textit{x}}}_\varepsilon,{\textbf{0}}])\ge 1-\varepsilon$
.
We already know that
 \begin{equation*} \sup_{{\textbf{\textit{x}}}\le{\textbf{0}}}{\left\vert{\textrm{P}}\big(n\big({\textbf{\textit{M}}}^{(n)}-{\textbf{1}}\big)\le{\textbf{\textit{x}}}\big)-G({\textbf{\textit{x}}})\right\vert}\to_{n\to\infty}0, \end{equation*}
which implies
 \begin{equation} {\left\vert{\textrm{P}}\big(n\big({\textbf{\textit{M}}}^{(n)}-{\textbf{1}}\big)\in[{\textbf{\textit{x}}}_\varepsilon,{\textbf{0}}]\big)-G([{\textbf{\textit{x}}}_\varepsilon,{\textbf{0}}])\right\vert}\to_{n\to\infty}0 \end{equation}
and, thus,
 \begin{equation*} \limsup_{n\to\infty}{\textrm{P}}\big(n\big({\textbf{\textit{M}}}^{(n)}-{\textbf{1}}\big)\in[{\textbf{\textit{x}}}_\varepsilon,{\textbf{0}}]^{\complement}\big)\le \varepsilon \end{equation*}
or
 \begin{align*} &\limsup_{n\to\infty} \sup_{A\in\mathbb B^d\cap[{\textbf{\textit{x}}}_\varepsilon,{\textbf{0}}]^{\complement}}{\left\vert{\textrm{P}}\big(n\big({\textbf{\textit{M}}}^{(n)}-{\textbf{1}}\big)\in A\big)-G(A)\right\vert}\\[4pt] &\le \limsup_{n\to\infty}{\textrm{P}}\big(n\big({\textbf{\textit{M}}}^{(n)}-{\textbf{1}}\big)\in [{\textbf{\textit{x}}}_\varepsilon,{\textbf{0}}]^{\complement}\big) + G\big([{\textbf{\textit{x}}}_\varepsilon,{\textbf{0}}]^{\complement} \big) \le 2\varepsilon. \end{align*}
As  $\varepsilon>0$
was arbitrary, it is therefore sufficient to establish
 \begin{equation*} \sup_{A\in\mathbb B^d\cap[{\textbf{\textit{x}}}_\varepsilon,{\textbf{0}}]}{\left\vert{\textrm{P}}\big(n\big({\textbf{\textit{M}}}^{(n)}-{\textbf{1}}\big)\in A\big) - G(A)\right\vert}\to_{n\to\infty} 0. \end{equation*}
Now, from equation (22) we know that
 \begin{equation*} \int_{[{\textbf{\textit{x}}}_\varepsilon,{\textbf{0}}]} f^{(n)}({\textbf{\textit{x}}})\,dx\to_{n\to\infty} \int_{[{\textbf{\textit{x}}}_\varepsilon,{\textbf{0}}]}g({\textbf{\textit{x}}})\,d{\textbf{\textit{x}}}. \end{equation*}
Together with (20), we can apply Scheffé’s lemma and obtain
 \begin{equation*} \int_{[{\textbf{\textit{x}}}_\varepsilon,{\textbf{0}}]}{\left\vert{\,f^{(n)}({\textbf{\textit{x}}})-g({\textbf{\textit{x}}})}\right\vert}\,d{\textbf{\textit{x}}}\to_{n\to\infty} 0. \end{equation*}
The bound
 \begin{equation*} \sup_{A\in\mathbb B^d\cap[{\textbf{\textit{x}}}_\varepsilon,{\textbf{0}}]}{\left\vert{{\textrm{P}}\big(n\big({\textbf{\textit{M}}}^{(n)}-{\textbf{1}}\big)\in A\big) - G(A)}\right\vert}\le \int_{[{\textbf{\textit{x}}}_\varepsilon,{\textbf{0}}]}{\left\vert{\,f^{(n)}({\textbf{\textit{x}}})-g({\textbf{\textit{x}}})}\right\vert}\,d{\textbf{\textit{x}}} \end{equation*}
now implies the assertion of Theorem 2.1.□
Next, we extend Theorem 2.1 to a copula C which is in a differentiable neighbourhood of a GPC, defined next. Suppose that C satisfies the expansion (16), where the D-norm  ${\left\Vert\cdot\right\Vert}_D$
on
 ${\mathbb{R}}^d$
has partial derivatives of order d. Assume also that C is such that, for each nonempty block of indices
 $B=(i_1,\dots,i_k)$
of
 ${\left\{{1,\dots,d}\right\}}$
,
 \begin{equation}\frac{\partial^k}{\partial x_{i_1},\dots,\partial x_{i_k}}n\left(C\left({\textbf{1}}+\frac{{\textbf{\textit{x}}}}n\right)-1\right)\to_{n\to\infty}\frac{\partial^k}{\partial x_{i_1},\dots,\partial x_{i_k}}\phi({\textbf{\textit{x}}}),\end{equation}
holds true for all  ${\textbf{\textit{x}}}<{\textbf{0}}\in{\mathbb{R}}^d$
, where
 $\phi({\textbf{\textit{x}}})=-{\left\Vert{\textbf{\textit{x}}}\right\Vert}_D$
.
Theorem 2.2. Suppose the copula C satisfies the conditions in (16) and (23). Then we obtain
 \begin{equation*} \sup_{A\in\mathbb B^d}{\left\vert{{\textrm{P}} \big(n\big({\textbf{\textit{M}}}^{(n)}-{\textbf{1}}\big)\in A \big)- G(A)}\right\vert}\to_{n\to\infty}0, \end{equation*}
where G is the standard max-stable distribution with corresponding D-norm  ${\left\Vert\cdot\right\Vert}_D$
, i.e. it has distribution function
 $G({\textbf{\textit{x}}})=\exp({-}{\left\Vert{\textbf{\textit{x}}}\right\Vert}_D)$
,
 ${\textbf{\textit{x}}}\le{\textbf{0}}\in{\mathbb{R}}^d$
.
Proof. The proof of Theorem 2.2 is similar to that of Theorem 2.1, but this time we resort to a variant of Lemma 2.1 as follows. Note that for  $n\in{\mathbb{N}}$
,
 \begin{equation*} {\textrm{P}} (n({\textbf{\textit{M}}}^{(n)}-{\textbf{1}})\le {\textbf{\textit{x}}}) = C^n\left({\textbf{1}}+\frac{{\textbf{\textit{x}}}}n\right)\!,\qquad {\textbf{\textit{x}}}\le{\textbf{0}}\in{\mathbb{R}}^d. \end{equation*}
Moreover,  $C^n\left({\textbf{1}}+{\textbf{\textit{x}}}/n\right)$
is the function composition
 $(\ell\circ \phi_n)({\textbf{\textit{x}}})$
, where we now set
 $\phi_n({\textbf{\textit{x}}})\coloneqq n\log\left(C\left({\textbf{1}}+{\textbf{\textit{x}}}/n\right)\right)$
. Furthermore,
 $\phi_n({\textbf{\textit{x}}})$
is the composition function
 $(\sigma_n\circ v_n)({\textbf{\textit{x}}})$
, where we set
 $v_n({\textbf{\textit{x}}})\coloneqq n (C({\textbf{1}} + {\textbf{\textit{x}}}/n)-1)$
and
 $\sigma_n$
is as in the proof of Lemma 2.1. Then, in Faá di Bruno’s formula we have that, for each block B,
 \begin{align*} \frac{\partial^{|B|}\phi_n({\textbf{\textit{x}}})}{\partial^{B}{\textbf{\textit{x}}}}&= \sum_{{\mathcal P}_B\in{\mathscr{P}}_B}\frac{\partial^{|{\mathcal P}_B|}\sigma_n(y)}{\partial y^{{|{\mathcal P}_B}|}}\bigg|_{y=v_n({\textbf{\textit{x}}})}\prod_{b\in{\mathcal P}_B}\frac{\partial^{|b|}v_n({\textbf{\textit{x}}})}{\partial^{b}{\textbf{\textit{x}}}}. \end{align*}
By assumptions (16) and (23) we obtain that, for each block b of a partition  ${\mathcal P}_B\in{\mathscr{P}}_B$
,
 \begin{equation*} \frac{\partial^{|b|}v_n({\textbf{\textit{x}}})}{\partial^{b}{\textbf{\textit{x}}}} \to_{n\to\infty} \frac{\partial^{|b|}\phi({\textbf{\textit{x}}})}{\partial^{b}{\textbf{\textit{x}}}}, \qquad {\textbf{\textit{x}}}<{\textbf{0}}\in{\mathbb{R}}^d.\end{equation*}
Therefore, as in Lemma 2.1, we obtain
 \begin{equation*} \frac{\partial^{|B|}\phi_n({\textbf{\textit{x}}})}{\partial^{B}{\textbf{\textit{x}}}}\to_{n\to\infty} \frac{\partial^{|B|}\phi({\textbf{\textit{x}}})}{\partial^{B}{\textbf{\textit{x}}}}, \quad {\textbf{\textit{x}}}<{\textbf{0}}\in{\mathbb{R}}^d , \end{equation*}
and the result follows.□
Example 2.1. Consider, the Gumbel–Hougaard family  ${\left\{{C_p:\,p\ge 1}\right\}}$
of Archimedean copulas, with generator function
 $\varphi_p(u)\coloneqq ({-}\log(u))^p$
,
 $p\ge 1$
. This is an extreme-value family of copulas. In particular, we have
 \begin{align*}C_p({\textbf{U}})=\exp\left({-}\left(\sum_{j=1}^d\left({-}\log(u_j)\right)^p\right)^{1/p}\right)= 1- {\left\Vert{\textbf{1}}-{\textbf{U}}\right\Vert}_p + o({\left\Vert{1-{\textbf{U}}}\right\Vert}) \end{align*}
as  ${\textbf{U}}\in(0,1]^d$
converges to
 ${\textbf{1}}\in{\mathbb{R}}^d$
, i.e. condition (16) is satisfied, where the D-norm is the logistic norm
 ${\left\Vert\cdot\right\Vert}_p$
and the limiting distribution is
 $G({\textbf{\textit{x}}})=\exp({-}{\left\Vert{\textbf{\textit{x}}}\right\Vert}_p)$
. The copula
 $C_p$
also satisfies conditions (23). To prove it, we express
 $C_p\left({\textbf{1}}+{\textbf{\textit{x}}}/n\right)$
as the function composition
 $(\ell\circ \varphi_n)({\textbf{\textit{x}}})$
, with
 $\ell$
as in the proof of Lemma 2.1 and
 $\varphi_n({\textbf{\textit{x}}})\coloneqq \log\left(C_p\left({\textbf{1}}+{\textbf{\textit{x}}}/n\right)\right)$
. Observe that
 \begin{equation*}n\varphi_n({\textbf{\textit{x}}})=-n{\left\Vert\log\left(1+\frac{{\textbf{\textit{x}}}}n\right)\right\Vert}_p =\!:\, -nt(s_n({\textbf{\textit{x}}})),\end{equation*}
where  $t(\cdot)={\left\Vert\cdot\right\Vert}_p$
,
 $s_n({\textbf{\textit{x}}})=(s_n(x_1),\ldots,s_n(x_d))$
, and
 $s_n(\cdot)=\log(1+\cdot /n)$
. Hence, applying Faá di Bruno’s formula to the partial derivatives of
 $n (\ell\circ \varphi_n(x)-1)$
and noting that, on one hand,
 $C_p\left({\textbf{1}}+{\textbf{\textit{x}}}/n\right)\to_{n\to\infty} 1$
, and on the other hand,
 \begin{align*}&\frac{\partial^k}{\partial x_{i_1},\dots,\partial x_{i_k}}{n\varphi_n({\textbf{\textit{x}}})}\\&=-n\frac{\partial^k}{\partial y_{i_1},\dots,\partial y_{i_k}} t({\textbf{\textit{y}}})\bigg|_{{\textbf{\textit{y}}}=s_n({\textbf{\textit{x}}})}\frac{\partial s_n(x_{i_1})}{\partial x_{i_1}} \cdots \frac{\partial s_n(x_{i_k})}{\partial x_{i_k}}\\&\simeq-n \prod_{j=1}^{k-1}(1-jp){\left\Vert{\textbf{\textit{x}}}\right\Vert}_p^{1-kp} n^{kp-1} \prod_{j=1}^k \frac{|x_{i_j}|^p}{x_{i_j}} n^{-k(p-1)}\prod_{j=1}^k\left(1+\frac{x_{i_j}}{n}\right)^{-1}n^{-k}\\&\to_{n\to\infty} -\frac{\partial^k}{\partial x_{i_1},\dots,\partial x_{i_k}}{\left\Vert{\textbf{\textit{x}}}\right\Vert}_p,\end{align*}
the desired result obtains. In particular, notice that we pass from the first to the second line above by computing partial derivatives, then from the second to the third by exploiting the asymptotic equivalence  $\log(1+y)\simeq y$
for
 $y \to 0$
.
Example 2.2. Consider the copula
 \begin{equation} C({\textbf{U}})=1-d+\sum_{j=1}^d u_j+\sum_{2\leq i\leq d}\bigg(({-}1)^i\sum_{\substack{B\subseteq\{1,\ldots,d\}\\ |B|=i}}\bigg(\sum_{j\in B} \frac{1}{1-u_j}-d+1\bigg)^{-1}\bigg). \end{equation}
This provides the d-dimensional version (with  $d\geq2$
) of the 2-dimensional copula associated to the distribution function discussed in [Reference Resnick25, Example 5.14]. It can be checked that
 $C\in\mathcal{D}(C_G)$
, where
 $C_G$
is, for all
 ${\textbf{U}}\in[0,1]^d$
, the extreme-value copula
 \begin{equation} C_G({\textbf{U}})=\exp\bigg(\sum_{j=1}^d \log u_j+\sum_{2\leq i\leq d}\bigg(({-}1)^{i+1}\sum_{\substack{B\subseteq\{1,\ldots,d\}\\ |B|=i}}\bigg(\sum_{j\in B} \frac{1}{\log u_j}-d+1\bigg)^{-1}\bigg)\bigg). \end{equation}
Then, by Proposition 3.1.5 and Corollary 3.1.12 in [Reference Falk12], the copula in (24) satisfies condition (16) with D-norm
 \begin{equation*} {\left\Vert{\textbf{\textit{x}}}\right\Vert}_D=\sum_{j=1}^d|x_j|+\sum_{2\leq i\leq d}\bigg(({-}1)^{i+1}\sum_{\substack{B\subseteq\{1,\ldots,d\}\\ |B|=i}}\bigg(\sum_{j\in B} \frac{1}{|x_j|}\bigg)^{-1}\bigg).\end{equation*}
The copula in (24) also complies with the conditions in (23). Indeed, for  $2 \leq k \leq d$
,
 \begin{equation*} \frac{\partial^k}{\partial x_{i_1},\dots,\partial x_{i_k}}{\left\Vert{\textbf{\textit{x}}}\right\Vert}_D= \sum_{k\leq j\leq d}\bigg(({-}1)^{\:j+1}k!\sum_{\substack{{\mathcal I} \subseteq B \subseteq \{1, \ldots,d\}\\ |B|=j}}\bigg(\sum_{l\in B}\frac{1}{|x_l|}\bigg)^{-(k+1)}\prod_{v=1}^k\frac{1}{x_{i_v}^2}\frac{|x_{i_v}|}{x_{i_v}} \bigg),\end{equation*}
where  ${\mathcal I}=\{i_1,\ldots,i_k\}$
. When
 $k=1$
,
 $(\partial/\partial x_{i_k}){\left\Vert{\textbf{\textit{x}}}\right\Vert}_D $
is given by the expression on the right-hand side of the above formula plus the term
 $|x_{i_k}|/x_{i_k}$
. Furthermore, for
 $2 \leq k \leq d$
,
 \begin{align*} &\frac{\partial^k}{\partial x_{i_1},\dots,\partial x_{i_k}}C({\textbf{1}}+{\textbf{\textit{x}}}/n)\\ &=\frac{1}{n}\bigg(\sum_{k\leq j\leq d}\bigg( ({-}1)^{\:j+1}k!\sum_{\substack{{\mathcal I} \subseteq B \subseteq \{1, \ldots,d\}\\ |B|=j}}\bigg(\sum_{l\in B}\frac{1}{x_l}+\frac{d-1}{n}\bigg)^{-(k+1)}\prod_{v=1}^k\frac{1}{x_{i_v}^2} \bigg)\bigg). \end{align*}
When  $k=1$
,
 $n(\partial/\partial x_{i_k}) C({\textbf{1}}+{\textbf{\textit{x}}}/n)$
is given by the expression on the right-hand side of the above formula plus 1. Therefore, for
 $k=1, \ldots, d$
, we have that
 \begin{equation*} n\frac{\partial^k}{\partial x_{i_1},\dots,\partial x_{i_k}}C({\textbf{1}}+{\textbf{\textit{x}}}/n)\to_{n\to\infty}-\frac{\partial^k}{\partial x_{i_1},\dots,\partial x_{i_k}}{\left\Vert{\textbf{\textit{x}}}\right\Vert}_D ,\end{equation*}
and the desired result obtains.
Let C be a copula and  $C^{(n)}$
be the copula of the corresponding componentwise maxima, see (12). We recall that
 $C^{(n)}({\textbf{U}})\coloneqq C^n({\textbf{U}}^{1/n})$
,
 ${\textbf{U}} \in [0,1]^d$
. Assume that
 $C\in\mathcal{D}(C_G)$
, where
 $C_G$
is an extreme-value copula. A readily demonstrable result implied by Theorem 2.2 is the convergence of
 $C^{(n)}$
to
 $C_G$
in variational distance.
Corollary 2.1. Assume C satisfies conditions (16) and (23), with continuous partial derivatives of order up to d on  $(0,1)^d$
; then
 \begin{equation*} \sup_{A \in \mathbb{B}^d\cap [0,1]^d}|C^{(n)}(A)-C_G(A)|\to_{n\to\infty}0.\end{equation*}
Proof. For any  ${\textbf{U}} \in [0,1]^d$
, define
 \begin{equation*} \widetilde{C}^{(n)}({\textbf{U}})\coloneqq {\textrm{P}}\big(n\big({\textbf{\textit{M}}}^{(n)}-{\textbf{1}}\big)\leq \log {\textbf{U}} \big)=C^n(1+\log {\textbf{U}} /n).\end{equation*}
By Theorem 2.2,  $\widetilde{C}^{(n)}$
converges to
 $C_G$
in variational distance. Now, for some
 $\varepsilon\in(0,1)$
, set
 \begin{equation*} \mathcal{U}_\varepsilon\coloneqq \cup_{j=1}^d\big\{{\textbf{U}} \in [0,1]\,:\, u_j <\varepsilon \text{ or } u_j>1-\varepsilon\big\}.\end{equation*}
In particular, fix  $\varepsilon>0$
such that
 $C_G\big(\mathcal{U}_\varepsilon^{\complement}\big)>1-\varepsilon_0$
, for some arbitrarily small
 $\varepsilon_0\in(0,1)$
. Then, using the Taylor expansion
 $u^{1/n}=1+n^{-1}\log u+o(1/n)$
, with uniform remainder over
 $\mathcal{U}_\varepsilon^{\complement}$
, together with the Lipschitz continuity of C, we obtain
 \begin{equation*} \sup_{{\textbf{U}} \in \mathcal{U}_\varepsilon^{\complement}}\big|C^{(n)}({\textbf{U}})-\widetilde{C}^{(n)}({\textbf{U}})\big|\to_{n \to \infty}0,\end{equation*}
and therefore  $ \lim\sup_{n \to \infty} C^{(n)}(\mathcal{U}_\varepsilon)<\varepsilon_0. $
This implies that, as
 $n \to \infty$
, we have
 \begin{equation} \sup_{A \in \mathbb{B}^d\cap [0,1]^d}\big|C^{(n)}(A)-C_G(A) \big| \leq \sup_{A \in \mathbb{B}^d\cap \,\mathcal{U}_\varepsilon^{\complement}}\big|C_\varepsilon^{(n)}(A)-\widetilde{C}_\varepsilon^{(n)}(A)\big|+O(\varepsilon_0), \end{equation}
where  $C_\varepsilon^{(n)}$
and
 $\widetilde{C}^{(n)}_\varepsilon$
are the normalised versions
 $C_\varepsilon^{(n)}=C^{(n)}/C^{(n)}\big(\mathcal{U}_\varepsilon^{\complement}\big)$
and
 $\widetilde{C}^{(n)}_\varepsilon=\widetilde{C}^{(n)}/\break \widetilde{C}^{(n)}\big(\mathcal{U}_\varepsilon^{\complement}\big)$
. Finally, denote their densities by
 $c_\epsilon^{(n)}$
and
 $\widetilde{c}_\varepsilon^{(n)}$
, respectively. Then the supremum on the right-hand side in (26) is attained at the set
 \begin{equation*} \widetilde{\mathcal{U}}_\varepsilon^{(n)}\coloneqq \big\{{\textbf{U}} \in \mathcal{U}_\varepsilon^{\complement}\,:\, c_\varepsilon^{(n)}({\textbf{U}})>\widetilde{c}_\varepsilon^{(n)}({\textbf{U}})\big\}.\end{equation*}
Notice that  $c_\varepsilon^{(n)}$
and
 $\widetilde{c}_\varepsilon^{(n)}$
are both positive on
 $\mathcal{U}_\varepsilon^{\complement}$
, for n sufficiently large. Following steps similar to those in the proof of Theorem 2.2 and exploiting the continuity of the partial derivatives of C, we obtain
 \begin{equation*} c_\varepsilon^{(n)}({\textbf{U}})/ \widetilde{c}_\varepsilon^{(n)}({\textbf{U}})\to_{n \to \infty}1,\end{equation*}
for all  ${\textbf{U}} \in \mathcal{U}_\varepsilon^{\complement}$
. Therefore,
 $\widetilde{\mathcal{U}}_\varepsilon^{(n)} \downarrow\emptyset$
as
 $n\to\infty$
and the result follows.□
3. The general case
Let  ${\textbf{\textit{X}}}=(X_1,\dots,X_d)$
be a random vector with arbitrary distribution function F. By Sklar’s theorem [Reference Sklar26, Reference Sklar27] we can assume the representation
 \begin{equation*}{\textbf{\textit{X}}}=(X_1,\dots,X_d)=\left(F_1^{-1}(U_1),\dots,F_d^{-1}(U_d)\right)\!,\end{equation*}
where  $F_j$
is the distribution function of
 $X_j$
,
 $j=1,\dots,d$
, and
 ${\textbf{U}}=(U_1,\dots,U_d)$
follows a copula, say C, corresponding to F.
Let  ${\textbf{\textit{X}}}^{(1)},{\textbf{\textit{X}}}^{(2)},\dots$
be independent copies of
 ${\textbf{\textit{X}}}$
and let
 ${\textbf{U}}^{(1)},{\textbf{U}}^{(2)},\dots$
be independent copies of
 ${\textbf{U}}$
. Again, we can assume the representation
 \begin{equation*}{\textbf{\textit{X}}}^{(i)}= \left(X_1^{(i)},\dots,X_d^{(i)}\right)=\left(F_1^{-1}\left(U_1^{(i)}\right),\dots,F_d^{-1}\left(U_d^{(i)}\right)\right),\qquad i=1,2,\dots.\end{equation*}
From the fact that each quantile function  $F_j^{-1}$
is monotone increasing, we obtain
 \begin{align*}&{\textbf{\textit{M}}}^{(n)}\\[2pt] &\coloneqq \bigg(\max_{1\le i\le n}X_1^{(i)},\dots,\max_{1\le i\le n}X_d^{(i)} \bigg)\\[2pt] &=\bigg(\max_{1\le i\le n}F_1^{-1}\big(U_1^{(i)}\big),\dots,\max_{1\le i\le n}F_d^{-1}\big(U_d^{(i)} \big) \bigg)\\[2pt] &= \bigg(F_1^{-1}\bigg(\max_{1\le i\le n}U_1^{(i)} \bigg),\dots, F_d^{-1}\bigg(\max_{1\le i\le n}U_d^{(i)} \bigg) \bigg)\\[2pt] &= \left(F_1^{-1}\left(1+\frac 1n \bigg(n \bigg(\max_{1\le i\le n}U_1^{(i)}-1\bigg) \bigg) \right)\!,\dots, F_d^{-1}\left(1+\frac 1n \bigg(n \bigg(\max_{1\le i\le n}U_d^{(i)}-1\bigg) \bigg) \right) \right)\!.\end{align*}
Theorem 2.1 now implies the following result.
Proposition 3.1. Let  ${\boldsymbol{\eta}}=(\eta_1,\dots,\eta_d)$
be a random vector with standard multivariate max-stable distribution function
 $G({\textbf{\textit{x}}})=\exp({-}{\left\Vert{\textbf{\textit{x}}}\right\Vert}_D)$
,
 ${\textbf{\textit{x}}}\le{\textbf{0}}\in{\mathbb{R}}^d$
. Let
 ${\textbf{\textit{X}}}$
be a random vector with some distribution F and a copula C. Suppose that either C is a GPC with corresponding D-norm
 ${\left\Vert\cdot\right\Vert}_D$
, which has partial derivatives of order
 $d\ge 2$
, or C satisfies conditions (16) and (23). Then,
 \begin{equation*} \sup_{A\in\mathbb B^d}{\left\vert{{\textrm{P}}\big({\textbf{\textit{M}}}^{(n)}\in A\big)- {\textrm{P}}\left(\left(F_1^{-1}\left(1+\frac 1n\eta_1 \right)\!,\dots, F_d^{-1}\left(1+\frac 1n \eta_d\right) \right)\in A\right)}\right\vert} \to_{n\to\infty}0. \end{equation*}
Finally, we generalise the result in Proposition 3.1 to the case where the random vector of componentwise maxima is suitably normalised. Precisely, we now consider the case that  $F \in \mathcal{D}(G_{{\boldsymbol{\gamma}}}^*)$
, i.e. F belongs to the domain of attraction of a generalised multivariate max-stable distribution function
 $G_{{\boldsymbol{\gamma}}}^*$
, with tail indices
 ${\boldsymbol{\gamma}}=(\gamma_1,\ldots,\gamma_d)$
, e.g. [Reference Falk, Padoan and Wisheckel14, Chapter 4]. This means that there exist sequences of norming vectors
 ${\textbf{\textit{a}}}_n=\big(a_{n}^{(1)},\ldots,a_{n}^{(d)}\big)>{\textbf{0}}$
and
 ${\textbf{\textit{b}}}_n=\big(b_n^{(1)},\ldots,b_n^{(d)}\big)\in{\mathbb{R}}^d$
, for
 $n\in{\mathbb{N}}$
, such that
 $({\textbf{\textit{M}}}^{(n)}-{\textbf{\textit{b}}}_n)/{\textbf{\textit{a}}}_n \to_{D} {\textbf{\textit{Y}}}$
as
 $n \to \infty$
, where
 ${\textbf{\textit{Y}}}$
is a random vector with distribution
 $G_{{\boldsymbol{\gamma}}}^*$
. The copula of
 $G_{{\boldsymbol{\gamma}}}^*$
is the extreme-value copula in (14), and its margins
 $G_{\gamma_j}^*$
,
 $j=1,\ldots,d$
, are members of the generalised extreme-value family of distribution functions in (6).
To attain convergence in variational distance, we combine Proposition 3.1, obtained under conditions involving only dependence structures, with univariate von Mises conditions on the margins  $F_1,\ldots, F_d$
, see (7)–(10). We denote the vector of endpoints by
 ${\textbf{\textit{x}}}_0\coloneqq (x_{0}^{(1)}, \ldots, x_{0}^{(d)})$
, where
 $x_{0}^{(\,j)}\coloneqq \sup\{x \in {\mathbb{R}}\,:\, F_j(x)<1\}$
,
 $j=1,\ldots,d$
.
Corollary 3.1. Let  ${\textbf{\textit{Y}}}$
and
 ${\textbf{\textit{X}}}$
be random vectors with a generalised multivariate max-stable distribution function
 $G_{{\boldsymbol{\gamma}}}^*$
and a continuous distribution function F, respectively. Assume that
 $F \in \mathcal{D}(G_{{\boldsymbol{\gamma}}}^*)$
and that its copula C satisfies the assumptions of Proposition (3.1). Assume further that, for
 $1\leq j\leq d$
, the density of the jth margin
 $F_{j}$
of F satisfies one of the conditions (8)–(10) with fʹ,
 $\gamma$
, and
 $x_0$
replaced by
 $f_j'$
,
 $\gamma_j$
, and
 $x_{0}^{(\,j)}$
. Then,
 \begin{align*} &\sup_{A\in\mathbb B^d}{\left\vert{{\textrm{P}}\bigg(\frac{{\textbf{\textit{M}}}^{(n)}-{\textbf{\textit{b}}}_n}{{\textbf{\textit{a}}}_n}\in A\bigg)- {\textrm{P}}\left({\textbf{\textit{Y}}}\in A\right)}\right\vert}\to_{n\to\infty}0. \end{align*}
Proof. Let  ${\boldsymbol{\eta}}=(\eta_1, \ldots, \eta_d)$
be a random vector with standard multivariate max-stable distribution
 $G({\textbf{\textit{x}}})=\exp({-}{\left\Vert{\textbf{\textit{x}}}\right\Vert}_D)$
. Define
 \begin{equation*} {\textbf{\textit{Y}}}_n\coloneqq \left(\frac{1}{a_n^{(1)}}\left(F_1^{-1}\left(1+\frac 1n \eta_1\right)-b_n^{(1)}\right)\!, \ldots, \frac{1}{a_n^{(d)}}\left(F_d^{-1}\left(1+\frac 1n \eta_d\right)-b_n^{(d)}\right)\right)\!.\end{equation*}
Observe that
 \begin{align} \nonumber \sup_{A\in\mathbb B^d}{\left\vert{{\textrm{P}}\bigg(\frac{{\textbf{\textit{M}}}^{(n)}-{\textbf{\textit{b}}}_n}{{\textbf{\textit{a}}}_n}\in A\bigg)- {\textrm{P}}\left({\textbf{\textit{Y}}}\in A\right)}\right\vert} \leq T_{1,n}+T_{2,n}, \end{align}
where
 \begin{equation*} T_{1,n}\coloneqq \sup_{A\in\mathbb B^d}{\left\vert{{\textrm{P}}\big({\textbf{\textit{M}}}^{(n)}\in A\big)- {\textrm{P}}\left(\left(F_1^{-1}\left(1+\frac 1n\eta_1 \right)\!,\dots, F_d^{-1}\left(1+\frac 1n \eta_d\right) \right)\in A\right)}\right\vert}\end{equation*}
and
 \begin{equation*} T_{2,n}\coloneqq \sup_{A\in\mathbb B^d}{\left\vert{{\textrm{P}}\left({\textbf{\textit{Y}}}_{n}\in A\right)- {\textrm{P}}\left( {\textbf{\textit{Y}}} \in A\right)}\right\vert}.\end{equation*}
By Proposition 3.1,  $T_{1,n} \to_{n \to \infty}0$
. To show that
 $T_{2,n} \to_{n \to \infty}0$
, it is sufficient to show pointwise convergence of the probability density function of
 ${\textbf{\textit{Y}}}_n$
to that of
 ${\textbf{\textit{Y}}}$
and then to appeal to Scheffé’s lemma. First, notice that
 $G_{{\boldsymbol{\gamma}}}^*$
and G have the same extreme-value copula. Thus, from (14) it follows that, for
 ${\textbf{\textit{x}}} \in {\mathbb{R}}^d$
,
 $ G_{{\boldsymbol{\gamma}}}^*({\textbf{\textit{x}}})=G({\textbf{U}}({\textbf{\textit{x}}})), $
where
 ${\textbf{U}}({\textbf{\textit{x}}})=\big(u^{(1)}(x_1), \ldots, u^{(d)}(x_d)\big)$
with
 $u^{(\,j)}(x_j)=\log G^*_{\gamma_j}(x_j)$
for
 $j=1,\ldots,d$
. Now, define
 $ Q^{(n)}({\textbf{\textit{x}}})\coloneqq {\textrm{P}}({\textbf{\textit{Y}}}_n\leq {\textbf{\textit{x}}})=G({\textbf{U}}_n({\textbf{\textit{x}}})), $
for
 ${\textbf{\textit{x}}} \in \mathbb{R}^d$
, where
 ${\textbf{U}}_{n}({\textbf{\textit{x}}})=\big(u_n^{(1)}(x_1), \ldots,u_n^{(d)}(x_d) \big)$
with
 \begin{equation*} u_n^{(\,j)}(x_j)\coloneqq -n\big(1-F_j\big(a_n^{(\,j)}{x_j}+b_n^{(\,j)}\big)\big), \qquad 1\leq j\leq d.\end{equation*}
Consequently, as  $n \to \infty$
,
 \begin{align} \nonumber \frac{\partial^d}{\partial x_1 \cdots \partial x_d} Q^{{(n)}}({\textbf{\textit{x}}})&= g({\textbf{U}}_n({\textbf{\textit{x}}})) \prod_{j=1}^d \frac{n a_n^{(\,j)}F_j\big(a_n^{(\,j)}x_j+b_n^{(\,j)}\big)^{n-1} f_j\big(a_n^{(\,j)}x_j+b_n^{(\,j)}\big)}{F_j\big(a_n^{(\,j)}x_j+b_n^{(\,j)}\big)^{n-1}}\\[3pt] \nonumber \nonumber& \simeq g({\textbf{U}}({\textbf{\textit{x}}})) \prod_{j=1}^d \frac{g^*_{\gamma_j}(x_j)}{G^*_{\gamma_j}(x_j)}\\[3pt] \nonumber&= \frac{\partial^d}{\partial x_1 \cdots \partial x_d} G({\textbf{U}}({\textbf{\textit{x}}}))=\frac{\partial^d}{\partial x_1 \cdots \partial x_d}G_{{\boldsymbol{\gamma}}}^*({\textbf{\textit{x}}}), \end{align}
where g is as in (21) and  $g^*_{\gamma_j}(x)=(\partial/\partial x)G^*_{\gamma_j}(x)$
,
 $1\leq j\leq d$
. In particular, the second line follows from the continuity of g and Proposition 2.5 in [Reference Resnick25]. The proof is now complete.□
4. Applications
The strong convergence results established in Sections 2 and 3 can be used to refine asymptotic statistical theory for extremes. Max-stable distributions have been used for modelling extremes in several statistical analyses, e.g. [Reference Coles7, Chapter 8], [Reference Beirlant, Goegebeur, Segers and Teugels1, Chapter 9], [Reference Marcon, Padoan, Naveau, Muliere and Segers21, Reference Mhalla, Chavez-Demoulin and Naveau22], to name a few. Parametric and nonparametric inferential procedures have been proposed for fitting max-stable models to the data; see, e.g., [Reference Berghaus, Bücher and Dette3, Reference Dombry, Engelke and Oesting11, Reference Gudendorf and Segers17, Reference Marcon, Padoan, Naveau, Muliere and Segers21]. The asymptotic theory of the corresponding estimators is well established assuming that a sample of (componentwise) maxima follows a max-stable distribution. In practice, the latter provides only an approximate distribution for sample maxima. The recent results in [Reference Berghaus and Bücher2, Reference Bücher and Segers5, Reference Dombry10, Reference Ferreira and de Haan15] account for such model misspecification in the univariate setting. In the multivariate case, in [Reference Bücher and Segers4] weak convergence and consistency in probability of empirical copulas have been studied under suitable second-order conditions; see also [Reference Bücher, Volgushev and Zou6]. This is the only multivariate contribution focusing on the problem of convergences under model misspecification, as far as we know. In the following we illustrate how our variational convergence results, obtained under conditions (16) and (23), allow us to establish a stronger form of consistency, for both frequentist and Bayesian procedures. To do that, we resort to the notion of remote contiguity introduced in [Reference Kleijn19].
Definition 4.1. Let  ${r_k,s_k}$
,
 $k\in{\mathbb{N}}$
, be real-valued sequences such that
 $0 < r_k,s_k \to_{k \to \infty} 0$
. Let
 $\mu_k$
and
 $\nu_k$
be sequences of probability measures. Then,
 $\nu_k$
is said to be
 $r_k$
-to-
 $s_k$
-remotely contiguous with respect to
 $\mu_k$
if
 $\mu_k(E_k) = o(r_k)$
, for a sequence of measurable events
 $E_k$
, implies
 $\nu_k(E_k)=o(s_k)$
. In this case, we write
 $s_k^{-1}\nu_k \triangleleft r_k^{-1}\mu_k$
.
4.1. Frequentist approach
Let  $\Theta$
denote a parameter space (possibly infinite dimensional) and
 $\theta \in \Theta$
be a parameter of interest. Let
 ${\textbf{\textit{Y}}}$
be a d-dimensional random vector with a distribution function F pertaining to a probability measure
 $\mu_0$
on
 $\mathbb{B}^d$
. Denote by
 $\mu_k$
the corresponding k-fold product measure. Let
 ${\textbf{\textit{Y}}}^{(1:k)}=\big({\textbf{\textit{Y}}}^{(1,k)}, \ldots,{\textbf{\textit{Y}}}^{(k,k)}\big)$
be a sequence of k i.i.d. copies of
 ${\textbf{\textit{Y}}}$
. Consider a measurable map
 $T_k\,: \times_{i=1}^k\mathbb{R}^d \to \Theta$
and let
 \begin{equation*}\widehat{\theta}_k\coloneqq T_k\big({\textbf{\textit{Y}}}^{(1:k)}\big)\end{equation*}
be an estimator of  $\theta$
. Let
 $\mathscr{D}$
denote a metric on
 $\Theta$
.
If for every  $\varepsilon>0$
there are constants
 $c_\varepsilon,c^{\prime}_\varepsilon>0$
such that
 $\mu_k\big(\mathscr{D}(\widehat{\theta}_k,\theta)>\varepsilon\big)=o(\textrm{e}^{-c_\varepsilon k})$
and
 $k^{1+c^{\prime}_\varepsilon}\nu_k \triangleleft \textrm{e}^{c_\varepsilon k} \mu_k$
, then we can conclude by the Borel–Cantelli lemma that
 \begin{equation*}\mathscr{D}\big(T_k\big({\textbf{\textit{Z}}}^{(1:k)}\big), \theta\big)\to_{k \to \infty}0 \qquad \nu_k\text{-almost surely},\end{equation*}
where  ${\textbf{\textit{Z}}}^{(1:k)}=\big({\textbf{\textit{Z}}}^{(1,k)}, \ldots,{\textbf{\textit{Z}}}^{(k,k)}\big)$
is a sequence of i.i.d. random vectors with common probability measure
 $\nu_{0,k}$
on
 $\mathbb{B}^d$
, and
 $\nu_k$
is the corresponding k-fold product measure. The required form of remote contiguity easily obtains if
 $\sup_{A \in \mathbb{B}^d}|\nu_{0,k}(A)-\mu_0(A)|\to_{k \to \infty}0$
, and
 $\mu_0$
and
 $\nu_{0,k}$
have the same support and continuous Lebesgue densities,
 $p_{0,k}$
and
 $m_0$
, satisfying
 \begin{equation}\sup_{k \geq k_0} \rho_\delta(\nu_{0,k},\mu_0)\coloneqq \sup_{k \geq k_0}\int_{\mathcal{X}_{\delta,k}}\left(p_{0,k}({\textbf{\textit{x}}})/ m_{0}({\textbf{\textit{x}}})\right)^\delta p_{0,k}({\textbf{\textit{x}}}){\textrm{d}}{\textbf{\textit{x}}} <\infty \end{equation}
for some  $\delta\in (0,1]$
and
 $k_0\in \mathbb{N}$
, where
 $\mathcal{X}_{\delta,k}=\{{\textbf{\textit{x}}} \in \mathbb{R}^d\,:\, p_{0,k}({\textbf{\textit{x}}})/ m_{0}({\textbf{\textit{x}}})>\textrm{e}^{1/\delta}\}$
. Essentially, variational convergence and (27) guarantee that the fourth moments and the expectations of the triangular array of variables
 $ \{\log p_{0,k}({\textbf{\textit{Z}}}^{(i,k)})-\log m_0({\textbf{\textit{Z}}}^{(i,k)}), 1 \leq i \leq k;\, k\geq k_0+k_0'\}$
are uniformly bounded and asymptotically null, respectively, for a sufficiently large
 $k_0' \in \mathbb{N}$
. The corresponding sequence of (rescaled) log-likelihood ratios then converges to 0 by the strong law of large numbers.
This novel asymptotic technique can be fruitfully applied to parameter estimation problems for multivariate max-stable models. In this context, the probability measure  $\mu_0$
can be associated to a multivariate max-stable distribution function
 $G_{{\boldsymbol{\gamma}}}^*$
or to its extreme-value copula. Accordingly, we see the probability measure
 $\nu_{0,k}$
as associated to the dostribution function of a normalized random vector of componentwise maxima, computed over a number of underlying random variables indexed by k, say
 $n_k$
.
Exploiting Corollary 2.1, herein we specialise the above procedure to the estimation of an extreme-value copula via the empirical copula of sample maxima. First, we recall some basic notions. Let  ${\textbf{\textit{Z}}}^{(1:k)}$
be a sequence of i.i.d. copies of a random vector
 ${\textbf{\textit{Z}}}$
with some copula C. Then, the empirical copula function
 $\widehat{C}_k$
is a map
 $T_k:\times_{i=1}^k\mathbb{R}^d \mapsto \ell^\infty([0,1]^d)$
defined by
 \begin{align*}&\widehat{C}_k\big({\textbf{U}};\, {\textbf{\textit{Z}}}^{(1:k)}\big)\coloneqq \big(T_k\big({\textbf{\textit{Z}}}^{(1:k)}\big)\big)({\textbf{U}}) \\[3pt] &=\frac{1}{k}\sum_{i=1}^k {\textrm{1}}\left(\frac{\sum_{l=1}^k {{\textrm{1}}\big(Z^{(l,k)}_1 \leq Z^{(i,k)}_1\big)}}{k}\leq \,u_1, \ldots, \frac{\sum_{l=1}^k {\textrm{1}}\big(Z^{(l,k)}_d \leq Z^{(i,k)}_d\big)}{k} \leq \,u_d\right)\!,\end{align*}
for  ${\textbf{U}} \in [0,1]^d$
, with
 ${\textrm{1}}(E)$
denoting the indicator function of the event E.
Proposition 4.1. Let  ${\textbf{\textit{M}}}^{(n)}=\big(M_1^{(n)},\ldots,M_d^{(n)}\big)$
, and C and G be as in Proposition 3.1, with C satisfying the assumptions of Corollary 2.1. Let
 ${\textbf{\textit{M}}}^{(n,1:k)}=\big({\textbf{\textit{M}}}^{(n,1)}, \ldots,{\textbf{\textit{M}}}^{(n,k)}\big)$
be k independent copies of
 ${\textbf{\textit{M}}}^{(n)}$
, with
 $n\equiv n_k \to_{k \to \infty} \infty$
. Assume that
 $C^{(n)}$
and
 $C_G$
satisfy
 \begin{equation} \sup_{k\geq k_0}\rho_\delta\left(C^{(n)},C_G\right)
< \infty \end{equation}
for some  $\delta \in (0,1]$
and
 $k_0 \in \mathbb{N}$
, with
 $\rho_\delta$
as in (27). Then, almost surely,
 \begin{equation*} \sup_{{\textbf{U}} \in [0,1]^d}\big|\widehat{C}_k({\textbf{U}})- C_G({\textbf{U}})\big|\to_{k \to \infty}0,\end{equation*}
where  $\widehat{C}_k \equiv \widehat{C}_k\big(\cdot \, ;\, {\textbf{\textit{M}}}^{(n,1:k)}\big)$
.
For the proof of Proposition 4.1 we establish the following remote contiguity relation.
Lemma 4.1. Let  $C^{(n,k)}$
and
 $C^k_G$
denote the k-fold product measures pertaining to
 $C^{(n)}$
and
 $C_G$
, respectively. Then
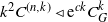 $k^{2}C^{(n,k)} \triangleleft \textrm{e}^{ck} C^k_G$
, for any
 $c>0$
.
Proof. Let  $E_k$
,
 $k=1,2, \ldots$
be a sequence of measurable events satisfying
 $C_G^{k}(E_k)=o\big(\textrm{e}^{-ck}\big)$
, for some
 $c>0$
. It is not difficult to see that, for any
 $\varepsilon>0$
,
 \begin{equation*} C^{(n,k)}(E_k) \leq \textrm{e}^{\varepsilon k} C_G^k(E_k)+C^{(n,k)}( S_k>\varepsilon k ),\end{equation*}
where  $S_k = \sum_{i=1}^k \log \{c^{(n)}({\textbf{U}}^{(n,i)})/c_G({\textbf{U}}^{(n,i)})\}$
,
 ${\textbf{U}}^{(n,i)}, \, 1 \leq i \leq k,$
are i.i.d. according to
 $C^{(n)}$
, and
 $c^{(n)}$
and
 $c_G$
are the Lebesgue densities of
 $C^{(n)}$
and
 $C_G$
, respectively. Choosing
 $\varepsilon<c$
, the first term on the right-hand side is of order
 $o\big(\textrm{e}^{-(c-\varepsilon)k}\big)$
. As for the second term, as
 $k \to +\infty$
we have that
 $n\equiv n_k\to\infty$
and, by Corollary 2.1,
 $ \varepsilon_k\coloneqq \sup_{A \in \mathbb{B}^d\cap [0,1]^d}|C^{(n)}(A)-C_G(A)|=o(1)$
. Thus, defining
 \begin{equation*} \eta_{\alpha,k}\coloneqq \textrm{E}\left[ \log^\alpha \left\{\frac{c^{(n)}\left({\textbf{U}}^{(n,1)}\right)}{c_G\left({\textbf{U}}^{(n,1)}\right)}\right\} \right], \qquad \alpha \in \mathbb{N},\end{equation*}
under assumption (28), Theorem 6 in [Reference Wong and Shen28] guarantees that, as  $k \to +\infty$
,
 $ \max_{i=1, 2}\eta_{i,k}= O(\varepsilon_k \log^2(1/\varepsilon_k)) \leq \varepsilon/2. $
Furthermore, simple analytical derivations lead to
 \begin{equation*} \sup_{k \geq k_0} ({-}\eta_{3,k})\leq 1+ \sup_{k \geq k_0}\eta_{4,k} \leq 2 + \log^4(K)+\sup_{k \geq k_0}\rho_\delta\left(C^{(n)},C_G\right)<+\infty \end{equation*}
for some large but fixed  $K>\textrm{e}^{1/\delta}$
. Together with the triangular and Markov inequalities, these facts entail that, as
 $k \to +\infty$
,
 \begin{equation*} \begin{split} C^{(n,k)}( S_k>\varepsilon k ) & \leq C^{(n,k)}( |S_k-k\eta_{1,k}|>\varepsilon/2 k )\\[3pt] & \leq \left(\frac{2}{\varepsilon k}\right)^4\textrm{E}\left[ (S_k-k\eta_{1,k})^4\right]\\[3pt] & \leq \left(\frac{2}{\varepsilon }\right)^4 \left[\frac{1}{k^3}\left(\eta_{4,k}-4\eta_{1,k}\eta_{3,k}+6\eta_{1,k}^2 \eta_{2,k}\right)+\frac{3}{k^2}\left(\eta_{2,k}-\eta_{1,k}\right)^2 \right]\\[3pt] &=o\left(k^{-2}\right), \end{split} \end{equation*}
where in the third line we exploit the nonnegativity of  $\eta_{1,k}$
. The result now follows.□
The top left and right panels display the densities  $c_G$
and c of the copula models in (25) and (24), respectively. The middle left panel shows the density
 $c^{(n)}$
of the copula
 $C^{(n)}$
pertaining to the copula model in (24), with sample size
 $n=100$
. The middle right to bottom right panels depict the density ratio
 $c^{(n)}/c_G$
for
 $n=2,50,100$
, respectively.

Proof of Proposition 4.1. Let  ${\textbf{\textit{V}}}$
be a random vector distributed according to the extreme-value copula
 $C_G$
. Let
 ${\textbf{\textit{V}}}^{(1:k)}=\big({\textbf{\textit{V}}}^{(1)}, \ldots, {\textbf{\textit{V}}}^{(k)}\big)$
be a sequence of i.i.d. copies of
 ${\textbf{\textit{V}}}$
with joint distribution
 $C_G^{(k)}$
. Then, standard empirical process arguments (see, e.g., [Reference Deheuvels9, Reference Gudendorf and Segers17, Reference Wellner29]) yield that, for any
 $\varepsilon>0$
,
 \begin{equation*} \begin{split} &C_G^{(k)}\Bigg(\sup_{{\textbf{U}} \in [0,1]^d}\left|\widehat{C}_k\left({\textbf{U}};\, {\textbf{\textit{V}}}^{(1:k)}\right)- C_G({\textbf{U}})\right|>\varepsilon\Bigg) \\ &\quad \leq 2d\exp\left({-}\frac{b_\varepsilon^2k}{(d+1)^2}\right)+16\frac{kb_\varepsilon^2}{(d+1)^2} \exp\left({-}\frac{2b_\varepsilon^2k}{(d+1)^2}\right) \end{split} \end{equation*}
for some  $b_\varepsilon\in(0, \varepsilon)$
. The term on the right-hand side is of order
 $O\big(\textrm{e}^{-c_\varepsilon k}\big)$
for some
 $c_\varepsilon>0$
. By Lemma 4.1, we have that
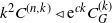 $k^2 C^{(n,k)}\triangleleft \textrm{e}^{ck}C_G^{(k)}$
for all
 $c>0$
, where
 $C^{(n,k)}$
is the k-fold product measure corresponding to
 $C^{(n)}$
. Let
 ${\textbf{U}}^{(n,1:k)}=\big({\textbf{U}}^{(n,1)}, \ldots, {\textbf{U}}^{(n,k)}\big)$
, where
 \begin{equation*} {\textbf{U}}^{(n,i)}= \left(F_1^n\left(M_1^{(n,i)}\right), \ldots,F_d^n\left(M_d^{\left(n,i\right)}\right)\right), \qquad i=1, \ldots,k.\end{equation*}
The result now follows observing that  ${\textbf{U}}^{(n,1:k)}$
is distributed according to
 $C^{(n,k)}$
and that
 $ \widehat{C}_k({\textbf{U}})\equiv \widehat{C}_k\big({\textbf{U}};\, {\textbf{\textit{M}}}^{(n, 1:k)}\big)=\widehat{C}_k\big({\textbf{U}};\, {\textbf{U}}^{(n,1:k)}\big). $
□
Remark 4.1. Notice that the assumption in (28) of Proposition 4.1 is not overambitious. Indeed, when  $C^{(n)}$
is obtained from copulas that are extreme-value copulas, the required condition is always satisfied, while when
 $C^{(n)}$
is obtained from copulas that are in the domain of attraction of extreme-value copulas, analytically verifying (28) seems troublesome. Still, numerically checking whether some copula models meet this assumption can be fairly simple. For instance, consider the copula of Example 2.2, given in (24), and let c denote its density. Denote by
 $c^{(n)}$
the density of the copula
 $C^{(n)}$
pertaining to C and by
 $c_G$
the density of the extreme-value copula in (25). In this case, Corollary 2.1 applies and
 $C^{(n)}$
converges to
 $C_G$
in variational distance. Figure 1 displays plots of the densities c,
 $c_G$
, and
 $c^{(n)}$
with
 $n=100$
. Outside a neighbourhood of the origin, pointwise convergence of
 $c^{(n)}$
to
 $c_G$
turns out to be quite fast. In addition, the middle-right to bottom-right panels show that the density ratio
 $c^{(n)}/c_G$
is uniformly bounded by a finite constant as the sample size n increases. Consequently, the condition in (28) is satisfied.
4.2. Bayesian approach
A similar scheme is exploited by [Reference Padoan and Rizzelli23] in a Bayesian context, where the extended Schwartz theorem, e.g. [Reference Ghosal and van der Vaart16, Theorem 6.23], provides exponential bounds for posterior concentration in a neighbourhood of the true parameter. In particular, [Reference Padoan and Rizzelli23] considers a nonparametric Bayesian approach for estimating the D-norm  ${\left\Vert\cdot\right\Vert}_D$
and the densities of the associated angular measure; see [Reference Falk12, pp. 25–29]. Therein, Corollary 3.1 is leveraged to obtain a suitable remote contiguity result, allowing us to extend almost-sure consistency of the proposed estimators from the case of data following a max-stable model to the case of suitably normalised sample maxima whose distribution lies in a variational neighbourhood of the latter.
Acknowledgements
The authors are indebted to the Associate Editor and two anonymous reviewers for their careful reading of the manuscript and their constructive remarks. Simone A. Padoan is supported by the Bocconi Institute for Data Science and Analytics (BIDSA).



