INTRODUCTION
The nutritional quality of leaves appears to be a reliable predictor of the biomass of primate communities in different tropical forests (Chapman et al. Reference CHAPMAN, CHAPMAN, NAUGHTON-TREVES, LAWES and MCDOWELL2004, Ganzhorn Reference GANZHORN1992, Oates et al. Reference OATES, WHITESIDES, DAVIES, WATERMAN, GREEN, DASILVA and MOLE1990). The total biomass of folivorous primates in different primary or anthropogenic forests is consistently predicted by the protein : acid detergent fibre (protein : adf) ratio in mature tree leaves of their forests. Almost 90% of the variance in their biomass is explained by variation of the chemical index of nutritional quality (Chapman et al. Reference CHAPMAN, CHAPMAN, NAUGHTON-TREVES, LAWES and MCDOWELL2004). This result is based mainly on the study of African and Asian colobines, the so-called ‘leaf-monkeys’, but other folivorous primates like New World howler monkeys or Malagasy lemurs also show a consistent positive relationship. Astonishingly, this correlation holds for the total biomass of primate communities, including frugivorous and insectivorous species beside leaf specialists (Ganzhorn Reference GANZHORN1992, Oates et al. Reference OATES, WHITESIDES, DAVIES, WATERMAN, GREEN, DASILVA and MOLE1990).
These relationships were documented two decades ago, but it is still not clear why primate biomass is predictable from the chemistry of mature tree leaves. Primary production indeed is usually considered a major determinant of consumer biomass across food webs (Odum Reference ODUM1959). On a functional level, one also expects primates to favour staple foods with high protein : fibre concentrations (Milton Reference MILTON1979). Food choices of polygastric species like leaf-monkeys however, do sometimes, but not always, correlate with this ratio (Chapman et al. Reference CHAPMAN, CHAPMAN, BJORNDAL and ONDERDONK2002, Dasilva Reference DASILVA1994). It is also intriguing that the biomass of folivorous prosimians and whole lemur communities in Madagascar seems to be consistently lower than that of Asian and African colobines, as well as compared with whole anthropoid communities, for a given protein : adf ratio (Ganzhorn Reference GANZHORN1992, Oates et al. Reference OATES, WHITESIDES, DAVIES, WATERMAN, GREEN, DASILVA and MOLE1990). Malagasy lemurs differ from anthropoids in a number of demographic and socio-ecological characteristics, and this so-called ‘lemur syndrome’ is interpreted as an evolutionary response to the stress induced by the unusually low food supply in Madagascar (Wright Reference WRIGHT1999). This hypothesis has been challenged by the notion that phylogenetic inertia might play a greater role than food constraints in the maintaining of many characteristics considered ancestral in extant lemurs (van Schaik & Kappeler Reference VAN SCHAIK and KAPPELER1996). A detailed discussion of these views is beyond the scope of our paper but it seems likely that environmental constraints exerted on infant mortality and breeding seasonality among other life-history traits depress lemur densities today (Wright Reference WRIGHT1999). In parallel, however, recent palaeoprimatological studies in Madagascar show that a range of lemur species disappeared during the past two millennia (Crowley et al. Reference CROWLEY, GODFREY and IRWIN2011, Mulchinski et al. Reference MULCHINSKI, GODFREY, MULDOON and TONGASOA2010). This suggests that current lemur communities may not have yet reached their optimal biomass related to the environment whatever the demographic characteristics of extant species.
In our study, we aimed at better understanding if qualitative aspects of food resources determine variation in lemur abundance in Madagascar and if not what other factors including food production and species extinction might be involved. The present work focused on the interaction between lemur biomass and leaf chemistry in a gallery forest in southern Madagascar as compared with other lemur habitats and anthropoid sites for which the average ratio of protein-to-fibre in leaves is available. Our hypotheses were that (1) the cumulative biomass of folivorous species in the gallery forest is predicted by the correlation drawn for other folivorous species within lemur communities according to the protein : fibre ratio (Ganzhorn Reference GANZHORN1992), (2) the biomass of folivorous lemurs in Madagascar, including that in our study site, is consistently lower than that found for their anthropoid counterparts, the colobines from Asia and Africa, at a given protein : adf ratio, (3) the total biomass of the lemur community at Berenty is lower than that found for anthropoids at a given protein : adf ratio.
METHODS
Study site, forest composition and plant sampling
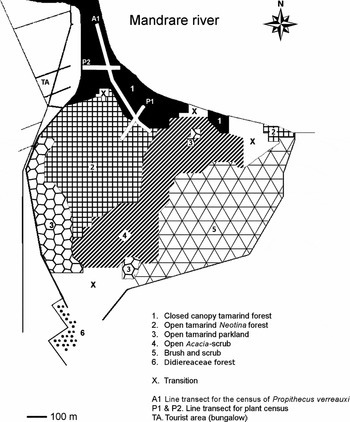
The gallery forest is located along the banks of the Mandrare river in the Berenty Reserve (25°0.29′S, 46°19.37′E) in a semi-arid sector within Madagascar's southern biogeographic domain. This riparian ecosystem is characterized by high spatial heterogeneity and uneven distribution of prosimian species, amplified by anthropogenic activity in some areas. Blumenfeld-Jones et al. (Reference BLUMENFELD-JONES, RANDRIAMBOAVONJY, WILLIAMS, MERTL-MILLHOLLEN, PINKUS, RASAMIMANANA, Jolly, Sussman, Koyama and Rasamimanana2006) identify five vegetation zones within this 97-ha tract named Malaza (Figure 1). Increased tourism in the 1980s led to the building of houses and the planting of ornamental species along the western edge of Malaza. Hunting is prohibited in the Reserve. Predation on medium-size lemur species by boa (Acrantophis sp.) and large birds of prey like the Madagascar harrier-hawk (Polyboroides radiatus Scopoli) has been reported. Carnivores like the small Indian civet (Viverricula indica É. Geoffroy Saint-Hilaire) have been observed, but the larger fossa (Cryptoprocta ferox Bennett) is absent.
Map of Malaza forest showing vegetation zones according to Blumenfeld-Jones et al. (Reference BLUMENFELD-JONES, RANDRIAMBOAVONJY, WILLIAMS, MERTL-MILLHOLLEN, PINKUS, RASAMIMANANA, Jolly, Sussman, Koyama and Rasamimanana2006). Plant transects in the rich gallery forest (closed-canopy tamarind forest and open tamarind/Neotina forest) and transects for recent sifaka censuses (2004–2005 and 2007) are indicated.

Because habitat heterogeneity affects the distribution of nutrients and toxins as well as the amount of food edible to consumers and animal densities, we aimed at providing an estimate of primate biomass and an abundance-weighted index of plant nutritional quality for the gallery forest as a whole (Malaza) and for a 34-ha microhabitat within it commonly referred to as the rich gallery forest (namely the ‘closed-canopy tamarind forest’ and adjacent part of the ‘open tamarind/Neotina forest’; Figure 1). The socio-ecology of sympatric lemurs in the rich gallery forest has been the subject of many studies since 1966, especially because it was considered to be the most favourable natural habitats for lemurs compared with more open, drier areas at the study site (Blumenfeld-Jones et al. Reference BLUMENFELD-JONES, RANDRIAMBOAVONJY, WILLIAMS, MERTL-MILLHOLLEN, PINKUS, RASAMIMANANA, Jolly, Sussman, Koyama and Rasamimanana2006, Charles-Dominique & Hladik Reference CHARLES-DOMINIQUE and HLADIK1971, Jolly et al. Reference JOLLY, DOBSON, RASAMIMANANA, WALKER, O'CONNOR, SOLBERG and PEREL2002, Reference JOLLY, RASAMIMANANA, BRAUN, DUBOVICK, MILLS, WILLIAMS, Jolly, Sussman, Koyama and Rasamimanana2006).
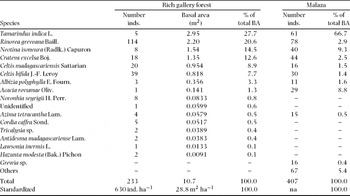
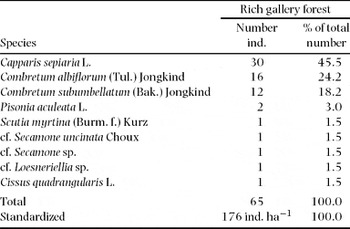
In the area of rich gallery forest, where no ornamental species occur, we enumerated and measured in 2004 the girth of trees with a diameter greater than or equal to 10 cm at breast height (dbh) in two 10-m-wide strips totalling 0.37 ha. The strips were 170 m and 200 m in length respectively (Figure 1). In each transect, we also tagged and enumerated lianas rooted within the area sampled, and we collected herbarium samples. The abundances of tree species in Malaza as a whole are known from results of 26 transect censuses made by O'Connor (Reference O'CONNOR1987, Reference O'CONNOR, Rakotovao, Barre and Sayer1988) who measured 407 trees with dbh ≥ 10 cm using the point-centred quarter sampling technique.
Population density and lemur biomass at Berenty
Two leaf-specialist primates occur in Malaza, the small white-footed sportive lemur, Lepilemur leucopus Major (Lepilemuridae), and the larger Verreaux's sifaka, Propithecus verreauxi A. Grandidier (Indriidae). Both species have an enlarged caecum and predominantly feed on leaves and/or unripe fruits (Charles-Dominique & Hladik Reference CHARLES-DOMINIQUE and HLADIK1971, Simmen et al. Reference SIMMEN, HLADIK and RAMASIARISOA2003). They co-occur with three other prosimian species, the native ring-tailed lemur (Lemur catta Linnaeus, Lemuridae), the grey mouse lemur (Microcebus murinus J.F. Miller, Cheirogaleidae), and the brown lemur introduced in 1975 (Eulemur rufifrons Bennett × E. collaris E. Geoffroy, Lemuridae; Mittermeier et al. Reference MITTERMEIER, GANZHORN, KONSTANT, GLANDER, TATTERSALL, GROVES, RYLANDS, HAPKE, RATSIMBAZAFY, MAYOR, LOUIS, RUMPLER, SCHWITZER and RASOLOARISON2008). The ring-tailed lemur and the brown lemur have mixed frugivorous/folivorous diets being mainly frugivorous when ripe fruits are available. Although the ring-tailed lemur at Berenty shifts its diet towards much lower-quality foods such as mature leaves and unripe fruits during periods of food scarcity, being able to digest fibrous foods to a greater extent than the brown lemur, this species is not categorized as a true folivore compared with the sifaka and the sportive lemur (Rasamimanana & Rafidinarivo Reference RASAMIMANANA, RAFIDINARIVO, Kappeler and Ganzhorn1993, Simmen et al. Reference SIMMEN, HLADIK and RAMASIARISOA2003). Food choices of the grey mouse lemur in Berenty gallery forest are only known from opportunistic observations but this small nocturnal species usually feeds on fruits, flowers, exudates and animal matter (Dammhahn & Kappeler Reference DAMMHAHN and KAPPELER2010, Hladik et al. Reference HLADIK, CHARLES-DOMINIQUE, PETTER, Charles-Dominique, Cooper, Hladik, Hladik, Pagès, Pariente, Petter-Rousseaux, Petter and Schilling1980).
For the purpose of our analysis, we regard lemur densities prior to 1975 without the brown lemur as an acceptable reflection of native lemur/flora interactions. Accordingly we will provide biomass estimates for the 1970–1975 period, supplemented with results for the period 2005–2011. The total number of ring-tailed lemurs and sifakas occurring in the 97-ha Malaza forest has been intermittently estimated from prior to 1975 and up until 2006 (Lemur catta: Jolly et al. Reference JOLLY, RASAMIMANANA, BRAUN, DUBOVICK, MILLS, WILLIAMS, Jolly, Sussman, Koyama and Rasamimanana2006; Propithecus verreauxi: Jolly et al. Reference JOLLY, GUSTAFSON, OLIVER and O'CONNOR1982, Norscia & Palagi Reference NORSCIA and PALAGI2008, O'Connor Reference O'CONNOR, Rakotovao, Barre and Sayer1988, Richard Reference RICHARD1978). Density estimates for Lemur catta and Propithecus verreauxi in the rich gallery forest refer to groups that include patches of ‘closed-canopy tamarind forest’ and/or the ‘open tamarind/Neotina forest’ in their home ranges, excluding forest edge (Jolly et al. Reference JOLLY, GUSTAFSON, OLIVER and O'CONNOR1982, Reference JOLLY, RASAMIMANANA, BRAUN, DUBOVICK, MILLS, WILLIAMS, Jolly, Sussman, Koyama and Rasamimanana2006). We standardized the results for the rich gallery forest by re-analysing group location according to the maps of Malaza in 1973 and 1995 provided by Blumenfeld-Jones et al. (Reference BLUMENFELD-JONES, RANDRIAMBOAVONJY, WILLIAMS, MERTL-MILLHOLLEN, PINKUS, RASAMIMANANA, Jolly, Sussman, Koyama and Rasamimanana2006). We also re-assessed the density of the sifaka from November 2004 to January 2005 in the rich gallery forest using a census line 780 m long (n = 9 repetitions: between late November 2005 and early January 2006; Figure 1). Counts and observations were made during morning and evening sessions, avoiding resting periods around midday when the probability of missing inactive groups is high. Counts were corrected taking into account the distribution of sighting distances perpendicular to the transect (Charles-Dominique & Hladik Reference CHARLES-DOMINIQUE and HLADIK1971). The cumulative sightings of sifaka (n = 30) during these transect walks yielded a density of 12.7 individuals per 10 ha in the rich gallery forest. In addition, in July 2007, we identified and exhaustively counted six neighbouring groups totalling 38 individuals distributed along the western edge of Malaza forest close to the tourist settlements and housing for resident families (Figure 1). Figures for the brown lemur are derived from an on-going census of the total number of individuals (Razafindramanana et al. unpubl. data) that started a few decades ago (Pinkus et al. Reference PINKUS, SMITH, JOLLY, Jolly, Sussman, Koyama and Rasamimanana2006).
Density estimates for Lepilemur leucopus are available from two censuses 27 y apart (1970 and 1997) that suggest a stabilized population in the wet and drier parts of the forest (Charles-Dominique & Hladik Reference CHARLES-DOMINIQUE and HLADIK1971, Hladik et al. Reference HLADIK, PINTE and SIMMEN1998). For the purpose of our study, we re-assessed their population density in the rich gallery forest in July 2011 using the same route (n = 4 repetitions) as in former censuses and correcting effective counts according to the distribution of sighting distances. Brush and scrub areas are not suitable habitats for this species and we used the figure at 270 ind. km−2 for the dry part of the forest, as previously determined (Charles-Dominique & Hladik Reference CHARLES-DOMINIQUE and HLADIK1971). No reliable data on grey mouse lemur (0.06 kg) are available but the biomass is usually low compared with that of larger sympatric lemurs (e.g. < 20 kg km−2; Ganzhorn Reference GANZHORN1992). We calculated biomass assigning an average body weight of 2.6 kg for sifaka, 0.6 kg for sportive lemur, 2.2 kg for ring-tailed lemur and 1.8 kg for brown lemur, as found in wild-caught animals (Charles-Dominique & Hladik Reference CHARLES-DOMINIQUE and HLADIK1971, Richard et al. Reference RICHARD, DEWAR, SCHWARTZ and RATSIRARSON2000, Simmen et al. Reference SIMMEN, BAYART, RASAMIMANANA, ZAHARIEV, BLANC and PASQUET2010).
Chemical analyses
Chemical analyses were performed on leaves of dominant plant species according to transect results. For each plant species, we sampled and mixed the leaves of several individuals scattered across the closed and open gallery forest prior to the analyses, mainly during the dry season. Leaves were collected from different parts of tree crowns whenever possible to account for within-plant chemical variability (Ganzhorn Reference GANZHORN1995). We dried them in an electric field oven (at a maximum of c. 50°C). Chemical variables investigated were crude protein (6.25 × N concentration; Kjeldahl method) and lignocellulose (adf or acid detergent fibre following Van Soest et al. Reference VAN SOEST, ROBERTSON and LEWIS1991).
We calculated the mean protein : adf ratio for Malaza and for the rich gallery forest. We then calculated an abundance-weighted chemical index (AWMR) for these two samples as:
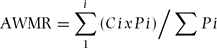
with Ci = protein : adf in tree species i and Pi = abundance of tree species i, as percentage of total basal area in the transects (Gartlan et al. Reference GARTLAN, MCKEY, WATERMAN, MBI and STRUHSAKER1980, Oates et al. Reference OATES, WHITESIDES, DAVIES, WATERMAN, GREEN, DASILVA and MOLE1990, Waterman & Kool Reference WATERMAN, KOOL, Davies and Oates1994). The AWMR reflects the chemistry of dominant tree species and is therefore a better estimate of the average nutritional quality of tree leaves available to primary consumers compared with the unweighted mean ratio. In this calculation, we chose mature leaves over young leaves to standardize comparisons with other study sites.
Leaf chemistry and the biomass of lemur communities within Madagascar compared with their anthropoid counterparts
Comparative data on leaf chemistry, biomass of primates in different communities and biomass of folivorous species within primate communities are taken from the literature (Madagascar, seven sites: Ganzhorn Reference GANZHORN1992, this study; continental Asia and Africa, five sites: Oates et al. Reference OATES, WHITESIDES, DAVIES, WATERMAN, GREEN, DASILVA and MOLE1990). Chapman et al. (Reference CHAPMAN, CHAPMAN, BJORNDAL and ONDERDONK2002, Reference CHAPMAN, CHAPMAN, NAUGHTON-TREVES, LAWES and MCDOWELL2004) investigated nine additional colobine habitats in western Africa. Forest habitats considered include evergreen rain forest, riverine forest, mid-montane forest and semi-deciduous forest. After checking for normality and variance homogeneity between samples, we log-transformed the data before running a covariance analysis. We used linear regression models to test for significance of differences in slopes and intercepts between the Madagascar database and the anthropoid database. In these comparisons, we used the mean protein-to-fibre ratio (Ganzhorn Reference GANZHORN1992, Waterman & Kool Reference WATERMAN, KOOL, Davies and Oates1994). The abundance-weighted mean ratio exists for Asian and African forests (Chapman et al. Reference CHAPMAN, CHAPMAN, NAUGHTON-TREVES, LAWES and MCDOWELL2004, Oates et al. Reference OATES, WHITESIDES, DAVIES, WATERMAN, GREEN, DASILVA and MOLE1990) but is not available for Malagasy forests except in our study. Accordingly, we used the 95% confidence interval of the prediction derived from the Colobine database (n = 14) to assess whether the biomass of folivorous lemurs at Berenty falls outside the range of predicted biomass.
RESULTS
Plant composition in the gallery forest
To date, a little more than 120 ligneous plant species have been identified throughout Malaza forest. Focusing on the abundance of these plant species in the rich gallery forest as well as in Malaza as a whole (Tables 1 and 2), three to four plant species account for more than 75% of the total basal area (trees) or, for lianas, of the total number of stems recorded in the transects. Total basal area of all plant species with dbh ≥ 10 cm is high compared with other semi-deciduous or deciduous tropical forests.
Abundance of major tree species with diameter at breast height ≥ 10 cm in the rich gallery forest (transects census) and in Malaza as a whole (point-centred quarter sampling). Data for Malaza are derived from O'Connor (Reference O'CONNOR1987, Reference O'CONNOR, Rakotovao, Barre and Sayer1988), with the category ‘Others’ referring to minor species. na: not available. BA: basal area.

Abundance of lianas in the rich gallery forest (two transects of 0.37 ha).

Lemur biomass and protein : adf ratio in leaves at Berenty
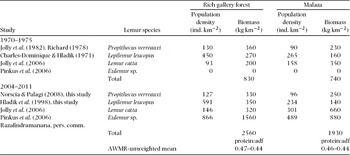
The biomasses of the different lemur species we calculated for 1970–1975 and 2004–2011, including folivorous species (Propithecus verreauxi and Lepilemur leucopus), are shown in Table 3 for Malaza and for the rich gallery forest. The biomass of folivorous species (390 kg km−2 in Malaza and 630–680 kg km−2 in the rich gallery forest) varied little during this 40-y interval compared with more frugivorous species such as Lemur catta and, especially, the introduced Eulemur rufifrons. In both Malaza and the rich gallery forest, mean protein : adf ratios for tree mature leaves weighted by species abundance (AWMR) is largely accounted for by a few non-ornamental tree species making the bulk of total basal area. We note that the unweighted mean ratios differ little from the AWMR and that the biomass of folivorous lemurs is higher in the rich gallery forest compared with Malaza although a similar AWMR is found (Table 3).
Primate densities and biomasses before/after introduction of the brown lemur, and nutritional quality of tree mature leaves in Malaza as a whole and the rich gallery forest as a micro-environment within it. The ratios of protein to acid detergent fibre (protein:adf) are expressed as abundance-weighted chemical mean (AWMR) and unweighted mean.

Among lianas occurring in the rich gallery forest, two major species reaching the canopy (accounting for 42% of the lianas censused but undoubtedly more in terms of leaf biomass) had protein : fibre ratios > 0.40 in their mature leaves. The four most frequent ornamental tree species occurring in the tourist area at the edge of the forest also have high ratios varying between 0.6 and 2.1.
Berenty lemurs and other primate communities
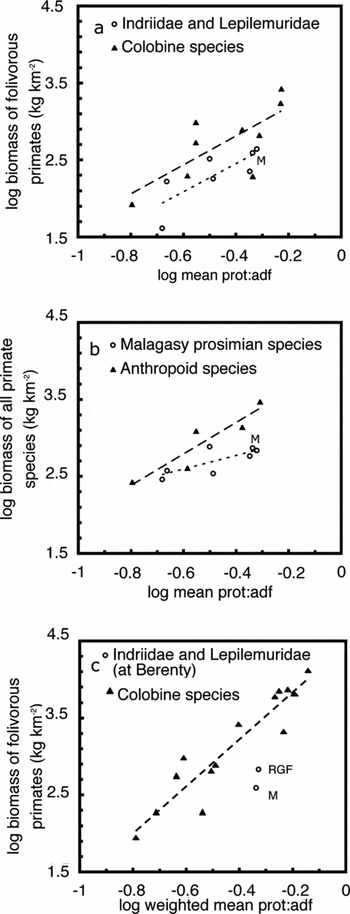
There is a significant positive correlation between primate biomass in different primate communities and the mean ratio of protein-to-fibre in leaves, as expected. The variation in the chemical index of leaf quality accounts for a large part of the variation in the biomass of folivorous species (Indriidae and Lepilemuridae from Madagascar: r2 = 0.63, P < 0.04, n = 7; Colobines from Africa and Asia: r2 = 0.55, P < 0.03, n = 9; Figure 2a) or in the biomass of whole primate communities (Madagascar: r2 = 0.59, P < 0.05, n = 7; Africa and Asia combined: r2 = 0.85, P < 0.03, n = 5; Figure 2b). Current total biomass of lemurs at Berenty is inflated by the invasive introduced brown lemur and use of introduced plant resources by all lemurs foraging at the forest edge. Still, prior to brown lemur introduction in 1975, a period when introduced plants had reduced effects on primate populations, total biomass in the gallery forest was high compared with other prosimian communities from seasonal and evergreen wet forests of Madagascar in which leaf chemistry is compared: the total biomass of lemurs we calculated for 1970–1975 at Berenty (740 kg km−2) lies at the top of the range of biomasses of primate communities found over the island (Madagascar: below 800 kg km−2 for communities in which the chemical index of leaf quality is known). The results show that the combined biomass of leaf-specialist prosimian species at Malaza, as well as the total biomass of the primate community, reflect the ratio of protein to fibre in leaves as predicted from correlations drawn for other forest prosimian communities in Madagascar (Figure 2b).
Plot of the average protein : acid detergent fibre (prot:adf) ratio in mature leaves and primate biomass within primate communities of Madagascar compared with Asian and African anthropoids. Comparisons focus on folivorous lemurs and colobines (a), whole communities of lemurs and anthropoids (b), and folivorous lemur species at Berenty versus colobine monkeys (c). In the latter figure, the protein-to-fibre ratio is expressed as the abundance-weighted mean, i.e. mean weighted by the basal area of tree species. In this case, the variation in the chemical ratio explains 90% of the variation in colobine biomass (Chapman et al. Reference CHAPMAN, CHAPMAN, NAUGHTON-TREVES, LAWES and MCDOWELL2004). M and RGF refer to 1970–1975 lemur biomass in Malaza and in the rich gallery forest as a microhabitat within Malaza, respectively. The dashed lines result from the regression analysis. (Source: Chapman et al. Reference CHAPMAN, CHAPMAN, BJORNDAL and ONDERDONK2002, Reference CHAPMAN, CHAPMAN, NAUGHTON-TREVES, LAWES and MCDOWELL2004; Ganzhorn Reference GANZHORN1992, Oates et al. Reference OATES, WHITESIDES, DAVIES, WATERMAN, GREEN, DASILVA and MOLE1990, this study, Waterman & Kool Reference WATERMAN, KOOL, Davies and Oates1994.)

However, as expected from previous comparisons made between Malagasy lemurs and their anthropoid counterparts, the difference in total biomass between folivorous prosimians and colobines is consistent within the range of protein : fibre ratios measured (Figure 2a). The slopes of the lines are not significantly different between the two databases (F 1,13 = 0.008, ns), but the biomass is significantly higher in colobines at a given protein : adf ratio (intercepts: F 1,13 = 14.3, P < 0.01). The difference in total biomass between lemurs and anthropoids is also consistent across the range of protein : adf ratios measured (Figure 2b): biomasses are significantly higher in anthropoids (intercepts: F 1,7 = 17.5, P < 0.01) although no significant difference is found between slopes (F 1,7 = 1.02, ns).
These results are based on the average protein-to-fibre ratio but the AWMR better reflects the average leaf quality of plant species available to consumers. The AWMR is available only from our study in the Madagascar sample. As shown in Figure 2c, the weighted ratios for Malaza forest (0.46) and for the rich gallery forest (0.47) at Berenty are associated with low biomass of folivorous lemurs when compared with those found in 14 colobine habitats (Malaza: observed biomass = 390 kg km−2 < (601–11 200 kg km−2) as the range predicted from the 95% confidence interval of the prediction; rich gallery forest: 630 kg km−2 < (641–12 000 kg km−2)). This difference is found using densities of Propithecus verreauxi and Lepilemur leucopus recorded in the 1970s but is also observed using recent population estimates for Malaza because there were no major changes in the densities of these two folivorous species during the last 40 y (Table 3).
DISCUSSION
Biomass of lemurs and leaf chemistry
A series of studies on primates shows that the total biomass of primate communities as well as the biomass of folivorous species is correlated with the average ratio of protein : fibre in mature leaves across different forest areas (Chapman & Chapman Reference CHAPMAN and CHAPMAN2002, Chapman et al. Reference CHAPMAN, CHAPMAN, NAUGHTON-TREVES, LAWES and MCDOWELL2004, Ganzhorn Reference GANZHORN1992, Oates et al. Reference OATES, WHITESIDES, DAVIES, WATERMAN, GREEN, DASILVA and MOLE1990). We found that the biomass of lemurs and the index of plant nutritional quality in both Malaza and the rich gallery forest were consistent with the expectation when compared with other Malagasy primate communities. The ecological mechanisms explaining the relationships between leaf quality and primate biomass remain poorly understood, in particular because the positive correlation seems to occur irrespective of the widely recognized effects of primary production within the consumer guilds (Odum Reference ODUM1959). Seasonal (e.g. deciduous) forests in Madagascar, for instance, have lower primary production over a yearly cycle than evergreen rain forests, but they nevertheless harbour higher primate biomasses (Abraham et al. Reference ABRAHAM, BENJA, RANDRIANASOLO, GANZHORN, JEANNODA and LEIGH1996, Ganzhorn Reference GANZHORN1992, Reference GANZHORN1995; Hladik Reference HLADIK, Charles-Dominique, Cooper, Hladik, Hladik, Pagès, Pariente, Petter-Rousseaux, Petter and Schilling1980, this study). Additional factors most likely interact with nutritional aspects to determine primate abundance so that the predictive power of the protein : fibre ratio has some limitations in its use. For instance, species susceptibility to logging and parasite load may explain differential densities of sympatric colobines in forest fragments at a given protein : adf ratio (Chapman et al. Reference CHAPMAN, STRUHSAKER and LAMBERT2005). In our study, the biomass of folivorous lemurs is higher in the rich gallery forest than in the more open habitats in Malaza although a similar protein : adf ratio is found in these two samples. In addition, total basal area found in the rich gallery forest is high compared with that of lemur forest habitats investigated so far – which is perhaps due to the proximity of the Mandrare river and nutrient enrichment of the soil during flooding episodes (Hladik Reference HLADIK, Charles-Dominique, Cooper, Hladik, Hladik, Pagès, Pariente, Petter-Rousseaux, Petter and Schilling1980, Pichon et al. Reference PICHON, RAMANAMISATA, TARNAUD, BAYART, HLADIK, HLADIK and SIMMEN2010). Accordingly, the chemical index of the nutritional quality of leaves does not explain all the variation in the abundance of folivores and other sympatric species. Considering total basal area as a proxy for primary production (Ganzhorn Reference GANZHORN1992), the combination of qualitative and quantitative aspects of foods available to lemurs probably accounts for high total biomass of lemurs in the rich gallery forest.
Differences in the biomass of Malagasy prosimians and Old World primates
The most striking results to emerge from the comparison between Malagasy prosimians and their anthropoid counterpart is that the total biomass of folivorous lemurs is consistently lower than that of Asian and African colobines for a given protein : fibre ratio. A comparison of results based on whole primate communities also reveals a comparatively low total biomass of lemurs at a given protein : adf ratio (Ganzhorn Reference GANZHORN1992, Oates et al. Reference OATES, WHITESIDES, DAVIES, WATERMAN, GREEN, DASILVA and MOLE1990, this study). Our results for Berenty lemurs are in agreement with the ‘Madagascar effect’. In the comparative analyses focused on whole primate communities, we used lemur densities recorded in the 1970s at Berenty to avoid biases due to brown lemur introduction. Therefore, we cannot rule out the possibility that the protein-to-fibre ratio has been varying since that time. If so, the direction of change is likely a decrease of leaf quality over time in line with herbivore pressure and elevated carbon dioxide accompanying climate change (Kamata et al. Reference KAMATA, IGARASHI and OHARA1996, Wang et al. Reference WANG, HECKATHORN, WANG and PHILPOTT2011). Hence, the relationship between primate biomass and the chemical index of leaf quality would differ to a greater extent than reported here between the lemur database and the anthropoid database. The difference is counterintuitive because energy strategies of lemurs rest on low daily energy expenditure for their body mass, low energy input and hypometabolism (Charles-Dominique & Hladik Reference CHARLES-DOMINIQUE and HLADIK1971, Perret et al. Reference PERRET, AUJARD and VANNIER1998, Richard & Nicoll Reference RICHARD and NICOLL1987, Simmen et al. Reference SIMMEN, HLADIK and RAMASIARISOA2003, Reference SIMMEN, BAYART, RASAMIMANANA, ZAHARIEV, BLANC and PASQUET2010). These traits should allow for higher population densities and biomasses compared with anthropoid species most of which have more ‘standard’ basal or field metabolic rates and normothermic physiology (among colobines, cercopithecines and apes; Raichlen et al. Reference RAICHLEN, GORDON and SECHREST2011, Ross Reference ROSS1992). Considering the paucity of lemur species with highly frugivorous diets in Madagascar and, in contrast, the high frequency of lemur species with leaf-rich diets (thus using ubiquitous resources) compared with other primate communities (Fleagle & Reed Reference FLEAGLE and REED1996, Ganzhorn et al. Reference GANZHORN, ARRIGO-NELSON, BOINSKI, BOLLEN, CARRAI, DERBY, DONATI, KOENIG, KOWALEWSKI, LAHANN, NORSCIA, POLOWINSKY, SCHWITZER, STEVENSON, TALEBI, TAN, VOGEL and WRIGHT2009, Hladik Reference HLADIK, Harding and Teleki1981, Wright Reference WRIGHT1999), it is puzzling why the total biomass of lemur communities is low.
Lemur abundance, forest resources and species loss in Madagascar
What may account for the relatively low biomass of lemur communities? Current knowledge of lemur digestive physiology, primary production and leaf chemistry as well as of patterns of species loss in Madagascar lends support to the earlier hypothesis that low lemur biomass is likely related to the rapid loss of primate diversity that occurred during the past two millennia (Ganzhorn Reference GANZHORN1992). Palaeontological data focus on the late Pleistocene and Holocene extinctions of ≥ 17 lemuriform species, most of which were probably driven by anthropogenic activity (Godfrey & Irwin Reference GODFREY and IRWIN2007). A number of these primates were adapted to feed on low-quality foods and foods difficult to process, and were much larger than living ones (> 30 kg in most cases and up to the size of male gorillas; Crowley et al. Reference CROWLEY, GODFREY and IRWIN2011, Mulchinski et al. Reference MULCHINSKI, GODFREY, MULDOON and TONGASOA2010). Some of these extinct primates were still present during the second half of the second millennium AD (Burney et al. Reference BURNEY, BURNEY, GODFREY, JUNGERS, GOODMAN, WRIGHT and JULL2004, Godfrey & Irwin Reference GODFREY and IRWIN2007). Presumably, the very recent extinction of large and giant folivorous species allowed too little time for contemporaneous smaller-sized species – which all weigh less than 15 kg – to evolve equally effective specializations for processing a large range of fibrous foods. There is experimental evidence indeed indicating that caeco-colic fermenters including Verreaux's sifaka derive less energy from leaf fermentation when fed high-fibre diets (i.e. comparable to natural diets in terms of NDF proportions) than African and Asian colobine species and other foregut fermenters (Campbell et al. Reference CAMPBELL, EISEMANN, GLANDER and CRISSEY1999, Edwards & Ullrey Reference EDWARDS and ULLREY1999, Nijboer Reference NIJBOER2006). In some small-sized folivorous prosimians like the sportive lemur, meeting the nutritional requirements requires caecotrophy (Charles-Dominique & Hladik Reference CHARLES-DOMINIQUE and HLADIK1971). Accordingly, without the possibility to increase the range of edible foods, population densities of lemur species remain tied to strict breeding seasonality and high rate of infant mortality (with species differences) among other demographic aspects that characterize Malagasy prosimians (Wright Reference WRIGHT1999).
The hypothesis of rapid impoverishment of primate communities and lack of comparable efficiency to digest leaves in contemporaneous lemurs, is challenged by the alternative or additional view that Malagasy forests cannot sustain populations of primate consumers as large as those in mainland counterparts. Forest ecosystems in Madagascar have been assumed to face relative soil infertility or unstable climatic conditions, and to be less productive than other tropical forests (Wright Reference WRIGHT1999). Low primary production would be reflected in the slow growth rate of trees, low fruit production, and lack of efficient secondary vegetation (Ganzhorn Reference GANZHORN1988, Koechlin et al. Reference KOECHLIN, GUILLAUMET and MORAT1974, Leigh et al. Reference LEIGH, HLADIK, HLADIK and JOLLY2007, Wright Reference WRIGHT1999). However, measures of leaf production over almost a yearly cycle in two different dry forests (Marosalaza: Hladik Reference HLADIK, Charles-Dominique, Cooper, Hladik, Hladik, Pagès, Pariente, Petter-Rousseaux, Petter and Schilling1980; Antrema: Ranaivoson et al. in press) reveal that the order of magnitude of leaf litterfall is similar to that reported in other seasonal forests, especially in Sri Lanka where a much higher biomass of folivorous primates is found (Polonnaruwa: Hladik Reference HLADIK, Charles-Dominique, Cooper, Hladik, Hladik, Pagès, Pariente, Petter-Rousseaux, Petter and Schilling1980, Oates et al. Reference OATES, WHITESIDES, DAVIES, WATERMAN, GREEN, DASILVA and MOLE1990). Moreover, quantitative data on phenological patterns of dry forests show that leaves are available to prosimian herbivores year-round – though as a seasonally variable assemblage of food trees and lianas – because evergreen plant species and late deciduous species co-occur with early deciduous plants in these ecosystems (Hladik Reference HLADIK, Charles-Dominique, Cooper, Hladik, Hladik, Pagès, Pariente, Petter-Rousseaux, Petter and Schilling1980, Ranaivoson et al. in press).
Do plant chemical defences or low nutrient concentrations in leaves decrease, in an excessive manner, the range of foods edible or acceptable to consumers in Madagascar? There is no indication that mean protein and adf in the diet differ markedly between folivorous prosimians and colobines in similar habitats (Powzyk & Mowry Reference POWZYK and MOWRY2003, Waterman & Kool Reference WATERMAN, KOOL, Davies and Oates1994, this study). In addition, secondary metabolites generally have no statistical deterrent effects on Propithecus species either in evergreen wet forests or in dry deciduous forests (e.g. polyphenols and alkaloids; Powzyk & Mowry Reference POWZYK and MOWRY2003, Simmen et al. Reference SIMMEN, HLADIK, RAMASIARISOA, IACONELLI, HLADIK, Rakotosamimanana, Rasamimanana, Ganzhorn and Goodman1999, unpubl. data, Yamashita Reference YAMASHITA2008). The largest living Malagasy folivore (Indri indri), which contributes greatly to prosimian biomass in some areas together with Propithecus diadema, is tolerant of phenolics, the most ubiquitous category of secondary metabolite in the evergreen rain forest of Madagascar (Ganzhorn Reference GANZHORN1988, Powzyk & Mowry Reference POWZYK and MOWRY2003, Simmen et al. Reference SIMMEN, HLADIK, RAMASIARISOA, IACONELLI, HLADIK, Rakotosamimanana, Rasamimanana, Ganzhorn and Goodman1999). Finally, there is no consistent evidence that plant diversity, which affects lemur species richness (Ganzhorn et al. Reference GANZHORN, MALCOMBER, ANDRIANANTOANINA and GOODMAN1997), is reduced relative to mainland forests that harbour leaf-eating primates: tree diversity is high in forests of Madagascar compared with similar forests of Africa and India and low relative to that found in South-East Asia (Abraham et al. Reference ABRAHAM, BENJA, RANDRIANASOLO, GANZHORN, JEANNODA and LEIGH1996, Leigh et al. Reference LEIGH, HLADIK, HLADIK and JOLLY2007).
An issue that was not addressed in this study was whether lemurs undergo unusually high competition pressure with other arboreal phytophagous animals, especially insects. There are still insufficient data on this topic but leaf-eating invertebrates (e.g. caterpillars) may account for a high biomass within the guild of folivores (e.g. roughly 50–100 kg km−2 in Marosalaza dry forest; Hladik et al. Reference HLADIK, CHARLES-DOMINIQUE, PETTER, Charles-Dominique, Cooper, Hladik, Hladik, Pagès, Pariente, Petter-Rousseaux, Petter and Schilling1980). Considerably more work will need to be done to explore the hypothesis that arboreal lemur communities might be subject to severe feeding competition with plant-eating arthropods. In conclusion, we do not expect primary production, plant diversity and plant secondary metabolites to impose unusual limitations to the biomass of folivorous prosimian communities whether they live in rain forests or in more seasonal forests. We favour the hypothesis that low biomass of present lemur communities is an ecological anomaly that primarily reflects the recent loss of primate species.
ACKNOWLEDGEMENTS
The study was funded by the CNRS, the MNHN and Fyssen Foundation. We are indebted to Jean DeHeaulme and the DGDRF/MEF Madagascar for providing permissions and authorizations to study lemurs. We thank Zoly and Takayo Soma for help in plant sampling and animal censusing. We are grateful to C. M. Hladik who helped us organizing the draft of this paper, and to E. G. Leigh, A. Mertl-Millhollen, I. Turner and an anonymous reviewer who improved the text and promoted discussion on Madagascar's particularities.