Introduction
Bilingualism is a dynamic operation of language processing influenced by various factors (e.g., language proficiency, exposure to each language over the lifetime, and environmental contexts). Recently, a burgeoning body of research that investigates how one mind processes two or more languages has emerged. Experimental paradigms range from behavioral designs (Costa & Santesteban, Reference Costa and Santesteban2004; Hermans, Bongaerts, De Bot & Schreuder, Reference Hermans, Bongaerts, De Bot and Schreuder1998; Zied, Phillipe, Pinon, Havet-Thomassin, Aubin & Roy, Reference Zied, Phillipe, Pinon, Havet-Thomassin, Aubin, Roy and Le Gall2004) to studies that use imaging techniques (Chee, Hon, Lee, & Soon, Reference Chee, Hon, Lee and Soon2001; Hernandez, Dapretto, Mazziotta & Bookheimer, Reference Hernandez, Dapretto, Mazziotta and Bookheimer2001; for a review, see Abutalebi & Green, Reference Abutalebi and Green2008). Current work in bilingualism research is slowly expanding to include individuals with aphasia (Abutalebi, Miozzo & Cappa, Reference Abutalebi, Miozzo and Cappa2000; Gray & Kiran, Reference Gray and Kiran2013; Green, Grogan, Crinion, Ali, Sutton & Price, Reference Green, Grogan, Crinion, Ali, Sutton and Price2010; Kiran, Sandberg, Gray, Ascenso & Kester, Reference Kiran, Sandberg, Gray, Ascenso and Kester2013).
It is well documented that in the bilingual brain both languages are active when processing a task that requires one language (Colomé, Reference Colomé2001; Costa & Caramazza, Reference Costa and Caramazza1999; Costa & Santesteban Reference Costa and Santesteban2004; Hermans et al., Reference Hermans, Bongaerts, De Bot and Schreuder1998; Kaushanskaya & Marian, Reference Kaushanskaya and Marian2007; Kroll & Stewart, Reference Kroll and Stewart1994; Meuter & Allport, Reference Meuter and Allport1999; Tzelgov, Henik & Leiser, Reference Tzelgov, Henik and Leiser1990; Zied et al., Reference Zied, Phillipe, Pinon, Havet-Thomassin, Aubin, Roy and Le Gall2004). In order to successfully manage their languages, bilingual individuals must exert some control over the non-target language, but how this is accomplished is still under debate (Costa & Santesteban, Reference Costa and Santesteban2004; Costa, Santesteban & Ivanova, Reference Costa, Santesteban and Ivanova2006; Dijkstra & Van Heuven, Reference Dijkstra and Heuven2002; Green, Reference Green1998; Hermans et al., Reference Hermans, Bongaerts, De Bot and Schreuder1998). For a review of this topic, see Costa (Reference Costa, Kroll and De Groot2005), Kroll, Bobb, Misra and Guo (Reference Kroll, Bobb, Misra and Guo2008) and Kroll, Bobb and Wodniecka (Reference Kroll, Bobb and Wodniecka2006). Relevant to this study is that bilingualism imposes a demand to switch between languages; however, it still must be determined if this mechanism to switch languages is specific to the language domain or cognitive domain.
Various researchers claim that because bilinguals are constantly monitoring two languages, there is a benefit that transfers to executive functioning skills. Extensive work by Bialystok and colleagues (Bialystok, Reference Bialystok2010; Bialystok, Reference Bialystok2011; Bialystok, Craik, Klein & Viswanathan, Reference Bialystok, Craik, Klein and Viswanathan2004; Bialystok, Craik & Luk, Reference Bialystok, Craik and Luk2008; for review see Bialystok, Craik, Green & Gollan, Reference Bialystok, Craik, Green and Gollan2009) suggests that being bilingual offers cognitive advantages such as better performance on the Stroop task, Simon task, and global local tasks (a paradigm that measures the inhibition of visual attention to the overall composition of a stimulus versus the specific details). In addition to having this ability to manage two or more active languages, there are other non-linguistic cognitive advantages. Studies that examine attentional networks and conflict monitoring skills tasks also suggest that bilinguals enjoy an added benefit to cognitive control processing that offers higher, more efficient performance on nonverbal tasks compared to monolinguals (Costa, Hernández & Sebastián-Gallés, Reference Costa, Hernández and Sebastián-Gallés2008; Costa, Hernández, Costa-Faidella & Sebastián-Gallés, Reference Costa, Hernández, Costa-Faidella and Sebastián-Gallés2009). For instance, Costa et al. (Reference Costa, Hernández and Sebastián-Gallés2008) and Costa et al. (Reference Costa, Hernández, Costa-Faidella and Sebastián-Gallés2009) asked bilingual and monolingual individuals to perform tasks that required non-linguistic conflict and attention monitoring tasks. Results revealed that people who were bilingual (i.e., those who constantly monitor two languages) were more efficient on non-linguistic tasks compared to their monolingual counterparts. These studies show that by constantly managing multiple languages, this skill of control carries over to non-linguistic cognitive processing.
This association between the two types of control is indicative of domain general cognitive control. This type of processing suggests that mechanisms of language control and mechanisms of cognitive control are not completely independent. It should be noted that this body of literature is based on the evidence that bilinguals have better cognitive control relative to their monolingual counterparts, but how this affects the degree of domain general versus domain specific mechanisms is not clear.
An opposing view is that language control may function independently of cognitive control and this view is termed domain specific control (Calabria, Branzi, Marne, Hernández & Costa, Reference Calabria, Branzi, Marne, Hernández and Costa2013; Calabria, Hernández, Branzi & Costa, Reference Calabria, Hernández, Branzi and Costa2011; Magezi, Khateb, Mouthon, Spierer & Annoni, Reference Magezi, Khateb, Mouthon, Spierer and Annoni2012; Weissberger, Wierenga, Bondi & Gollan, Reference Weissberger, Wierenga, Bondi and Gollan2012). Calabria et al. (Reference Calabria, Hernández, Branzi and Costa2011) asked highly proficient bilingual participants to perform a non-linguistic card sorting (color/shape) task and a cued naming task using their first language (L1) (Catalan) and second language (L2) (Spanish) and then using their L1 and third language (L3) (low proficient English). Response times from switch and non-switch trials on the non-linguistic and linguistic experiments were analyzed and compared. Results showed symmetrical switch costs for the language task but asymmetrical switch costs for the non-linguistic task, revealing a dissociation between the bilingual language control network and general cognitive control system. More recently, Calabria et al. (Reference Calabria, Branzi, Marne, Hernández and Costa2013) evaluated the mechanisms of bilingual language control and non-linguistic control by comparing three age groups of bilinguals on a language switching task and a non-linguistic switching task. Findings revealed age related change only on the non-linguistic task, indicating a dissociation between the two control systems. In another study, Magezi et al. (Reference Magezi, Khateb, Mouthon, Spierer and Annoni2012) investigated a group of heterogeneous bilinguals’ performance on a picture naming task and an alphanumeric categorization task in single and mixed contexts. Behavioral data analysis revealed a greater mixing cost in the alphanumeric task compared to the linguistic task, suggesting that language control is partly independent from general cognitive control. Weissberger et al. (Reference Weissberger, Wierenga, Bondi and Gollan2012) compared older bilinguals to their younger counterparts while completing a color-shape identification switching task and cued language switching task (number naming). Results of both tasks revealed effects of aging, but specific effects differed across tasks. The color-shape task revealed more age related costs (e.g., more errors and longer response times), compared to the language task. Notably, all participants were able to complete the linguistic task yet a handful of the older participants were not able to perform the non-linguistic task. These results also suggest a dissociation between mechanisms of language control and general cognitive control, indicative of domain specific control mechanisms.
As discussed, empirical data provides conflicting evidence where some studies reveal a dissociation between mechanisms of language control and cognitive control indicative of domain specific cognitive control, whereas other studies show an association between these control mechanisms, indicative of domain general cognitive control. In contrast to healthy bilinguals, bilingual adults with aphasia are vulnerable to language control deficits (e.g., the inability to suppress the non-target language) because (a) bilingual individuals must manage (i.e., control) two languages and (b) the nature of aphasia is that it concerns language impairment. It is not known whether aphasia overrides control mechanisms in a specific (i.e., dissociated) way, or in a domain-general manner, but this knowledge is critical to effectively diagnosing and treating this population. For example, if the overlap is extensive and a patient presents with pathological language switching, theoretically, treatment could be targeted at training cognitive control rather than language control.
Case studies investigating language control impairment in bilingual adults with aphasia have explored asymmetric translation deficits and pathological language switching/mixing qualitatively and associate these types of deficits with subcortical damage (Abutalebi et al., Reference Abutalebi, Miozzo and Cappa2000; Ansaldo & Marcotte, Reference Ansaldo, Marcotte, Centeno, Obler and Anderson2007; Ansaldo, Saidi & Ruiz, Reference Ansaldo, Saidi and Ruiz2010; Adrover-Roig, Galparsoro-Izagirre, Marcotte, Ferré, Wilson & Ansaldo, Reference Adrover-Roig, Galparsoro-Izagirre, Marcotte, Ferré, Wilson and Ansaldo2011; García-Caballero, García-Lado, González-Hermida, Area, Recimil, Rabadán, Lamas, Ozaita & Jorge, Reference García-Caballero, García-Lado, González-Hermida, Area, Recimil, Rabadán, Lamas, Ozaita and Jorge2007; Keane & Kiran, under revision). For instance, Ansaldo and Marcotte (Reference Ansaldo, Marcotte, Centeno, Obler and Anderson2007) and Ansaldo et al. (Reference Ansaldo, Saidi and Ruiz2010) reported the case of a Spanish–English bilingual patient who suffered a left subcortical lesion and presented with pathological language mixing and switching. In another example, Abutalebi et al. (Reference Abutalebi, Miozzo and Cappa2000) reported the case of a balanced pre-stroke polyglot who presented with language mixing resulting from a subcortical infarct. Rather extensively, these studies highlight the influence that subcortical lesions may have on language control deficits. Furthermore, they suggest a link between language control deficits and cognitive control deficits which needs to be explored and defined.
The abovementioned case studies that examine language control in bilingual aphasia are somewhat limiting because they are case studies that omit investigations of control within non-linguistic contexts. However, a few studies do include experimental paradigms that evaluate control in the linguistic and non-linguistic domains. For instance, Green et al. (Reference Green, Grogan, Crinion, Ali, Sutton and Price2010) used three conflict tasks (lexical decision, the Stroop task in L1 and English, and the flanker task) to investigate interference effects (i.e., the effect of non-target stimuli on target stimuli which can result in slow response times) in healthy bilingual and monolingual adults and two bilingual adults with aphasia. One aim of the study was to explore the hypothesis that bilingual patients who are equally impaired in both languages (i.e., parallel impairment) can exhibit breakdowns in control within non-linguistic contexts. Imaging data revealed that Patient 1 presented with a subcortical lesion that included the left lentiform nucleus, and Patient 2's lesion encompassed the left middle cerebral artery and affected the left frontal and temporal areas, as well as the bilateral occipital region. Bilingual patient performance on the linguistic and non-linguistic tasks revealed a double dissociation of impairment on control processing. Specifically, Patient 1's results revealed abnormal Stroop performance paired with less abnormal flanker performance, whereas Patient 2 demonstrated the opposite pattern where results revealed abnormal flanker performance paired with less abnormal Stroop performance. These findings provoke interesting implications for the hypothesis of domain specific versus domain general cognitive processing because the patients presented with opposing impairment trends on the linguistic and non-linguistic tasks. Another interesting observation is that these two patients were both diagnosed with parallel language impairment which does not generally point to language control impairment but rather language loss; however, these data suggest that parallel language impairment may be indicative of language control deficits.
In another study, Verreyt, De Letter, Hemelsoet, Santens and Duyck (Reference Verreyt, De Letter, Hemelsoet, Santens and Duyck2013) explored the possible effects of language control on differential language impairment in one bilingual adult with aphasia whose French (L1) was less impaired than Dutch (L2). Testing consisted of the flanker task and a lexical decision task that included three versions, all containing cognate and non-cognate word types: a generalized version (stimuli and targets in French and Dutch) and two selective versions (stimuli in French and Dutch but targets in either French or Dutch). Participants were instructed to identify stimuli as a word or a non-word. In theory, the generalized version requires less language control relative to the selective version. Results revealed that on the generalized version, cognate facilitation was observed, suggesting that cognates were receiving activation from both languages. On the French selective version, no effect of cognate facilitation was observed, suggesting no interference from Dutch. In contrast, on the Dutch version, cognates were identified with less accuracy relative to their non-cognate Dutch counterparts, suggesting that the less impaired French was exerting some degree of interference that could not be suppressed. In sum, the linguistic results are indicative of language control impairment where the stronger language (French) could not be inhibited. Combined with the results on the flanker task (that were indicative of impaired non-linguistic control), the outcome points to an overlap between language control and cognitive control processing.
More recently, Dash and Kar (Reference Dash and Kar2014) investigated the relationship between language control and cognitive control in four bilingual patients with aphasia. Experimental tasks included a linguistic and non-linguistic flanker task and a non-linguistic negative priming task. The variation in performance across tasks was identified by examining two modes of control: 1) proactive control which is anticipatory towards upcoming, future events, and 2) reactive control which is concerned with transient information and requires the ability to resolve interference after it occurs. Results across tasks revealed that some patients relied more on proactive control to complete the linguistic task while relying more on reactive control to complete the non-linguistic task, whereas other patients showed the opposite pattern. These results are compelling because they are at odds with previous studies (e.g., Green et al., Reference Green, Grogan, Crinion, Ali, Sutton and Price2010; Verreyt et al., Reference Verreyt, De Letter, Hemelsoet, Santens and Duyck2013) and suggest that at some level of processing, language control mechanisms are independent from cognitive control mechanisms.
The Green et al. (Reference Green, Grogan, Crinion, Ali, Sutton and Price2010), Verreyt et al. (Reference Verreyt, De Letter, Hemelsoet, Santens and Duyck2013) and Dash and Kar (Reference Dash and Kar2014) studies are all case studies that employ the flanker task for a measure of non-linguistic control. However, the linguistic control tasks differ: where Green et al. (Reference Green, Grogan, Crinion, Ali, Sutton and Price2010) employed the Stroop task, Verreyt et al. (Reference Verreyt, De Letter, Hemelsoet, Santens and Duyck2013) designed a lexical decision task that was strategically designed to tap language control, and Dash and Kar (Reference Dash and Kar2014) used a linguistic flanker task. Although the present study uses the flanker to tap non-linguistic control, consistent with other studies that measure non-linguistic inhibitory control in patient and non-patient populations (e.g., Costa et al., Reference Costa, Hernández, Costa-Faidella and Sebastián-Gallés2009; Green et al., Reference Green, Grogan, Crinion, Ali, Sutton and Price2010; Green, Ruffle, Grogan, Ali, Ramsden, Schofield, Leff, Crinon & Price, Reference Green, Ruffle, Grogan, Ali, Ramsden, Schofield, Crinon and Price2011; Luk, Anderson, Craik, Bialystok & Grady, Reference Luk, Anderson, Craik, Bialystok and Grady2010), our study is different from the three aforementioned studies because 1) it is a multi-case study which allows us to perform group analyses, and 2) it includes a unique linguistic task specifically designed to tap effects of language control. An important similarity between Dash and Kar (Reference Dash and Kar2014) and the present study is that both studies explore the effects of language proficiency on performance. Although very little is understood about bilingual aphasia and language control processing, we do know that proficiency does influence post-stroke language skill in bilingual adults with aphasia. In 2013, Gray and Kiran investigated the effect of pre-morbid language-use related factors (i.e., confidence to speak L1 and L2, self-rating report for L1 and L2, and post-stroke current exposure for L1 and L2), on post-stroke language performance. Results revealed that pre-stroke language proficiency in L1 and L2 can determine the presentation of post-stroke language performance. These results indicate the importance of accounting for language proficiency when examining language processing or control deficits in bilingual aphasia; therefore, we examine it in the present study.
The preliminary evidence thus far suggests that individuals with bilingual aphasia may have language control deficits and some of these individuals exhibit an extension to deficits in non-linguistic cognitive control. However, the mechanisms of language control impairment and cognitive control impairment in bilingual aphasia are not clearly understood. Therefore, we systematically investigate whether differences arise between a linguistic task and non-linguistic task (as measured by congruency effects) when neurologically healthy bilingual adults (hereafter NHBA) and bilingual adults with aphasia (hereafter BAA) complete the flanker task (Eriksen & Eriksen, Reference Eriksen and Eriksen1974) that examines non-linguistic inhibitory control and a word-pair relatedness judgment task that examines linguistic inhibitory control. As mentioned before, our choice of the flanker task is consistent with other recent studies. For the linguistic task geared to tap language control, it was imperative that we employ a receptive language task, consistent with previous studies that have also examined language control in this population (Dash & Kar, Reference Dash and Kar2014; Verreyt et al., Reference Verreyt, De Letter, Hemelsoet, Santens and Duyck2013). Because BAA may experience a range of lexical access deficits on top of language control deficits, the use of a receptive language task eliminates the confounding variable of lexical access impairment which can arise during an expressive language task.
Another aim of the present study is to evaluate the effect of language dominance on direction of translation. The Revised Hierarchical model (RHM; Kroll & Stewart, Reference Kroll and Stewart1994) accounts for translation asymmetries. In this model, the dominant language has a direct link between a word and its meaning (i.e., the concept of a word), and the less dominant language accesses the meaning via the word in the stronger language. Thus, unbalanced bilinguals will exhibit longer response time latencies when translating from the weaker language into the stronger language compared to the translating from the stronger language into the weaker language. However, as proficiency in the weaker language improves, both languages access word meanings via direct links which can theoretically affect response time latencies. Thus, balanced bilinguals will exhibit same response time latencies when translating into either language. Therefore, because the linguistic task in the present study consists of within- and between-language word-pairs (that translate into Spanish and into English), we aim to systematically investigate speed of processing as a function of language proficiency on these two conditions.
Research questions
Research question 1
Examine the nature of cognitive control in a non-linguistic task requiring the inhibition of irrelevant information in a group of Spanish–English NHBA and Spanish–English BAA. Based on previous research (Prior & Gollan, Reference Prior and Gollan2011), we hypothesize that NHBA will exhibit the congruency effect (i.e., exhibit faster response times [RTs] when irrelevant information to be inhibited is congruent relative to incongruent). However, for BAA, because we know so little about how this population performs on non-linguistic control tasks, one hypothesis is that they will exhibit the congruency effect but an alternative hypothesis is that they will not exhibit the congruency effect.
Research question 2
Examine the nature of language control and language processing on a word-pair relatedness judgment task. Specifically, we asked if NHBA and BAA will exhibit effects of congruency on a linguistic task that requires translating between semantically related and semantically unrelated word-pairs. As previous research indicates, both languages are simultaneously active in the bilingual lexicon but the non-target language must be inhibited in order for the target language to be accessed. Then to switch languages, the inhibition must be overcome (Green, Reference Green1998). To examine language control and language processing, we developed a receptive word-pair relatedness judgment task that includes a prime and a target that vary by two factors: 1) language type (i.e., within-language [Spanish or English word-pairs] or between-language [English–Spanish or Spanish–English word-pairs]), and 2) semantic relationship (i.e., direct translation [Tr], semantic non-translation [S], unrelated non-translation [Un], semantic translation [STr] and unrelated translation [UnTr]). In our task, trials consisting of within-language word-pairs (S and Un conditions) are considered ‘congruent’ because although they still require language control (i.e., inhibition of the non-target language), they require less language control effort compared to their between-language word-pair counterparts (STr and UnTr conditions) which are considered ‘incongruent’. In order to evaluate language control, we will compare the S versus STr condition and Un versus UnTr. We hypothesize that because of the increased demand of control and because of semantic relationships that remain constant across contrasts, NHBA and BAA will exhibit faster RTs when linguistic information is congruent relevant to incongruent (i.e., S < STr and Un < UnTr). We also anticipate that because the Tr condition demonstrates the strongest overlap in lexical representations compared to the other conditions, it has a unique advantage and will evoke RTs that are faster than the other conditions (Basnight-Brown & Altarriba, Reference Basnight-Brown and Altarriba2007; Zhao & Li, Reference Zhao and Li2013). Our second hypothesis is based on our expectations that NHBA and BAA will benefit from semantic relationships. Semantically related items should evoke faster RTs relative to unrelated items, thus revealing an effect of semantic facilitation (i.e., S < U and STr < UnTr) (Basnight-Brown & Altarriba, Reference Basnight-Brown and Altarriba2007, Chen & Ng, Reference Chen and Ng1989; Grainger & Frenck-Mestre, Reference Grainger and Frenck-Mestre1998). To summarize, we expect the following profile of fastest to slowest RTs by condition: Tr < S < Un < STr < UnTr.
Research Question 3
Building on research questions 1 and 2, we examine the results from the linguistic and non-linguistic tasks to see if the mechanisms of control are associated (indicative of domain general cognitive control), or dissociated (indicative of domain specific cognitive control). We expect NHBA to exhibit congruency effects on both the flanker and word-pair relatedness judgment task because they are neurologically healthy adults and should, therefore, be able to complete both tasks with high accuracy and RTs that align with the domain general view. In order to systematically investigate mechanisms of domain general and domain specific control, we must examine BAA data, and it is unclear if BAA will demonstrate positive or negative effects of control on the linguistic and non-linguistic tasks (Dash & Kar, Reference Dash and Kar2014; Green et al., Reference Green, Grogan, Crinion, Ali, Sutton and Price2010; Verreyt et al., Reference Verreyt, De Letter, Hemelsoet, Santens and Duyck2013). For results that suggest domain general cognitive control, we expect BAA to show the congruency effect on the flanker task and word-pair relatedness judgment task or no congruency effect on the flanker task and word-pair relatedness judgment task. For results that suggest domain specific cognitive control, we expect BAA to show either the congruency effect on the flanker task and no congruency on the word-pair relatedness task or no congruency effect on the flanker task and congruency on the word-pair relatedness judgment task.
Research Question 4
Because we expect to have participants with varying levels of language proficiency, we will examine the effect of language dominance on language processing. Specifically, we asked if language dominance affects speed of processing during translation and non-translation conditions that vary by semantic relationship. We hypothesize that the performance of NHBA and BAA will align with the Revised Hierarchical Model (Kroll & Stewart, Reference Kroll and Stewart1994) in that translating into the dominant language will be faster than translating into the weaker language.
Methods
Participants
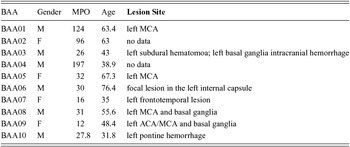
Thirty right handed, Spanish–English NHBA (14 male, 16 females) ranging in age from 24–85 (M = 48 years, SD = 15) and 10 right handed, Spanish–English BAA (6 male, 4 female) ranging in age from 32–76 (M = 52, SD = 14) participated in this study. Participants were either English or Spanish dominant and either simultaneous or sequential language learners with L1 being English or Spanish. Education ranged from elementary to college level. All BAA were at least 12 months post onset from a left CVA (except one with a gun-shot wound). See Table 1 for BAA demographic profiles.
Demographic Data for all Participants and Lesion Cite Information for BAA.

NHBA: 14 M; 16 F; average age = 48 years.
Note: BAA = bilingual adult with aphasia; NHBA = neurologically healthy bilingual adult; M = male; F = female; MPO = months post onset.
Questionnaires and Testing
All participants signed a consent form, filled out a participant or patient history form and a Language Use Questionnaire (LUQ: Kiran, Peña, Bedore & Sheng, Reference Kiran, Peña, Bedore and Sheng2010) that asked specific questions pertaining to: (a) age of L1 and L2 acquisition; (b) amount of lifetime exposure, averaged across three modalities (hearing, speaking and reading), captured as a ratio between L1 and L2 that was averaged across three year intervals and accounted for age; (c) confidence, averaged across three modalities (hearing, speaking and reading), captured in percentages out of 100 for L1 and L2 that was averaged across three year intervals and accounted for age; (d) current exposure that included an hour by hour account of language(s) spoken and heard by participant during his/her daily routine (weekday/weekend) (for BAA this includes a separate rating for pre- and post-stroke language exposure) and is expressed as a proportion between L1 and L2; (e) language proficiency of first degree family members and is expressed as a percentage for each language averaged across family members; (f) language of education history, specifically, languages spoken and preferred by participant and other students in elementary school, high school, and college environments and is expressed as a proportion between L1 and L2; and (g) language ability rating (LAR) for L1 and L2 including overall ability, speaking in casual conversations, listening in casual conversations, speaking in formal situations, listening in formal situations, and reading and writing using a 5 point scale Likert scale where 1 represents non-fluent skills (e.g., speaking at the single word level) and 5 represents native or near native-fluency (for BAA, LAR data was collected for pre-stroke language skill) and is expressed as a percentage.
For NHBA, the average age of acquisition (AoA) for English was 14 years (SD = 20) and the average AoA for Spanish was .9 years (SD = 4); the average family proficiency in English was 56% (SD = 41%) and for Spanish it was 44% (SD = 41%); 12 participants were English dominant, 12 participants were Spanish dominant and the remaining 6 were balanced. For BAA, the average AoA for English was 14 years (SD = 15) and the average AoA for Spanish was 0 years (SD = 0); the average family proficiency in English was 50% (SD = 39%) and for Spanish it was 94% (SD = 11%); 4 participants were English dominant, and 6 participants were Spanish dominant.
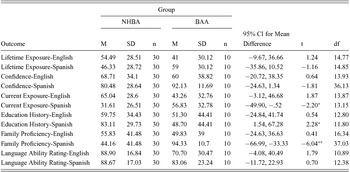
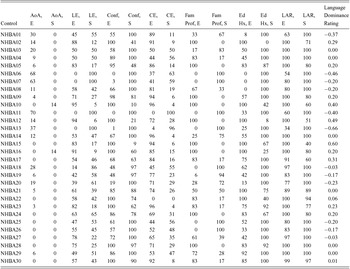
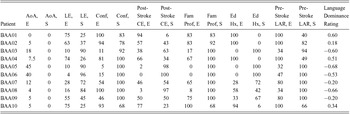
NHBA and BAA were matched on age (t(38) = −.72, p < .05), as well as the following variables from the LUQ: lifetime exposure for Spanish and English, confidence for Spanish and English, LAR for Spanish and English, current exposure for English, education history for English, and family proficiency for Spanish. NHBA and BAA were not matched on the LUQ Spanish variables current exposure, education history, or family proficiency. For results of t-test and descriptive statistics for variables from the LUQ, see Table 2. For LUQ profiles, see Table 3 for NHBA and Table 4 for BAA.
Results of t-test and Descriptive Statistics for Language Use Questionnaire Variables.

Note: Satterthwaite approximation employed due to unequal group variances. All p > .05 unless notated. *p < .05. **p < .001.
NHBA: Language History and Language Dominance Ratings.

Note: NHBA = neurologically healthy bilingual adults; S = Spanish; E = English; AoA = age of acquisition in years; LE = lifetime exposure; Conf = confidence; CE = current exposure; LAR = language ability rating; Ed = education; Hx = history; Fam = family; Prof = proficiency.
BAA: Language History and Language Dominance Ratings.

Note: BAA = bilingual adults with aphasia; S = Spanish; E = English; AoA = age of acquisition in years; LE = lifetime exposure; Conf = confidence; CE = current exposure; LAR = language ability rating; Ed = education; Hx = history; Fam = family; Prof = proficiency.
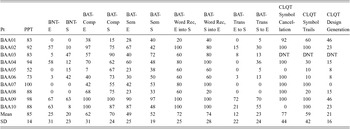
One of our goals was to examine the role of language dominance on linguistic task data. Since we had numerous measures from the LUQ, we turned to our previous work where we found that pre-stroke LAR is a reliable measure predictive of post-stroke language deficits (Gray & Kiran, Reference Gray and Kiran2013; Kiran, Balachandran & Lucas, Reference Kiran, Balachandran and Lucas2014). Therefore, we chose this metric as a method to measure levels of language dominance. In this study, we established a measure of language dominance (labeled LARdiff) based on the language ability rating (LAR) measure from the LUQ. LARdiff is a quantitative metric of language dominance computed for each participant by subtracting LAR Spanish from LAR English. A positive value indicates English dominance and a negative value indicates Spanish dominance. (See Table 3 for NHBA LARdiff profiles and Table 4 for BAA LARdiff profiles.) In addition to the standard intake forms and LUQ interview, all patients were administered a battery of tests that included the Bilingual Aphasia Test (BAT) (Paradis, Reference Paradis1989) in both Spanish and English, the BAT Part C Spanish–English (Paradis, Reference Paradis1989), the Boston Naming Test (BNT) (Kaplan, Goodglass & Weintraub, Reference Kaplan, Goodglass and Weinraub2001) in both Spanish and English, the Pyramids and Palm Trees Test (PPT) – Picture Version (Howard & Patterson, Reference Howard and Patterson1992), and the Symbol Cancellation, Symbol Trails, and Design Generation subtests from the Cognitive Linguistic Quick Test (CLQT) (Helms-Estabrooks, Reference Helm-Estabrooks2001). BAA were a heterogeneous group consisting of balanced and unbalanced individuals who were Spanish or English dominant. They exhibited relatively strong semantic access (e.g., PPT results M = 85, SD = 14), varying degrees of lexical impairment marked by low naming scores (e.g., BNT English results: M = 25, SD = 31, Spanish results: M = 20, SD = 23), and difficulty switching between languages as determined by the BAT Word Recognition (English into Spanish: M = 72, SD = 25; Spanish into English: M = 74, SD = 28) and Translation subtests (English into Spanish M = 12, SD = 22; Spanish into English: M = 23, SD = 24). We specifically did not include a verbal switching or naming task because patients with aphasia exhibit verbal production deficits. Based on test scores, our task of semantic priming that does not require verbal input is justified. BAA test results are listed in Table 5.
BAA Spanish and English Diagnostic Scores.

Note: BAA = bilingual adults with aphasia; Pt = Patient; E = English; S = Spanish; Comp = Comprehension; Sem = Semantics; Trans = Translation; BAT Comp E and BAT Comp S are averages from subtests: Pointing, Semi-Complex Commands and Complex Commands; BAT-Sem E and BAT-Sem S are averages from subtests: Semantic Categories, Synonyms, Antonyms I and II, Semantic Acceptability and Semantic Opposites; BAT Word Rec is the BAT Word Recognition Subtest; BAT-Trans S into E and BAT-Trans E into S are averages from subtests: Translation of Words and Translation of Sentences; PPT = Pyramids and Palm Tree Test, Picture Version; BNT = Boston Naming Test; BAT = Bilingual Aphasia Test; CLQT = Cognitive Linguistic Quick Test.
Tasks
1. Non-Linguistic Task
An adaptation of Erikson and Erikson's (Reference Eriksen and Eriksen1974) flanker task was administered on a laptop using E-Prime (Psychology Software Tools, Inc.). All trials consisted of 5 arrows with a red target arrow in the center. In congruent trials, all arrows faced the same direction and in incongruent conditions, the flanking arrows pointed in opposite directions relative to the target arrow. Approximately half of the NHBA and BAA were presented with 40 trials of congruent and 40 trials of incongruent conditions. We then introduced a neutral condition which reduced the number of congruent and incongruent conditions, and the other half of the participants were presented with 20 trials of each condition. The task included two blocks, each consisting of pseudo-randomized trials (of congruent, incongruent and neutral conditions) that were presented for 3000ms followed by a randomly jittered ISI duration fixation (2000ms or 4000ms) to control for the expectation bias. Participants were instructed to respond as quickly as possible and to respond with a button press “3” if target arrow was pointing left or “4” if target arrow was pointing right. Accuracy and RTs were recorded.
2. Linguistic Task
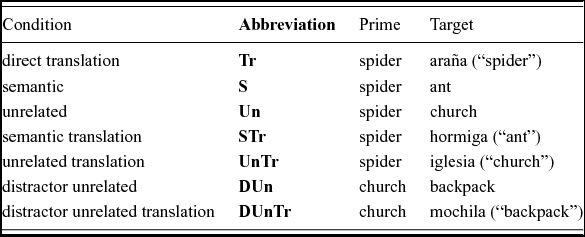
The linguistic task was administered on a laptop using E-Prime (Psychology Software Tools, Inc.). The task consisted of word-pairs that varied by language direction from prime to target (e.g., English–Spanish, Spanish–English, or non-translation) and 5 conditions of word-pair relationships. Stimuli included 30 different Spanish primes and 30 different English primes. Each prime had 5 target conditions. These conditions are: direct translation (hereafter Tr), semantically related non-translation (hereafter S), semantically related translation (hereafter STr), unrelated non-translation (hereafter Un), and unrelated translation (hereafter UnTr). In addition to the five experimental conditions, there were distractor unrelated non-translation (hereafter DUn) and distractor unrelated translation (hereafter DUnTr) conditions to create more no responses relative to yes responses (See Table 6 for a legend of condition abbreviations and sample stimuli.) Stimuli were controlled for cognates and word length. Additionally, we controlled for frequency across primes and target conditions. The following stimuli types were matched for frequency: Spanish primes (M = 3.5, SD = 1.81) and English primes (M = 2.9, SD = .91), t(49) = −1.47, p = .14; S condition Spanish targets (M = 3.19, SD = 1.86) and English targets (M = 2.41, SD = 1.63), t(58) = 1.71, p = .09; STr condition Spanish targets (M = 2.62, SD = 2.08) and English targets (M = 2.93, SD = 1.87), t(58) = −.61, p = .54; Tr condition Spanish targets (M = 2.48, SD = 1.67) and English targets (M = 2.88, SD = 1.95), t(58) = −.86, p = .39; Un condition Spanish targets (M = 2.81, SD = 1.64) and English targets (M = 2.31, SD = 1.59), t(53) = 1.14, p = .25; and UnTr condition Spanish targets (M = 2.48, SD = 1.83) and English targets (M = 2.64, SD = 1.54), t(53) = −.34, p = .73.
Legend of Conditions and Sample Word-Pair Stimuli

Note: NHBA = neurologically healthy bilingual adults; BAA = bilingual adults with aphasia.
The task consists of 8 blocks of 53 trials each. At the end of each block, participants were given the opportunity to rest and were instructed to press the spacebar when ready to start the subsequent block. Each run consisted of four blocks containing only English primes and four blocks containing only Spanish primes. The order of block presentation was pseudo-randomized to form eight unique runs. Assignment of runs was counterbalanced across participants.
Participants were instructed to indicate whether words were related or unrelated. Responses were made with a button press “4” for related and “3” for unrelated. Each trial began with a prime followed by a 100 ms fixation (+), followed by a target. . The goal of this task was to capture automatic processing so the prime and target stimulus presentation was set at 250 ms for NHBA. After some pilot testing, we increased the duration to 350 ms for patients because 250ms was observed to be too fast. After the target disappeared, NHBA and BAA were given a 1500 ms ‘response’ fixation. Accuracy and RT were recorded.
Procedure
All BAA met with a licensed speech-language pathologist who is English–Spanish bilingual. NHBA met with either a trained Spanish–English bilingual student clinician or a licensed, bilingual speech-language pathologist. The purpose of the study, the procedures, and possible risks and benefits were explained to each participant. After consent was obtained, the LUQ was completed. For BAA, the LUQ interview included a primary caregiver so the most accurate language history information was obtained. Then BAA were administered a battery of standardized language tests, whereas NHBA then completed the experiment. The linguistic task was always administered before the non-linguistic task, and practice runs for the linguistic and non-linguistic tasks were administered to ensure comprehension of the tasks. Notably, the linguistic practice runs consisted of unique stimuli that did not overlap with experimental stimuli. NHBA testing was completed in one session. The total number of BAA sessions varied because standardized testing was administered at the pace of each BAA. The language of the session matched the language of testing for that day and languages were not mixed (e.g., if Spanish testing was being administered, instructions were given in Spanish).
Data Analysis
BAA and NHBA data were analyzed separately. To be included in data analysis, participants had to complete the linguistic task and non-linguistic task.
Accuracy and RT data from the linguistic and non-linguistic tasks for BAA and NHBA were analyzed. Because the two distractor conditions on the linguistic task were developed to offset “yes” responses, they were discarded from all analyses. Only accurate responses were included in RT analyses. To account for the resulting individual variability, for each participant we transformed their linguistic raw RTs into z-scores relative to their own scores for each condition and used zRTs for all linguistic analyses.
Results
Non-linguistic task
Accuracy
For NHBA and BAA paired-samples t-tests were performed to evaluate the effect of condition (i.e., congruent and incongruent) on accuracy. NHBA and BAA did not show a significant effect of condition on accuracy, NHBA: t(29) = 1.26, p = .22, η2 = .05 and BAA: t(9) = 1.35, p = .21, η2 = .17.
Response time
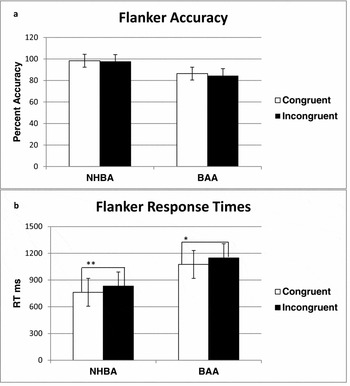
For NHBA and BAA paired-samples t-tests were conducted to evaluate the effect of condition on RT. Both, NHBA, t(29) = −3.26, p < .01, η2 = .27,and BAA, t(9) = −2.37, p = .05, η2 = .34, showed a significant effect of condition, with RTs faster for the congruent condition compared to the incongruent condition, indicating a congruency effect. (See Figure 1 for all non-linguistic task results).
Flanker task (a) accuracy and (b) RT with standard error.
For accuracy, NHBA results showed M = 98% (SD = 5%) for congruent conditions and M = 97.5% (SD = 4%) for incongruent conditions, and BAA results showed M = 87% (SD = 17%) for congruent conditions and M = 86% (SD = 18%) for incongruent conditions. For response time, NHBA results showed M = 763 ms (SD = 199 ms) for congruent conditions and M = 832 ms (SD = 191 ms) for incongruent conditions, and BAA results showed M = 1075 ms (SD = 347) for congruent conditions and M = 1148% (SD = 335 ms) for incongruent conditions.

Linguistic task
Accuracy
For NHBA and BAA one-way ANCOVAS were performed to evaluate the effect of condition and direction (i.e., target language) on percent accuracy with language dominance as the covariate.
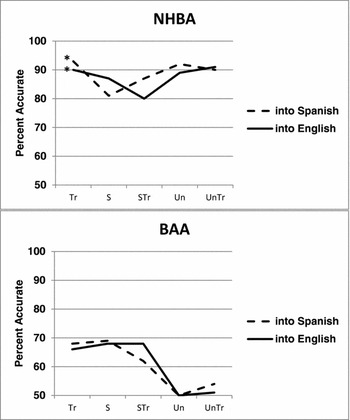
NHBA showed a significant effect of condition and English targets, F(4, 144) = 3.73, p < .01, η2 = .09. Post hoc LSD pairwise comparisons revealed that NHBA were less accurate on the STr condition compared to Tr (p < .01), S (p < .05), Un (p < .05), and UnTr (p < .05). Effect of condition and Spanish targets was also significant, F(4, 144) = 4.69, p = .001, η2 = .11. Post hoc LSD pairwise comparisons revealed that NHBA were less accurate on the S condition compared to Tr (p < .001), STr (p = .05), Un (p = .001), and UnTr (p < .05). Findings show that between the languages, there was lower accuracy for S and STr conditions (see Figure 2).
NHBA and BAA: Accuracy by translation direction ANCOVAS, covarying language dominance with adjusted means.
NHBA: into English and into Spanish (p < .01).
BAA: into English (p = .15), into Spanish (p = .20).
(Stimulus conditions: Tr = direct translation, S = semantic, STr = semantic translation; Un = unrelated; UnTr = unrelated translation. NHBA = neurologically healthy bilingual adults. BAA = bilingual adults with aphasia.)

BAA did not show a significant effect for condition and English targets, F(4, 44) = 1.74, p = .15, η2 = .13, or condition and Spanish targets, F(4, 44) = 1.56, p = .20, η2 = .12. However, BAA were trending towards higher accuracy on semantically related conditions relative to unrelated conditions for English targets (Tr: M = 66, SD = 19; S: M = 68, SD = 18; and STr: M = 68, SD = 17; Un: M = 50, SD = 30; UnTr: M = 51, SD = 21) and Spanish targets (Tr: M = 68, SD = 21; S: M = 69, SD = 15; and STr: M = 62, SD = 19; Un: M = 50, SD = 24; UnTr: M = 54, SD = 23), indicating possible effects of semantic facilitation (see Figure 2).
Response time
Next, we performed one-way ANCOVAs to evaluate the effect of condition and direction (i.e., target language) on zRTs for NHBA and BAA with language dominance as the covariate. We examined differences between S and STr conditions and Un and UnTr conditions.
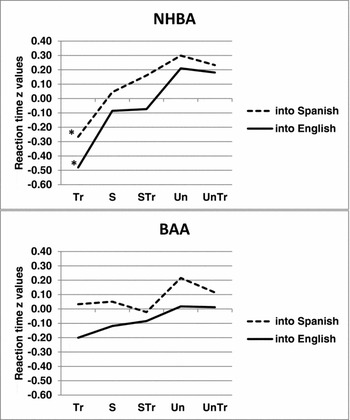
NHBA showed a significant effect of condition and English target, F(4, 144) = 25.35, p < .001, η2 = .38. Post hoc LSD pairwise comparisons revealed that Tr < S (p < .001), Tr < STr (p < .001), Tr < Un (p < .001) and UnTr (p < .001); S < Un (p < .001) and S < UnTr (p < .001); STr < Un (p < .01) and STr < UnTr (p < .01), whereas there was no difference between S and STr (p = .882) or Un and UnTr (p = .705). Effect of condition and Spanish target was significant, F(4, 144) = 19.436, p < .001, η2 = .31. Post hoc LSD pairwise comparison showed that Tr < S (p < .001), Tr < STr (p < .001), Tr < Un (p < .001) and UnTr (p < .001); S < Un (p < .001), S < UnTr (p < .01); STr < Un (p = .05), whereas there was no difference between S and STr (p = .10), STr and UnTr (p = .31) or Un and UnTr (p = .36). To summarize, Tr was the fastest condition, S and STr were the next fastest followed by Un and UnTr for English and Spanish targets, indicating a semantic benefit on condition (i.e., semantically related word-pairs require less effort to process, thus they evoke faster RTs relative to unrelated word-pairs). There were no significant differences between within- and between-language semantically related conditions (S and STr) and unrelated conditions (Un and UnTr) for English and Spanish targets (see Figure 3).
NHBA and BAA: Response time by translation direction ANCOVAS, covarying language dominance with adjusted means.
NHBA: into English and into Spanish (p < .001).
BAA: into English (p = .14), into Spanish (p = .17).
(Stimulus conditions: Tr = direct translation, S = semantic, STr = semantic translation; Un = unrelated; UnTr = unrelated translation. NHBA = neurologically healthy bilingual adults. BAA = bilingual adults with aphasia.)

BAA results were not significant (English targets: F(4, 44) = 1.35, p = .26, η2 = .11; Spanish targets: F(4, 44) = .782, p = .54, η2 = .06) (see Figure 3). However, trends suggest that semantically related conditions (English targets: Tr, M = −.20, SD = .21; S, M = −.11, SD = .29; STr, M = −.08, SD = .24 and Spanish targets: Tr, M = .03, SD = .21; S, M = .05, SD = .20; STr, M = −.02, SD = .25) were faster than unrelated conditions (English targets: Un, M = .02, SD = .30; UnTr M = .01, SD = .21 and Spanish targets: Un, M = .22, SD = .44; UnTr, M = .11, SD = .47), indicating that BAA may benefit from semantic relationships (see Figure 3).
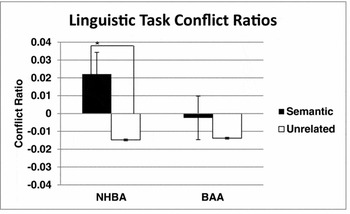
As a follow up we calculated conflict ratios for semantic conditions (S and STr) and unrelated conditions (Un and UnTr) based on Green et al.'s (Reference Green, Grogan, Crinion, Ali, Sutton and Price2010) formula where conflict is calculated as the difference between conflict trials and non-conflict trials divided by non-conflict trials. Then we conducted paired-samples t-tests between the conflict ratios for semantically related (S/STr) and unrelated (Un/UnTr) conditions for NHBA and BAA. Greater conflict ratios indicated greater control required to complete the task. For NHBA, semantically related conditions (S/STr) were significantly different from the unrelated conditions (Un/UnTr), t(29) = 1.95, p = .05, η2 = .12, indicating increased conflict for semantically related conditions relative to unrelated conditions. BAA did not show a significant difference in conflict for semantically related (S/STr) and unrelated conditions (Un/UnTr), t(9) = −.16, p = .87, η2 = .003, indicating impaired control (see Figure 4).
NHBA and BAA conflict ratios with standard error.
The semantic conflict ratio is calculated from the semantic and semantic translation conditions, and the unrelated conflict ratio is calculated from the unrelated and unrelated translation conditions. NHBA = neurologically healthy bilingual adults. BAA = bilingual adults with aphasia. *p = .05

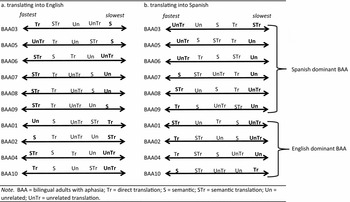
Since the ANCOVA model for BAA was not significant, we visually inspected the BAA zRT data to identify trends for speed across condition and direction of translation for fastest and slowest zRTs. For each patient, we averaged accurate zRTs by condition and direction of translation to identify fastest zRT and slowest zRTs.
First we examined fastest zRTs. In the first subgroup, when translating into English, two out of ten BAA were fastest on the Tr condition and when translating into Spanish, three out of ten BAA were fastest on the Tr condition (e.g., see Figure 5: BAA03 translating into English), indicating that only a few BAA followed the expected zRT trends. Unexpectedly, the largest subgroup, when translating into English, consisted of five out of ten BAA who were fastest on the STr condition and when translating into Spanish, two out of ten BAA were fastest on the STr condition, suggesting a benefit from semantic facilitation and translating between languages (e.g., see Figure 5: BAA06 translating into English). In the next subgroup, when translating into English, one out of ten BAA was fastest on the UnTr condition and when translating into Spanish, three out of ten BAA were fastest on the UnTr condition (e.g., see Figure 5: BAA05 translating into Spanish). These BAA showed a benefit from the between-language conditions without the benefit of semantic facilitation. The last subgroup consists of BAA patients who were fastest on the within-language conditions. For the English S condition, only one BAA was fastest, for the Spanish S condition, two BAA were fastest, and for the English Un condition, only one BAA was fastest (e.g., see Figure 5: BAA01 translating into English). This smallest subgroup reveals that a few of BAA benefit from within-language conditions, whether they are semantically related or unrelated.
BAA Response Time Profiles.

Next we examined slowest zRTs. In the largest subgroup, when translating into English, five out of ten BAA were slowest on either the Un or UnTr condition and when translating into Spanish, eight out of ten BAA were slowest on either the Un or UnTr condition (e.g., see Figure 5: BAA07 translating into Spanish). These results align with trends observed in the NHBA zRT data, that Un and UnTr conditions should evoke slow zRTs. In the next subgroup, three of ten BAA were slowest on the S condition in English, results that show within-language interference (e.g., see Figure 5: BAA09 translating into English). The two smallest subgroups consisted of BAA patients who were slowest on the Tr or STr conditions. (See Figure 5 for all BAA RT profiles.)
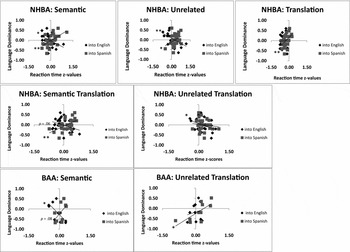
Finally, we examined the effect of language dominance on translation. We performed Pearson correlations within each condition for NHBA and BAA, correlating language dominance with zRTs in the target language. For language dominance we used LARdiff scores.
For NHBA on S and Un conditions, English language dominance was negatively correlated with English target zRTs (S: r = −.42; Un: r = −.54, p < .01) and Spanish language dominance was positively correlated with Spanish target zRTs (S: r = .58, p < .01; Un: r = .37). This indicates that for within-language conditions, English dominant NHBA responded faster to English targets relative to Spanish targets and Spanish dominant NHBA responded faster to Spanish targets relative to English targets. For STr, English language dominance had a strong trend towards a negative correlation with English target zRTs (r = −.35, p = .06) and Spanish language dominance was positively correlated with Spanish targets (r = .53, p < .01), indicating that translating into the dominant language evokes faster response times relative to translating into the weaker language. For Tr and UnTr conditions we see inverse results. For the direct translation, Tr condition, English language dominance was not significantly correlated with English target zRTs (r = .10, p = .60), whereas Spanish language dominance was positively correlated with Spanish target zRTs (r = .49, p < .01). Conversely, for the UnTr condition English dominant NHBA were faster when translating into English (r = −.38, p < .05) but for Spanish dominant NHBA we did not see significant effects when translating into the dominant language (r = −.13, p = .51). This indicates that when translating into the dominant language, only Spanish dominant NHBA showed significant effects in the Tr condition and only English dominant NHBA showed significant effects in the UnTr condition. Overall, these results suggest that NHBA show strong relationships for within-language word-pairs in their dominant language and for semantically related, between-language word-pairs when translating into the dominant language (see Figure 6).
Correlations of language dominance and response time by translation direction. Language dominance is represented by LARdiff where positive values = English dominance and negative values = Spanish dominance. LARdiff = language ability rating difference, NHBA = neurologically healthy bilingual adults. BAA = bilingual adults with aphasia.*p < .05, **p < .01

In line with NHBA results, for BAA on the S condition, English language dominance was negatively correlated with English target zRTs (r = −.70, p < .05) and Spanish language dominance was trending towards a significant correlation with Spanish target zRTs (r = .56, p = .08), indicating that for the S condition, English dominant BAA responded faster to English targets relative to Spanish targets and Spanish dominant BAA responded faster to Spanish targets relative to English targets. For the UnTr condition, Spanish language dominance was correlated with Spanish target zRTs (r = .73, p < .05), whereas English language dominance was not significantly correlated with English target zRTs (p > .05), suggesting that Spanish dominant BAA are faster when translating into their dominant language. Overall, these results for within-language conditions suggest that BAA show a strong relationship with semantically related, within-language word-pairs that are in their dominant language and that Spanish dominant BAA show a strong relationship for unrelated word-pairs when translating into the dominant language. All other correlations evaluating language dominance and target language were not significant (see Figure 6).
Discussion
In this study we examined the nature of cognitive control in bilingual aphasia and explored the role of language proficiency on language processing. As discussed in the introduction, bilinguals manage two languages simultaneously, but it is unclear if mechanisms of language control are indicative of domain specific cognitive control, or indicative of domain general cognitive control. To investigate these control mechanisms and explore effects of language proficiency on language processing, we asked four research questions. The first two questions examined the effects of control in linguistic and non-linguistic contexts. The third question integrated the results of the first two questions to determine if mechanisms of language control and cognitive control are domain general or domain specific. The fourth question examined the effect of language proficiency on direction of translation.
In the first research question we examined the nature of cognitive control in a non-linguistic task. We employed the flanker task that included congruent and incongruent conditions. In terms of response times, NHBA and BAA results revealed positive effects of non-linguistic cognitive control, indicating that both groups demonstrated that suppressing incongruent flanking arrows took longer relative to suppressing congruent flanking arrows. We did not observe differences in accuracy between the two conditions for either group. This was not surprising because high accuracy is expected on the flanker task (Costa, Hernández & Sebastián-Gallés, Reference Costa, Hernández and Sebastián-Gallés2008; Soveri, Rodriguez-Fornells & Laine, Reference Soveri, Rodriguez-Fornells and Laine2011).
In the second research question we examined the nature of language control and language processing. We employed a semantic word-pair judgment task where two factors were at play: 1) language processing: targets that were semantically related to their primes should have greater activation (Collins & Loftus, Reference Collins and Loftus1975) which would result in faster RTs compared to targets that were unrelated to their primes, and 2) language control: within-language word-pairs (S and Un) require less active inhibition of the non-target language and likely should evoke faster RTs compared their between-language word-pair counterparts (STr and UnTr). Therefore, we expected semantically related conditions to evoke faster RTs relative to unrelated conditions (S < Un and STr < UnTr), and effects of congruency (S < STr and Un < UnTr).
First we evaluated accuracy. NHBA were more accurate on the Tr, Un and UnTr conditions compared to the S, and STr conditions. These results indicate that semantically related word-pairs from within- and between-languages were more difficult to identify than direct translations or unrelated word-pairs. Next we examined RTs. For NHBA, the Tr condition evoked the fastest RTs independent of whether participants were going into their weaker language or stronger language. S and STr conditions were the next fastest conditions followed by the slowest conditions, Un and UnTr. In line with our language processing predictions, these outcomes reveal an advantage for semantically related items for both within- and between-language word-pairs relative to within- and between-language unrelated word-pairs, a finding that is supported by studies that show that direct translation primes elicit quicker responses relative to semantically related primes (Basnight-Brown & Altarriba, Reference Basnight-Brown and Altarriba2007; Zhao & Li, Reference Zhao and Li2013). Regarding language control, it is surprising that we did not see effects of congruency (S faster than STr and Un faster than UnTr). While one interpretation of this data is that the lack of congruency effect on the linguistic task taken together with the congruency effect observed on the non-linguistic task indicates domain specific language control processing for NHBA, we hypothesize that the receptive task was not strong enough to sufficiently tax the language control system in the NHBA group, resulting in no differences between contrasted conditions. However, because we are examining bilingual adults with aphasia who may present with impairment in lexical access and language control, we needed to use a receptive task in order to tease apart the two types of impairments that can emerge. This apparent tradeoff is important because the main goal of the study was to examine language control in bilingual aphasia and these individuals can only reliably perform receptive language tasks.
To further evaluate effects of control on the linguistic task, we analyzed conflict ratios, which reflect the amount of control required to perform a task. Higher conflict ratios indicate greater control required. Previous studies have used conflict ratios to examine conflict required to perform particular tasks (e.g., the flanker and Stroop) in bilingual patients and controls (Green et al., Reference Green, Grogan, Crinion, Ali, Sutton and Price2010). If the semantic judgment task in the present study only tapped the semantic system, lower conflict ratios would be observed for semantic conditions compared to unrelated conditions. However, NHBA demonstrated greater conflict on the semantic conditions, findings that indicate the semantic conditions require more control compared to the unrelated conditions. Taken together, the accuracy and RT results suggest increased cost for semantic conditions (S/STr), indicating greater need for control.
Now we turn to the BAA group results. Although the BAA group analysis for accuracy and RT on the linguistic task did not produce significant findings, we visually inspected the data. Overall, BAA appeared to benefit from semantically related items. For accuracy and RT, group results trended towards higher accuracy and faster RTs on Tr, S, and STr conditions compared to Un and UnTr conditions. We then performed individual patient analyses, similar to other studies that explore language control in bilingual aphasia (Dash & Kar, Reference Dash and Kar2014; Green et al., Reference Green, Grogan, Crinion, Ali, Sutton and Price2010; Verreyt et al., Reference Verreyt, De Letter, Hemelsoet, Santens and Duyck2013). Findings are two-fold. Some BAA show positive effects language control as evidenced by being fastest on within language conditions, but other BAA do not show positive effects of language control as evidence by being fastest on between-language conditions. Additionally, some BAA show a benefit from semantic relationships as evidenced by faster RTs on word-pairs that are semantically related, whereas other BAA do not. Finally, several patients show faster reaction times for translations, indicating that that translating from one language to the other is facilitatory. One surprising finding was that some BAA were fastest on the unrelated translations, suggesting that these BAA were simply not processing the word-pairs or that due to weak language boundaries, they are making decisions based on the second word.
Based on the individual analysis on BAA RT linguistic data, some BAA benefit from within-language conditions and exhibit interference from between-language conditions while other BAA show the opposite effect, exhibiting facilitation from between-language conditions and no benefit from staying within-language. This result is counterintuitive, but the finding that STr is facilitative requires further discussion. Although the STr condition requires moving between two languages, it could be that 1) the semantic relationship bootstraps this process to evoke fast RTs in language processing for BAA and 2) the language of the prime facilitates lexical access to the language of the target. BAA show a benefit from the STr condition because the prime triggers spreading activation of the semantic network, including cross-language spreading activation (Columé, Reference Colomé2001; De Bot, Reference De Bot1992), resulting in robust priming effects and fast RTs. Because BAA exhibit lexical retrieval deficits (i.e., a lack of activation for lexical items because the language system is impaired) the semantic prime boosts lexical activation levels. In sum, the observed benefit of STr has to do with semantic relationships being stronger than the inhibition required to translate between-languages.
It is also worth noting that as a group, BAA did not show a significant difference in conflict ratios between semantic conditions (S/STr) and unrelated conditions (Un/UnTr). Taken together with the semantic facilitation in the STr condition, BAA results suggest an interesting pattern of a lack of control required for the semantic translations. Therefore, it is possible that the semantic benefit is more important than the boundary of language. These results are validated by treatment studies that reveal generalization to the semantic translation of the target is based on semantic facilitation and bilingual lexical retrieval (Edmonds & Kiran, Reference Edmonds and Kiran2006; Kiran et al., Reference Kiran, Sandberg, Gray, Ascenso and Kester2013; Kiran & Roberts, Reference Kiran and Roberts2010). Furthermore, patterns in these data emerge across language dominance, apart from within- or between-language conditions, and quite possibly reveal a tradeoff between within- and between-language processing.
To answer the third question, we examined if the non-linguistic and linguistic task results were indicative of domain specific or domain general cognitive control. We predicted that NHBA would exhibit the congruency effect on the flanker task and the linguistic task. On the flanker task, NHBA showed the congruency effect. On the linguistic task, NHBA did not show the congruency effect on the first level analysis (i.e., S vs STr and Un vs UnTr). However, in the follow up conflict ratio analysis on the linguistic task, results revealed that NHBA did exhibit effects of language control. While we cannot rule out the possibility that the receptive language task we employed did not amplify the difference between congruent and incongruent conditions for NHBA, the results tentatively provide evidence for domain general cognitive control.
Nevertheless, to identify domain general cognitive control vs. domain specific cognitive control, we must focus on BAA performance on these two tasks. For evidence of mechanisms of domain general cognitive control, we made two predictions: 1) BAA would show the congruency effect on the flanker task and the linguistic task, or alternatively, 2) BAA would not show the congruency effect on the flanker task and the linguistic task. For evidence of mechanisms of domain specific cognitive control, we made two predictions: 1) BAA would show the congruency effect on the flanker task and no congruency effect on the linguistic task, or alternatively, 2) BAA would not show the congruency effect on the flanker task and show the congruency effect on the linguistic task. Results revealed that BAA showed the congruency effect on the flanker task but did not show the congruency effect on the linguistic task (as evidenced by group analyses, individual analyses, and conflict ratios), suggesting a dissociation between language control and cognitive control, indicative of domain specific cognitive control. In relation to previous studies that explore control mechanisms in bilingual aphasia, our results align with Dash and Kar (Reference Dash and Kar2014) that identified a dissociation between language control and cognitive control, but are at odds with the Green et al. (Reference Green, Grogan, Crinion, Ali, Sutton and Price2010) and Verreyt et al. (Reference Verreyt, De Letter, Hemelsoet, Santens and Duyck2013) studies that identified impaired linguistic and non-linguistic control.
In the fourth research question we examined the effect of language dominance on language processing. Specifically, we explored the effect of language dominance on lexical access in terms of between-language conditions on direction of translation. Based on psycholinguistic models of language control including the Inhibitory Control model (Green, Reference Green1998) and the RHM (Kroll & Stewart, Reference Kroll and Stewart1994), as well as empirical data that provide evidence in support of these models (e.g., Costa & Santesteban, Reference Costa and Santesteban2004; Meuter & Allport, Reference Meuter and Allport1999), we expected participants to demonstrate faster RTs when translating into their dominant language. The NHBA results from semantically related word-pairs (STr and Tr conditions) confirm these findings, suggesting that to switch into the dominant language, a bilingual must overcome inhibition required to suppress that language. In contrast, it was surprising that only for the within-language S condition did the BAA show faster RTs in their dominant language. These results clearly indicate that BAA are not processing language in the same way as NHBA and show that semantic relationships are beneficial for BAA. Our previous work has shown that gains in bilingual naming treatment can generalize to semantically related words that are within- or between-language (Kiran et al., Reference Kiran, Sandberg, Gray, Ascenso and Kester2013) which lends support to these findings. Furthermore, it appears that it is the effect of semantic relationships that may drive the BAA RTs to offer any resemblance to the expected outcomes observed in the NHBA. In sum, these results suggest that even if BAA stay within-language, which should require less language control effort relative to moving between-languages, the semantic relationships are crucial parts of their ability to complete language tasks.
Conclusion
In this study we set out to explore mechanisms of control and language processing in bilingual aphasia. When results from the linguistic and non-linguistic control tasks are examined in tandem, a dissociation between the mechanisms of language control and general cognitive control emerged in the data, thus offering support for the model of domain specific cognitive control. The findings from the present study offer strong contributions to the corpus of bilingual aphasia literature, and we acknowledge the importance of extending these findings. In order to provide a more thorough examination of language processing and executive functioning that investigates how these processes overlap and breakdown, additional linguistic and non-linguistic experimental paradigms must be explored. Finally, since the patient sample size is small, the conclusions we can draw are limited. However, the fact that ten BAA are included in the data set is compelling, and these data serve as a starting point to evaluate patients by subgroups rather than single cases.