



1. Introduction
Interfacial fluid mixing is a common phenomenon that occurs frequently in basic science research and in engineering applications. Very often, the involved interface is unstable and small disturbances at the interface grow to form nonlinear structures. Particularly, the instabilities of the interface between two immiscible fluids, induced by an external force or a shock wave, have been intensively studied due to their essential role in understanding supernova explosions, inertial confinement fusion, etc. The former instability is known as Rayleigh–Taylor (RT) instability (Rayleigh Reference Rayleigh1883; Taylor Reference Taylor1950), and the latter one is known as Richtmyer–Meshkov (RM) instability (Richtmyer Reference Richtmyer1960; Meshkov Reference Meshkov1969). The nonlinear structures at the unstable interface are known as spikes for the portion of heavy fluid penetrating into light fluid, and known as bubbles for the portion of light fluid penetrating into heavy fluid. To predict the growth rate of spikes and bubbles is very important for understanding the dynamics of unstable interfaces.
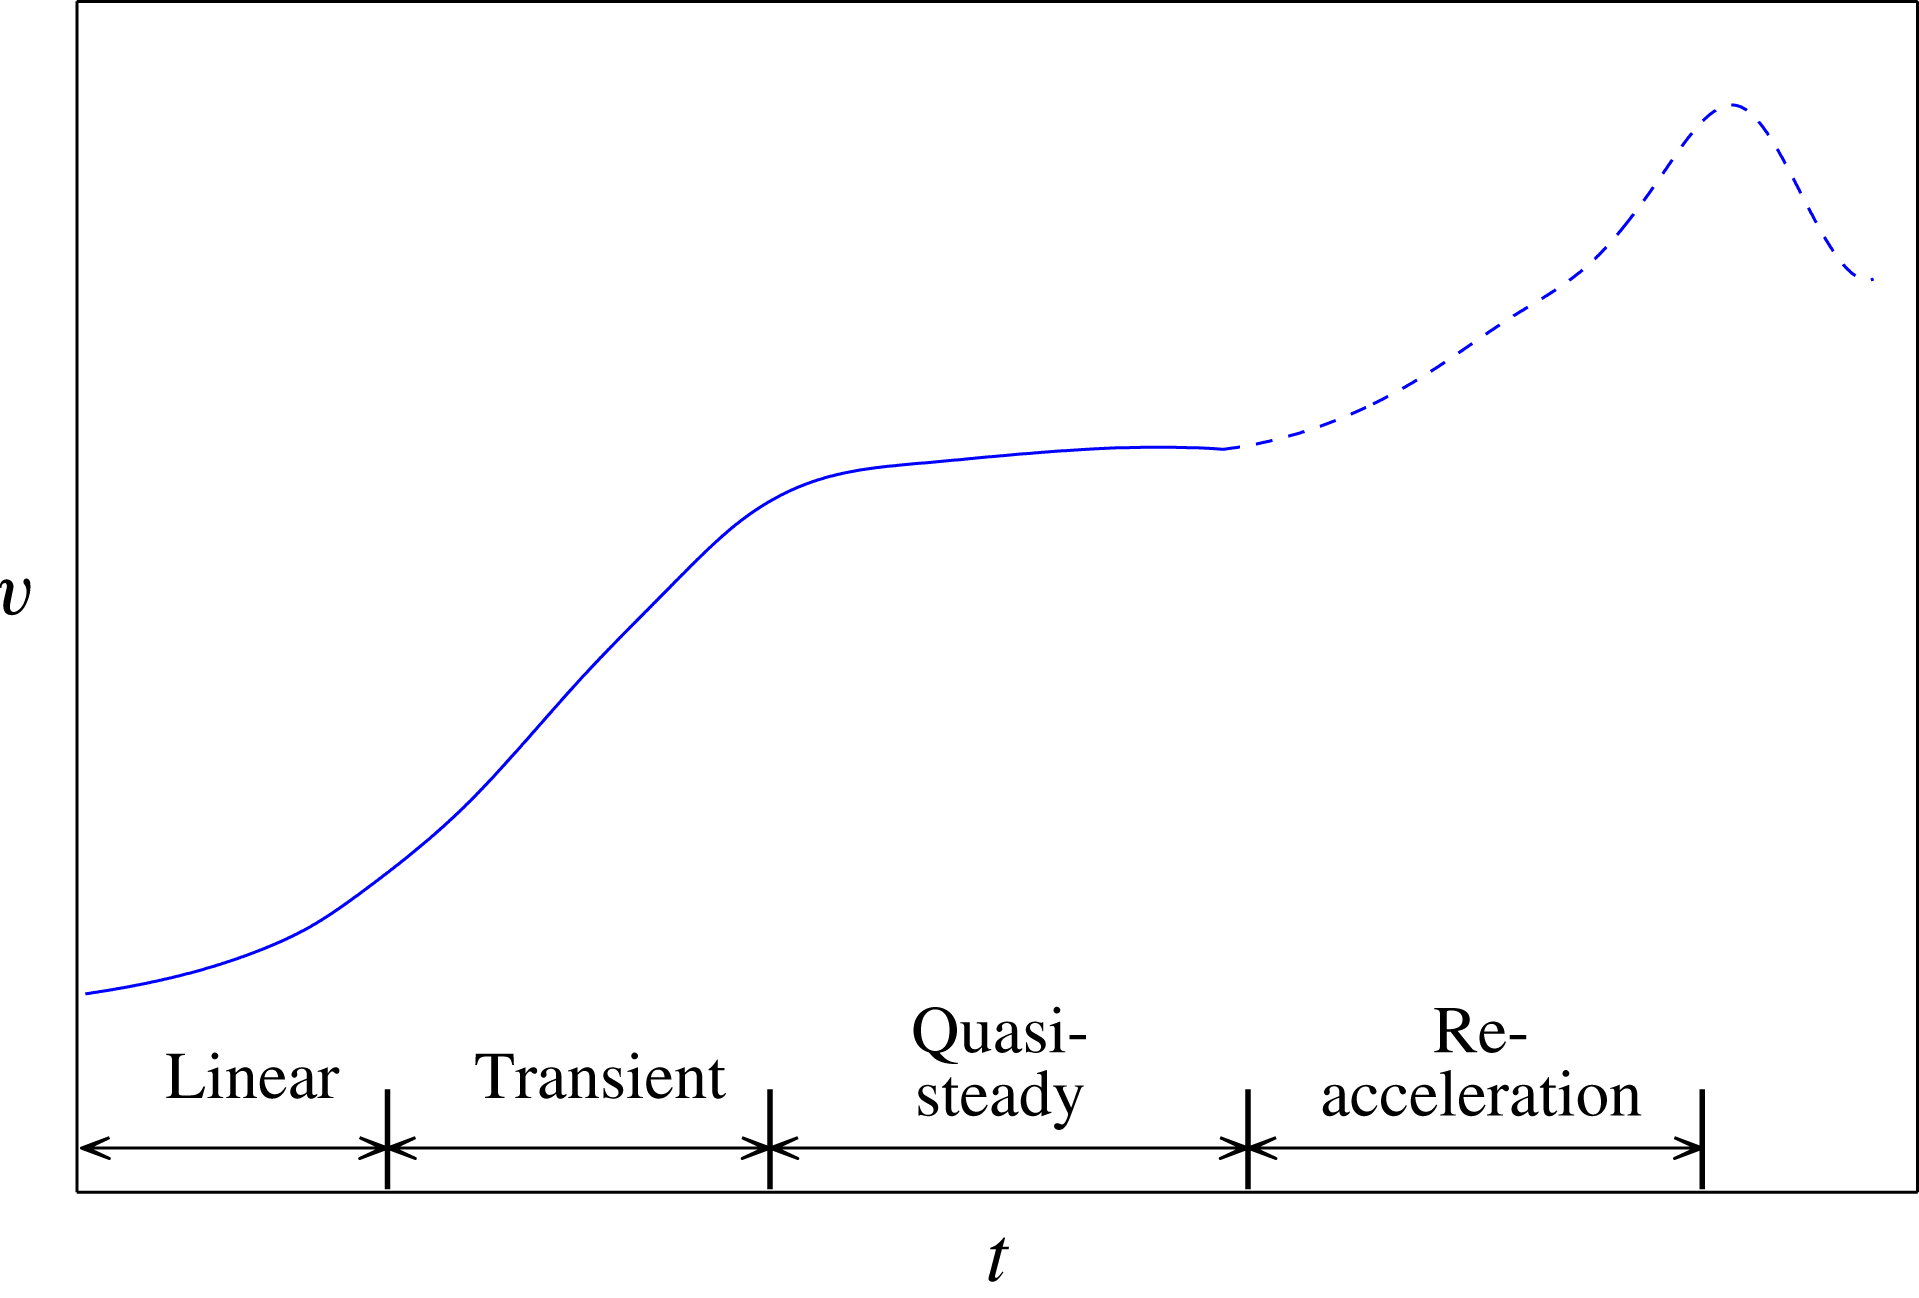
The studies of RT and RM instabilities have a long history. General reviews on RT and RM instabilities can be found in Sharp (Reference Sharp1984) and Brouillette (Reference Brouillette2002). The results for RT and RM instabilities in incompressible, irrotational and inviscid systems can be traced from Hecht, Alon & Shvarts (Reference Hecht, Alon and Shvarts1994), Zhang (Reference Zhang1998), Glimm, Li & Lin (Reference Glimm, Li and Lin2002), Goncharov (Reference Goncharov2002), Abarzhi, Glimm & Lin (Reference Abarzhi, Glimm and Lin2003), Mikaelian (Reference Mikaelian2003) and Sohn (Reference Sohn2003, Reference Sohn2004). Many studies have showed that the development of RT instability starts with a linear stage, and transits into a quasi-steady stage at late times. In the quasi-steady stage, the growth rates of the fingers are insensitive to time for systems with finite density ratios (see the solid curve in figure 1). Since most of the previous experiments, numerical simulations and theoretical studies were performed up through the quasi-steady stage, we will focus on the development of the instability in the quasi-steady stage. New numerical studies (Glimm et al. Reference Glimm, Li and Lin2002; Sohn Reference Sohn2011) on RT instability suggested that, beyond this stage, the growth rate may experience a period of re-acceleration, followed by a decrease (see the dashed curve in figure 1). Several interpretations have been offered for this phenomenon, such as the geometric effect of changes in finger tip curvature (Glimm et al. Reference Glimm, Li and Lin2002), or strong vorticities at the tails of bubbles and spikes (Sohn Reference Sohn2011). Since the understanding of the dynamics of fingers in such a late stage is still progressing, we will not focus on the fingering growth in this possible re-acceleration stage.
Sketch of different growth stages in RT instability, based on the numerical result from Glimm et al. (Reference Glimm, Li and Lin2002).
2. Different behaviours between spikes and bubbles
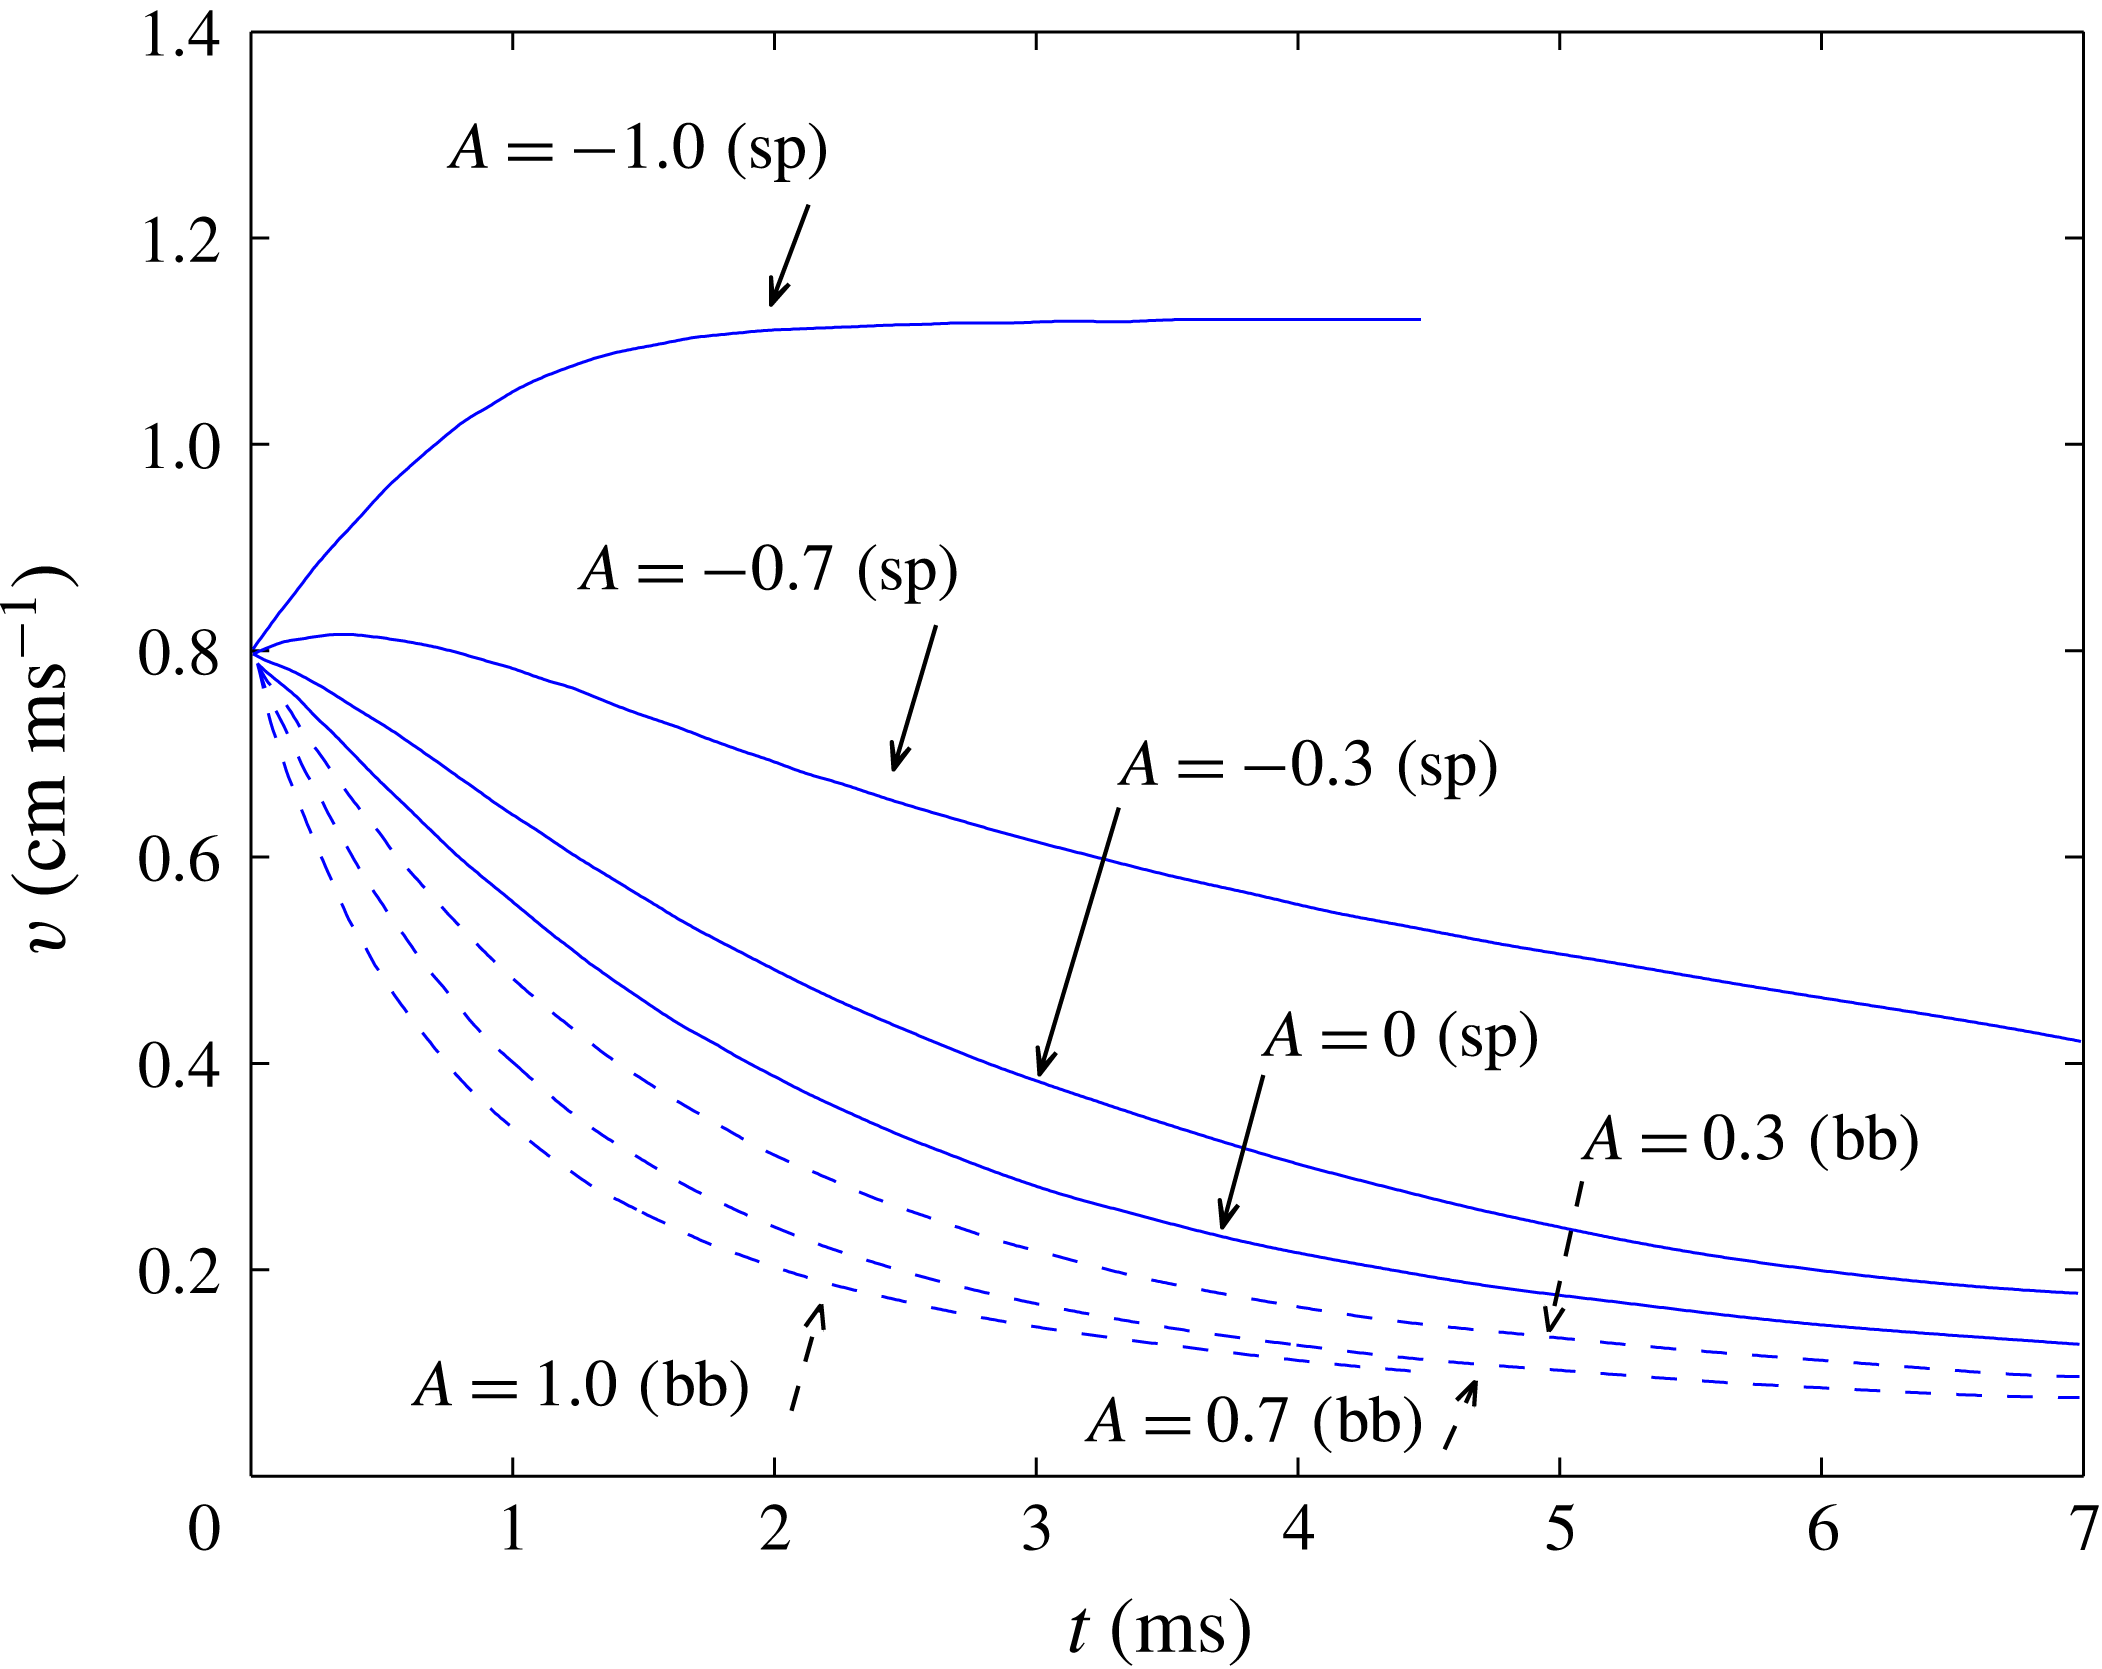
It is well known that spikes and bubbles can exhibit qualitatively different behaviours. Spikes are more unstable than bubbles and consequently it is more difficult to predict the behaviour of spikes. Even among fingers of the same type, different fluid density ratios can lead to quantitatively different behaviours. The larger the density ratio, the more unstable is the finger. In addition, the spike in a system with an infinite density ratio shows completely different behaviour at late times from those in systems with finite density ratios. For RM instability, the former attains a constant velocity asymptotically while the latter decay with time; for RT instability, the former asymptotically grows with a constant acceleration while the latter grow with approximately constant velocities at the quasi-steady stage. These phenomena are well illustrated in figures 2–4 for RM instability, and in figure 5 for RT instability. In the captions of these figures,
 $a_{0}$
is the initial amplitude of the interface perturbation,
 $v_{0}$
is the initial velocity,
 $k$
is the wavenumber,
 ${\it\lambda}$
is the wavelength and
 $g$
is the gravitational acceleration. The data for figures 2 and 5 are taken from Sohn (Reference Sohn2004), in which the numerical simulations were performed with the vortex method (E & Hou Reference E and Hou1990). The data for figure 3 are taken from Dimonte & Ramaprabhu (Reference Dimonte and Ramaprabhu2010), and the data for figure 4 are taken from Alon et al. (Reference Alon, Hecht, Ofer and Shvarts1995). To describe density ratios, the Atwood number
 $A=({\it\rho}_{1}-{\it\rho}_{2})/({\it\rho}_{1}+{\it\rho}_{2})$
is commonly used, where
 ${\it\rho}_{i}~(i=1,2)$
denotes the density of fluid
 $i$
. Conventionally only a positive Atwood number is used for both spikes and bubbles of the same system, but in this paper we specifically use the positive Atwood number for bubbles, and its negative counterpart for spikes with the same density ratio. This allows us to express the results for both spikes and bubbles by the same function in the later analysis.
Spike (solid curves) and bubble (dashed curves) velocities at different Atwood numbers
 $A$
from numerical simulations for RM instability (Sohn Reference Sohn2004). The initial conditions are
 $a_{0}=0.5$
cm and
 $v_{0}=0.8$
cm ms
 $^{-1}$
, with
 $A=0,\pm 0.3,\pm 0.7,\pm 1$
.
Spike (solid curves) and bubble (dashed curves) velocities at different Atwood numbers
 $A$
from numerical simulations for RM instability (Dimonte & Ramaprabhu Reference Dimonte and Ramaprabhu2010). The initial condition is
 $a_{0}k=0.125$
, with
 $A=\pm 0.25,\pm 0.5,\pm 0.75,\pm 0.88,\pm 0.94,\pm 0.98$
.

Spike (solid curves) and bubble (dashed curves) velocities at different Atwood numbers
 $A$
from numerical simulations for RM instability (Alon et al.
Reference Alon, Hecht, Ofer and Shvarts1995). The initial conditions are
 $v_{0}=1$
cm ms
 $^{-1}$
and
 ${\it\lambda}=1$
cm, with
 $A=\pm 0.2,\pm 0.5,\pm 0.9,-1$
.

Spike (solid curves) and bubble (dashed curves) velocities at different Atwood numbers
 $A$
from numerical simulations for RT instability. Blue curves: vortex model results from Sohn (Reference Sohn2004), with
 $a_{0}k=0.5$
,
 $v_{0}=0$
and
 $A=\pm 0.05,\pm 0.3,\pm 0.7,\pm 1$
. Black curve (labelled as c.m.): conformal mapping result from Menikoff & Zemach (Reference Menikoff and Zemach1983), with the same initial conditions and
 $A=1$
.

In this study, we investigate both spikes and bubbles in systems with all density ratios up through the quasi-steady stage, and report a very surprising result: by appropriately scaling the physical quantities, the main behaviours of growth rates of all fingers collapse onto a single curve. We call this curve ‘universal’ because it applies (1) among bubbles of different density ratios, (2) among spikes of different density ratios and (3) between bubbles and spikes of different density ratios.
The Layzer-type method has been extensively adapted in studying fingering instabilities. This method was initially introduced by Layzer (Reference Layzer1955) to study the motion of a vacuum bubble in RT instability. The model was later extended by Hecht et al. (Reference Hecht, Alon and Shvarts1994) to study bubbles in RM instability and by Mikaelian (Reference Mikaelian1998) to study bubbles in cylindrical geometry. Zhang (Reference Zhang1998) extended the model to the spike. All these studies are for systems with infinite density ratios. Goncharov (Reference Goncharov2002) generalized the method to finite density ratios. However, Mikaelian (Reference Mikaelian2008) pointed out the problems in Goncharov’s model: ‘The failure for spikes becomes perhaps obvious for this model
 $\ldots$
it is well known that spikes are ‘sharper,’ i.e. have larger
 $|{\it\eta}_{2}|$
than bubbles, especially at large
 $A$
. (Goncharov’s) equation (4) is independent of
 $A$
and clearly predicts the wrong curvature for Goncharov’s spikes.’ Later Abarzhi et al. (Reference Abarzhi, Glimm and Lin2003) and Sohn (Reference Sohn2003) obtained similar growth rates with different approaches, however only for bubbles. Mikaelian (Reference Mikaelian2003) proposed an analytic model for the evolution of the bubble amplitude from the linear to the nonlinear regime. From these works, we observe a list of characteristics that the finger curvature possesses:
-
(1) for infinite density ratio, the bubble curvature asymptotically tends to one-sixth of the wavenumber (Hecht et al. Reference Hecht, Alon and Shvarts1994; Mikaelian Reference Mikaelian1998; Zhang Reference Zhang1998; Goncharov Reference Goncharov2002; Abarzhi et al. Reference Abarzhi, Glimm and Lin2003; Sohn Reference Sohn2003);
-
(2) for infinite density ratio, the spike curvature asymptotically tends to infinity (Zhang Reference Zhang1998);
-
(3) the bubble curvature in the quasi-steady stage is insensitive to the density ratio (Sohn Reference Sohn2004).
Based on these properties we will deduce the finger growth rate for a system with any density ratio and show the universality of all fingers at late times, but before the possible re-acceleration stage.
3. Theoretical formulation
We consider incompressible, inviscid and irrotational fluids with arbitrary density ratio in two dimensions, whose governing equations (Layzer Reference Layzer1955) are
 $$\begin{eqnarray}\displaystyle & \displaystyle {\rm\nabla}^{2}{\it\phi}_{i}(t,x,z)=0, & \displaystyle\end{eqnarray}$$
 $$\begin{eqnarray}\displaystyle & \displaystyle \frac{\partial {\it\eta}}{\partial t}-\frac{\partial {\it\phi}_{i}}{\partial x}\frac{\partial {\it\eta}}{\partial x}+\frac{\partial {\it\phi}_{i}}{\partial z}=0,\quad \text{at}~z={\it\eta}, & \displaystyle\end{eqnarray}$$
 $$\begin{eqnarray}\displaystyle & \displaystyle \mathop{\sum }_{i=1}^{2}(-1)^{i}{\it\rho}_{i}\left(-g{\it\eta}+\frac{\partial {\it\phi}_{i}}{\partial t}-\frac{1}{2}\left[\left(\frac{\partial {\it\phi}_{i}}{\partial x}\right)^{2}+\left(\frac{\partial {\it\phi}_{i}}{\partial z}\right)^{2}\right]\right)=f(t),\quad \text{at}~z={\it\eta}. & \displaystyle\end{eqnarray}$$
 $z={\it\eta}(t,x)$
is the vertical position of the interface at time
 $t$
,
 $g$
is the gravitational acceleration,
 ${\it\phi}_{i}$
is the velocity potential,
 ${\it\rho}_{i}$
is the fluid density, subscript
 $i~(i=1,2)$
denotes the upper fluid and lower fluid, respectively, and
 $f(t)$
is an arbitrary function that depends only on time
 $t$
.
In our configuration, a signed Atwood number is used to describe the density ratio. To elaborate, when studying bubbles, we consider the heavy fluid is on top of the light fluid with the acceleration pointing downwards. Therefore, the Atwood number
 $A=({\it\rho}_{1}-{\it\rho}_{2})/({\it\rho}_{1}+{\it\rho}_{2})>0$
and
 $g>0$
for bubbles. When studying spikes, we consider the light fluid is on top of the heavy fluid with the acceleration pointing upwards. Therefore,
 $A<0$
and
 $g<0$
for spikes. This setting allows us to consider only the case of the finger penetrating from the lower fluid into the upper fluid for both finger types (bubbles and spikes).
The shape of a finger tip (bubble or spike) is approximated as a parabola,
 ${\it\eta}(t,x)=z_{0}(t)+{\it\xi}(t)kx^{2}$
. Here
 $z_{0}(t)$
and
 ${\it\xi}(t)$
are the vertical position and the curvature of the finger tip, respectively. In our configuration, the curvature is always non-positive, i.e.
 ${\it\xi}\leqslant 0$
.
In theory, the velocity potential in phase 1 can be expressed in a series such as
 ${\it\phi}_{1}=\sum _{j=1}^{\infty }a_{1}^{(j)}(t)\cos (jkx)\text{e}^{-jkz}=a_{1}^{(1)}(t)\cos (kx)\text{e}^{-kz}+\sum _{j=2}^{\infty }a_{1}^{(j)}(t)\cos (jkx)\text{e}^{-jkz}$
. This usual standard perturbation expansion with modes
 $k,2k,3k,\ldots$
is good for early-time behaviour, but not suitable for late-time approximation, since it is a divergent series for large times. Since our study focuses on the late-time behaviour of single-mode RT and RM instabilities, an approach that captures the dominant behaviour of fingers at late times is needed. The works in Layzer (Reference Layzer1955), Hecht et al. (Reference Hecht, Alon and Shvarts1994), Mikaelian (Reference Mikaelian1998) and Zhang (Reference Zhang1998) showed that, for
 $A=1$
, modelling the system with only the primary mode
 $k$
is sufficient to obtain a good approximation. However, as pointed out by Mikaelian (Reference Mikaelian2008), for a system with
 $|A|\neq 1$
, still modelling the system with only one mode had led to incorrect predictions for the asymptotic curvature. Thus, it is necessary to model the collective behaviour of all modes beyond the primary mode
 $k$
. In our model, the first term
 $a_{1}^{(1)}(t)\cos (kx)\text{e}^{-kz}$
, abbreviated as
 $a_{1}(t)\cos (kx)\text{e}^{-kz}$
, represents the dominant behaviour of the finger, and we approximate the collective behaviour of all remaining terms
 $\sum _{j=2}^{\infty }a_{1}^{(j)}(t)\cos (jkx)\text{e}^{-jkz}$
by
 $b_{1}(t)\cos (c(t)kx)\text{e}^{-c(t)kz}$
. Note that in our approximation the coefficient
 $c(t)$
depends on the Atwood number
 $A$
, which is different from other approximations. Most approximations assume that the finger can be well expressed by the first few terms of the series
 $\sum _{j=1}^{n}a^{(j)}(t)\cos (jkx)\text{e}^{-jkz}$
, and each frequency is proportional to
 $k$
and independent of
 $A$
. Since we use an effective mode to represent the collective behaviour of all remaining modes
 $j=2,3,\ldots ,$
and the coefficients of these modes depend on
 $A$
, it follows that
 $c(t)$
in our approximation must also depend on
 $A$
. We comment that
 $c(t)k$
is not an approximation for only the first few terms in the expansion, and it is not for the whole interface. It is a local approximation for the collective behaviour of all remaining modes near the finger tip. Although the same functional form
 $c(t,A,g)$
is used for both bubbles and spikes, in our signed Atwood number notation, namely,
 $A>0,~g>0$
for bubbles and
 $A<0,~g<0$
for spikes, we have
 $c_{bb}=c(t,|A|,|g|)$
and
 $c_{sp}=c(t,-|A|,-|g|)$
. Therefore, the value of
 $c_{bb}$
is different from that of
 $c_{sp}$
in a system with a given density ratio. The velocity potential in phase 2 is approximated in a similar way. Therefore, we write the velocity potentials in the following form:
 $$\begin{eqnarray}{\it\phi}_{i}(t,x,z)=a_{i}(t)\cos (kx)\text{e}^{(-1)^{i}kz}+b_{i}(t)\cos (c(t)kx)\text{e}^{(-1)^{i}c(t)kz},\quad i=1,2.\end{eqnarray}$$
We comment that
 $a_{i}(t)$
,
 $b_{i}(t)$
,
 $c(t)$
,
 $z_{0}(t)$
and
 ${\it\xi}(t)$
are also functions of
 $A$
and
 $g$
. For conciseness, we do not display them explicitly.
By substituting expression (3.4) into (3.2) and expanding the resulting equations through the order of
 $x^{2}$
, we obtain:
 $$\begin{eqnarray}\frac{\text{d}z_{0}}{\text{d}t}+(-1)^{i}k(a_{i}\,\text{e}^{(-1)^{i}kz_{0}}+b_{i}\,c\,\text{e}^{(-1)^{i}c\,kz_{0}})=0,\end{eqnarray}$$
 $$\begin{eqnarray}\displaystyle & & \displaystyle 2\,\frac{\text{d}{\it\xi}}{\text{d}t}+6k^{2}{\it\xi}\,(a_{i}\,\text{e}^{(-1)^{i}kz_{0}}+b_{i}\,c^{2}\,\text{e}^{(-1)^{i}c\,kz_{0}})\nonumber\\ \displaystyle & & \displaystyle \quad -\,(-1)^{i}k^{2}(a_{i}\,\text{e}^{(-1)^{i}kz_{0}}+b_{i}\,c^{3}\,\text{e}^{(-1)^{i}c\,kz_{0}})=0,\quad i=1,2.\end{eqnarray}$$
One can solve for
 $a_{i}$
and
 $b_{i}$
explicitly from (3.5) and (3.6). After substituting the resulting expressions into (3.3), one can obtain an ordinary differential equation for the term proportional to
 $x^{2}$
:
 $$\begin{eqnarray}\displaystyle & & \displaystyle F_{1}\left[16\left(\frac{\text{d}{\it\xi}}{\text{d}t}\right)^{2}-10ckv\frac{\text{d}{\it\xi}}{\text{d}t}+c^{2}k^{2}v^{2}\right]+2F_{2}\frac{\text{d}{\it\xi}}{\text{d}t}\frac{\text{d}c}{\text{d}t}\nonumber\\ \displaystyle & & \displaystyle \quad +\,F_{3}kv\frac{\text{d}c}{\text{d}t}+F_{4}\left(2F_{4}kAg{\it\xi}-2F_{5}\frac{\text{d}^{2}{\it\xi}}{\text{d}t^{2}}+F_{6}k\frac{\text{d}v}{\text{d}t}\right)=0.\end{eqnarray}$$
Here
 $v=\text{d}z_{0}/\text{d}t$
is the velocity of the finger tip, and
 $$\begin{eqnarray}\displaystyle F_{1} & = & \displaystyle A(c+1)^{2}-12\,{\it\xi}(c+1)+36A\,{\it\xi}^{2},\end{eqnarray}$$
 $$\begin{eqnarray}\displaystyle F_{2} & = & \displaystyle (c+1)^{2}-12\,A{\it\xi}(c+1)+36\,{\it\xi}^{2},\end{eqnarray}$$
 $$\begin{eqnarray}\displaystyle F_{3} & = & \displaystyle (c+1)^{2}+6A\,{\it\xi}(c^{2}-1)-36\,{\it\xi}^{2}(2c+1)+216A\,{\it\xi}^{3},\end{eqnarray}$$
 $$\begin{eqnarray}\displaystyle F_{4} & = & \displaystyle (c+1)^{2}-36\,{\it\xi}^{2},\end{eqnarray}$$
 $$\begin{eqnarray}\displaystyle F_{5} & = & \displaystyle c+1-6A\,{\it\xi},\end{eqnarray}$$
 $$\begin{eqnarray}\displaystyle F_{6} & = & \displaystyle c^{2}+c+2A\,{\it\xi}(c^{2}-c+1)-72A\,{\it\xi}^{3}.\end{eqnarray}$$
The results from numerical simulations (Tryggvason Reference Tryggvason1988; Sohn Reference Sohn2004) and from theoretical analysis (Alon et al.
Reference Alon, Hecht, Ofer and Shvarts1995; Goncharov Reference Goncharov2002) showed that, in the quasi-steady state, spikes have approximately constant velocities in RT instability with finite density ratios. Only in an infinite density ratio system, i.e.
 $A=-1$
, does the spike approach free fall asymptotically. Therefore, we will consider the fingers with
 $A\in (-1,1]$
in our analysis. If a theoretical model is consistent, one would expect that its solution should have the property that, as
 $A\rightarrow -1$
, it approaches the behaviour of spikes in an infinite density ratio system. As we will see later, our solution indeed has this important consistency property.
We now examine the velocity of the finger in the quasi-steady stage. It has been shown that both the velocity and the curvature of the finger tip are insensitive to time in this stage (Glimm et al.
Reference Glimm, Li and Lin2002; Sohn Reference Sohn2004), namely,
 $\text{d}v/\text{d}t=0$
,
 $\text{d}{\it\xi}/\text{d}t=0$
and
 $\text{d}c/\text{d}t=0$
. From this property, we obtain an equation from (3.7) for RT instability in the quasi-steady stage:
 $$\begin{eqnarray}v_{qs}^{2}=-\frac{2Ag{\it\xi}_{qs}\,(c_{qs}+1+6\,{\it\xi}_{qs})^{2}(c_{qs}+1-6\,{\it\xi}_{qs})^{2}}{kc_{qs}^{2}[(36{\it\xi}_{qs}^{2}+(c_{qs}+1)^{2})(1+A)-(c_{qs}+1+6\,{\it\xi}_{qs})^{2}]},\end{eqnarray}$$
where the constants
 $v_{qs}$
and
 ${\it\xi}_{qs}$
stand for the quasi-steady velocity and the quasi-steady curvature, respectively. The right-hand side of (3.14) must be non-negative for all values of
 $A$
. In this equation,
 $A$
and
 $g$
share the same sign, and
 ${\it\xi}_{qs}$
is always non-positive. Therefore, to maintain a non-negative
 $v_{qs}^{2}$
it is required that
 $$\begin{eqnarray}(36{\it\xi}_{qs}^{2}+(c_{qs}+1)^{2})(1+A)-(c_{qs}+1+6\,{\it\xi}_{qs})^{2}\geqslant 0,\quad \text{for all}~A\in (-1,1],\end{eqnarray}$$
which is equivalent to
 $$\begin{eqnarray}A\,(36+q^{2})-12q\geqslant 0,\quad \text{for all}~A\in (-1,1],\end{eqnarray}$$
where
 $q=(c_{qs}+1)/{\it\xi}_{qs}$
. In the case of spikes, i.e. when
 $A<0$
, the solution of (3.16) is
 $$\begin{eqnarray}\frac{6}{A}(1+\sqrt{1-A^{2}})\leqslant q\leqslant \frac{6}{A}(1-\sqrt{1-A^{2}}).\end{eqnarray}$$
In particular, (3.17) must hold in the neighbourhood of
 $A=-1$
, which gives
 $$\begin{eqnarray}q=-6+o(1),\end{eqnarray}$$
namely,
 $c_{qs}/{\it\xi}_{qs}=-6-1/{\it\xi}_{qs}+o(1)=-6+o(1)$
, since
 $1/{\it\xi}_{qs}=o(1)$
by property (2) at the end of § 2. Therefore, we obtain
 $c_{qs}=-6\,{\it\xi}_{qs}(1+o(1))$
in the neighbourhood of
 $A=-1$
. To the leading-order approximation, we will approximate
 $c_{qs}$
by
 $-6{\it\xi}_{qs}$
. We now determine the behaviour of
 ${\it\xi}_{qs}$
near
 $A=-1$
. After approximating
 $c_{qs}$
by
 $-6{\it\xi}_{qs}$
, a condition for
 ${\it\xi}_{qs}$
can be deduced from (3.15):
 $$\begin{eqnarray}72{\it\zeta}^{2}-12{\it\zeta}\sqrt{1+A}+(1+A)\geqslant 1,\end{eqnarray}$$
where
 ${\it\zeta}={\it\xi}_{qs}\,\sqrt{1+A}$
. In the neighbourhood of
 $A=-1$
, the left-hand side of (3.19) will be determined by the leading term:
 $$\begin{eqnarray}72{\it\zeta}^{2}\geqslant 1.\end{eqnarray}$$
The equality in (3.19) holds for the case in which the expression inside the square bracket in the denominator of (3.14) tends to zero. This corresponds to the largest growth rate for the spike near
 $A=-1$
. Therefore, to obtain the most unstable growth rate, we require
 $72{\it\zeta}^{2}=1$
, i.e.
 $$\begin{eqnarray}{\it\xi}_{qs}=-\frac{\sqrt{2}}{12\sqrt{(1+A)}},\quad \text{as}~A\rightarrow -1.\end{eqnarray}$$
Equation (3.21) suggests that
 ${\it\xi}_{qs}(A)$
should have a Laurent series in terms of
 $\sqrt{1+A}$
, and we will keep only the three leading terms, namely,
 $$\begin{eqnarray}{\it\xi}_{qs}(A)=-\frac{\sqrt{2}}{12}(1+A)^{-1/2}+d_{0}+d_{1}(1+A)^{1/2}.\end{eqnarray}$$
Property (1) of § 2 requires, when
 $A=1$
, that
 ${\it\xi}_{qs}(1)=-1/6$
, which means
 $$\begin{eqnarray}-{\textstyle \frac{1}{12}}+d_{0}+\sqrt{2}d_{1}=-{\textstyle \frac{1}{6}}.\end{eqnarray}$$
To capture property (3), we take
 $(\text{d}{\it\xi}_{qs}/\text{d}A)|_{A=1}=0$
, which provides another equation:
 $$\begin{eqnarray}\frac{1}{48}+\frac{\sqrt{2}}{4}d_{1}=0.\end{eqnarray}$$
Equations (3.23) and (3.24) give
 $d_{0}=0$
and
 $d_{1}=-1/(12\sqrt{2})$
. Thus, we obtain the quasi-steady curvature
 $$\begin{eqnarray}{\it\xi}_{qs}(A)=-\frac{1}{12}\left(\sqrt{\frac{2}{1+A}}+\sqrt{\frac{1+A}{2}}\right)=-\frac{3+A}{12\sqrt{2(1+A)}}\end{eqnarray}$$
from (3.22), and the quasi-steady velocity
 $$\begin{eqnarray}v_{qs}(A)=\left(\frac{Ag}{3k}\frac{8}{(1+A)(3+A)}\frac{[3+A+\sqrt{2}\,(1+A)^{1/2}]^{2}}{[4(3+A)+\sqrt{2}\,(9+A)(1+A)^{1/2}]}\right)^{1/2}\end{eqnarray}$$
from (3.14) for RT instability. We comment that the result given by (3.26) is valid for both spikes (
 $A<0,~g<0$
) and bubbles (
 $A>0,~g>0$
).
As given by (3.26)
 $v_{qs}$
is the velocity at the quasi-steady stage. The leading-order contribution at early times is just the initial condition
 $v_{0}$
. It is desirable to have an asymptotic matched solution for both early and quasi-steady stages. To achieve this, we approximate
 ${\it\xi}(t)$
by
 ${\it\xi}_{qs}$
and
 $c(t)$
by
 $-6{\it\xi}_{qs}$
. This is motivated by the analytical results for
 $A=1$
(Mikaelian Reference Mikaelian1998; Zhang Reference Zhang1998). Equations (4) and (7) in Zhang (Reference Zhang1998) show that
 ${\it\xi}(t)$
approaches its asymptotic value much faster than
 $v(t)$
does:
 ${\it\xi}(t)$
approaches its asymptotic value at the rate of
 $\text{e}^{-3kz_{0}}$
;
 $v(t)$
approaches its asymptotic value at the rate of
 $\text{e}^{-[3kz_{0}-\text{ln}(kz_{0})]/2}$
, which is much slower than
 $\text{e}^{-3kz_{0}}$
. Therefore, it is reasonable to approximate
 ${\it\xi}(t)$
as a constant. Since, in our analysis, the asymptotic value of
 $c(t)$
is related to that of
 ${\it\xi}(t)$
, it is reasonable to approximate
 $c(t)$
as a constant as well. Under these approximations, (3.7) becomes
 $$\begin{eqnarray}\frac{\text{d}v}{\text{d}t}=-{\it\alpha}k(v^{2}-v_{qs}^{2}),\end{eqnarray}$$
where
 $$\begin{eqnarray}{\it\alpha}=\frac{3}{4}\,\frac{(1+A)(3+A)}{[3+A+\sqrt{2}(1+A)^{1/2}]}\frac{[4(3+A)+\sqrt{2}\,(9+A)(1+A)^{1/2}]}{[(3+A)^{2}+2\sqrt{2}\,(3-A)(1+A)^{1/2}]},\end{eqnarray}$$
which is a function of the Atwood number
 $A$
. Therefore, a matched solution for
 $v$
can be obtained by integrating (3.27) from 0 to
 $t$
.
4. Universality of fingers at all density ratios
For RM instability, we take the limit
 $g\rightarrow 0$
in (3.27) and obtain
 $$\begin{eqnarray}\frac{\text{d}v}{\text{d}t}=-{\it\alpha}kv^{2},\end{eqnarray}$$
and the matched solution is
 $$\begin{eqnarray}v=\frac{v_{0}}{1+{\it\alpha}kv_{0}t},\end{eqnarray}$$
where
 $v_{0}$
denotes the initial velocity. When
 $A=1$
, the expression given by (4.2) recovers the results shown by Mikaelian (Reference Mikaelian1998) and Buttler et al. (Reference Buttler, Oró, Preston, Mikaelian, Cherne, Hixson, Mariam, Morris, Stone, Terrones and Tupa2012).
If we introduce the scaled dimensionless variables
 $$\begin{eqnarray}u_{RM}=\frac{v}{v_{0}},\quad {\it\tau}_{RM}={\it\alpha}kv_{0}t,\end{eqnarray}$$
then (4.2) can be written as
 $$\begin{eqnarray}u_{RM}=\frac{1}{1+{\it\tau}_{RM}}.\end{eqnarray}$$
Comparison between universality curve given by (4.4) and scaled data from figure 2 for RM instability at different Atwood numbers. The solid curves are the scaled spike velocities, and the dashed curves are the scaled bubble velocities. Red curve: universality model prediction. Blue curves: vortex model results from Sohn (Reference Sohn2004) with
 $a_{0}=0.5$
cm
 $v_{0}=0.8$
cm ms
 $^{-1}$
and
 $A=0,\pm 0.3,\pm 0.7,1$
. Black curve and green curve:
 $a_{0}=0$
and
 $v_{0}=0.5$
cm ms
 $^{-1}$
, with
 $A=1$
. The black curve (labelled as c.m.) is the conformal mapping result from Menikoff & Zemach (Reference Menikoff and Zemach1983), and the green curve is the vortex model result from Sohn (Reference Sohn2004).

It is completely unexpected that, despite the different behaviours among fingers with various Atwood numbers, and even the qualitative distinctions between spikes and bubbles, the growth rates of all finger tips, up through the quasi-steady stage, can be approximately described by a single equation in terms of the appropriately scaled dimensionless variables given by (4.3). This equation is independent of finger types and of the Atwood number. This means that, in terms of scaled variables, the dominant behaviours of the growth rates of all fingers (both spikes and bubbles) at all Atwood numbers follow a universal curve for systems governed by (3.1)–(3.3). Furthermore, the result of the bubble growth rate at any specific Atwood number can be used to predict (through scaling) not only the bubble growth rates at other Atwood numbers, but also the spike growth rates at all Atwood numbers. Similarly, one can also use the result of a spike to do such predictions. This implies that, to study the growth rates for both finger types and for all Atwood numbers, one only needs to study the behaviour of one finger at any Atwood number. This is particularly important and useful for numerical simulations and experiments, since it is highly time-consuming and also possibly expensive to perform studies for multiple Atwood numbers up through the nonlinear stage.
To verify our prediction on universality, we apply (4.3) to scale all the results from numerical simulations shown in figures 2–4, and compare the scaled results with our prediction given by (4.4). The comparison results are presented in figures 6–8. All results from three sets of data show that the scaled data are in good agreement with our universality curve. The scaled results also show that, in terms of scaled time, longer simulations are needed for spikes with large Atwood numbers to reach the quasi-steady stage. This may not be obvious in the original unscaled data.
The scaling technique can also be applied to RT instability. By expressing (3.27) in terms of the scaled dimensionless variables
 $$\begin{eqnarray}u_{RT}=\frac{v}{v_{qs}}\quad \text{and}\quad {\it\tau}_{RT}={\it\alpha}kv_{qs}t,\end{eqnarray}$$
we obtain a universal curve for the scaled velocity in RT instability:
 $$\begin{eqnarray}u_{RT}=\frac{1-r\,\text{e}^{-2{\it\tau}_{RT}}}{1+r\,\text{e}^{-2{\it\tau}_{RT}}},\end{eqnarray}$$
where
 $r=[1-u_{RT}(0)]/[1+u_{RT}(0)]$
.
Comparison between universality curve given by (4.4) and scaled data from figure 3 for RM instability at different Atwood numbers. The solid curves are the scaled spike velocities, and the dashed curves are the scaled bubble velocities. Red curve: universality model prediction. Blue curves: numerical results (FLASH) from Dimonte & Ramaprabhu (Reference Dimonte and Ramaprabhu2010), with
 $a_{0}k=0.125$
and
 $A=\pm 0.25,\pm 0.5,\pm 0.75,\pm 0.88,\pm 0.94,\pm 0.98$
.

Comparison between universality curve given by (4.4) and scaled data from figure 4 for RM instability at different Atwood numbers. The solid curves are the scaled spike velocities, and the dashed curves are the scaled bubble velocities. Red curve: universality model prediction. Blue curves: numerical results (LEEOR2D) from Alon et al. (Reference Alon, Hecht, Ofer and Shvarts1995), with
 $v_{0}=1$
cm ms
 $^{-1}$
,
 ${\it\lambda}=1$
cm and
 $A=\pm 0.2,\pm 0.5,\pm 0.9$
.

Comparison between universality curve given by (4.6) and scaled data from figure 5 for RT instability at different Atwood numbers. The solid curves are the scaled spike velocities, and the dashed curves are the scaled bubble velocities. Red curve: universality model prediction. Blue curves: vortex model results from Sohn (Reference Sohn2004), with
 $a_{0}k=0.5$
,
 $v_{0}=0$
and
 $A=\pm 0.05,\pm 0.3,\pm 0.7,1$
. Black curve (labelled as c.m.): conformal mapping result from Menikoff & Zemach (Reference Menikoff and Zemach1983), with the same initial conditions and
 $A=1$
.

Figure 9, the scaled version of figure 5, also shows the similarity and the universality between the growth rate of spikes and that of bubbles at different Atwood numbers for RT instability. Despite the different developments in the early stage, the scaled physical quantities for all fingers are gradually approaching the same universality curve. The agreement between the theoretical prediction and the scaled numerical data for RT instability shown in figure 9 is not as good as those for RM instability shown in figures 6–8. This is due to several reasons. (1) The fingers in RT instability are driven by gravity, and therefore are more unstable than those in RM instability. Thus, it is much harder to carry out the simulations for RT instability to the asymptotic regime. They need a larger computational domain and longer computing time. Owing to these difficulties, in terms of scaled time, the numerical simulations for RT instability were actually terminated earlier than those for RM instability. (2) Since in terms of scaled time the simulations for RT instability are shorter than those for RM instability, they contain more transient effects, which are not included in our model. (3) In the numerical simulations presented by Sohn (Reference Sohn2004), a numerical desingularization parameter is introduced to avoid singularities in computation, which reduces the growth rates. Therefore, the numerical data are consistently below our theoretical prediction. For the same reason, the numerical results shown in figure 6 are also slightly lower than our theoretical prediction. In particular, figure 9 shows that the simulation for the spike at
 $A=-0.7$
ends too soon and has not approached the quasi-steady stage yet. Therefore, we call for further numerical studies of RT instability in late times, especially for spikes with large Atwood numbers.
5. Discussion
Our derivation is based on
 $A\in (-1,1]$
. However, one would expect that a consistent theoretical model should have the property that in the limit
 $A\rightarrow -1$
the solution of the model approaches the known behaviour for
 $A=-1$
, namely, it should recover the behaviour of spikes in an infinite density ratio system. We now examine this limit. In the limit
 $A\rightarrow -1$
,
 ${\it\alpha}$
given by (3.28) tends to 0. Consequently, the scaled times
 ${\it\tau}_{RM}$
and
 ${\it\tau}_{RT}$
given by (4.3) and (4.5) tend to 0 as well. This shows that, for both RM and RT instabilities, the asymptotic behaviour of spikes in an infinite density ratio system corresponds to the point
 ${\it\tau}=0$
on our universality curve. For RM instability, since
 ${\it\tau}_{RM}\rightarrow 0$
, (4.4) becomes
 $u_{RM}=1$
, namely,
 $v=v_{\infty }=v_{0}$
. This agrees with the prediction of
 $v_{\infty }=v_{0}[(6{\it\xi}_{0}+3)/(6{\it\xi}_{0}+1)]^{1/2}$
given by Zhang (Reference Zhang1998), since in our analysis
 ${\it\xi}_{0}={\it\xi}_{\infty }=\infty$
. For RT instability, by taking the limit
 $A\rightarrow -1$
in (3.27), we obtain
 $\text{d}u_{RT}/\text{d}{\it\tau}=1$
, namely,
 $\text{d}v/\text{d}t=\text{d}v/\text{d}t|_{t=\infty }=|g|$
in terms of unscaled variables. This expression also agrees with the prediction given by Zhang (Reference Zhang1998), and recovers the free-fall behaviour of RT spikes in an infinite density ratio system. This shows that our derivation based on
 $A\in (-1,1]$
indeed recovers the known results for
 $A=-1$
. Therefore, our theory is for all density ratios.
For an initial interface randomly perturbed by many different modes, a turbulent mixing zone forms at late times. It has been shown that the size of the turbulent mixing zone has certain important scaling behaviour at late times (Alon et al. Reference Alon, Hecht, Ofer and Shvarts1995; Dimonte & Schneider Reference Dimonte and Schneider2000; Poujade & Peybernes Reference Poujade and Peybernes2010; Thornber et al. Reference Thornber, Drikakis, Youngs and Williams2010; Tritschler et al. Reference Tritschler, Olson, Lele, Hickel, Hu and Adams2014). It is known that the dynamics of a mixing zone is governed by the growth of each individual mode and by the interaction between adjacent bubbles. In this paper the universal scaling behaviour for single-mode RT and RM instabilities is shown. If one can further establish a scaling behaviour for bubble interaction, then potentially one could provide a better understanding of the scaling behaviour of turbulent mixing zones.
Acknowledgement
The work of Q.Z. was supported by the Research Grants Council of the Hong Kong Special Administrative Region, China (project CityU 11303714).



