I. INTRODUCTION
Composite materials such as carbon fiber reinforced polymer (CFRP) composites made by laminating unidirectionally reinforced plies are extensively used in civil and aircraft structures due to their high specific strength and stiffness, superior corrosion resistance and improved fatigue resistance compared to conventional engineering materials such as aluminum and steel. Reference Cantwell and Morton1–Reference Poe, Dexter and Raju3 However, such materials are susceptible to interply delamination, Reference Prichard and Hogg4,Reference Dransfield, Baillie and Mai5 which traditionally has limited their use in situations, where impact loading can occur. Nevertheless, lightweighting programs for transportation structures are driving renewed interest in composite materials for impact protection systems. For example, military vehicles are required to resist projectile impacts while in civilian aircraft applications the engines and airframes must be able to resist impacts from hail, bird strikes and impact by other foreign objects. In most cases, the structure needs to be able to retain its structural integrity after impact loading, which presents a serious challenge for traditional laminated composites.
Impact loads induce a range of damage modes in composites that seriously degrade their mechanical performance. These damage modes include matrix cracks, delamination between plies and fiber fracture. Delamination under impact loading is a particularly critical damage mode as it results in a significant reduction in the mechanical performance of the composite in spite of the fact that the fibers remain intact. A number of approaches have been proposed to tailor the fiber/tow architectures to enhance the delamination resistance. These include Z-pinning, Reference Freitas, Magee, Dardzinski and Fusco6,Reference Mouritz7 stitching Reference George, Deshpande and Wadley8,Reference Malcom, Aronson, Deshpande and Wadley9 and knitting Reference Kamiya, Cheeseman, Popper and Chou10 but these methods have had only marginal success as the reinforcements are unable to withstand the large out-of-plane stresses that are generated under impact loading. More recently, a range of methods have been developed to manufacture three-dimensional (3D) fiber preforms wherein tows are present in at-least three orthogonal directions; see Khokar Reference Khokar11 for a detailed review of these techniques. These 3D fiber preforms can be broadly classified into three categories: (i) 2D woven 3D fabrics produced by usual 2D weaving methods with mono-directional shedding; (ii) 3D woven 3D fabrics produced by a dual-direction shedding system; and (iii) nonwoven 3D fabrics without interlacing or interweaving produced by a technique known as “noobing” that is described in Sec. II. This emerging ability to independently manipulate the volume fractions of fiber in three directions not only allows tailoring of the multi-axial properties of composites Reference Quinn, McIlhagger and McIlhagger12 but it also greatly reduces their susceptibility to delamination, and improves the impact resistance of CFRPs. Reference McIlhagger, Quinn, McIlhagger, Wilson, Simpson and Wenger13–Reference Tan, Tong, Steven and Ishikawa15 However, a key drawback of 3D composites compared to laminated counterparts is their reduced elastic modulus due to significant fiber waviness. This waviness also reduces compressive strength. For example, Kuo and Ko Reference Kuo and Ko16 modified a conventional weaving machine to produce 3D composites with orthogonal non-woven yarns. Although the composite showed high ductility in compression, the inherent fiber waviness resulting from their modified weaving process, significantly reduced the compressive strength.
Impacts by hail particles or bird strikes against aircraft structures are typically categorised as relatively low velocity impacts. Nevertheless, visualisation of their damage modes is hindered by the difficulty of observing internal failure modes via methods like in situ X-ray tomography (XCT) during impact events. Even interrupting the test to characterize damage modes can change the deformation/failure modes. Thus, damage visualisation in low-velocity impact tests is typically restricted to post-mortem inspections. However, since stress waves travel and reflect multiple times from the edges of a target during the time over which the projectile is in contact with the target, Reference Abisset, Daghia, Sun, Wisnom and Hallett17,Reference Swanson18 low velocity impacts can be well approximated to be quasi-static. Hence, quasi-static indentation tests are often used to develop an initial understanding of the low velocity impact response of composites Reference Wagih, Maimi, Gonzalez, Blanco, de Aja, de la Escalera, Olsson and Alvarez19 and a number of studies Reference Kwon and Sankar20,Reference Bouvet, Rivallant and Barrau21 have demonstrated the equivalence between low velocity impact and quasi-static indentation tests.
This study reports the quasi-static indentation response of a 3D non-woven carbon fiber/epoxy composites manufactured by the noobing process. The uniaxial compressive response of this composite was recently studied by Das et al. Reference Das, Kandan, Kazemahvazi, Wadley and Deshpande22 and here we extend the understanding of the mechanical properties of this composite by investigating the indentation response. Both measurements and finite element simulations are reported and the indentation mechanisms of this 3D composite are contrasted with those of traditional cross-ply laminates to assess the suitability of 3D noobed composites for impact protection applications.
II. MATERIALS AND MANUFACTURE
The study primarily focuses on 3D noobed Footnote a composites in which three linear sets of orthogonal yarns are bound/tied together to produce a layerless 3D fabric. To put the behavior of such noobed composites in context, we also report the equivalent responses of a two-dimensional (2D) cross-ply composite. The details of these two materials including their manufacture are described in this section.
A. Manufacture and structure of the noobed composites
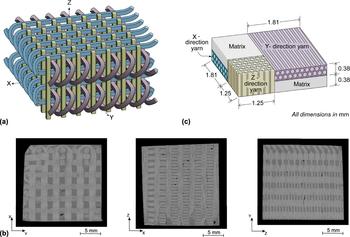
Dry 3D fabrics were produced in block form using the noobing method developed by Khokar Reference Khokar24 where readers can find details of the device used for its automated manufacture. With (X, Y, Z) forming a Cartesian co-ordinate system, the composite comprises an array of Z-yarns bound together by X and Y-yarns that traverse the rows and columns of the grid formed by the Z-yarns. These yarns loop as shown in Fig. 1(a) and externally bind the preform together [for clarity we do not show the looping of the Z yarns in Fig. 1(a)]. This preform is therefore produced by a process that does not involve shedding as in a weaving process and results in structure consisting of three orthogonal non-interlaced X, Y, and Z-yarns. Infusion of a polymer matrix was performed via a resin transfer molding process (RTM) to produce the 3D composite material.
(a) Sketch of the orthogonal non-woven yarns in the 3D noobed fabric that is infused with a polymer matrix to give the composite. (b) X-ray tomographic (XCT) scans of the 3D noobed composite showing sections on three orthogonal planes. The (X, Y, Z) co-ordinate system is indicated in (a). (c) Sketch of the unit cell of the 3D noobed composite used in this study. The unit cell is inferred from the XCT images in (b).

The 3D noobed composites made for this study used Toray T700S 12k (Toray CFA Inc., Santa Ana, California) carbon fiber tows (non-twisted carbon fiber yarns are usually referred to as tows) in a NM FW3070 epoxy matrix. Footnote b The carbon fibers were approximately d = 7.2 μm in diameter and the 3D composite was anisotropic with 20% of the total number of tows in the Z-direction and 40% each in the X and Y-directions. Blocks of the 3D noobed composites of size 175(X) mm × 103(Y) mm × 45(Z) mm were manufactured and specimens of required dimensions were cut from these blocks using a diamond band saw. X-ray computed tomography (XCT) images of the interior of the specimens on three orthogonal planes are included in Fig. 1(b). These images clearly show that while the Z-direction tows have an approximately square cross-section the X and Y-direction tows are flattened in the Z-direction during the RTM process. Moreover, due to the orthogonal arrangement of the tows, pockets of pure matrix (in addition to the matrix that exists between fibers within each tow) are regularly interspersed in the composite. The periodic unit cell as inferred from these XCT images is sketched in Fig. 1(c) (an average unit cell based on measurements at 30 different locations in the XCT images) and includes all the relevant dimensions of the tows and matrix pockets.
The composite comprises four principal phases: the X, Y, and Z-direction tows and the matrix pockets. Based on the unit cell with dimensions sketched in Fig. 1(c), the X and Y-direction tows comprise a volume fraction v X = v Y ≈ 29% of the composite while the Z-direction tows occupy a volume fraction v Z ≈ 17% of the composite. The remainder v M = 25% of the volume is occupied by the matrix pockets. To specify the overall carbon fiber volume fraction within the composite, recall that each tow comprises 12k fibers of diameter 7.2 μm. Based on the tow cross-sectional areas from Fig. 1(c) the fiber volume fractions in the X and Y-direction tows are f X = f Y ≈ 68% while the Z-direction tow comprises f Z ≈ 30% fibers. The overall fiber volume fraction in the composite then follows as f = 2v X f X + v Z f Z ≈ 45%.
B. The cross-ply 2D composite
The performance of the 3D noobed composite was compared with a standard laminated (2D) carbon fiber composite with constituent properties as close to those of the 3D noobed composite as possible. A cross-ply composite comprising 66% by volume IM7 fibers in a Hexply 8552 matrix was manufactured from prepregs supplied by Hexcel composites (ply thickness 125 μm; Duxford, United Kingdom). Unlike the 3D noobed composite, 45 mm thick laminated composites typically are not manufactured from prepregs but to mimic the 3D composite as closely as possible, we constructed a 25 mm thick composite sheet with lay-up (0/90)100. The mechanical properties of this standard laminate are well established; see for example the Hexcel datasheet 25 and Russell et al. Reference Russell, Liu, Fleck and Deshpande26 We use a Cartesian co-ordinate system for the laminated system such that the Z-direction is perpendicular to the plane of the plies and the X and Y-directions are aligned with the fiber directions in the cross-ply composite.
III. EXPERIMENTAL PROTOCOL AND MEASUREMENTS
The aims of the experimental study are (i) to measure the indentation response of the 3D noobed composites; (ii) investigate the deformation/failure mechanisms; and (iii) contrast the performance of the 3D composite with cross-ply laminated composite. We first describe the measurement protocols and then proceed to discuss the observations.
A. Measurement protocol
Back-supported indentation of the noobed composites in the X and Z-directions was carried out on cuboidal specimens of dimension ∼45 mm × 45 mm × 20 mm (the blocks were 20 mm in the X and Z-directions for indentations carried out in those respective directions). Since the Y-direction is indentical to the X-direction, results in only one of these directions are presented. The specimens were cut from the infused noobed composite blocks first with a diamond band-saw and then milled to the final dimensions to ensure parallel sides. Indentation was carried out in a screw-driven test machine using a hardened steel, flat-bottomed circular indenter of diameter D = 8 mm. The indenter diameter was chosen so that at-least two Z-direction tows were aligned along the diameter of the indenter for indentation in the Z-direction (since the cross section of the X-direction tows is smaller, at-least nine X-direction tows lay along this indenter diameter for indentation in the X-direction). The indentation was performed at the center of the 45 × 45 mm cross-sectional area of the specimen with the indentation load P measured from the load cell of the test machine and the indentation displacement δ measured via a laser extensometer. The indentation response is quantified in terms of the indentation stress σI ≡ P/A versus the measure of indentation strain,
Reference Sargent and Ashby27
 ${\varepsilon _{\rm{I}}} \equiv \delta {\rm{/}}\sqrt A$
where A = πD
2/4 is the cross-sectional area of the indenter. All indentations were carried out at an applied displacement rate
 $\dot{\delta } = 0.2\;{\rm{mm/min}}$
.
The indentation tests were periodically interrupted to enable XCT visualisation of the deformation/damage evolution under the indenter. At high indentation displacements, the indenter was embedded in the specimen and could not be removed without causing additional damage. In these cases, the XCT was performed with the steel indenter still within the specimen and this resulted in relatively poor quality XCT images. In addition to these XCT images, high resolution optical imaging of the interior of the specimens immediately under the indenter was also conducted at the end of the indentation experiment. The optical imaging involved polishing of the specimen to expose the specimen interior as follows. The unloaded specimen was polished with SiC abrasive paper first using a coarse-grit (P220–P400; Metprep Ltd., Coventry, United Kingdom) until approximately the mid-section of the specimen was exposed. Then, another 1 mm or so of the specimen was further abraded using a fine-grit (P800–P4000; Metprep Ltd., Coventry, United Kingdom) paper to obtain a clean and smooth surface for imaging. To maximise the resolution of the images while still imaging a large enough area to clearly expose the deformation/failure modes, the imaged area was divided into a grid comprising approximately 200 squares. Each of these squares was imaged separately and the entire imaged section was then reconstructed by stitching together these sub-images.
Indentation for the cross-ply composites in the Z-direction was conducted using the same protocol. However, recall that cross-ply composite plates were only 25 mm thick in the Z-direction. Thus, indentation in the X-direction was carried out using a half-scale geometrically similar setup compared to all the other tests, i.e., the specimen and indenter dimensions as well as the indentation rate were decreased by a factor of two. The deformation/failure of the cross-ply specimens was visualised only using XCT.
B. Indentation of the noobed composite in the Z-direction
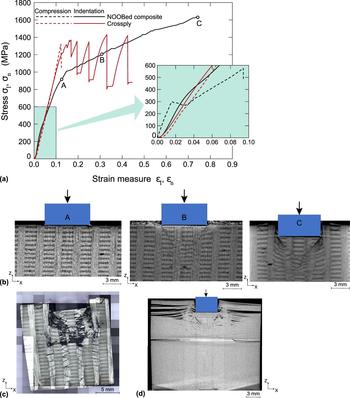
The measured σI versus εI response of the noobed composite in the Z-direction is plotted in Fig. 2(a). After an initial elastic response, the composite displays an approximately linearly hardening response. Unloading was performed from the three instants A, B, and C marked on the σI–εI curve in Fig. 2(a) [unloading followed approximately the initial elastic slope and thus the unloading curves are omitted from Fig. 2(a) for the sake of clarity]. XCT images of a section of the specimen after unloading from A, B, and C are shown in Fig. 2(b). These images are of sections lying in the diametrical plane of the indenter and show views of the X–Z plane. At the onset of nonlinearity (A) nearly no permanent deformation or failure is observed. Further along the hardening curves, shear bands orientated at approximately ±45° to the axis of loading emanate from the edge of the indenter as seen in the images B and C in Fig. 2(b). These bands are associated with shearing of the X-direction tows and kinking within the compressed Z-direction tows, although the kinking is not clearly visible within the resolution of the XCT images. The optical micrograph corresponding to the XCT image C in Fig. 2(b) is included in Fig. 2(c). Multiple and reflected kinks are now clearly visible in the Z-direction tows, and the deformation is reminiscent of that observed during uniaxial compression of the same noobed composite in the Z-direction. Reference Das, Kandan, Kazemahvazi, Wadley and Deshpande22 It is thus instructive to compare the uniaxial compression and indentation responses.
(a) The measured Z-direction indentation (σI–εI) and uniaxial compression (σn–εn) responses of the 3D noobed and cross-ply composites. The inset shows a zoom-in of the early part of the loading history. (b) XCT images of the noobed composite showing the deformation under the indenter after unloading from locations A, B, and C marked in (a). (c) An optical micrograph of the deformation under the indenter of the noobed composite after completion of loading. (d) XCT image of the deformation/failure of the cross-ply specimen after completion of the indentation loading.

The Z-direction uniaxial nominal compressive stress σn versus nominal strain εn response of the noobed composite from Das et al. Reference Das, Kandan, Kazemahvazi, Wadley and Deshpande22 is included in Fig. 2(a): the compressive ductility of the noobed composite in the Z-direction was about 10% and hence for the sake of clarity it is included in an inset that shows an enlarged view of the early part of the indentation response. We briefly summarise the compression results of Das et al. Reference Das, Kandan, Kazemahvazi, Wadley and Deshpande22 so as to enable us to contrast them with the indentation response measured here. The noobed composite has an elastic response until the onset of kinking and then displays a hardening response when further kinks (some of which zig-zag) form within the Z-direction tows. Final collapse of the composite occurs by tensile failure of the X and Y-direction tows via the indirect tension Reference Attwood, Khaderi, Karthikeyan, Fleck, O’Masta, Wadley and Deshpande28 mechanism. In comparing the indentation and uniaxial compression responses, we emphasize that while it is meaningful to compare the stress levels σI and σn, the indentation strain εI as defined by Sargent and Ashby Reference Sargent and Ashby27 is only an approximate measure of the strain under the indenter and thus may not be directly comparable to εn. Keeping this in mind we observe that the two main differences between the indentation and uniaxial compressive response are: (i) the onset of non-linearity associated with the formation of the first kink-band in the Z-direction tow occurs at a lower stress level under uniaxial compression and (ii) the specimen under uniaxial compression fails at σn ≈ 580 MPa while a continued hardening indentation response is observed even at an indentation stress σI ≈ 1600 MPa. These differences are best understood by recalling that under indentation loading the stress state under the indenter has a significant hydrostatic component that stabilises the formation of kinks and increases the stress level required for the formation of the first kink band. Subsequently, continued deformation occurs by the formation of multiple kinks within the Z-direction tow and the shear deformation of the X and Y-direction tows. The continuing build-up of hydrostatic stress results in the high hardening observed under indentation loading while the overall hydrostatic stress remains low under uniaxial compression.
C. Indentation of the noobed composite in the X-direction
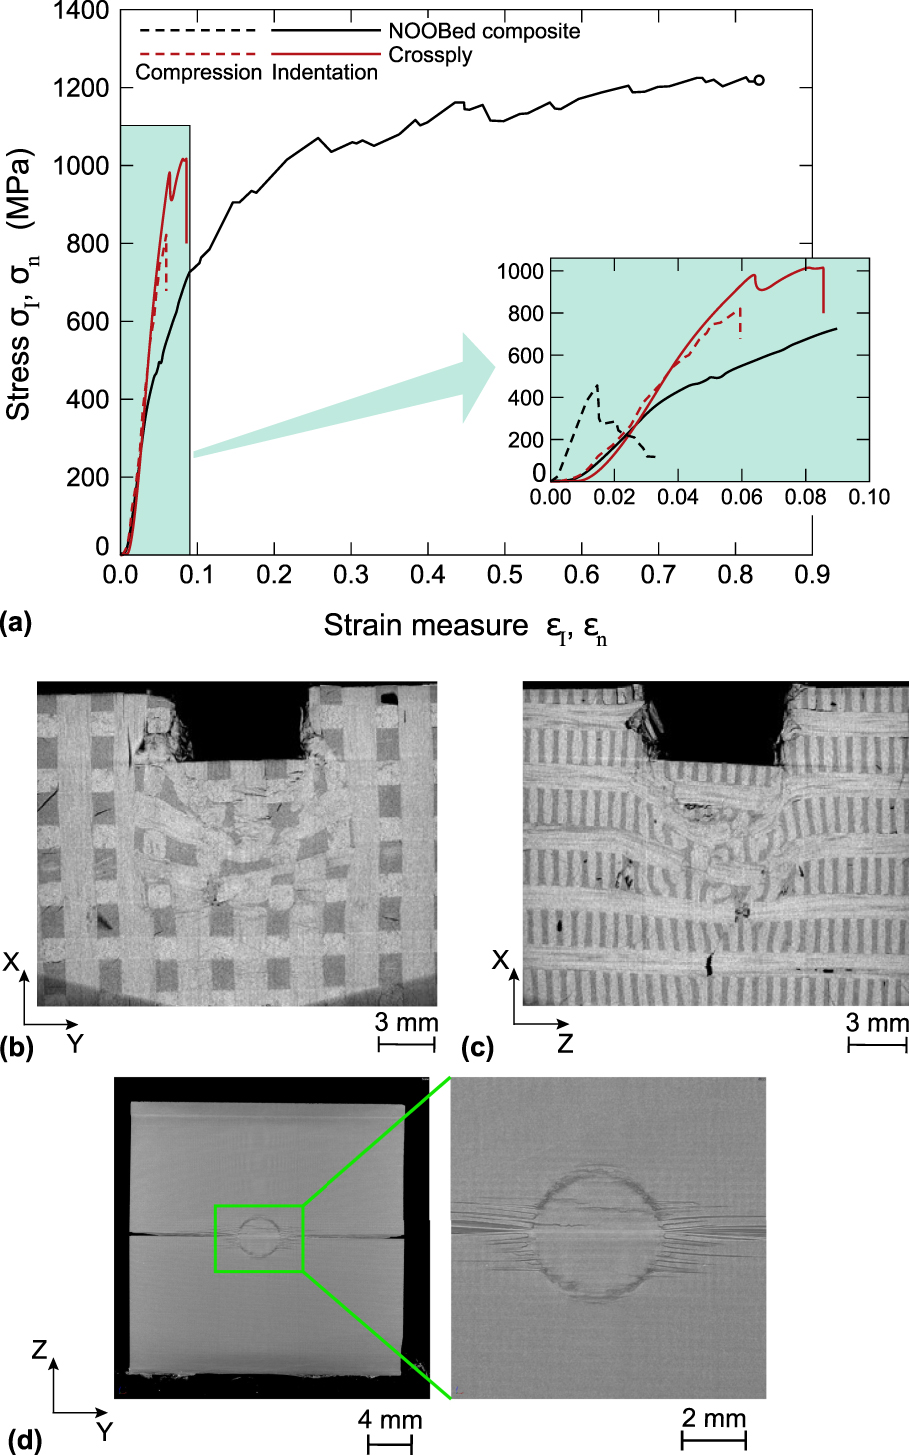
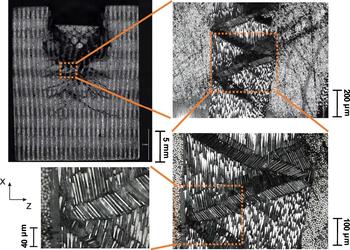
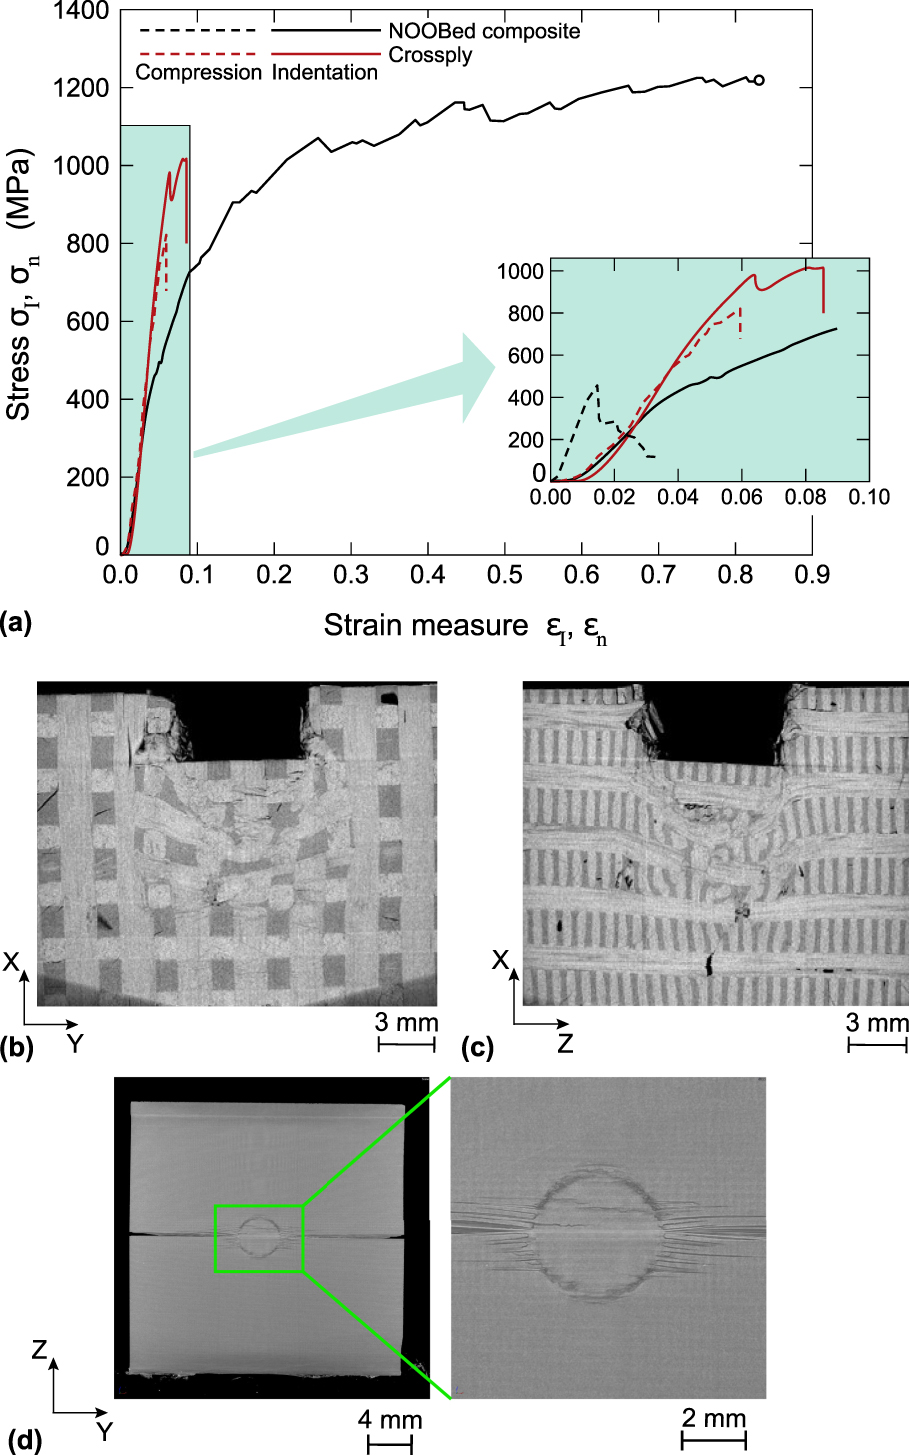
The measured σI versus εI response for indentation of the noobed composite in the X-direction is plotted in Fig. 3(a) with the corresponding uniaxial compressive response in the X-direction from Das et al. Reference Das, Kandan, Kazemahvazi, Wadley and Deshpande22 again included in the inset. Now, unlike for indentation in the Z-direction, there is negligible hardening with continued indentation occurring at a constant stress σI ≈ 1200 MPa. Further, there is no sign of loss of load carrying capacity even at εI ≈ 0.8 and this is in stark contrast with the X-direction uniaxial compression response where the noobed composite underwent catastrophic failure at σn ≈ 500 MPa with a compressive ductility of about 2%; see inset in Fig. 3(a). XCT images of the deformation immediately under the indenter after unloading from εI ≈ 0.8 are included in Figs. 3(b) and 3(c): these images show views of the X–Y and X–Z planes for sections lying in the diametrical plane of the indenter. The Z and Y-direction tows are seen to undergo large shear strains but the XCT images do not have the resolution to clearly show the deformation/failure mechanisms within the X-direction tows. Optical micrographs of the section in Fig. 3(c) are included in Fig. 4 with multiple levels of magnification that clearly illustrate the kink bands within the X-direction tows. Similar to the Z-direction tows in Fig. 2(c) we observe multiple and reflected kink-bands in the X-direction tows. Thus, while the deformation mechanisms for indentation in the X and Z-directions are similar, the reduced hardening for indentation in the X-direction is presumably due to the lower fiber volume fractions in the Z-direction tows, which makes them easier to shear. We emphasize that under indentation loading these shear bands are confined under the indenter and thus do not cause catastrophic failure.
(a) The measured X-direction indentation (σI–εI) and uniaxial compression (σn–εn) responses of the 3D noobed and cross-ply composites. The inset shows a zoom-in of the early part of the loading history. (b, c) XCT images of the noobed composite that show the deformation under the indenter after unloading from a strain level εI ≈ 0.8. (d) XCT image of the deformation/failure of the cross-ply specimen after completion of the indentation loading.
Optical micrograph of the XCT section in Fig. 3(c) for the X-direction indentation of the noobed composite. Images at varying levels of magnification are included to illustrate the kink-bands within the X-direction tows.

D. Comparison with the indentation response of cross-ply composites
Measurements of the Z-direction indentation response of the cross-ply laminates and the corresponding uniaxial compressive response are included in Fig. 2(a). Under uniaxial compression in the Z-direction, the cross-ply laminates fail by indirect tension Reference Attwood, Khaderi, Karthikeyan, Fleck, O’Masta, Wadley and Deshpande28,Reference Attwood, Russell, Wadley and Deshpande29 resulting in the elastic-brittle behavior seen in Fig. 2(a). The indentation behavior is also dominated by indirect tension with the peak indentation and uniaxial compression strength being approximately equal (i.e., there is no enhancement of the indentation strength over the uniaxial compression strength as observed in the noobed composite). However, under indentation loading there is no catastrophic failure. Rather, the failure is progressive with significant load drops associated with the failure of plies immediately under the indenter. This is followed by a more gradual increase in the load, as the indenter compressively loads the undamaged plies. Since the plies fail by the indirect tension mechanism, they recoil into the surrounding composite upon tensile failure, resulting in delamination as seen in the XCT image included in Fig. 2(d) [this image was taken at the end of the loading response shown in Fig. 2(a)]. Similar behavior has previously been reported for other cross-ply laminates including ultra high molecular weight polyethylene composites. Reference Attwood, Khaderi, Karthikeyan, Fleck, O’Masta, Wadley and Deshpande28,Reference Yu, Karthikeyan, Deshpande and Fleck30 The comparison in Fig. 2(a) indicates that the Z-direction indentation responses of the noobed and cross-ply composites are similar except that the cross-ply composite has a serrated response associated with ply failure while the noobed composite has a relatively smooth hardening curve.
While the cross-ply and noobed composites have reasonably similar Z-direction indentation responses, their X-direction indentation behaviors are markedly different as seen in Fig. 3(a). Catastrophic failure of the cross-ply specimen occurs at an indentation strain εI ≈ 0.09 while the noobed composite exhibits a ductile indentation response with no loss of load carrying capacity even at εI ≈ 0.8. The failure of the cross-ply specimen is a result of delamination that emanates from the indented region as seen in the XCT image in Fig. 3(d). This delamination is triggered by kink-band formation in the plies with fibers aligned along the X-direction. This hypothesis is consistent with the observation that the peak X-direction strength and corresponding uniaxial compression strengths of the cross-ply composites are approximately equal; see Fig. 3(a).
The comparisons between the indentation responses of the noobed and cross-ply composites suggest that the noobed composites perform atleast on-par with cross-ply composites in the Z-direction but have a greatly superior response in other directions. The noobed composites have an indentation response reminiscent of a ductile metal, albeit at significantly lower density. This combined with the absence of delamination is expected to make 3D noobed composites attractive for impact and ballistic protection applications where the direction of loading is uncertain and spall resistance is an important requirement.
IV. FINITE ELEMENT MODELLING OF THE INDENTATION RESPONSE
To better understand the experimentally observed deformation and failure modes of the noobed composites, FE calculations of the indentation responses in the Z and X-directions were performed. The discrete microstructure comprising fibers and matrix is not modeled explicitly. Rather, we use the homogenised model developed by Das et al. Reference Das, Kandan, Kazemahvazi, Wadley and Deshpande22 which was shown to capture the uniaxial compressive response with reasonable fidelity. In this approach the noobed composite was modeled as a two-phase material comprising Z-direction tows within a homogenised matrix that represents the smeared-out properties of the matrix pockets along with the X and Y-direction tows.
A. Material model
Two anisotropic materials are used to model the Z-direction tows and the homogenised matrix. Here we detail the material properties used to describe both these materials. Both materials are modeled as anisotropic elastic, perfectly plastic materials with the anisotropic plasticity described by the Hill
Reference Hill31
anisotropic plasticity model. In the following, all the relevant anisotropic properties will be stated using the global co-ordinate system. For example,
 $E_Z^Z$
and
 $E_X^Z$
denote the longitudinal and transverse moduli, respectively, of the Z-direction tow (the superscript specifies that these properties relate to the Z-direction tow while the subscripts specify the direction of the property). Similarly,
 $E_X^X$
and
 $E_Z^X$
are the longitudinal and transverse moduli, respectively, of the X-direction tow while
 $E_X^h$
and
 $E_Z^h$
are the moduli of the homogenised matrix in the X and Z-directions, respectively.
First consider the Z-direction tow. We model it as a transversely isotropic medium with the Z or fiber direction being normal to the plane of isotropy. Then the elastic strains
 $\varepsilon _{ij}^e$
are related to the stresses σ
ij
in the (X, Y, Z) co-ordinate system via 5 independent elastic constants as
 $$\left( {\matrix{ {\varepsilon _{XX}^e} \cr {\varepsilon _{YY}^e} \cr {\varepsilon _{ZZ}^e} \cr {\varepsilon _{YZ}^e} \cr {\varepsilon _{XZ}^e} \cr {\varepsilon _{XY}^e} \cr} } \right) = \left( {\matrix{ {{1 / {E_X^Z}}} & {{{ - \nu _{YX}^Z} / {E_X^Z}}} & {{{ - \nu _{ZX}^Z} / {E_Z^Z}}} & 0 & 0 & 0 \cr {{{ - {\nu _{XY}}} / {E_X^Z}}} & {{1 / {E_X^Z}}} & {{{ - \nu _{ZX}^Z} / {E_Z^Z}}} & 0 & 0 & 0 \cr {{{ - \nu _{XZ}^Z} / {E_X^Z}}} & {{{ - \nu _{XZ}^Z} / {E_X^Z}}} & {{1 / {E_Z^Z}}} & 0 & 0 & 0 \cr 0 & 0 & 0 & {{1 / {\left( {2G_{YZ}^Z} \right)}}} & 0 & 0 \cr 0 & 0 & 0 & 0 & {{1 / {\left( {2G_{YZ}^Z} \right)}}} & 0 \cr 0 & 0 & 0 & 0 & 0 & {{{\left( {1 + \nu _{XY}^Z} \right)} / {E_X^Z}}} \cr} } \right)\left( {\matrix{ {{\sigma _{XX}}} \cr {{\sigma _{YY}}} \cr {{\sigma _{ZZ}}} \cr {{\sigma _{YZ}}} \cr {{\sigma _{XZ}}} \cr {{\sigma _{XY}}} \cr} } \right)\quad ,$$
Here, the symbols G and ν denote the shear modulus and Poisson’s ratio, respectively while the subscripts denote the directions of the property and the superscript Z denotes that these properties refer to the Z-direction tow (i.e., notation analogous to that for the Young’s modulus E). The total strain rate is then written as the sum of the elastic and plastic strain rates such that
 $${\dot{\varepsilon }_{ij}} = \dot{\varepsilon }_{ij}^e + \dot{\varepsilon }_{ij}^p\quad ,$$
with the plastic strain rate given by the associated flow rule
 $$\dot{\varepsilon }_{ij}^p = \dot{\lambda }{{\partial \Phi } \over {\partial {\sigma _{ij}}}}\quad ,$$
in terms of the plastic multiplier
 $\dot{\lambda }$
and the Hill yield potential Φ. This potential is specified in terms of the constants F, G, H, L, M, and N as
 $$2\Phi \,\equiv\, F{\left( {{\sigma _{YY}} - {\sigma _{ZZ}}} \right)^2} + G{\left( {{\sigma _{ZZ}} - {\sigma _{XX}}} \right)^2} + H{\left( {{\sigma _{XX}} - {\sigma _{YY}}} \right)^2} + 2L\sigma _{YZ}^2 + 2M\sigma _{ZX}^2 + 2N\sigma _{XY}^2\quad ,$$
such that continued plastic flow occurs with Φ = 1/2. The six constants F, G, H, L, M, and N then follow from six strengths with respect to the principal axes of anisotropy, i.e.,
 $$G + H = {1 \over {{{\left( {Y_X^Z} \right)}^2}}},\quad F + H = {1 \over {{{\left( {Y_Y^Z} \right)}^2}}},\quad {\rm{and}}\quad G + F = {1 \over {{{\left( {Y_Z^Z} \right)}^2}}}\quad ,$$
where
 $Y_X^Z$
,
 $Y_Y^Z$
, and
 $Y_Z^Z$
are the tensile strengths in the X, Y, and Z-directions, respectively (note that the Hill model assumes equal compressive and tensile strengths). Similarly, the shear strengths
 $Y_{YZ}^Z$
,
 $Y_{ZX}^Z$
, and
 $Y_{XY}^Z$
give the remaining constants via
 $$L = {1 \over {2{{\left( {Y_{YZ}^Z} \right)}^2}}},\quad M = {1 \over {2{{\left( {Y_{ZX}^Z} \right)}^2}}},\quad {\rm{and}}\quad N = {1 \over {2{{\left( {Y_{XY}^Z} \right)}^2}}}\quad .$$
The material surrounding the Z-direction tows comprises the X and Y-direction tows as well as the matrix pockets. This material is modeled as a single effective medium labeled the homogenised matrix. Based on the symmetries of the micro-structure of this material, Das et al. Reference Das, Kandan, Kazemahvazi, Wadley and Deshpande22 modeled this homogenised matrix also as a transversely isotropic medium with the Z-direction being normal to the plane of isotropy. Thus, again we use an elastic law of the form Eq. (4.1) with plastic flow modeled via Hill’s anisotropic plastic model. Derivations of the elastic and plastic properties of this effective medium are given in the Supplementary Material using the homogenisation procedure developed by Das et al. Reference Das, Kandan, Kazemahvazi, Wadley and Deshpande22 The elastic and plastic properties of the Z-direction tows and the homogenised matrix are summarised in Table I and II, respectively; these completely specify the elastic law and can also be used to determine the 6 constants of the Hill model.
The elastic properties of the transversely isotropic Z-direction tows and the homogenised matrix in the 3D noobed composite. All the moduli are given in GPa.

The plastic/failure strengths of the Z-direction tows and the homogenised matrix in the 3D noobed composite. In this table, all the strengths are in MPa.

B. Description of the boundary value problem
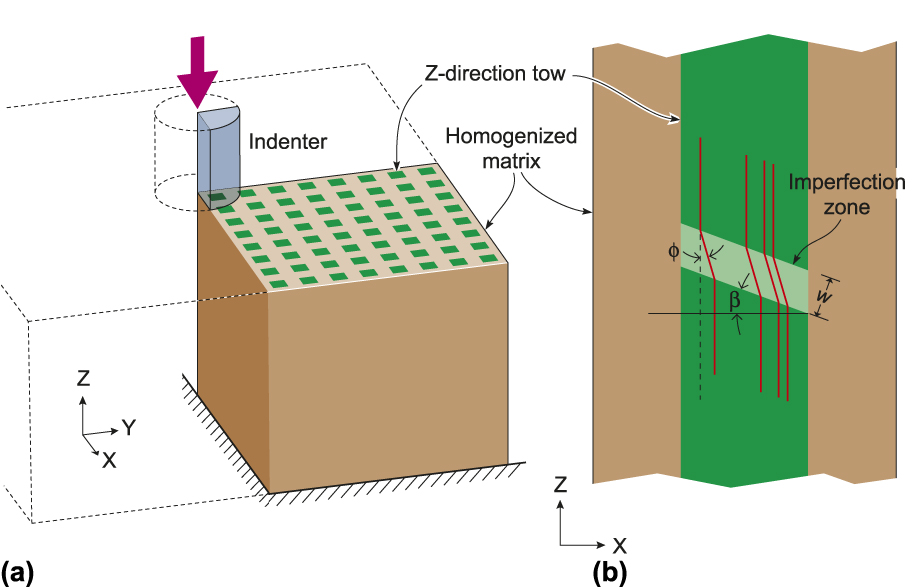
The finite element (FE) calculations were performed using the commercial FE package ABAQUS (Dassault Systemes, Waltham, Massachusetts). To reduce the size of the computation, cubic specimens comprising a grid of 16 × 16 Z-direction tows were used [Fig. 5(a)]. In these specimens, the Z-direction tows had cross-sectional dimensions 1.25 × 1.25 mm and were arranged in a cubic grid with a centre-to-center tow spacing of 3.06 mm consistent with the unit cell sketched in Fig. 1(c). The same specimen was used for both the Z and X-direction indentation calculations with the specimen discretised using 8-noded linear brick elements (C3D8R in the ABAQUS notation) of size ∼0.05 mm. Perfect bonding was assumed between the homogenised matrix and the Z-direction tows but an imperfection to trigger the formation of a kink-band was introduced into the Z-directions tows (this imperfection influences the predictions of the Z-direction indentation response but has virtually no effect on the X-direction indentation behavior). The imperfection is sketched in Fig. 5(b) and comprised a region within which fibers were assumed to be misaligned. This imperfect region was located at mid-height in all the Z-directions tows, had a width w = 200 μm and was inclined at an angle β = 20° with respect to the X-direction. The misalignment was specified by rotating the principal axes of the material anisotropy such that the material Z-direction was at an angle ϕ with respect to the global Z-direction in the X–Z plane as shown in Fig. 5(b). Such a prescription of the initial imperfection to initiate a kink-band is commonly used Reference Kyriakides, Arseculeratne, Perry and Liechti32,Reference Kyriakides and Ruff33 and consistent with a range of experimental observations. Reference Moran, Liu and Shih34
(a) Sketch of the quarter specimen used in the FE analysis of the Z-direction indentation. (b) An illustration of the geometric imperfection included in the Z-direction tows.
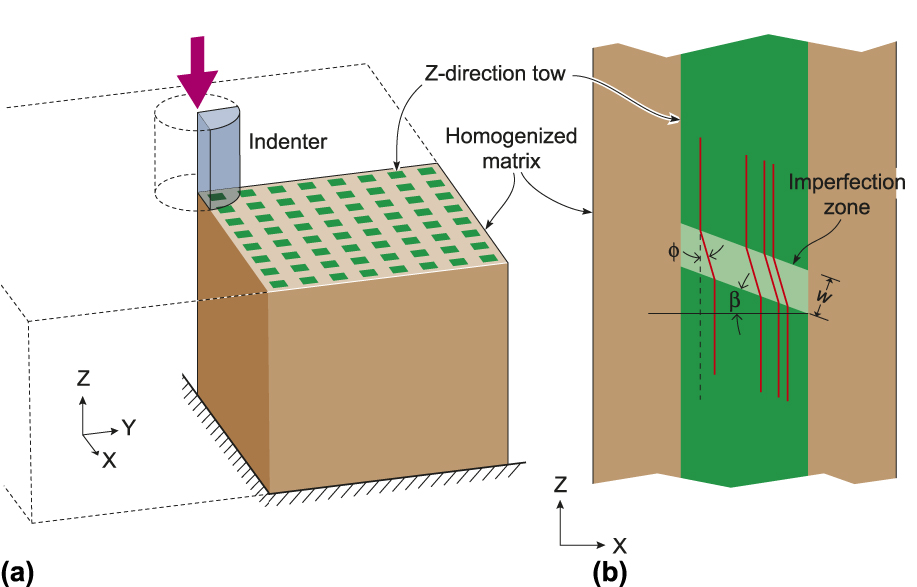
The boundary conditions for simulating indentation were as follows. Employing symmetry of the problem, we analyzed a quarter of the specimen and used symmetry boundary conditions on two perpendicular planes that intersect along the axis of the cylindrical indenter; see sketch in Fig. 5(a) for the setup for simulating the Z-direction indentation response. Displacements in the direction of indentation were completely restrained on the bottom of the surface of the specimen with the specimen sides specified to be traction-free. The circular flat-bottomed indenter was modeled as a rigid body with the general contact option in ABAQUS used to model contact between the indenter and the specimen. Loading was specified by applying an indentation displacement to the indenter: the applied displacement and resulting work-conjugate load were used to define εI and σI in a manner analogous to the experiments. The FE analysis was conducted using the large deformation/non-linear geometry option.
C. Numerical predictions of the indentation response
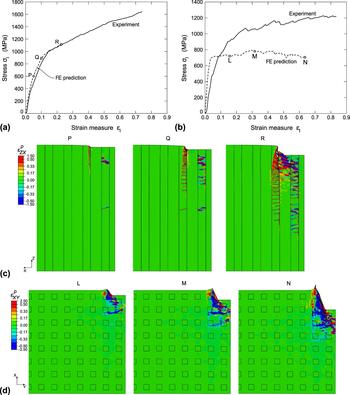
Predictions of the Z and X-direction indentation responses of the noobed composites are included in Figs. 6(a) and 6(b), respectively. First consider the case of indentation in the Z-direction. The maximum applied displacements in the FE calculations corresponded to an indentation strain εI ≈ 0.3 as mesh distortion prevented the FE calculations from being carried out any further. Excellent agreement is observed between measurements and predictions over the range of displacements computed in the FE analysis including an accurate prediction of the onset of non-linearity and the subsequent hardening rate. Corresponding predictions of the deformation modes under the indenter at instants P, Q, and R marked in Fig. 6(a) are shown in Fig. 6(c). In Fig. 6(c) we show contours of the plastic strain
 $\varepsilon _{ZX}^p$
on a plane that sections the specimen along the X–Z diametrical plane of the indenter. Here we see that very early in the deformation history (P) a kink-band has formed in a centrally located Z-direction tow with the development of plasticity at the edge of the indenter. However, this plasticity causes no significant non-linearity in the overall indentation response. Multiple and reflected kink-bands developed within the Z-direction tows with increasing indentation displacement, and at the end of the calculation (R) we see extensive zig-zagged kink-band formation along as well as bands of plasticity, emanating from the edges of the indenter, reminiscent of the shear bands seen in Fig. 2(c).
Comparison between the measured and FE predictions of the (a) Z-direction and (b) X-direction indentation responses of the noobed composites. The corresponding FE predictions of the deformation along with distributions of the plastic strain are shown in (c) for Z-direction and in (d) X-direction indentation. The columns in (c) and squares in (d) indicate the Z-direction tows.

On the other hand, the results in Fig. 6(b) show that the FE calculations grossly under-predict the X-direction indentation strength. The associated predicted that deformations at points L, M, and N marked in Fig. 6(b) are shown in Fig. 6(d). The deformations here are shown on a section through the specimen along the X–Y diametrical plane of the indenter with contours of the plastic strain
 $\varepsilon _{XY}^p$
included in Fig. 6(d). The FE calculations correctly predict the development of shear bands emanating from the edge of the indenter that shear the Z-directions tows. However, the X and Y-direction tows are not explicitly modeled here and thus the approach does not include predictions of kink-bands in the X-direction tows as seen in Fig. 4. We associate the poor fidelity of the FE model of Das et al.
Reference Das, Kandan, Kazemahvazi, Wadley and Deshpande22
in this case to the fact that the X-direction tows are not explicitly modeled, i.e., this study suggests that a more comprehensive model which explicitly includes tows in all directions is required to capture the full multi-axial response of the noobed composites.
V. CONCLUDING REMARKS
The quasi-static indentation response of a 3D noobed (the acronym NOOB stands for Noninterlacing, Orientating Orthogonally, and Binding) composite comprising carbon fiber tows in an epoxy matrix has been investigated. The measurements indicate that the indentation response is ductile with continued indentation occurring by a combination of kink-band propagation in the tows aligned with the indentation direction and shearing of the tows in the orthogonal directions. Importantly, the response is nearly isotropic with the indentation strength being approximately equal in three orthogonal directions. By contrast, the out-of-plane indentation of a traditional cross-ply carbon fiber laminate occurs by progressive tensile ply failure resulting in a serrated load versus displacement curve. Nevertheless, the average indentation strength in this direction is approximately equal to that of the 3D noobed composite. However, cross-ply composites delaminate when indented in the in-plane direction resulting in an elastic-brittle response.
A finite element (FE) analysis of the indentation response of the noobed composites is also presented wherein only one set of tows is explicitly modeled while the other two sets of orthogonal tows and the matrix pockets are homogenized into an effective medium. This simplified approach accurately captures the indentation response in the direction of the tows that are explicitly modeled but under-predicts the indentation strength in the other directions. The modeling study suggests that all tows of the 3D composite need to be explicitly considered to capture the multiaxial response of these composites with adequate fidelity.
Traditional cross-ply carbon fiber laminates and state-of-the-art ultra high molecular weight polyethylene composites Reference O’Masta, Crayton, Deshpande and Wadley35 have a saw-tooth indentation load versus displacement curve for indentation perpendicular to the plane of the plies. Moreover, these composites are extremely brittle with delamination limiting the energy absorption for indentation along the ply directions. We have demonstrated here that 3D noobed composites not only have smooth load–displacement curves that are reminiscent to those of ductile metals for indentation in all directions but also undergo no delamination. This is all achieved at densities significantly lower than structural metals that display equivalent ductility. These noobed composites are thus strong candidates for applications such as impact protection where the loading direction is not known a priori and spall resistance is an important requirement.
Supplementary Material
To view supplementary material for this article, please visit https://doi.org/10.1557/jmr.2017.481
ACKNOWLEDGMENTS
The authors are grateful to the Office of Naval Research (ONR) for their financial support through grant number N62909-16-1-2127 on Dynamic performance of 3D assembled composite structures (program managers Dr. Joong Kim & Dr. Judah Goldwasser).