

Phosphorus (P) is a complicated subject in soil science and particularly so in the tropics. There are several reasons. Contrary to carbon (C) and nitrogen (N) cycles, which are organic, the phosphorus cycle involves both organic and inorganic stocks. Some reactions are very fast, some very slow, and many of them are not well understood. Important differences exist between and within plants and microorganisms in their ability to cope with low levels of available phosphorus. In addition, the nomenclature is not uniform and often confusing in the literature.
Phosphorus is a scarce element in our planet when compared with carbon and nitrogen. It does not exist in significant amounts in the atmosphere, ranks eleventh in the lithosphere, and thirteenth in seawater (Smil Reference Smil2000). Its content in plant leaves is approximately 0.1 percent P compared with ~ 45 percent C and ~ 2 percent N. Nevertheless, humans almost always consume phosphorus in sufficient quantities, so phosphorus deficiency is not a public health concern, unlike nitrogen (protein), which is often deficient in the diets of people living in poor countries of the tropics. Phosphorus intake by humans is mainly in the form of cereals, meat and milk products. It is abundant in the bones and teeth of vertebrate animals, about 60–70 percent of which are hydroxyapatite, containing about 12 percent P (Smil Reference Smil2000).
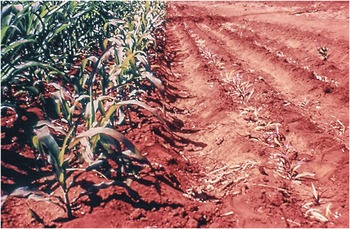
Phosphorus deficiencies in relation to plant needs are very common in Oxisols, Ultisols and oxidic groups of Alfisols and Inceptisols. They are also common in Andisols and Vertisols, as well as in sandy Alfisols, Spodosols and Histosols. In large areas of tropical South America (Cerrado, Llanos; Fig. 14.1) and Africa (Sahel), phosphorus is the first nutrient deficiency that has to be corrected in agriculture, ahead of nitrogen. Ecologists assert that natural systems on highly weathered soils are primarily phosphorus-limited, while young, slightly weathered soils of the glaciated temperate region are primarily nitrogen-limited (Vitousek and Sanford Reference Vitousek and Sanford1986). Since the tropics have both highly weathered and slightly weathered soils, soils of the tropics can be limited in either of these two elements. Using the k attribute of the Functional Capability Classification (FCC) system, which indicates low content of primary weatherable minerals (< 10 percent in the sand and silt fractions in the top 50 cm), about 45 percent of the tropics (1.7 billion hectares) are primarily phosphorus-limited and 55 percent are primarily nitrogen-limited. The corresponding estimate for the temperate region (excluding boreal latitudes) is in the opposite direction: about 10 percent being primarily phosphorus-limited (653 million hectares) while the vast majority are primarily nitrogen-limited (Chapter 5).
Extreme phosphorus deficiency and phosphorus sorption in a clayey Oxisol at Planaltina, Brazil. The right-hand row is the check plot without phosphorus, maize plants about dead. The center row is a border row, showing strong phosphorus deficiency symptoms. The upper left-hand row is one that received phosphorus fertilizer.
Exacerbating phosphorus limitations, many soils in the tropics have very high capacity to sorb (retain or fix) added phosphorus in slowly soluble forms, making the element immediately unavailable to plants, though eventually part of it is released. Soils with high phosphorus sorption capacity cover about 1.11 billion hectares in the tropics (Chapter 5) but that is only 24 percent of the area, meaning that three-fourths of the soils do not have high phosphorus sorption as a constraint. In contrast, the prevalence of such soils in the temperate region is only 1.7 percent (113 million hectares), mainly in the southeastern United States and southeastern China.
This chapter describes the phosphorus cycle at two time scales (geologic and human), the various phosphorus fractions and fluxes in soils, the critical issue of phosphorus sorption and release, plant adaptation to low levels of available phosphorus, fertilizer management strategies, residual effects, efficiency of utilization and environmentally positive interventions.
14.1 The Phosphorus CycleFootnote 1
The global phosphorus cycle is different from those previously described (water, carbon, nitrogen) in that the atmosphere does not participate in a major way. Phosphorus is not directly involved in global warming as carbon and nitrogen are. In addition, phosphorus does not have a biotic input akin to biological nitrogen fixation.
14.1.1 The Phosphorus Cycle at the Geologic Time Scale
A closed cycle (Fig. 14.2) exists only at a geologic time scale (107–108 years). Phosphorus constitutes 0.1 percent of the Earth’s crust; 95 percent of this phosphorus is apatite (calcium phosphate), its three main forms being fluorapatite [Ca10(PO4)6F2], hydroxyapatite [Ca10(PO4)6(OH)2], and chlorapatite [Ca10(PO4)6Cl2]. Marine sediments containing 4 × 10⁶ Pg (billion tons) of phosphorus occupy vast coastal areas, for example from the coast of Florida to the Grand Banks of Canada in the Atlantic Ocean (22 Pg P), off the coast of southwest Africa and other continental shelves. Estimates of the US coastal resources at different depths by Stewart et al. (Reference Stewart, Hammond, van Kauwenbergh, Sims and Sharpley2005) add up to 727 Pg P.
The global phosphorus cycle in geologic time. Boxes are stocks in Tg (million tons) or Pg (billion tons) of phosphorus (P) or phosphate rock (PR), while fluxes (in red) are in Tg P or Tg PR per year.

Tectonic uplift in geologic time raises apatite-rich phosphate rock to land and continental shelves at an annual rate of 111–185 million tons (Tg) of phosphate rock per year. Interestingly, this is within the range of the world’s annual extraction rate of phosphate rock, currently estimated at 140 Tg of phosphate rock per year (Fig. 14.2). Strictly speaking, phosphorus is a renewable resource at the geologic time scale, something I have not read in the literature, because tectonic uplift inputs are more or less balanced by phosphate rock mining extraction. This may be of little practical value because of the unknown location of these new uplifted deposits (presumably in the coastal continental shelves), their accessibility and cost of extraction, and whether or not sea level rise caused by global warming would adversely affect phosphate rock extraction.
Another, albeit small, input comes from the excreta and bones deposited on arid tropical islands where sea birds choose to roost. The product is called biogenic phosphate rock, or guano. Biogenic phosphate rocks are apatites of very high solubility and can be used for direct application to the soil, as the Incas did for centuries from the Peruvian guano islands. Some tropical Pacific and Indian ocean islands covered by guano are sinking into the sea as phosphate rock is harvested. Most notable is the island state of Nauru. The current global reserves of biogenic phosphate rock are unknown, but a relevant one, the Minjingu phosphate rock deposit of northern Tanzania, has an estimated reserve of 8–10 Tg of phosphate rock (van Kauwenbergh Reference van Kauwenbergh2010). This is a small deposit, compared to sedimentary deposits.
Approximately 112 Tg of phosphate rock are currently converted into phosphorus fertilizers every year. An additional 28 Tg of phosphate rock are annually converted into detergents, soft drinks, livestock salt licks and other industrial uses of phosphoric acid, adding up to 140 Tg of phosphate rock per year. About 1.5 Tg of phosphate rock per year are directly applied to the soil, including much of the biogenic phosphate rock.
The main process used for converting phosphate rock into soluble phosphorus fertilizers, the wet phosphoric acid process, is very polluting. The process leaves a byproduct called phosphogypsum, some of which often ends up in surface waters, causing eutrophication.
Phosphorus applied to agricultural soils from fertilizers was 14.2 Tg P in 2000 and the manure applied in that year contained 9.6 Tg P (MacDonald et al. Reference MacDonald, Bennett, Potter and Ramankutty2011). Phosphorus fertilizer use increased to 18 Tg P per year by 2007 (Sattari et al. Reference Sattari, Bouwman, Giller and van Ittersum2012).
Soil phoshorus stocks are considerable (~ 50 Pg P in the top 50 cm) and constitutes the largest phosphorus stock in terrestrial systems, of which over 90 percent is inorganic. This is roughly an average stock in the world’s soils of 3570 kg P/ha of which about 400 kg P/ha is organic phosphorus (Smil Reference Smil2000). The world’s croplands (arable and permanent crops), total ~1.5 billion hectares in 2013 (Table 2.10); they have a stock of 5–6 Pg P or about 10–12 percent of the total global soil stock. Terrestrial plant stocks are relatively small, about 0.6 Pg P.
Unlike other element cycles – as mentioned above – there is no major atmospheric component of the phosphorus cycle. However, particulate phosphorus is thrown to the air by wind erosion and biomass burning, but returns to the soil, usually at another location, and can be deposited in the oceans as well. These fluxes are small (1–2 Tg P per year).
The two main loss pathways from the soil are harvest removals and runoff and erosion. Large parts of harvest removals turn into sewage. The fluxes of phosphorus in runoff and erosion and sewage are the main loss pathways from terrestrial to aquatic environments. These two pathways carry 30–35 Tg P per year to freshwater and eventually the oceans, where they accumulate as sediments, and together with dead marine biomass a flux of 20–30 Tg P per year are buried in the continental shelves of oceans, adding to the immense stock of 4 × 10⁶ Pg P. Some of this stock eventually becomes phosphate rock. In geologic time, it is uplifted tectonically to the Earth’s surface, closing the phosphorus cycle.
14.1.2 The Phosphorus Cycle at a Human Time Scale
There is no closed phosphorus cycle at the human time scale (102–103 years), because what we have is one source (phosphate rock) and one sink (marine sediments) without a feedback loop to make it a cycle (Fig. 14.3). Unlike nitrogen and potassium, much of the phosphorus that is added to the soil tends to remain there, often building up large residual stocks. Except in very sandy soils there usually is no leaching of the phosphate anions, with the exception of movement just below the topsoil by tillage or other disturbances (see for example Beck and Sanchez Reference Beck and Sanchez1996, Garcia-Montiel et al. Reference Garcia-Montiel, Neill, Melillo, Thomas, Steudler and Cerri2000). Agronomically, the largest agricultural area in the tropics where phosphorus leaching is an important factor is the northern Sahel, because of the predominance of coarse sandy soils (Chapter 4). If the subsoil is clayey (having an argillic horizon), like many sandy Alfisols in that region, the phosphorus leached can be sorbed by the subsoils, which often have reddish colors indicative of iron oxides, giving them phosphorus sorption capacity.
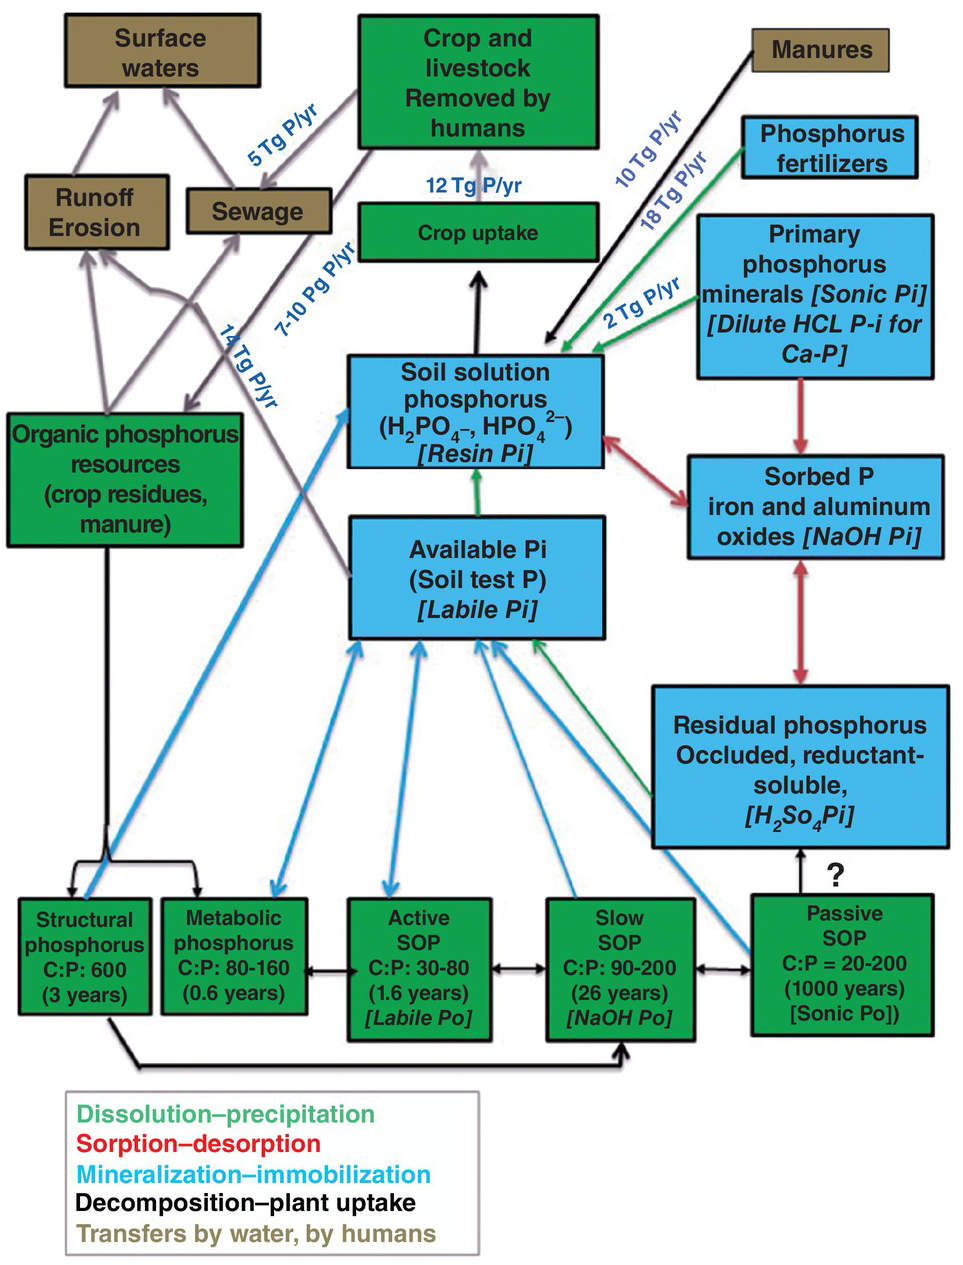
Soil phosphorus stocks and fluxes in the world’s cropland (crops plus cultivated forages) at about the year 2000. The main flux processes are color-coded as shown below the graph. Doubled-pointed arrows indicate opposite processes are happening. Single arrows indicate only one flux process. Stocks are also color-coded. Green for organic phosphorus (Po) and blue for inorganic phosphorus (Pi). Hedley fractions are indicated in italics for each relevant stock. Please note that no arrows have been drawn from the organic and inorganic stocks to erosion and runoff for clarity, but these fluxes are an important part of the system. Many unknown fluxes remain.
Dissolved organic phosphorus, however, has been found to move down and out of the profile in loamy, permanent-charge Alfisols of the long-term plots in Rothamsted, UK, from plots that had accumulated high levels of available phosphorus in the A horizon (Syers et al. Reference Syers, Johnston and Curtin2008). Rothamsted soils don’t have much phosphorus sorption, but Olibone and Rosolem (Reference Olibone, Rosolem and Alves2006) detected movement of dissolved organic phosphorus down to 40 cm in a clayey Oxisol of Brazil, which sorbs phosphorus strongly. There are no clear conclusions, but this is an area for future research.
Between the sources (phosphorus fertilizers 18 Tg P per year, plus 10 Tg P per year from manure phosphorus and 2 Tg P/ha from weathering of primary minerals) and the sink (surface waters) there are many phosphorus fractions or pools, six inorganic (in blue) and eight organic (in green) plus three combined ones (brown background) in Fig. 14.3. These stocks are connected by several opposite fluxes: dissolution and precipitation; sorption and desorption; mineralization and immobilization; decomposition of organic inputs and plant uptake. In addition, there are several one-way physical transfers: crop residue returns, manures, runoff and erosion, and sewage to surface waters.
Harvest removal by crops and cultivated pastures was 12.3 Tg P per year in the year 2000 (MacDonald et al. Reference MacDonald, Bennett, Potter and Ramankutty2011). Runoff and subsequent erosion of phosphorus are the main transfer mechanisms to water bodies, which Smil estimates to be 14 Tg P per year in cultivated land. Since phosphorus does not move much in the soil (except in very sandy soils) leaching losses are usually negligible. Much of the runoff and erosion losses happen during intense rainfall, particularly upon converting phosphorus-rich farmland to urban expansion and road development.
The phosphorus consumed as food from crop harvest removals and livestock products eventually winds up in cemeteries and urban sewer systems, the latter receiving 2–4 Tg P per year worldwide. Organized urban sewer systems are the norm in rich countries and in some cities of tropical Asia and Latin America. The exceptions are mainly in tropical Africa and remote areas of the other regions where sewage systems are seldom organized and are mostly non-point. Also interesting is Japan, where Smil observed that only half its population was connected to sewer systems at the end of the twentieth century. I can testify to that when visiting friends in Hokkaido in the 1980s.
Urban sewer systems also receive domestic waste and industrial detergents (with high phosphorus contents), which raise the total flux to 5 Tg P per year globally (Smil Reference Smil2000). Treatment of urban sewage decreases some of these phosphorus inputs by sedimentation and other means, and frequently biosolids are recycled to crop fields if they do not contain heavy metals.
14.1.3 Will the World Run Out of Phosphorus?
Because phosphorus is a finite resource at the human time scale, a key question to our survival is how long phosphate rock resources will last. Such a question has cropped up about once a decade during my professional career, with advocates estimating that we would run out of phosphorus by the year 2000, 2033, 2100 or similar times. It is an important question because phosphorus is one of the two plant nutrient elements where supplies are not only finite, but they are used at increasing rates that are highly correlated with the increasing demand for food (Stewart et al. Reference Stewart, Hammond, van Kauwenbergh, Sims and Sharpley2005). (The other major nutrient element is potassium where the supplies are also finite, but they are so large that it is not a concern.)
The best estimate I am aware of describes phosphate rock supply in terms of its price, as it will only be mined if it is economical. Stewart et al. (Reference Stewart, Hammond, van Kauwenbergh, Sims and Sharpley2005) calculated that at the global price US $40/Tg P of phosphate rock of the known above-ground reserves as of 2002, 12 Pg of phosphate rock would last for about 90 years, in other words, to the end of the twenty-first century. With an increase in phosphate rock price to about US $100/Tg P, the known above-ground phosphate rock reserves would almost quadruple, to 47 Pg of phosphate rock, which would last for 343 years (Stewart et al. Reference Stewart, Hammond, van Kauwenbergh, Sims and Sharpley2005). Subsequent estimates (van Kauwenbergh Reference van Kauwenbergh2010, Malingreau et al. Reference Malingreau, Eva and Maggio2012) agree with Stewart’s assessment. These estimates are alarming for centuries to come, but not for the century we live in. Such estimates assume the same level of technologies in phosphate rock beneficiation and phosphorus fertilizer use as well as current efficiencies. This should not make us complacent or give us an excuse not to be more efficient and recycle better. Ways of increasing the efficiency of phosphorus fertilizer and manure are presented towards the end of this chapter.
We do not have a mechanism to fully recycle the P used at a human time scale. It is unacceptable in virtually all cultures to recycle our ancestors’ bones, but something can be done about solid waste, livestock bones, erosion and runoff control.
I asked the International Fertilizer Industry Association (IFA) if new extraction technologies from coastal marine sediments are being developed. Michel Prud’homme (personal communication, 2012) indicated that there are a few ongoing projects investigating the economic feasibility of dredging shallow ocean sediments off the coasts of Namibia and New Zealand, but this is work in progress. A promising effort is that found off the coast of North Carolina (Christopher Lambe, personal communication, 2013).
The following sections describe in more detail the stocks and fluxes of phosphorus in the soil that are illustrated in Fig. 14.3, organized in terms of total, inorganic and organic phosphorus stocks.
14.2 Total Soil Phosphorus
The 50 Pg P in the top 50 cm of the world’s soils (Fig. 14.2) is an important metric, but the total phosphorus content of soils has no direct relevance to plant uptake. Olson and Englestad (Reference Olson and Englestad1972) stated that representative soils from the US Midwest average about 3000 mg/kg total phosphorus in the topsoil, the more weathered soils of southeastern United States about 500 mg/kg P; and “tropical soils” about 200 mg/kg P. Total phosphorus in soils has been used as a weathering index. Walker and Syers (Reference Walker and Syers1976), Cross and Schlesinger (Reference Cross and Schlesinger1995) and Porder and Hilley (Reference Porder and Hilley2011) all found that total phosphorus decreases with weathering stage. In Venezuela, for example, total phosphorus contents are correlated with increasing weathering in different soils, as estimated by the cation exchange capacity (CEC) of the clay fraction (Table 14.1).
Although Oxisols are generally low in total phosphorus, some are extremely high. Moura et al. (Reference Moura, Buol and Kamprath1972) reported 3760 mg/kg total topsoil phosphorus in a Eutrustox from Brazil, the highest level I have encountered. Ultisols and Alfisols are also generally low in total phosphorus, with topsoil values mostly below 200 mg/kg P. Andisols are generally high in total phosphorus, with ranges of 1000–3000 mg/kg P, but usually deficient in available phosphorus because of high phosphorus sorption. Most Vertisols are low in total P, ranging from 20 mg/kg P to 90 mg/kg P. The total phosphorus contents of Entisols and Inceptisols vary with parent materials.
As mentioned several times before, there is great variability among soils of the tropics. Within the Amazon, upland soils (non-alluvial) are classified as Oxisols and closely related Ultisols and Alfisols, all highly weathered. Data shown in Table 14.2 for topsoils covering a wide range of pH, clay and soil organic carbon (SOC) also show a wide range in total phosphorus and in its inorganic and organic phosphorus fractions. They vary in total phosphorus and the different phosphorus fractions. The soil from Altamira is a Eutrustox similar to that of Moura et al. (Reference Moura, Buol and Kamprath1972), with very high levels of total phosphorus.
| Locality and soil | pH | Clay (%) | SOC (%) | Total phosphorus | Organic phosphorus (% total P) | Inorganic phosphorus | ||||
|---|---|---|---|---|---|---|---|---|---|---|
| Ca-bonded phosphates | Al-bonded phosphates | Fe-bonded phosphates | Residual phosphorus | Total inorganic P | ||||||
| (mg/kg P) | ||||||||||
| Itacoatiara (Oxisol) | 4.2 | 60 | 2.87 | 198 | 27 (14) | 6 | 49 | 39 | 77 | 171 |
| Manaus (Oxisol) | 4.1 | 10 | 0.90 | 176 | 39 (23) | 16 | 75 | 30 | 16 | 137 |
| Porto Velho (Oxisol) | 4.9 | 39 | 4.00 | 327 | 116 (36) | 1 | 63 | 42 | 105 | 211 |
| Altamira (Eutrustox) | 5.8 | 41 | 1.47 | 1521 | 698 (46) | 15 | 14 | 126 | 667 | 823 |
| Alenquer (Alfisol?) | 6.8 | 29 | 1.75 | 522 | 320 (61) | 12 | 16 | 33 | 139 | 202 |
Andisols, as mentioned above, have high total phosphorus values (Table 14.3). In sharp contrast, sandy Alfisols from the Sahel of Africa have overall low total phosphorus contents, mostly as residual phosphorus, with very low levels of organic phosphorus, reflecting the low SOM levels. The soils in Table 14.3 are not highly weathered but their texture and mineralogy produce such great contrasts.
| Soils | Total P | Organic phosphorus (percent of total phosphorus) | Inorganic phosphorus | ||||
|---|---|---|---|---|---|---|---|
| Ca-bonded phosphates | Al-bonded phosphates | Fe-bonded phosphates | Residual phosphorus | Total inorganic phosphorus | |||
| (mg/kg P) | |||||||
| Andisols (mean of 34) | 1142 | 496 (43) | 124 | 92 | 55 | 274 | 646 |
| Sandy Alfisol, Sadoré, Niger | 41 | 2 (5) | 9 | 19 | 33 | ||
| Sandy Alfisol, Gobery, Niger | 39 | 7 (18) | 11 | 18 | 32 | ||
Please note that all these data are from topsoils. With phosphorus, the focus is on the topsoil because phosphate ions are strongly held there and this is where the sorption of fertilizer phosphorus occurs.
14.3 Inorganic Phosphorus
14.3.1 Primary Minerals
The primary phosphorus soil minerals (mainly apatites) are present in the sand and silt fractions. They are slowly dissolved by the soil’s natural acidity and organic acid secretions from microorganisms, roots and mycorrhizae at the rate of 2 Tg P per year in cultivated soils (Smil Reference Smil2000). The resulting phosphate anions are short-lived in the soil solution because they are rapidly sorbed as secondary phosphorus minerals, or immobilized by microorganisms in soil organic matter (SOM). This is the origin of soil organic phosphorus (SOP).
14.3.2 Secondary Minerals
The secondary phosphorus minerals form in the soil as clay particles. They are grouped into three active fractions and one recalcitrant fraction in terms of their solubility, according to the classic method of Chang and Jackson (Reference Chang and Jackson1957). It is noteworthy that Chang and Jackson included two soils from the tropics out of the four soils used to develop their fractionation method. The active inorganic phosphorus fractions are grouped as calcium (Ca)-bonded phosphates, which are more prevalent in neutral to calcareous soils, and aluminum (Al)-bonded phosphates and iron (Fe)-bonded phosphates, both of which are most common in variable-charge acid soils. Calcium phosphates are more soluble than aluminum phosphates, which, in turn, are more soluble than iron phosphates. Calcium phosphates are present as discrete particles, while aluminum phosphates and iron phosphates are present as films adsorbed on clay surfaces.
The recalcitrant fractions are called occluded phosphorus and reductant-soluble phosphorus in the Chang and Jackson (Reference Chang and Jackson1957) method and as residual inorganic phosphorus extracted by concentrated sulfuric acid in the Hedley sequential fractionation (Hedley et al. Reference Hedley, Stewart and Chauhan1982a). Most of the total phosphorus found in Moura’s Brazilian Eutrustox was also in this fraction. In aerobic soils, occluded and reductant-soluble inorganic phosphorus act pretty much the same and are normally lumped together as occluded phosphorus. They often constitute the largest inorganic phosphorus fraction in the Chang and Jackson method shown in Tables 14.1, 14.2 and 14.3.
The transformation of one fraction of secondary inorganic phosphorus into another is controlled mainly by soil pH (Guo et al. Reference Guo, Yost, Hue, Evensen and Silva2000). As soils become more acid, the activity of iron and aluminum increases and the relatively soluble calcium phosphates are converted into less soluble aluminum and iron phosphates. These processes are slow enough to permit considerable quantities of calcium phosphates to be present in acid soils with pH values below 5.5, as shown in Table 14.2, with some even in a soil of pH 3.9, as will be shown later.
14.3.3 Sorbed Phosphorus and Available Phosphorus
Because of the importance of these two fractions, they will be discussed separately.
14.3.4 Soil Solution Phosphorus
Two phosphate anions exist in the soil solution: the dihydrogen phosphate anion (H2PO4–), more abundant in soils < pH 7, and the hydrogen phosphate ion (HPO42-), most abundant in soils > pH 7.2. Both anions move by the slow diffusion process as opposed to the fast mass flow process of many other nutrient ions, and both are readily taken up by plants.
The dynamics of soil solution phosphorus are very fast. Fluxes shown in Fig. 14.4 that add phosphorus to the soil solution – dissolution of phosphorus fertilizers, dissolution of secondary minerals, desorption of sorbed phosphorus and mineralization of organic phosphorus – vie constantly with depletion fluxes such as phosphorus sorption, immobilization by microorganisms and plant uptake. Plants accumulate in their tissues 1000–5000 mg/kg P (0.1–0.5 percent on a dry mass basis) from a soil solution of 0.2 mg/L P or less. Syers et al. (Reference Syers, Johnston and Curtin2008) estimated that when crops are having a rapid rate of uptake (0.3–0.5 kg P/ha per day), the average root hair cylinder needs to have its surrounding soil solution replaced 10–20 times per day. This varies with the discontinuity and tortuosity of the water films that contain the soil solution. Even at the wilting point, (–1500 kPa of soil moisture tension), water films around clays can be continuous. Other actors also vie for soil solution phosphorus; weeds and microorganisms want to take it up, iron and aluminum oxide surfaces sorb it. It’s a tough neighborhood there.
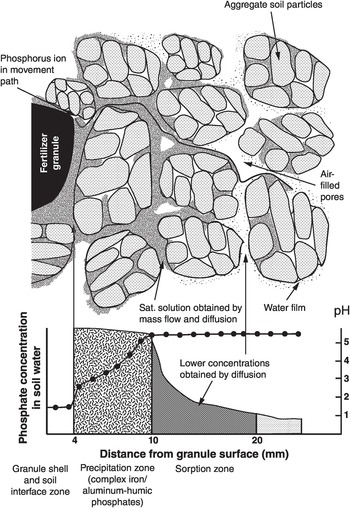
Representation of the movement of phosphorus from a triple superphosphate granule to a well-granulated soil by mass flow and diffusion, indicating the precipitation and adsorption zones, as pH and phosphorus concentration changes.
14.4 Organic Phosphorus
It is commonly believed that the majority of soil phosphorus in highly weathered soils of the tropics is in the form of organic phosphorus (I wrote as much in the first edition). Tables 14.1, 14.2 and 14.3 indicate that this is not always the case. The variability in the proportion of the total phosphorus that is organic is not a matter of weathering, as total phosphorus seems to be. Organic phosphorus is very important for soil fertility in the tropics (Duxbury et al. Reference Duxbury, Smith, Doran, Coleman, Oades and Uehara1989, Nziguheba and Bünemann Reference Nziguheba, Bünemann, Turner, Frossard and Baldwin2005).
There is a positive relationship between total organic phosphorus content and clay content (Table 14.4), which is no doubt related to SOM content, which normally increases as particle size decreases.
| Textural class | Number of samples | Organic phosphorus (mg/kg; mean + SD) | Percentage of total phosphorus (mean + SD) |
|---|---|---|---|
| Sands | 77 | 147 ± 20 | 36 ± 2 |
| Loams | 155 | 290 ± 20 | 37 ± 2 |
| Clay loams | 113 | 324 ± 24 | 45 ± 2 |
| Clays | 80 | 277 ± 31 | 44 ± 3 |
14.4.1 Composition
Most SOP compounds have phosphorus bonded to oxygen in ester bonds (–C–O–P), unlike in soil organic nitrogen (SON) compounds where the nitrogen is bonded to carbon (–C–N–). More than half of the organic phosphorus is composed of monoesters, mainly inositol phosphate (phytate); about 5 percent is in phospholipids and 2 percent in nucleic acids, but a large amount is yet to be chemically identified (Stewart and Tiessen Reference Stewart and Tiessen1987, Majid et al. Reference Majid, Tiessen, Condron and Piccolo1996, Condron and Tiessen Reference Condron, Tiessen, Turner, Frossard and Baldwin2005). They are probably located in the slow and passive SOP pools shown in Fig. 14.3.
Phosphate ester bonds can be readily broken by one extracellular enzyme, phosphatase, which is produced by microorganisms, roots and mycorrhizae, while the release of nitrogen from its carbon bond requires the coordinated action of several enzymes (Vitousek et al. Reference Vitousek, Haettenschweiler, Olander and Allison2002). Because of this, Vitousek and co-workers assert that the organic component of the phosphorus cycle is more flexible than the nitrogen cycle. When fertilizing annual crops, only 3–10 percent of the applied phosphorus becomes organic phosphorus. Pastures convert more (5–30 percent) and perennial crops, agroforestry and forestry plantations the most (17–44 percent).
14.4.2 The Hedley Fractionation
A method of sequential phosphorus fractionation was developed by Hedley et al. (Reference Hedley, Stewart and Chauhan1982aReference Hedley, White and Nyeb), which has increasingly become the standard for soil phosphorus fractionation with minor modifications. It separates soil phosphorus into five inorganic fractions (Pi), three organic fractions (Po) and one residual fraction, largely inorganic. Increasingly strong reagents extract phosphorus fractions that are believed to be less available to plants. The organic Po fractions were determined by measuring total phosphorus in each extract and subtracting the Pi already determined. The version that I used (Beck and Sanchez Reference Beck and Sanchez1994) starts with an anion resin extraction (called resin Pi), a fraction that is used as a soil test in acid soils of Brazil (van Raij and Quaggio Reference 414van Raij and Quaggio1990). Then comes the 0.5 M NaHCO3 extraction (called bicarb Pi and bicarb Po), which is the Olsen phosphorus soil test. This is then followed by a 0.1 M NaOH extraction (called NaOH Pi and Po), another 0.1 M NaOH extraction followed by sonication (called sonic Pi and Po), then a 1 M HCl (called HCl Pi) extraction and finally a concentrated H2SO4 digestion (called residual phosphorus). Regardless of the size of the residual phosphorus, it represents the most recalcitrant forms of soil phosphorus that have little to do with soil fertility. However Guo et al. (Reference Guo, Yost, Hue, Evensen and Silva2000) observed that the residual phosphorus fraction decreased with exhaustive cropping in soils with permanent charge while there was no change in soils with variable charge.
Cross and Schlesinger (Reference Cross and Schlesinger1995) stated that one advantage of the Hedley scheme over previous methods is that the same soil sample is sequentially treated with the various reagents. As a result, one can establish the proportion of the different fraction in each sample. The largest disadvantage is that residual phosphorus often accounts for the largest proportion of total phosphorus, and we don’t really know whether it is organic or inorganic, or both. This was improved by Tiessen and Moir (Reference Tiessen, Moir and Carter1993) by adding a hot concentrated HCl extraction that separates the residual Po from residual Pi, but it is not commonly used. The organic SOP pools are based on modeling, while the inorganic SOP ones are measured, so they are fractions of the total inorganic phosphorus content of a soil.
Some scientists see sequential extractions as potentially misleading, because they may redistribute the different phosphorus species (Roel Merckx, personal communication, 2013). Perhaps what Guo et al. (Reference Guo, Yost, Hue, Evensen and Silva2000) found is such a case, but the differences due to mineralogy are noteworthy.
Below I have attempted to call each Hedley fraction by what I feel is the most appropriate functional name, and relate them to the organic phosphorus pools of the Century model (Parton et al. Reference Parton, Schimel, Cole and Ojima1987) as well as the Chang and Jackson (Reference Chang and Jackson1957) inorganic phosphorus fractions. They are:
Soil solution Pi: resin Pi, capturing phosphate anions in the soil solution.
Labile Pi: available Pi, or Olsen soil test available phosphorus (bicarb Pi). When another soil test is more effective in a region, such as Mehlich or Bray, it can be used instead. This is why I call this fraction labile and not bicarb.
Active Po: labile Po. Clearly, this is because it contributes directly to plant available phosphorus by rapid mineralization.
Sorbed Pi: The NaOH-extractable Pi fraction, phosphorus sorbed on the surfaces of iron and aluminum oxides (Garcia-Montiel et al. Reference Garcia-Montiel, Neill, Melillo, Thomas, Steudler and Cerri2000).
Slow Po: NaOH-extractable Po.
Primary weatherable phosphorus minerals: sonic Pi.
Passive Po: sonic Po + residual Po: extracted with hot, concentrated HCl (Tiessen and Moir Reference Tiessen, Moir and Carter1993) if measured.
Calcium-bonded Pi (Ca-Pi): dilute HCl-extractable Pi. May reflect the phosphorus fertilizer that has not reacted, as well as any apatite present.
Residual phosphorus: H2SO4-extractable Pi: Mostly occluded and reductant soluble Pi.
Needless to say, this classification is likely to require verification. All the Hedley fractions are incorporated in Fig. 14.3.
14.4.3 Organic Inputs, Metabolic and Structural Phosphorus Fractions
The organic inputs or organic resources include the additions to the soil of above- and below-ground plant litter, crop residues, animal manures, green manures, sewage and cadavers of animals that died in the soil. For nitrogen, the plant resources are split in terms of their quality according to their lignin:nitrogen ratios (Chapters 12 and 13). This is not directly applicable to phosphorus (Palm and Sanchez Reference Palm and Sanchez1991). For phosphorus, the main quality parameter is the C:P ratio, which Parton et al. (Reference Parton, Sanford, Sanchez, Stewart, Coleman, Oades and Uehara1989) used to split metabolic and structural phosphorus fractions.
Metabolic phosphorus comes from the decomposition of plant material that has a C:P ratio lower than 200, constituting the high-quality resource that is mineralized quickly and goes directly to the available phosphorus and soil solution phosphorus fractions or enters the active SOP pool (Nziguheba and Bünemann Reference Nziguheba, Bünemann, Turner, Frossard and Baldwin2005). The microbial biomass included in the metabolic phosphorus pool also immobilizes soil solution phosphorus; hence, the two-way flux in Fig. 14.3.
The structural phosphorus results from organic materials with C:P ratio of above 200, which is converted into the slow SOP pool and is then mineralized slowly into available phosphorus and soil solution phosphorus. This flux is one way, because there will be little immobilization by the slow SOP pool. Nziguheba (Reference Nziguheba and Bationo2007) confirmed these limits with African plant materials and related them to the percentage phosphorus content of plants.Footnote 2 The organic inputs that result in net mineralization had more than 0.25 percent P, while the ones that resulted in immobilization of phosphorus had less than that amount. Included in the mineralizing group is Tithonia diversifolia with 0.4 percent P in its tissue. Soil moisture and temperature affect the rate of these decomposition, mineralization and immobilization fluxes.
Terrestrial plants take up about 70–100 Tg P per year, all from the soil. Of that amount, Smil (Reference Smil2000) estimates that 18–22 Tg P are annually harvested, and thus removed in crops and livestock products. It is surprising that a major proportion of these removals by humans are recycled back to the soil. Smil (Reference Smil2000) estimates that the actual crop residue returns (1–2 Tg P per year) plus animal manure applications (6–10 Tg P per year) recycle back 7–10 Tg P per year, though the manure portion usually ends up in another field or in feedlots. Childers et al. (Reference Childers, Corman, Edwards and Elser2011) believe that the proportion recycled is only about 25 percent.
14.4.4 Active SOP Fraction
This is the first true organic phosphorus pool in Fig. 14.3, which is equivalent to the Labile Po fraction in the Hedley fractionation. It consists of microbial biomass and organic phosphorus that is not physically protected or chemically recalcitrant as described in Chapter 11. The C:P ratio of this organic phosphorus is about 30–80. This is the fraction recognized by Hedley and co-workers to be the organic phosphorus fraction most responsible for supplying phosphorus to plants, and, as in the case of nitrogen, the main organic one responsible for soil fertility provision. The microbial biomass included in the active pool also immobilizes available or soil solution phosphorus, hence the two-way flux in Fig. 14.3.
14.4.5 Slow and Passive SOP Fractions
Part of the active SOP pool that is not mineralized or taken up by plants decomposes into the slow SOP pool, with a C:P ratio of 90–200, and into the passive SOP pool with a C:P ratio of 20–200 (Parton et al. Reference Parton, Schimel, Cole and Ojima1987, Reference Parton, Sanford, Sanchez, Stewart, Coleman, Oades and Uehara1989). The nice thing about the Hedley fractionation is that the NaOH Po fraction and the Sonic Po fractions represent well the slow and the passive pools, respectively. What is not clear is whether the residual phosphorus fraction, extracted by concentrated sulfuric acid in the Hedley scheme, has any organic phosphorus present. Therefore, a question mark flux is placed in Fig. 14.3 between the passive SOP pool and the residual phosphorus fraction. As in the case of nitrogen, the slow and passive SOP pools will mineralize very slowly and most of the phosphorus will remain in the aggregates, either protected by coatings or in very chemically recalcitrant forms. They contribute little to soil fertility but much to aggregate stability and related soil physical properties. Again, the results of Guo et al. (Reference Guo, Yost, Hue, Evensen and Silva2000) suggest that there is a difference between soils with permanent charge and those with variable charge with regard to the plant availability of the residual phosphorus fraction.
14.5 Phosphorus Sorption and ReleaseFootnote 3
Phosphorus sorption (also known as phosphorus fixation and phosphorus retention) is the transformation of phosphorus in the soil solution into solid, sparingly soluble forms of phosphorus on the surface of soil clays by processes that make them not readily available to plants. The basic principles and practices had been well researched before the 1980s (Hedley and McLaughlin Reference Hedley, McLaughlin, JT Sims and Sharpley2005); hence, much of the literature quoted refers to that period.
The older term fixation implies some sort of capture, sequestration or immobilization. Here is where soil science nomenclature shows inconsistency. Biological nitrogen fixation is the capture of atmospheric N2, “fixing” it into reactive nitrogen forms by bacteria. Carbon sequestration is the capture of carbon from organic decomposition into slow or passive SOC pools, while nitrogen immobilization is the capture of inorganic nitrogen by bacteria into SON pools. In all cases, what is captured is eventually released by opposite processes, organic nitrogen decomposition, carbon dioxide emission and nitrogen mineralization. Even with biological nitrogen fixation, the reactive nitrogen is eventually released back to where it came from by denitrification and other processes. Phosphorus sorption is similar in the sense of capture and subsequent release. The different nomenclature most likely came from different research groups, but all the terms refer to the capture and release of the nutrient in question.
Three mechanisms of phosphorus sorption by soils are recognized:
precipitation, in three-dimensional amorphous or crystalline solids such as calcium phosphates;
adsorption, in two-dimensional films or sheets where phosphate ions are chemically bonded to reactive surfaces of soil clays (Pierzynski et al. Reference Pierzynski, McDowell, Sims, Sims and Sharpley2005), and
absorption, a slow, continuing reaction, where phosphate anions penetrate into the matrix of iron and aluminum oxides (Barrow Reference Barrow1974, Reference Barrow1985, Linquist et al. Reference Linquist, Singleton, Yost and Cassman1997)
The latter two are collectively called sorption in the soils literature, or sometimes the fast and slow reactions. Dissolution is the opposite process of precipitation while desorption is the opposite process of sorption.
I will use the term sorption to refer to precipitation, adsorption and absorption reactions, and the term release to cover both the dissolution of precipitated phosphorus and the desorption of sorbed phosphorus.
Although phosphorus sorption is a common occurrence in soils, it is a major management challenge in clayey soils that are high in iron and aluminum oxides.Footnote 4 Phosphorus sorption is not much of a problem in calcareous soils because the amounts sorbed are not large. It is very low in sandy soils and almost nil in coarse-sandy soils.
Phosphorus deficiency is a different issue; it can happen in any soil, and can be determined by soil tests. A phosphorus-deficient soil that can be corrected by an application of 10–20 kg P/ha is not a problem soil, but a soil that requires 200 kg P/ha to over 1000 kg P/ha to supply enough phosphorus for crop growth needs a different management approach. This is why there are no flux rates in the sorption–desorption fluxes in Fig. 14.3; they are very variable among soils and a global rate for cultivated soils is yet to be calculated.
A soil can be deficient in phosphorus without being a high-phosphorus-sorption soil, for example, the sandy Alfisols of the Sahel, but all high-phosphorus-sorption soils are also phosphorus-deficient, as shown by the clayey Oxisol shown in Fig. 14.1 at the beginning of this chapter. There are critical levels for both, as will be described later. Let us turn to the main processes of phosphorus sorption.
14.5.1 Precipitation from the Dissolution of Phosphorus Fertilizers
Precipitation is the first process that occurs to the phosphorus that has been added to soil as a fertilizer (Fig. 14.4). When a triple superphosphate granule containing mainly monocalcium phosphate [Ca(H2PO4)2·H2O] is added to an acid mineral soil, water moves into the hygroscopic granule, dissolves it and forms dicalcium phosphate (CaHPO4·2H2O) and phosphoric acid, which produces a solution saturated with P, as indicated in the Eq. 14.1.
In a dry soil, this solution is very acid (pH 1.5) and moves outward from the granule by mass flow to about 10 mm, releasing silica (SiO2), and iron, aluminum and manganese (Mn) ions. As the granule gets wetter the pH increases. The residue is the insoluble CaHPO4·2H2O, and the soluble phosphate ions precipitate with iron and aluminum oxides, represented as Al(OH)2+ in the following equation:
In moist soils, the pH increases, releasing aluminum and iron compounds and precipitating them as sparingly soluble phosphates.
These precipitates are some of the secondary phosphorus minerals previously described – crystalline calcium, iron and aluminum phosphates, amorphous iron and aluminum phosphates and iron or aluminum organophosphates. As these precipitates dissolve in an acid medium the H2PO4– ions are sorbed by the aluminum and iron oxides on the clay surfaces and are gradually released, as will be explained later.
It is important to realize that these reactions are not acid-forming and therefore soluble phosphorus fertilizers do not produce secondary acidity as some nitrogen fertilizers do (Chapter 9). Also, it is important to recognize that the H2PO4– and HPO42– ions the plants take up do not come directly from the water-soluble fertilizer but from fertilizer reaction products (White Reference White2006).
In acid soils that contain significant quantities of exchangeable aluminum ions (Al3+), phosphorus fertilizers can also be precipitated by exchangeable Al3+(Coleman et al. Reference Coleman, Thorup and Jackson1960). Exchangeable Al3+, however, must first be displaced into the soil solution by the calcium contained in fertilizers and then hydrolyzed into Al(OH)2+ or Al(OH)2+ before being able to precipitate H2PO4–. About 102 mg/kg P as H2PO4– can be precipitated by 1 cmolc/kg of exchangeable Al3+ after being hydrolyzed.
Diammonium phosphate (DAP) is the most common phosphorus fertilizer used in the tropics. It is important to contrast the different reaction that occurs when a DAP granule enters contact with water in the soil, as compared with TSP, described above.
The resulting phosphorus-saturated solution has a pH of 10.6 (Ganga Hettiarachchi, personal communication, 2013) totally the opposite from the strongly, short-lived, acid solution (pH 1.5) produced by the superphosphates. DAP causes less dissolution of iron and aluminum (Hedley and McLaughlin Reference Hedley, McLaughlin, JT Sims and Sharpley2005) and many of the phosphate ions remain in solution and are subject to sorption.
In alkaline soils (> pH 7), phosphate anions are precipitated by Ca2+ and Mg2+ cations, as relatively insoluble compounds, which are slowly dissolved by organic acids.
14.5.2 Adsorption
In acid soils (< pH 7) phosphate ions in a soil solution that is not saturated with phosphorus enter into ligand exchange reactions with OH– ions on the surface of iron and aluminum oxide particles or films. Ligand exchange occurs when an ion or molecule binds with metal ions, such as Fe3+, Al3+, Ca2+, Mg2+, K+, etc. In acid soils, aluminum and iron are the most abundant metals on the surface of clay particles. Oxide surfaces may exhibit net negative, net positive or net zero charge, as discussed in Chapter 8. Equation 14.4 illustrates a ligand exchange reaction at an acid pH value above the zero point of charge, which is the case in most topsoils:
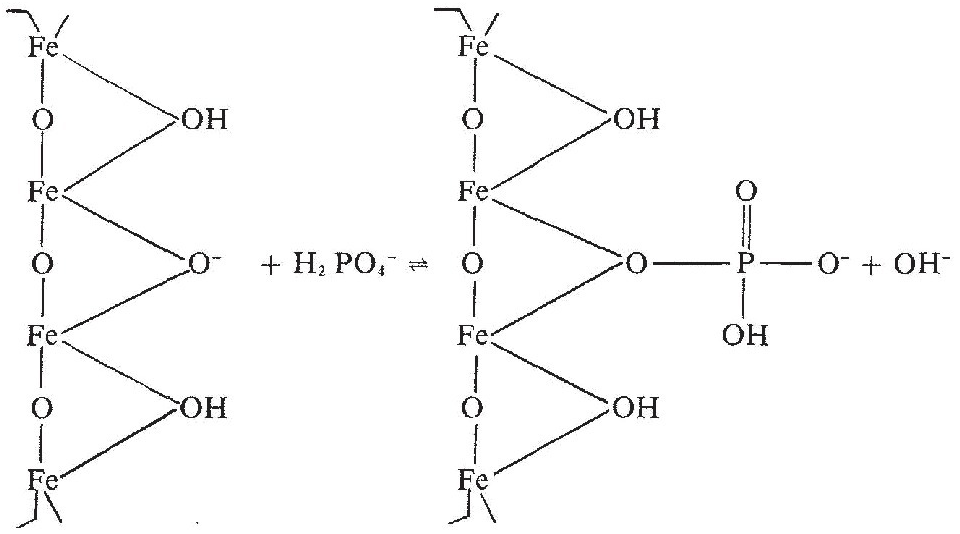
Above the zero point of charge, the sorbed phosphate ion displaces hydroxide (OH–) ions, and an increase in pH may take place. (This is sometimes referred to as “liming with phosphorus,” which does not make agronomic or economic sense.)
As Fig. 14.4 illustrates, the phosphate ions do not penetrate much into the micropores located inside macroaggregates, because of their slow diffusion and the discontinuities of the soil solution. In fact, most adsorbed phosphorus is on the surface of macroaggregates, the water films of which are in contact with the soil solution containing phosphate anions. Linquist et al. (Reference Linquist, Singleton, Yost and Cassman1997) found that phosphate ions were sorbed in a 188-μm layer around the macroaggregates of a clayey, oxidic Hawaiian Ultisol. Likewise, the precipitation products are also likely to be at the surface of macroaggregates unless they were present when microaggregates coalesced into macroaggregates (see Chapter 11). However, in Linquist et al.’s soil, 88 percent of the aggregates were macroaggregates (> 250 μm). The few microaggregates fully adsorbed all the phosphate throughout their mass, since most of them had a diameter smaller than 188 μm.
There is usually less adsorption in alkaline soils because they have low amounts of iron and aluminum oxide coats.
14.5.3 Absorption
It is common for well-aggregated soils that are high in iron and aluminum oxides to retain over 90 percent of the phosphate applied within the first hour of contact by adsorption or precipitation. Diffusion from this 0.2-mm layer into the rest of the macroaggregate (absorption) is a slow process, requiring at least 2 years to reach equilibrium (Linquist et al. Reference Linquist, Singleton, Yost and Cassman1997). Barrow (Reference Barrow1974) suggested that these slower absorption reactions are a consequence of the disruption of hydroxy-aluminum gels and the displacement of the silicate layer in the crystal structure by phosphate ions penetrating the mineral matrix. Some scientists suggest that the slow reaction is the formation of a second bond of a phosphorus molecule to an oxide surface (Russell Yost, personal communication, 2013).
At high phosphorus concentrations in the soil solution, H2PO4– is adsorbed in new sites arising from slow absorption (Rajan and Perrot Reference Rajan and Perrott1975), meaning that high phosphorus fertilization rates open new phosphorus sorption sites. This is particularly the case with Andisols, where allophane (a hydroxy-aluminum gel) is dominant.
14.5.4 Estimating Phosphorus Sorption in the Laboratory
Most soils retain some amount of phosphorus, which has been estimated by a variety of methods involving widely diverging amounts of phosphorus added and extracted.
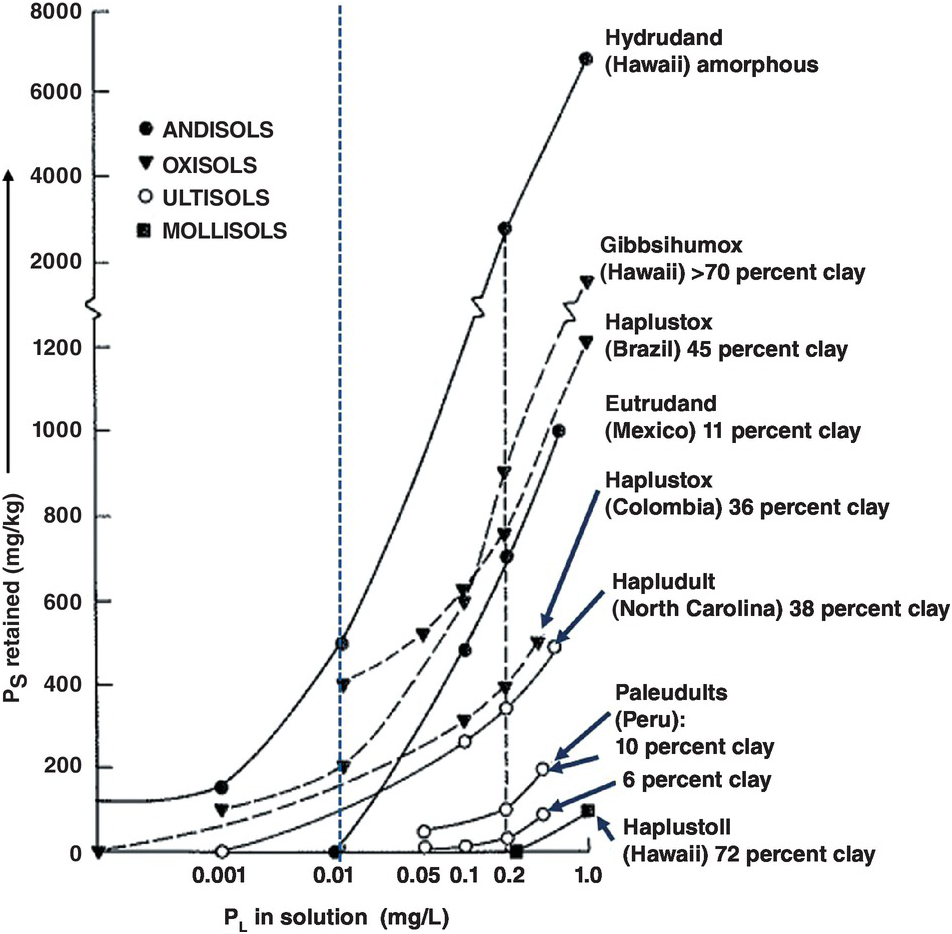
Perhaps the most widely used method is an adaptation of the Freundlich and Langmuir sorption isotherms – originally developed to describe the adsorption of a monomolecular layer of gas on a solid surface. Beckwith (Reference Beckwith1965) suggested that the data be plotted in terms of straightforward quantity–intensity relationships. The amount of phosphorus sorbed by the soil surfaces (PS) is expressed in mg/kg P, kg P/ha or μmol P/cm2 as the quantity factor plotted on the y axis; the phosphorus concentration in the soil solution (PL) is expressed in mg/L P or μmol P/cm3 as the intensity factor, plotted on the x axis at a logarithmic scale.
There are some conceptual problems with the use of sorption isotherms. Most methodologies focus on adsorption and ignore the absorption and precipitation processes, the latter being particularly important in calcareous soils. Pierzynski et al. (Reference Pierzynski, McDowell, Sims, Sims and Sharpley2005) emphasize that the parameters obtained with such equations are empirical artifacts and do not physically exist in soils. This is the third time in this book that we realize that empirical artifacts are used as practical tools of soil science (the previous ones being humic and fulvic acids in Chapter 11, and available nutrients from soil tests in Chapter 12). Barrow (Reference Barrow1985) observed that the term “isotherm” is inappropriate because it implies that temperature is the only factor affecting the shape of the curves. He suggested the more straightforward term “sorption curve,” which I prefer, to make terminology clearer with less jargon.
Fox and Kamprath (Reference Fox and Kamprath1970) developed the most widely used analytical procedure for developing phosphorus sorption curves. A known amount of soil is equilibrated with different concentrations of Ca(H2PO4)2·H2O dissolved in 0.01M CaCl2 and shaken for 30 minutes, twice a day for 6 days, after which the phosphorus remaining in solution (PL) is assumed to be in equilibrium with the sorbed PS. A 0.01M CaCl2 solution has been a reasonable approximation of the soil solution from the analytical standpoint (Rajan and Fox Reference Rajan and Fox1972). The amount of PS sorbed by the soil that results in a PL soil solution concentration of 0.2 mg/L (0.2 ppm) was then considered the agronomically relevant estimate of phosphorus sorption. The Fox–Kamprath method still dominates tropical soil science, but it fell out of favor in the soil chemistry community for some years. Pierzynski et al. (Reference Pierzynski, McDowell, Sims, Sims and Sharpley2005) indicate that it has come back in vogue, because the sorption curves accommodate the high phosphorus levels present in manures, organic wastes and heavily fertilized soils (1–8 mg/L PL).
This method, however, does not differentiate between the fast adsorption and the slow absorption processes, which can continue to decrease PL for weeks or months (Barrow Reference Barrow1985).
Figure 14.5 shows several representative phosphorus sorption curves encompassing a wide range of soils (all topsoils). As a group, Andisols and related andic soils, high in allophane or imogolite, are the highest phosphorus retainers with about 500 mg/kg of added phosphorus to reach 0.01 mg/L PL. Clayey, oxidic soils, including kaolinitic soils with oxide coatings, mainly Oxisols, Ultisols and rhodic Alfisols, follow, with values ranging from 100 mg/kg PS to 400 mg/kg PS to reach 0.01 mg/L PL. Coarse-textured Ultisols retain little phosphorus. Mollisols with permanent-charge minerals sorb very little phosphorus, as illustrated by the Haplustoll from Hawaii, with 72 percent clay.
Examples of phosphorus sorption curves determined by the Fox and Kamprath (Reference Fox and Kamprath1970) method. The general critical level for crops is 0.2 mg/L (0.2 ppm) PL in the x axis (right dotted line). Instead I propose that those soils with a PL of 0.01 mg/L or less be considered as those with high phosphorus sorption capacity (left dotted line).
14.5.5 Proposed New Limit for Soils with High Phosphorus Sorption Capacity
The critical level of 0.02 mg P/L as the best estimate of what plants need is a gross overstatement when compared with critical soil test levels, which, as described later, represent a well-correlated empirical estimate with plant uptake. Table 14.5 shows the overestimate, where critical soil test levels on the order of 150 mg/kg (ppm) of available phosphorus corresponds to a soil solution level of 0.2 mg/L PL, as originally suggested by Fox and Kamprath (Reference Fox and Kamprath1970). In contrast, a 0.012–0.006 mg/L PL relates to critical soil test levels orders of magnitude lower (3–30 mg/kg of available phosphorus), which is the range encountered in practice (8–30 mg/kg P).
| Soil solution PL (mg P/L) | Soil test values (available phosphorus [mg/kg]) | ||
|---|---|---|---|
| Bray 1 | Mehlich 1 (North Carolina) | Olsen | |
| 0.003 | 2 | 6 | 12 |
| 0.006 | 3 | 9 | 15 |
| 0.012 | 14 | 20 | 30 |
| 0.025 | 28 | 35 | 44 |
| 0.05 | 55 | 57 | 72 |
| 0.1 | 72 | 86 | 93 |
| 0.2 | 144 | 158 | 164 |
| 0.4 | 156 | 209 | 160 |
| 1.6 | 339 | 337 | 295 |
Therefore I propose that soils with PL of 0.01 mg/L or less be considered to have high phosphorus sorption capacity. This is a more realistic PL critical level relative to the amount of PS sorbed to provide that critical soil test value. A value of 1 mg/kg PS sorbed is roughly equivalent to 2 kg P/ha in most soils (100–500 kg P/ha) except in Andisols, where because of low bulk density the conversion factor would be about 1.4 (70–350 kg P/ha).
14.5.6 Estimating High Phosphorus Sorption in the Field
Luckily, a complex metric like high phosphorus sorption can be estimated in the field for topsoils using the FCC system created by Buol et al. (Reference Buol, Sanchez, Cate, Granger, Bornemisza and Alvarado1975), described in Chapter 5. High phosphorus sorption is identified by two FCC attributes as show in Table 14.6.
Except for the first two methods that are used for the i attribute, and one of those used for the x attribute, all are field tests. In addition the x attribute can be quantitatively detected by near-infrared spectroscopy, making this technique very useful, as shown in Chapter 5. Unfortunately, this technique cannot currently be used for identifying soil solution PL or in soil tests for available phosphorus.
14.5.7 Geographical Distribution of Soils with a High Phosphorus Sorption Capacity
The tabular distribution of soils with high phosphorus sorption capacity by tropical geographic region is shown in Table 14.7. About half of these soils are in tropical America, covering 32 percent of the region, followed by tropical Asia, with a regional prevalence of 30 percent, mainly in the upland areas with Oxisols, Ultisols and Andisols. Tropical Africa has a low prevalence of soils with high phosphorus sorption capacity, and they occur mostly in the Lake Victoria Basin. The only biome in the world with more than 20 percent of such soils is the tropical–subtropical moist broadleaved forest.
| Region and biome | High phosphorus sorption | |
|---|---|---|
| Regions: | Area (million hectares) | Regional area (%) |
| Tropical Africa | 171 | 11 |
| Tropical America | 601 | 32 |
| Tropical Asia | 241 | 30 |
| Total tropics | 1013 | 22 |
| Temperate | 113 | 2 |
| Boreal | 0 | 0 |
| World | 1126 | 9 |
| Biomes: | ||
| Tropical–subtropical moist broadleaved forest | 421 | 21 |
| Tropical–subtropical grassland, savanna, shrubland | 157 | 8 |
| Temperate broadleaf and mixed forest | 19 | 2 |
| Tropical–subtropical dry broadleaved forest | 16 | 4 |
14.5.8 Influence of the Core Soil Properties on Phosphorus Sorption
Reminding ourselves that in phosphorus sorption we are dealing with the topsoil, the influences of the three core properties are considered below.
Texture
Among soils of similar clay mineralogy, phosphorus sorption increases with increasing clay content. Lopes and Cox (Reference Lopes and Cox1979) found that clay content explains 92 percent of the variability in phosphorus sorption capacity of Cerrado soils, which largely have kaolinitic and oxidic mineralogy. Figure 14.5 shows that the slopes of phosphorus sorption curves for the Ultisols and Oxisols become steeper as texture becomes finer. Among the Ultisols, in order to reach the old 0.2 mg/L PL level, the sandy Paleudult from Yurimaguas, Peru, with 6 percent clay, retains 24 mg/kg PS, while the one with 10 percent clay retains 80 mg/kg PS, but the Hapludult from North Carolina, with 38 percent clay, retains 340 mg/kg PS.
Similar relationships are found among Oxisols, which by definition must have at least 15 percent clay in the topsoil. The loamy Haplustox from the Llanos Orientales of Colombia, with 36 percent clay, sorbed 390 mg/kg PS to reach 0.2 mg/L PL. Another Haplustox from the Cerrado of Brazil, with 45 percent clay, sorbed almost twice that amount, 750 mg/kg PS. A Gibbsihumox from Hawaii, with more than 70 percent clay, sorbed 900 mg/kg PS. These relationships do not follow a straight line because of variation in the amount and degree of crystallinity of the oxide minerals. Many positive correlations have been reported between clay contents and phosphorus sorbed in Oxisols of Brazil (Syers et al. Reference Syers, Evans, Williams and Murdock1971, Leal and Velloso Reference Leal and Velloso1973aReference Leal and Vellosob, Oliveira et al. Reference Oliveira, Lourenço and Goedert1982, de Sousa and Lobato Reference de Sousa, Lobato, Yamada, Stipp and Abdalla2004, Lopes et al. Reference Lopes, Wiethölter, Guilherme and Silva2008). Texture, therefore, is the most important determinant of phosphorus sorption for areas with soils of similar clay mineralogy.
Mineralogy
The influence of clay mineralogy is well illustrated by the three soils from Hawaii in Fig. 14.5 all of which have more than 70 percent clay. The Mollisol (Haplustoll) sorbed no phosphorus within the agronomic range because of the preponderance of smectite. This is a typical example of soils that are dominated by layer-silicate permanent minerals, which pose little phosphorus sorption problems. To reach the 0.2 mg/L PL level, the Oxisol (Gibbsihumox), which consists primarily of the aluminum hydroxide gibbsite, sorbed about 900 mg/kg P. The Andisol (Hydrudand), composed primarily of amorphous allophane and finely divided gibbsite and goethite, sorbed about 2800 mg/kg P. Among soils with high contents of sesquioxides, it is well established that the less crystalline they are, the higher their phosphorus sorption capacity because of greater surface area (Colwell Reference Colwell1959, Pratt et al. Reference Pratt, Peterson and Holzley1969, Fox et al. Reference Fox, Hassan and Jones1971, Kamprath Reference Kamprath1973, Jackman et al. Reference Jackman, Jones, Yost and Babcock1997).
Because of the high contents of amorphous colloids, texture is often meaningless in Andisols. Phosphorus sorption, however, is positively correlated with X-ray amorphous colloid content and with surface area (Schalscha et al. Reference Schalscha, Pratt and Soto1974). Andisols can also develop considerable phosphorus sorption capacity rather rapidly. For example, Fox (Reference Fox1974b) studied a sequence of volcanic deposits of known age along the Irazú volcano in Costa Rica. He measured 70 mg/kg PS sorbed in a ~ 4-year-old deposit near the crater. Phosphorus sorption increased as the proportion of silica in the amorphous fraction decreased with weathering (Fox et al. Reference Fox, Hassan and Jones1971).
Andisols, as a soil order, are the highest phosphorus-retainers. As mentioned above, because of their generally low bulk densities (0.4–0.7 t/m3) the amounts indicated on the y axis of the sorption curves cannot be multiplied by a factor of 2 for conversion to kg P/ha as in most other soils. When an adjustment is made for bulk density, the PS requirements become much lower. A factor of about 1.4 can be used, assuming a 50 percent porosity. For example, the actual PS requirement of the Hydrudand shown in Fig. 14.5 is much less than the y axis indicates, but is still an enormous amount (Fox Reference Fox1974aReference Foxb).
SOM
In soils with high oxide contents, organic radicals of SOM can block exposed hydroxy groups on the surfaces of iron or aluminum oxides and thus decrease phosphorus sorption (Moshi et al. Reference Moshi, Wild and Greenland1974, Appelt et al. Reference Appelt, Coleman and Pratt1975). This is one reason why topsoils of Oxisols and Andepts with texture and clay mineralogy similar to their subsoils retain considerably less phosphorus than the subsoil layers. The main difference between the topsoil and subsoil horizons is the generally higher SOM content of the topsoils. Negative correlations between SOM content and phosphorus sorption in horizons of the same soil are often reported in the literature (Fassbender Reference Fassbender1969, Hinga Reference Hinga1973, Leal and Velloso Reference Leal and Velloso1973aReference Leal and Vellosob), but these correlations do not necessarily reflect a cause–effect relationship because SOM does not sorb or retain phosphorus.
14.5.9 Ways to Decrease Phosphorus Sorption
The high phosphorus sorption capacity of soils can be ameliorated by liming and silicate amendments, by adding inorganic phosphorus fertilizers and, to a lesser extent, by repeated applications of high-quality leafy organic inputs.
Liming
Liming aluminum-toxic topsoils to a pH of 5.5 neutralizes exchangeable Al3+ (Eqs. 9.9 and 9.10). As mentioned previously, 1 cmolc/kg of exchangeable Al3+ when hydrolyzed may precipitate up to 102 mg/kg P as aluminum phosphates, but such precipitation does not always happen because of incomplete hydrolysis (Syers et al. Reference Syers, Evans, Williams and Murdock1971).
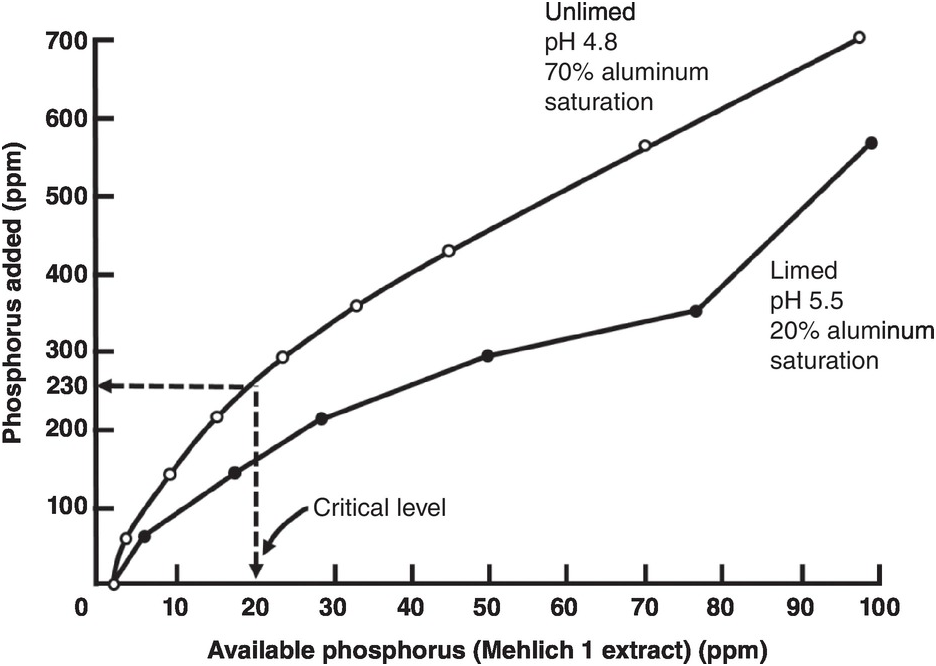
Figure 14.6 shows the decrease in phosphorus sorption when an Oxisol from Panama was limed to pH 5.5. In this case less than half the phosphorus application rate was needed in the limed soil to approach the critical soil test level of available phosphorus in relation to the unlimed soil, as aluminum saturation decreased from 70 percent to 20 percent. This is an effective way to reduce phosphorus sorption in acid soils.
Liming a strongly acid Oxisol from Panama decreases phosphorus sorption to attain the critical soil test level for millet.
Liming, however, has little or no influence in decreasing phosphorus sorption in soils with pH values of 5.0–6.0, which generally have low aluminum saturation levels (0–45 percent). These results have been observed in Oxisols of South Africa (Reeve and Sumner Reference Reeve and Sumner1970), Brazil (Leal and Velloso Reference Leal and Velloso1973b), Hawaii (Fox and Benavides Reference Fox and Benavides1974); Ultisols of North Carolina (Woodruff and Kamprath, Reference Woodruff and Kamprath1965); and Andisols of the Island of Reunion (Truong et al. Reference Truong, Bertrand, Burdin and Pichot1974). Phosphorus sorption by iron and aluminum oxides per se is not affected by liming. The effect of liming is to prevent phosphate ions from precipitating with exchangeable Al3+ after hydrolysis. That’s why it does not work when aluminum saturation is low.
There are many soils that retain large quantities of phosphorus at low levels of aluminum saturation; the most common case is with Andisols. Liming such soils could trigger detrimental effects of overliming (Chapter 9).
In their pioneering research on the Cerrado, de Freitas et al. (Reference de Freitas, McClung and Lott1960) suspected that liming may have a positive effect on SOP. Awan (Reference Awan1964), working in Honduras, found that increased yields of maize, sorghum and cowpea due to liming were associated with increased mineralization of SOP, thus confirming the suspicions of de Freitas’ group.
Silicate Applications
Silicate applications, usually as calcium silicate (CaSiO4), sodium silicate or basic slag can also decrease phosphorus sorption and increase its uptake by crops in certain Oxisols and Andisols. In some cases, the increased phosphorus uptake may result from a direct growth response to silica in soils that are very deficient in this element, but in many others, there is a direct effect of decreasing phosphorus sorption. Silicate anions replace phosphate ions from the sorption sites, increasing the availability of phosphorus (Silva Reference Silva1971). Table 14.8 shows similar reductions in phosphorus fixation with CaSiO4 and calcium carbonate (CaCO3) when both were applied at rates sufficient to neutralize the exchangeable Al3+ in an Oxisol from Brazil which was not deficient in silicon. The table also shows the decrease in phosphorus sorption with phosphorus fertilization alone. Most of the phosphorus application rates are very high (multiply by 2 to convert to kg P/ha).
| Amendment rate to neutralize 1.45 cmolc Al/kg | Amendment | Applied phosphorus (mg/kg ) | |||
|---|---|---|---|---|---|
| 0 | 380 | 460 | 540 | ||
| Decrease in phosphorus sorption (%) | |||||
| 0 | None | 0 | 44 | 54 | 65 |
| 1 × exchangeable Al3+ | CaCO3 | 18 | 59 | 68 | 77 |
| CaSiO4 | 24 | 65 | 77 | 84 | |
| Combined | 18 | 65 | 71 | 82 | |
| 2 × exchangeable Al3+ | CaCO3 | 16 | 62 | 77 | 85 |
| CaSiO4 | 28 | 75 | 82 | 91 | |
| Combined | 32 | 74 | 77 | 85 | |
Silicate applications are routinely done in some Oxisols of Brazil. Table 14.8 also shows that doubling the lime and silicate rates to neutralize twice the exchangeable Al3+ decreases phosphorus sorption even more, but then there is the danger of overliming. One practical implication is that phosphorus sorption curves should be constructed after lime and silicate applications in order not to overestimate the amount of phosphorus required.
Organic Inputs
Plant-based organic inputs (crop residues, biomass transfers, leaves of nitrogen-fixing trees) generally cannot provide sufficient phosphorus to meet crop requirements because their phosphorus contents are low (0.1–0.2 percent, 0.01–0.02 mg/kg P) (Palm Reference Palm1995). The use of plant organic materials is also hampered by limited amounts of dry matter available. Organic inputs, particularly those with C:P ratios lower than 200 and thus considered high quality, can temporarily decrease phosphorus sorption because the organic anions produced during decomposition compete with H2PO4– for adsorption sites (Nziguheba et al. Reference Nziguheba, Palm, Buresh and Smithson1998, Kpomblekou-a and Tabatabai Reference Kpomblekou-a and Tabatabai1994). Nziguheba et al. (Reference Nziguheba, Merckx, Palm and Rao2000) also showed no differences in phosphorus sorption during the first maize crop in an Oxisol, but after four consecutive crops that received 5 t/ha per crop of organic inputs, PS sorption to provide 0.2 mg/L PL significantly decreased from 300 mg/kg PS with inorganic fertilizers alone to about 230 mg/kg PS with the high-quality organic Tithonia diversifolia.
14.5.10 Phosphorus Release
Eventually, much of the phosphorus sorbed is released back to the soil solution, particularly when plant roots remove phosphate ions from this solution, creating a concentration gradient that causes phosphate ions to be released from sorbed sites or precipitates, and to move towards the roots by diffusion.
Phosphorus release is not quantitatively the reverse of phosphorus sorption. There is a hysteresis. Linquist et al. (Reference Linquist, Singleton, Cassman and Keane1996, Reference Linquist, Singleton, Yost and Cassman1997) and Wang et al. (Reference Wang, Yost and Linquist2001) demonstrated that the effect of aggregate size on sorption differed from that on desorption. They estimated the phosphorus release of different-sized aggregates in their Hawaiian Ultisol using a continuous flow of the Mehlich 1 soil test extractant. At 56 hours, all aggregate sizes released phosphorus but the release was larger from microaggregates (< 250 μm), which were depleted of most of the sorbed phosphorus in 2 years. Linquist et al. (Reference Linquist, Singleton, Yost and Cassman1997) concluded that the release of sorbed phosphorus is faster in oxidic soils with a large proportion of microaggregates. The conundrum associated with this conclusion is that tillage is necessary to incorporate significant quantities of phosphorus fertilizers but macroaggregates are often destroyed by tillage (Chapter 6). How might this affect phosphorus sorption and release? This could be a future research topic.
14.6 Soil Tests for Available Phosphorus
Phosphorus soil tests are empirical determinations that attempt to extract, in a few minutes, an amount of phosphorus that will correlate with plant uptake of phosphorus throughout the crop’s life. A description of the processes involved is in Chapter 12. Basically, soil tests attempt to estimate the labile or “bioavailable” pool in one shot, which according to Pierzynski et al. (Reference Pierzynski, McDowell, Sims, Sims and Sharpley2005) consists of adsorbed phosphorus, slightly soluble phosphorus compounds, phosphorus in organic inputs and some organic phosphorus forms. When used and interpreted properly, soil tests can distinguish soils that will probably respond to phosphorus fertilization from those that are not likely to do so. The point of inflection is called the critical soil test level. Soil tests do not tell you how much phosphorus to add.
The main phosphorus soil tests used in the tropics, described in Table 14.9, tackle forms of aluminum and calcium phosphates, and are basically empirical. The Bray tests are the oldest used in the tropics. The Olsen or modified Olsen with ethylenediaminetetraacetic acid (EDTA) tests are probably the most widely applicable and have the advantage that they represent the actual bicarb Pi in the Hedley fractionation. The Mehlich 1 or North Carolina extraction is used widely in acid tropical soils.
| Name | Extractant | Year released | Applicability |
|---|---|---|---|
| Bray I | 0.03 M NH4F + 0.025 M HCl | 1945 | Not for calcareous soils. Good for phosphate rock applications. Correlates with organic phosphorus in unfertilized soils. |
| Bray 2 | 0.03 M NH4F + 0.1 M HCl | 1945 | Widely used. Overestimates phosphate rock solubility. |
| Olsen | 0.5 M NaHCO3 at pH 8.5 | 1954 | Wide range. |
| Modified Olsen | 0.5 M NaHCO3 + 0.01M EDTA at pH 8.5 | 1960s | Widely used in a broad range of soils. A multinutrient extractant. |
| Resin P | Resin acting as a sink for phosphorus | 1955 | Used in Brazil; but use of resin bags is cumbersome – use of beads is not. |
| Mehlich 1 (double acid, North Carolina) | 0.05 M HCl + 0.0125 M H2SO4 | 1953 | Used widely in kaolinitic soils, pH < 7. Overestimates phosphate rock solubility. |
| Mehlich 3 | 0.015 M NH4F + 0.2 M CH3COOH +0.25 M NH4NO3 +0.013 M HNO3 +0.001M EDTA | 1984 | A multinutrient extractant. Extracts more phosphorus in clayey soils, and less phosphorus in soils fertilized with phosphate rock than Mehlich 1 (Bortolon and Gianello Reference Bortolon, Gianello, Alves, Guimarães and de Magalhaes2006). Overestimates phosphate rock solubility. |
| Houba | 0.01 M CaCl2 | 1990 | A multinutrient extractant (Houba et al. Reference Houba, Novozamsky, Lexmon and van der Lee1990). Still experimental in the tropics. Tries to approximate phosphorus in the soil solution. |
Routine Methods
The phosphorus sorption curves shown earlier in Fig. 14.5 are limited to research laboratories. The time requirement of 6 days and the analytical precision required to determine fractions of 1 mg/kg prevent their routine use in service laboratories. That is why soil test methods continue to be useful.
What is missing in the literature is a meta-analysis of algorithms that translate each major soil test method with others on a wide range of soil textures, mineralogy and SOM levels for different crops across the tropics, and with the appropriate boundary conditions. Comparisons among the different methods have been done with soils of Germany and Austria (Wuenscher et al. Reference Wuenscher, Unterfrauner, Peticzka and Zehetner2015), which are mostly permanent-charge soils. They found highly significant correlations (p < 0.001) between the extraction methods of CaCl2, Olsen, Bray 2 and Mehlich 3 that are – with the exception of the modified Olsen method – those most commonly used in the tropics. This is useful but the next logical step, comparing the critical soil test levels for a variety of plants, remains to be done.
14.7 Plant Phosphorus Requirements
This discussion now shifts from the soil to the plant. Plant roots remove phosphate ions from the soil solution, creating a concentration gradient and causing phosphate ions to move towards the roots by diffusion.
14.7.1 External and Internal Phosphorus Requirements
Plant species and cultivars (varieties, hybrids, accessions) differ in their external phosphorus requirements (critical soil test level – varies with soils) and internal phosphorus requirements (phosphorus content in the plant tissue or in grain).
Data for the main tropical food crops have been compiled by Rao et al. (Reference Rao, Friesen, Osaki and Pessarakli1999) and show major differences in internal phosphorus requirements at high yield levels of the principal crops (Table 14.10). The internal phosphorus requirements from grain legumes are the highest, showing the higher needs for phosphorus in nitrogen-fixing crops. Tropical root crops like cassava and sweet potato have the lowest. Potato and the main cereals rank in between. Among cereals, wheat has the highest internal phosphorus requirement and rice the lowest, with maize in between. Data from other crops can be calculated from data presented in Table 12.2 of Chapter 12.
| Crop | Plant part | Yield (t/ha) | Phosphorus uptake (kg P/ha) | Internal phosphorus requirement in plant part (% P) |
|---|---|---|---|---|
| Maize | Grain | 9.4 | 26 | 0.28 |
| Total | 19.5 | 44 | 0.23 | |
| Rice | Grain | 5.4 | 10 | 0.19 |
| Total | 11.0 | 16 | 0.15 | |
| Wheat | Grain | 2.7 | 12 | 0.45 |
| Total | 6.1 | 15 | 0.25 | |
| Cassava | Roots | 13.5 | 13 | 0.10 |
| Total | – | 24 | – | |
| Sweet potato | Tubers | 10.5 | 18 | 0.17 |
| Total | 16.7 | 30 | 0.18 | |
| Potato | Tubers | 11.9 | 34 | 0.29 |
| Total | 18.3 | 44 | 0.24 | |
| Soybean | Grain | 3.0 | 22 | 0.73 |
| Total | 6.7 | 25 | 0.37 | |
| Common bean | Grain | 0.9 | 4 | 0.38 |
| Total | – | 9 | – |
A simpler situation to illustrate the concept is with forage species as the entire above-ground plant is harvested. The internal phosphorus requirement of the grasses and legumes shown in Table 14.11 lie within the same range, even though nitrogen-fixing legumes like the ones indicated are supposed to have larger requirements for phosphorus, as was the case for soybeans and beans in Table 14.10. The differences in the case of these forage species seem to be related to the general soil fertility and phosphorus status of their center of origin.
| Plant type | Species or genera | Internal phosphorus requirement (%) | External phosphorus requirement Bray 2 (mg/kg )c |
|---|---|---|---|
| Legumes: | Stylosanthes spp.a | 0.17 | 2.5–5.5 |
| Centrosema pubescens | 0.16 | ||
| Desmodium spp.b | 0.22 | 3.0–11.4 | |
| Perennial soybean (Glycine wightii) | 0.23 | ||
| Alfalfa (Medicago sativa) | 0.25 | ||
| Grasses: | Andropogon gayanus CIAT 621 | 0.11 | 5.0 |
| Brachiaria decumbens CIAT 606 | 0.12 | 7.0 | |
| Molasses grass (Melinis minutiflora) | 0.18 | ||
| Guinea grass (Panicum maximum) CIAT 604 | 0.19 | 10.0 | |
| Kikuyu grass (Pennisetum clandestinum) | 0.22 | ||
| Rhodes grass (Chloris gayana) | 0.25 | ||
a S. hamata (Townsville Stylo) for internal requirement; S. capitata (five accessions) and S. guianensis (two accessions) for external requirement.
b D. intortum for internal requirement; D. ovalifolium, D. scorpirius and D gyroides for external requirement.
c For 80 percent maximum yield.
The legumes Stylosanthes humilis and Centrosema pubescens originated in low-phosphorus Oxisols and Ultisols of Latin America while the higher-phosphorus-requiring perennial soybean and alfalfa arose from temperate regions high in available phosphorus and other nutrients. The same situation takes place among the grass species. Andropogon gayanus, Brachiaria decumbens and molasses grass arose from low-fertility areas of tropical Africa, Guinea grass and kikuyu grass from medium-fertility regions of tropical Africa, and Rhodes grass from high-fertility areas of southern Africa.
14.7.2 Genotype Adaptation to Low Available Phosphorus
It is now possible to select varieties or cultivars of crop and pasture species that have a lower external phosphorus requirement for maximum growth than those presently used. Fortunately, aluminum tolerance and “low-phosphorus tolerance” often occur jointly because the latter seems to be associated with the plant’s ability to absorb and translocate phosphorus in the presence of high levels of aluminum in the soil solution and/or root tissue (Chapter 9).
Embrapa, the Brazilian Agricultural Research Corporation, has been conducting research on selecting maize cultivars for tolerance to low phosphorus and high aluminum saturation since the 1970s in the Cerrado. Perentoni et al. (Reference Perentoni, Alves, Gama, Coelho, Guimarães, Guimarães, Pacheco, Magalhães, Godoy, Oliveira, Meireles, Vasconcelos, Souza, Schaffert and Alves2006) have found maize hybrids that are high-yielding, aluminum-tolerant and are able to yield 6–8 t/ha of grain with as little as 5 mg/kg of available phosphorus by the Mehlich 1 method.
Reviewing the genetics of phosphorus tolerance in maize, Vasconcelos and Raghothama (Reference Vasconcelos, Raghothama and Alves2006) concluded that it is a complex trait involving several genes and that there is no phosphorus-efficiency gene, but there is an opposite one; the Bat-3 gene is strongly suppressed by phosphorus deficiency in maize and sorghum. Similar advances in identifying genes and quantitative trait loci are being found in rice (Ismail et al. Reference Ismail, Gatula, Heuer, Lu, Wissuwa and Alves2006) and wheat (Silva et al. Reference Silva, Delatorre, Bertoldi and Alves2006).
The physiological mechanisms responsible for these cultivar and species differences are not well understood. Rao et al. (Reference Rao, Friesen, Osaki and Pessarakli1999) provide a comprehensive review and divide the processes into those that improve phosphorus acquisition (uptake) and those that improve phosphorus utilization inside the plant.
An early review by Salinas and Sanchez (Reference Salinas and Sanchez1976) observed that cultivars and species that are more tolerant of low available soil phosphorus can either acquire it at a faster rate or translocate it to the tops at a faster rate than sensitive cultivars or species. In some cases, tolerant cultivars have a slower growth rate that enables them to operate at a low level of external phosphorus supply. In a later review, Rao et al. (Reference Rao, Friesen, Osaki and Pessarakli1999) considered that crops and pastures tolerant to low phosphorus have low phosphorus requirements to start with, and/or higher uptake efficiency and/or higher utilization efficiency.
The following is largely based on Rao et al.’s (Reference Rao, Friesen, Osaki and Pessarakli1999) review as well as Sanchez and Salinas (Reference Sanchez and Salinas1981) and Brazilian data in the volume edited by Alves et al. (Reference Alves, Guimarães, de Magalhães, Schaffert, Coelho, Bahia-Filho and Santana2006).
14.7.3 Effective Root Volume
Differences in root growth, root length, diameter, duration and distribution explain differences among cultivars on phosphorus uptake efficiency in low-phosphorus soils (Rao et al. Reference Rao, Friesen, Osaki and Pessarakli1999). Even more important are two features, root hairs and mycorrhizal associations.
Root hairs can triple the acquisition volume of roots, and since hairs are perpendicular to the roots they exploit wider volumes (Rao et al. Reference Rao, Friesen, Osaki and Pessarakli1999, Vandamme et al. Reference Vandamme, Renkens, Pypers, Smolders, Vanlauwe and Merckx2013).
Mycorrhizal associations with roots are extremely important for most tropical plants and increase the effective root area from 2 to over 800 times. Mycorrhizal plants take up not only the soil solution Pi and labile Pi and Po pools but are also able to access sorbed (NaOH) Pi (see Chapter 10).
14.7.4 Rhizosphere Exudation
Plant roots continually exude complex mixtures of carbon compounds into the rhizosphere. This includes organic acids such as citric, malic, acetic, lactic, oxalic, piscidic acids, and others. These acids dissolve solid fractions of inorganic and organic phosphorus, bringing it into the labile and soil solution phosphorus.
Some acids can be quite specific. Ae et al. (Reference Ae, Okada, Yoshihara and Johansen1990) found that piscidic acid exudates by pigeon pea dissolved some of the iron-bound phosphorus in a red Alfisol but did not react with calcium-bonded phosphorus in an adjacent black Vertisol in Patancheru, India. In a phosphorus-deficient (2 mg/kg Olsen P) Oxisol of western Kenya, George et al. (Reference George, Gregory, Robinson and Buresh2002) found that the phosphorus-accumulating shrub Tithonia diversifolia slightly acidified the rhizosphere, lowering the pH from 4.8 to 4.5, causing a significant decrease in the soil solution Pi, sorbed Pi and the slow Po fractions up to about 6 mm distance, suggesting that part of these fractions were taken up by the plant. In contrast, the legume Tephrosia vogelii increased the rhizosphere pH from 4.8 to 5.4, which decreased the slow Po fraction. While such research cannot establish quantitative effects, or whether it is the effect of organic acid exudation or of a proton balance, George et al.’s data imply that these two very different agroforestry species may be able to tap sorbed Pi and the slow organic Po fraction. It is interesting that the labile Pi and active Po fractions were not affected.
Roots can secrete acid phosphatase ectoenzymes, which they do faster and in larger quantities when phosphorus deficiency occurs, breaking down some organic phosphorus pools. Rao et al. (Reference Rao, Friesen, Osaki and Pessarakli1999) also suggested that species tolerant to low available phosphorus levels, such as Stylosanthes guianensis and Brachiaria decumbens secrete phytase, the enzyme that breaks down inositol hexaphosphate (the main constituent of organic phosphorus) in these phosphorus-deficient soils. The rhizosphere processes are an evolving science, with few hard data at the field level.
14.8 Phosphorus Fertilization
14.8.1 Phosphorus Fertilizers
All phosphorus fertilizers, including the organic ones, originate from phosphate rock. Superphosphates and other soluble inorganic fertilizers are the product of reacting phosphate rock with acids. Organic fertilizers come from plant or animal products that originated from the dissolution of phosphate rock. The main fertilizers are listed in Table 14.12.
| Sources | Deposits or properties | Characteristics | Reactivity | Contents | Comments |
|---|---|---|---|---|---|
| Igneous and metamorphic phosphate rocks |
| Ca10(PO4)6F2, Ca10(PO4)6(OH)2 | Very low reactivity, especially fluorapatite | 16–18% P | Nil for direct application; 15–20 percent of world phosphate rock production, used for making soluble phosphorus fertilizers |
| Sedimentary phosphate rocks | Central Florida, Togo, Ca10–x–y,NaxMgy(PO4)6F2, formed mainly in marine environments | Francolite (carbonate-substituted apatite) | Moderate reactivity | 15–17% P | 80% of world phosphate rock production, and type of phosphate rock most commonly used for soluble P fertilizer production |
| Biogenic phosphate rocks |
| Ca10(PO4)6(OH)2 and carbonate-substituted Ca10(PO4)6(OH)2 | High reactivity; good for direct application in acid soils | 4–5% P (Peru) | Locally important; 1–2% of world phosphate rock production; Many are used for direct application |
| Partially acidulated phosphate rock | Phosphate rocks + usually 50 percent less acid than for producing superphosphates | Low reactivity Phosphate rocks + sulfuric acid | Medium solubility (40–50%) | Variable | Limited use, mainly experimental (Hammond et al. Reference Hammond, Chien and Mokwunye1986; Nziguheba Reference Nziguheba and Bationo2007) |
| Single (simple, ordinary) superphosphate | 3Ca(H2PO4)2·H2O + 7CaSO4 | Phosphate rock + H2SO4 | High solubility (~85%) | 7–10% P, 1–3% S | 21 percent of the world market (1999) |
| TSP | Ca(H2PO4)2·H2O | Phosphate rock + H3PO4 | High solubility (~87%) | 20% P | 7 percent of the world market (1999) |
| DAP | (NH4)2HPO4 | H3PO4 + NH4+ | High solubility (~100% ) | 23%, 18–21% N | 42 percent of the world market (1999): best in basal application |
| NPK/PK compounds | For example 15–15–15 (N–P2O5–K2O) | Blend | Variable solubility | Variable | 21 percent of the world market |
| Thermal phosphates (Rhenania) | Sodium silicophosphate “Termofosfato, ” Ca3(PO4)2CaSiO4 | Phosphate rock with Na2CO3 + silica + steam ~1100 °C | Low solubility (< 1%) | 10–12% P | High cost of electricity and water; little use |
| Fused magnesium phosphate | Ca3(PO4)2MgSiO4 | Phosphate rock with olivine, or serpentine fused at 1500 °C | Low solubility (< 1%) | 6% P , 7% Mg, 18–20% Ca | High expense of electricity and water; little use |
| Cattle manures | Feces | High solubility; slow release | 0.15– 1.1% P | Widely used; cattle manures provide improved soil properties not fully understood | |
| Poultry manure | Feces + uric acid | High solubility; slow release | 0.7–2.1% P | Very concentrated; can be a pollutant due to low N:P ratio | |
| Pig manure | Feces | High solubility; slow release | 0.8% P | Can be a pollutant due to low N:P ratio | |
| Tithonia diversifolia leaves | Unusually high nutrient content; a nutrient accumulator (Jama et al. Reference Jama, Palm, Buresh, Niang, Gachengo, Nziguheba and Amadalo2000) | Fast decomposition | 0.2–0.6% P, 4% N, 4% K | Good for biomass transfers for high‐value crops | |
| Crop residues | Straw, stover | Maize stover < 0.1% P | Slow decomposition | < 0.1–0.2% P | Phosphorus is too low; main interest is carbon, and potassium |
| Ash from burning wood | Slash-and-burn agriculture; cooking fires | High solubility | 0.14% P | ||
| Biosolids | Urban sewage, semisolid and solid wastes | Variable composition | < 0.1–15% P; Median: 0.7–2.4% P | Possible heavy metal contamination (arsenic, cadmium, chromium, lead, mercury); also molybdenum, nickel, selenium, zinc |
Superphosphate fertilizers are formed by reacting the phosphate rock – Ca10(PO4)6F2, for example – with an acid. For single superphosphate the reaction is with sulfuric acid, producing gypsum (CaSO4) and monocalcium phosphate Ca(H2PO4)2.H2O:
For triple superphosphate, the reaction is phosphate rock with phosphoric acid, which is previously produced from phosphate rock (Leikam and Achorn Reference Leikam, Achorn, Sims and Sharpley2005):
DAP is produced by reacting phosphoric acid with anhydrous ammonia:
14.8.2 Phosphate Rocks
The largest producers of phosphate rocks in 1999, in descending order are United States, China and Morocco (together accounting for 64 percent of the total) followed by Russia, Tunisia, Jordan, Brazil, Israel, South Africa, Syria, Senegal, Togo, Colombia, Peru, Sri Lanka and Venezuela (Stewart et al. Reference Stewart, Hammond, van Kauwenbergh, Sims and Sharpley2005; Fig. 14.7). The eight tropical countries in this list together produce only ~8 percent of the world’s total. Presently, additional countries are producing phosphorus fertilizers, notably Saudi Arabia, Malaysia and Indonesia (both in Borneo), Australia and the Central Asian republics. Morocco has discovered new deposits, and currently has the largest reserves.
Minjingu biogenic phosphate rock deposit in northern Tanzania.
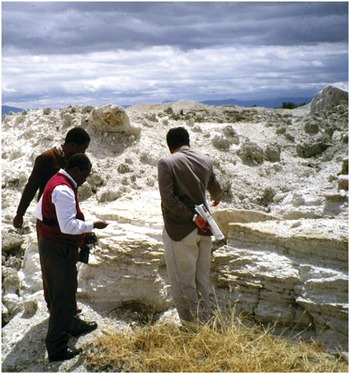
Igneous and metamorphic phosphate rock deposits are the least soluble and consist mainly of fluorapatites and hydroxyapatites; they are almost never used for direct application and relatively little for phosphate rock production. The least soluble are the fluorapatites, which are never used for direct application, even if finely ground to < 0.02 mm (Rajan et al. Reference Rajan, Watkinson and Sinclair1996). Sedimentary resources (of marine origin) are more soluble and consist largely of fluorapatite and carbonate-substituted fluorapatite (francolite), accounting for the vast majority of phosphate rock production and soluble phosphorus fertilizers. The main differences in reactivity lie in the crystal chemistry of apatite, particularly isomorphic substitution (van Straaten Reference van Straaten2002).They constitute the bulk of phosphate rock production and exports. Many of the sedimentary deposits can be used for direct application in acid soils, as indicated in Table 14.12. Biogenic deposits are the most soluble and are great for direct application in acid soils, but are only locally important.
The percentage of total phosphorus that is soluble in either 2 percent neutral ammonium citrate or in 2 percent citric acid is the most common measure for estimating the reactivity of phosphate rocks. Using the Hedley fractionation, the increase in the sorbed (NaOH-extractable) Pi fraction after phosphate rock application indicates the transformation of phosphate rock into sorbed iron- and aluminum-bonded phosphates, and the amount not reactive can be determined by the increase in calcium-bonded phosphate with the HCl extraction (Rajan et al. Reference Rajan, Watkinson and Sinclair1996).
The most important deposits used in the tropics are grouped in Table 14.13. It is interesting to note the paucity of highly reactive phosphate rocks in the tropics compared with the temperate region, particularly North Africa. Tropical Latin America has a wide variety of medium- to high-reactivity phosphate rocks, where research has concentrated in Brazil and Colombia. Brazil seems to have mainly low-reactivity phosphate rocks, which are widely used. Tropical Africa appears to have the medium-reactivity rocks in West Africa, while the low-reactivity ones predominate in East and southern Africa. This is probably due to the largely sedimentary geology of West Africa in comparison to the largely mountainous/plateau backbone of East and southern Africa, which includes past and present volcanic activity. Surprisingly, there seem to be few known phosphate rock deposits in tropical Asia.
| Region and deposit | High reactivity | Medium reactivity | Low reactivity |
|---|---|---|---|
| Temperate region phosphate rocks used in the tropics | North Carolina, Gafsa (Tunisia, Morocco), Arad (Israel), Jordan | Central Florida | Missouri |
| Tropical Latin America | Bayóvar/Sechura (Peru)a | Huila (Colombia); Baja California, Zacatecas (Mexico); Lobatera, Riecito (Venezuela) | Abaeté, Araxá, Catalão, Olinda, Patos de Minas (Brazil); Pesca, Sardinata (Colombia) |
| Tropical Africa | Iles Barrens (Madagascar); 13 offshore islands (Namibia); Minjingua; Pyramids (Tanzania) | Cabinda, Lucunga (Angola); Mekrou, Pobe (Benin); Arly, Kodjari (Burkina Faso); Matongo (Burundi); Douala (Cameroon); Bokouma (CAR); Comba, Holle, Offshore (Congo Republic); Lueshe (Democratic Republic of Congo); Gorrakel, (Ethiopia); Iguela (Gabon); Saliquinhe (Guinée-Bissau); Secondi (Ghana); Bambuta (Liberia); Tilemsi (Mali)a; Bofal-Lubboira (Mauritania); Tauhoa,a Maputo (Mozambique); Parc W, Tahoua, Muambe, Tapoa (Niger); Sokoto, Abeokuta (Nigeria)a; Empembe, Kalkfeld (Namibia); Taiba-Thies,b Matam, Ziguinchor, Taiba (Senegal); El Bur (Somalia); Akoumape-Hahotoe (Togo)c | Bikilal (Ethiopia); Mrima Hill, Rangwa (Kenya); Tundulu, Chilwa Island Mlindi (Malawi)a; Evite (Mozambique); Phalaborwa (South Africa)b; Panda Hill (Tanzania); Tororo, Sukulu,d Busumbud (Uganda); Chilembwe,d Rifisa, Nkfombwa (Zambia); Dorowa,d Shawa, Chisaya (Zimbabwe)b |
| Tropical Asia and Pacific | Nauru | Christmas Island (Australia); Lao Cay (Vietnam); Mussooire (India); Kanchanaburi (Thailand) | Eppawala (Sri Lanka) |
Phosphate rock reactivity in soil depends on the solubility product of the main minerals, fineness and soil pH. The general reaction with the acidity of the soil using the most common form, fluorapatite is as follows (van Straaten Reference van Straaten2002).
The reaction is similar with other forms of apatite. Obviously, the reaction will not proceed to the right in calcareous soils. This is why soluble fertilizers had to be invented.
The reactivity of phosphate rocks is higher in soils with low exchangeable Ca2+ levels and soils low in available phosphorus (Hammond et al. Reference Hammond, Chien and Mokwunye1986). Interestingly, high phosphorus sorption in Oxisols and clayey Ultisols enhances the dissolution of phosphate rock particles by having a low concentration of soil solution phosphorus around the particle (Smyth and Sanchez Reference Smyth and Sanchez1982). SOM often forms complexes with exchangeable Ca2+, thus decreasing Ca2+ concentration and driving the dissolution reaction towards the right. Therefore, the higher the SOM content the better the dissolution of phosphate rock will be (Hammond et al. Reference Hammond, Chien and Mokwunye1986, Rajan et al. Reference Rajan, Watkinson and Sinclair1996).
The size of phosphate rock particles applied to the soil also affects the reactivity, because this increases with the particle’s surface area. Generally, grinding machines used in phosphate rock extraction should produce particles fine enough that 80 percent of them pass a 100-mesh (150-μm) screen, which is essentially powder (Hammond et al. Reference Hammond, Chien and Mokwunye1986). The application of phosphate rock as powder is best applied early in the morning when there is still dew and no wind.
14.8.3 Managing Phosphorus Fertilizers in Low Phosphorus Sorption Soils
Phosphorus fertilizer management in soils with low to moderate phosphorus sorption capacity is usually a simple proposition. Phosphorus fertilizers should be at least 40–50 percent water-soluble (Englestad Reference Englestad1972) to insure an adequate phosphorus supply early in crop growth stages, when it is needed the most. Single and triple superphosphate, together with monoammonium and diammonium phosphates, meet this requirement and can be used effectively in most soils with low to moderate phosphorus sorption capacity.
Phosphorus deficiency probably is the first nutrient deficiency to be overcome in the West African Sahel, south of the Sahara and north of the savanna belt, extending from Senegal in the Atlantic coast eastwards until facing the Ethiopian Highlands. The soils are unusual for such a semiarid tropical climate because the majority of them are not calcareous and do not suffer from salinity or alkalinity (they do not have the FCC attributes b, s or n). The reason for this is that their parent materials are mainly quartz sand and ironstone, which produce sandy Alfisols with pH 5–6, without aluminum toxicity, with low phosphorus sorption and little SOM. Their phosphorus sorption levels, shown by Bationo (Reference Bationo2008), are negligible. Annual rainfall varies from 200 mm to 600 mm, concentrated in a short 3-month rainy season.
The soil test critical levels and follow-up steps shown in Chapter 12 are applicable. However, when using phosphate rocks, the Bray 2, Mehlich 1 and Mehlich 3 soil tests overestimate phosphate rock dissolution (Hammond et al. Reference Hammond, Chien and Mokwunye1986). Low annual rates of superphosphate or diammonium phosphate can be broadcast and incorporated into the topsoil or banded once a year. All phosphorus fertilization should be done at planting time, because plants have the ability to accumulate and translocate phosphorus to younger plant parts (Rao et al. Reference Rao, Friesen, Osaki and Pessarakli1999). Therefore, regardless of sorption capacity, there is no need for topdressing applications of phosphorus fertilizers.
Bationo et al. (Reference Bationo, Baethgen, Christianson and Mokwunye1991), in an exemplary work to calibrate soil tests with yield response, found that over 75 percent of the soils sampled had available phosphorus values of less than 8 mg/kg P (Bray 1), which was considered the critical level for the main crop, pearl millet. In very sandy Alfisols of Niger the rates of phosphorus needed for achieving 90 percent of the maximum millet yield were extremely low, 17 kg P/ha, when the Bray 1 soil test level was 2 mg/kg P, and 4 kg P/ha when the soil test level was 7 mg/kg P, approaching the critical level. Millet yields were also very low: 190 kg/ha without fertilizers, and 714 kg/ha with 13 kg P/ha. There was no response to nitrogen without phosphorus being applied, but when both 13 kg P/ha and 60 kg N/ha were applied, millet yields increased to about 1 t/ha. Bationo (Reference Bationo2008) did not detect significant millet and cowpea responses to sulfur or potassium applications. Therefore the central issue was phosphorus.
With ample sedimentary phosphate rock deposits in West Africa, it was logical to try them in comparison with imported superphosphates. The only one of medium reactivity is the Tilemsi deposit and it is essentially as effective as superphosphates (Bationo et al. Reference Bationo, Ayuk, Ballo and Koné1997). Unfortunately, the Tilemsi phosphate rock deposit is in a remote area of northern Mali. Although increased yield responses due to crop residue incorporation or biomass transfers have been reported, it is extremely difficult to grow sufficient biomass in this semiarid climate and virtually all crop residues are consumed by cattle after the grain harvest. Furthermore, the only fertilizer currently available is imported 15–15–15, which works but wastes potassium, according to our experience in the Tiby Millennium Villages, near Segou, Mali.
14.8.4 Managing Soluble Fertilizers in Soils with High Phosphorus Sorption Capacity
In certain Andisols of Japan and Oxisols of Latin America, agronomists were convinced that these soils did not respond to phosphorus fertilization, even though crops showed severe phosphorus deficiency symptoms. This changed when they applied rates of 500–1000 kg P/ha and obtained dramatic yield responses. When the topsoils have phosphorus sorption capacities higher than 100 mg/kg PS (or 200 kg P/ha) to reach 0.01 mg P/L, as indicated in Fig. 14.5, crop fertilization strategies have to look at a 5–10-year horizon. The best strategy is to use what the Brazilians call adubação corretiva – corrective fertilization, followed by small, banded maintenance phosphorus applications every year. While clearing Cerrado, Brazilian farmers called the corrective strategy amansar Cerrado (tame or domesticate the Cerrado).
I have seen the epitome of corrective applications near Stellenbosch, South Africa, where large rates of phosphorus, lime and gypsum were mixed with the top meter of soil (either a clayey Ultisol or Oxisol), using a tractor-mounted back hoe. The land was being prepared to grow vineyards that produce high-quality wines. Such a strategy is considered an investment in natural capital and is often financed accordingly.
One of the best examples of various options is shown in the classic experiment that started in 1972 in a clayey Red Latosol (Typic Haplustox) at Embrapa’s Cerrado Research Center near Brasília by Yost et al. (Reference Yost and Fox1979) and continued for 13 years. The results of the first 9 years are shown in Fig. 14.8. Broadcast rates, applied only once in 1972 before planting the first crop, ranged from 70 kg P/ha to 560 kg P/ha (no point having a control since the yield without applied phosphorus is zero). The highest rate, in retrospect, was close to a full corrective application to produce the desired 0.01 mg P/L. Looking at Fig. 14.5, this same soil (Haplustox from Brazil) needed ~ 200 mg/kg PS (800 kg P/ha) to reach 0.01 mg/L PL. Discounting for the lime applications (1 × exchangeable Al3+) in Table 14.8, which lowers the phosphorus sorption by 18 percent, the recommended amount would be 656 kg P/ha, which is reasonably close to what Yost and co-workers applied – 560 kg P/ha.
Performance of different phosphorus broadcast and banded strategies on nine consecutive maize crops in a Typic Haplustox in Planaltina, Brazil. The phosphorus source was simple superphosphate. All treatments were limed and fertilized with other nutrients. Without phosphorus, maize yields were zero.
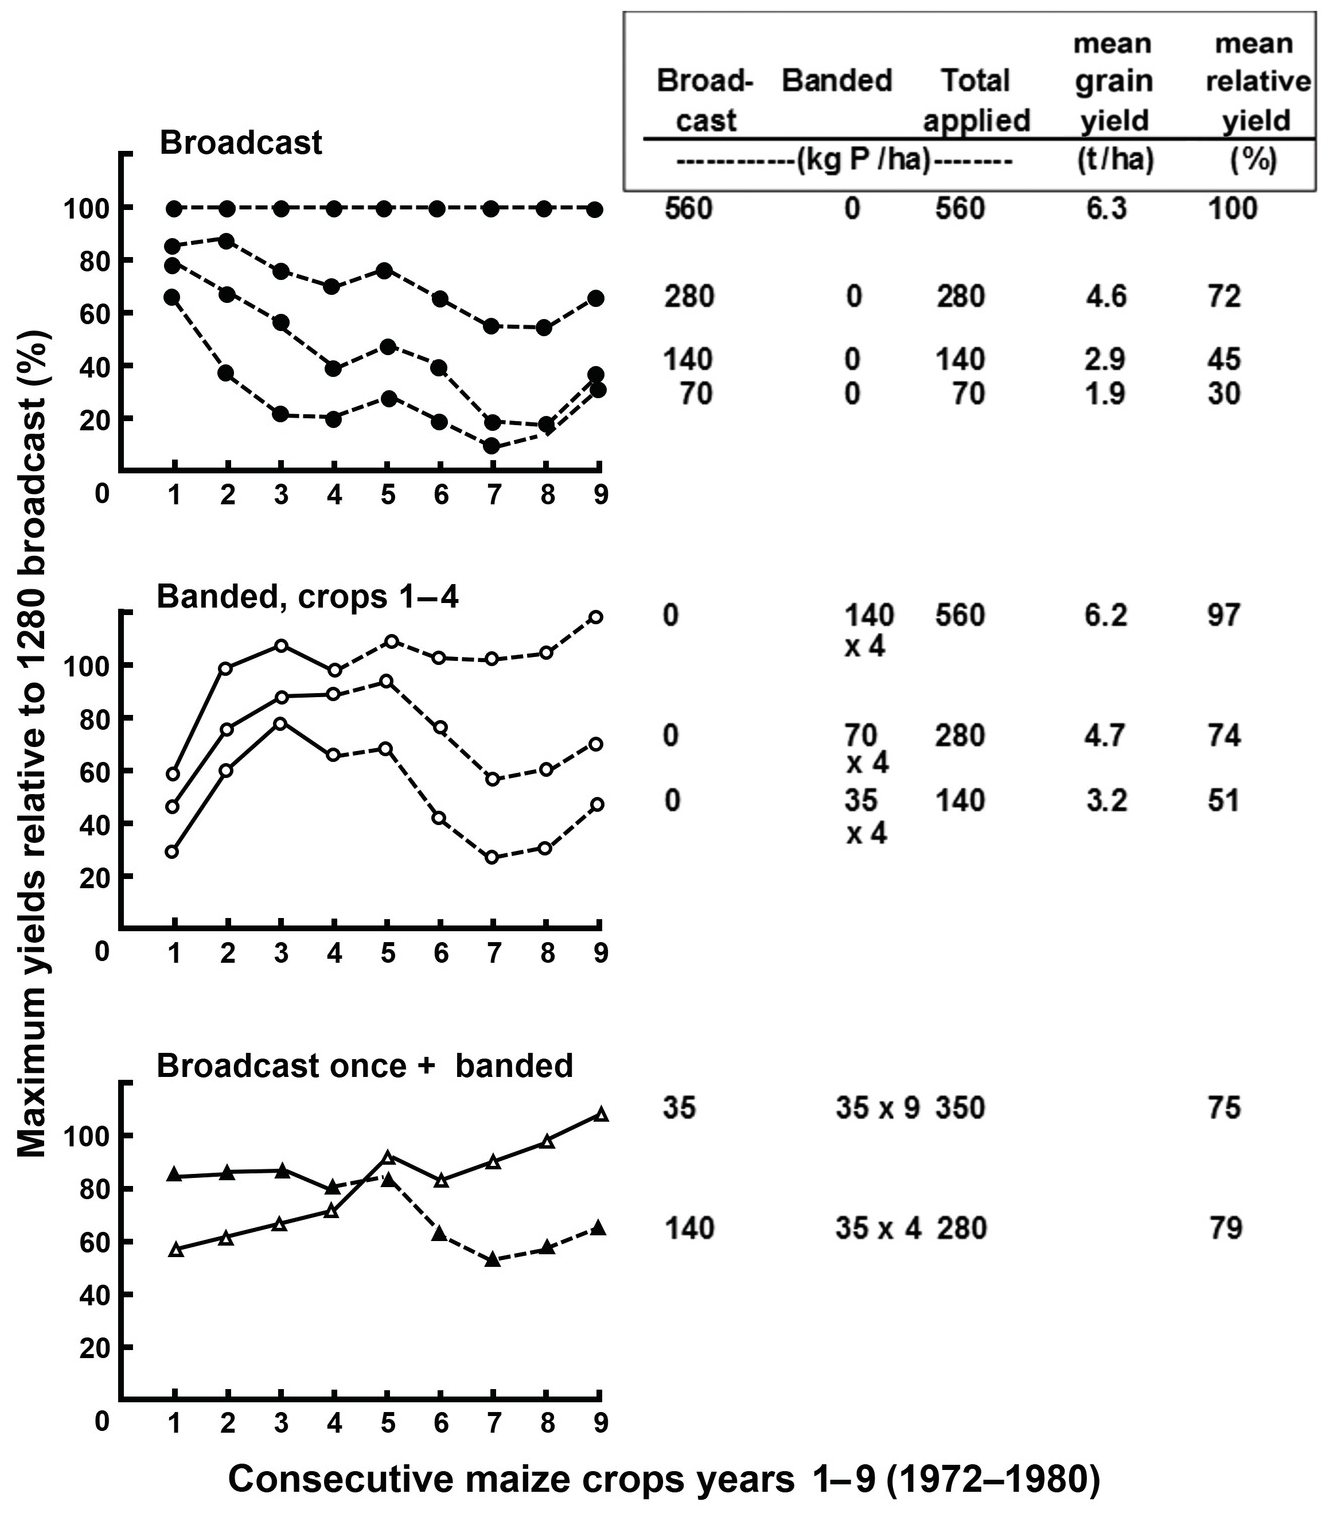
The highest broadcast rate provided the highest maize yields for 9 years, averaging a very respectable 6.3 t/ha, but banding 140 kg P/ha for four consecutive years did just as well (the total rate was the same 560 kg P/ha) achieving 97 percent of the maximum yield. A yield of around 72 percent of the maximum was obtained using two strategies, both totaling 280 kg P/ha, the one-time broadcast application of 280 kg P/ha, or banding 70 kg P/ha to four consecutive crops.
The experiment continued for a total of 13 years, with no additional phosphorus applications, but not all treatments were reported (Table 14.14). de Souza and Lobato (Reference de Sousa, Lobato, Yamada, Stipp and Abdalla2004) reported that the phosphorus recovery by the 13 consecutive crops ranged from 35 percent with the highest rate to 62 percent with the lowest, with the applications totaling 140 kg P/ha or 280 kg P/ha hovering at about 50 percent recovery.
| Phosphorus applied (kg P/ha) | Cumulative maize grain yields in 13 crops (t/ha) | Relative yield for 13 crops (%) | Applied phosphorus recovered by 13 crops | Applied phosphorus remaining in topsoil after 13 crops (kg P/ha) | |||
|---|---|---|---|---|---|---|---|
| Broadcast | Banded | Total | (%) | (kg P/ha) | |||
| 70 | 0 | 70 | 17.3 | 26 | 62 | 43 | 27 |
| 140 | 0 | 140 | 28.1 | 43 | 49 | 69 | 71 |
| 280 | 0 | 280 | 43.8 | 66 | 45 | 126 | 154 |
| 560 | 0 | 560 | 66.1 | 100 | 35 | 196 | 364 |
Applying phosphorus fertilizers in bands is a simple practice that probably satisfies the phosphorus sorption capacity of a small soil volume. It thus makes much of the fertilizer applied directly available to plants. Yost et al. (Reference Yost and Fox1979; Fig. 14.8) found that banded applications concentrated maize root development around the band, and, when a temporary drought struck, plants suffered more than those of the broadcast plots, which showed more extensive root volume.
With continuous cropping and tilling, banded applications are mixed with a greater volume of soil after each tillage operation. In a sense, annual banding begins to approach broadcast applications in terms of phosphorus distribution with time. For soils with high phosphorus sorption capacity the most appropriate scheme is a moderately high initial broadcast application followed by small, banded applications at each subsequent planting.
14.8.5 Managing Direct Applications of Phosphate Rock
For soils with pH < 5.5, with high phosphorus sorption, low exchangeable Ca2+, and low available phosphorus, van Straaten (Reference van Straaten2002) summarized the suitability of phosphate rock for direct application as follows (with additional data for Latin American phosphate rocks from Hammond et al. Reference Hammond, Chien and Mokwunye1986):
For phosphate rocks with high neutral ammonium citrate solubility (> 5.9 percent): Apply directly to most annual and perennial crops. Examples: Minjingu, Tanzania (5.6–12.9 percent); Bayóvar, Peru (18.0 percent); Pesca, Colombia (9.5 percent).
For phosphate rocks of medium to high neutral ammonium citrate solubility (3.4–5.9 percent): Apply directly to low phosphorus-demanding crops like many forage species, sugar cane, tree crops and crops with high effective root volume, like pigeon pea. Example: Tilemsi, Mali (4.5 percent).
For phosphate rocks of low neutral ammonium citrate solubility (< 3.4 percent): Apply directly to tea, perennial tree crops, rape and cabbage. Examples: Hahotoe, Togo (< 3.1 percent); Taiba, Senegal (3.1 percent).
Considering the wide differences in phosphate rock deposits around the tropics, their use will be illustrated by two long-term examples, one using low-reactivity phosphate rocks in Brazil and another with a high-reactivity phosphate rock in Kenya, which included organic inputs.
14.8.6 Brazilian Strategies for Managing Phosphorus Applications in Soils with High Phosphorus Sorption Capacity
Because Brazil’s many phosphate rock deposits are all of low reactivity, Brazilian scientists have done a large number of long-term research projects on how to use these phosphate rocks, usually comparing them to superphosphates and imported high-reactivity phosphate rocks. The relative agronomic efficiency index of phosphate rock (RAEPR), described by Goedert et al. (Reference Goedert, de Souza, Lobato and Goedert1986), is commonly used. (Both phosphate rock and superphosphate in this equation must have the same phosphorus content.)
 (14.9)
In many Brazilian soils this equation is further simplified because the yields without phosphorus are usually zero. Another long-term experiment on the same Oxisol as the one used in Fig. 14.8 is shown in Table 14.15.
| Phosphate source | Broadcast rate 87 kg P/ha | Broadcast rate 350 kg P/ha | ||||
|---|---|---|---|---|---|---|
| Annual crops | Andropogon | Total (8 years) | Annual crops | Andropogon | Total (8 years) | |
| RAEPR: | ||||||
| TSP | 100 | 100 | 100 | 100 | 100 | 100 |
| Gafsa phosphate rock | 93 | 110 | 104 | 106 | 106 | 106 |
| Patos de Minas phosphate rock | 45 | 81 | 59 | 56 | 91 | 70 |
| Araxá phosphate rock | 27 | 69 | 41 | 47 | 74 | 58 |
| Abaeté phosphate rock | 21 | 86 | 43 | 47 | 71 | 76 |
| Catalão phosphate rock | 8 | 36 | 17 | 26 | 43 | 33 |
The high-reactivity Gafsa phosphate rock (from Tunisia) performed as well and even slightly better than triple superphosphate throughout the 8 years. All the low-reactivity Brazilian phosphate rocks performed poorly in comparison. Gafsa had 22 percent P solubility in neutral ammonium citrate, while values for the Brazilian phosphate rocks ranged from 4 percent to 7 percent (Lopes Reference Lopes1983). Very importantly, the effectiveness of the Brazilian phosphate rocks increased with time. Except for the highly unreactive Catalão, the other phosphate rocks reached ~ 60–75 percent of the agronomic efficiency of superphosphate with the high broadcast rate, and ~ 40–60 percent at the 87 kg P/ha rate. Even these low-reactivity Brazilian phosphate rocks had a significant residual effect.
Brazilian scientists tried many combinations of their phosphate rocks with superphosphate banded applications. These were summarized by Lopes (Reference Lopes1983) in five strategies depending on how quickly the farmer wishes to achieve 80 percent of the maximum yield, called “target” yield – a worthy concept that is repeatedly advocated in this book. The strategies are all based in the previously mentioned fact which Alfredo Lopes found, that topsoil clay content alone accounted for 92 percent of the variation in phosphorus sorption and release in Oxisols and related Cerrado soils (Lopes and Cox Reference Lopes and Cox1979). The strategies (Lopes Reference Lopes1983, Reference Lopes2016, with some of my modifications) are:
1. Quick response and high investment: Achieve the 80 percent target yield in the second year of application. Broadcast 4–5 kg P/ha for each 1 percent topsoil clay content (180–225 kg P/ha in a clayey Oxisol with 45 percent topsoil clay) with either superphosphate or imported high-reactivity phosphate rock, followed by annual band applications of superphosphates to maintain an adequate soil test level – 12–16 mg P/kg (Mehlich 1) as recommended by de Sousa and Lobato (Reference de Sousa, Lobato, Yamada, Stipp and Abdalla2004) for this clayey soil. Alfredo Lopes feels this is a high investment cost that few farmers can afford. This is what Sanchez et al. (Reference Sanchez, Shepherd, Soule, Place, Buresh, Izac, Mokwunye, Kwesiga, Ndiritu, Woomer, Buresh, Sanchez and Calhoun1997) called a recapitalization strategy for African soils with high phosphorus sorption capacity.
2. Achieve target yield in 4 years: Broadcast 1.5–2 kg P/ha per 1 percent topsoil clay content (67–90 kg P/ha) and annual band applications of superphosphate to maintain an adequate soil test level. Lopes comments that this strategy was widely applied in millions of hectares of Cerrado Oxisols during the 1970s with a credit subsidy for fertilizers (which no longer exists), and many farmers still use it, without subsidies. Another recapitalization strategy is to use Minjingu phosphate rock in East Africa and medium-reactivity Taiba, Hahotoe and Tilemsi phosphate rocks in West Africa at the same rate per 1 percent clay.
3. Achieve target yield in 6 years: Yearly banded applications of superphosphate or high-reactivity phosphate rocks according to crop needs but with a small excess (8–10 kg P/ha). Tillage operations (not no-till) gradually build up soil phosphorus. Suitable to farmers who cannot afford a capital investment.
4. Achieve target yield in 8–10 years: Broadcast 1.5–2 kg P/ha per 1 percent topsoil clay content (67–90 kg P/ha) as finely ground (200-mesh) low-reactivity Brazilian phosphate rocks plus annual banded applications of superphosphate according to crop needs, to gradually build up soil phosphorus. This is good for pastures and perennial crops.
5. “Perpetuate poverty in high phosphorus sorption soils” (Lopes Reference Lopes2016): Small (8–10 kg P/ha), banded phosphorus applications each year to crop or pasture. Should not be used for crop production in Cerrado soils or other soils with high phosphorus sorption capacity.
14.8.7 East African Strategies for Managing Phosphorus Applications in Soils with High Phosphorus Sorption Capacity
Oxisols and related soils in humid and subhumid western Kenya, Uganda, Rwanda, Burundi and eastern Democratic Replublic of Congo have high phosphorus sorption in a similar range to Brazilian soils. The East African soils are not as phosphorus-deficient (2–5 mg P/kg Olsen soil test versus almost zero in the Brazilian Cerrado), so they require a control plot. Also, these East African soils respond to phosphorus rates as low as 10 kg P/ha (Nziguheba et al. Reference Nziguheba, Merckx and Palm2002b). Smallholder farmers tend to use available sources of phosphorus, particularly DAP, high-phosphorus biomass transfers (cut and carry), manures, as well as the high-reactivity Minjingu phosphate rock (Semoka et al. Reference Semoka, Mnkeni and Ringo1992). East Africa has a research tradition of combining inorganic phosphorus fertilizers with organic, plant-derived sources of phosphorus (Palm et al. Reference Palm, Myers, Nwanda, Buresh, Sanchez and Calhoun1997; Jama et al. Reference Jama, Buresh and Place1998, Reference Jama, Palm, Buresh, Niang, Gachengo, Nziguheba and Amadalo2000; Otinga et al. Reference Otinga, Pypers, Okalebo, Njoroge, Emong’ole, Six, Vanlauwe and Merckx2013) and tackling nitrogen and phosphorus deficiencies together (Jama et al. Reference Jama, Buresh and Place1998, Ikerra et al. Reference Ikerra, Semu and Mrema2006). The farming systems are totally different. The Brazilian experience is from large, mechanized commercial farms, while in East Africa we are dealing with smallholder farming (< 1–5 hectares), using little if any mechanization.
A key component of East African strategies are the organic phosphorus resources. Organic leafy inputs can immobilize or mineralize available phosphorus in the soil, with the tipping point being about 0.25 percent P content (Fig. 14.9). Tithonia (Tithonia diversifolia), gliricidia (Gliricidia sepium), soybean and alfalfa (Medicago sativa) mineralize phosphorus, while sesbania (Sesbania sesban), flemingia (Flemingia congesta), calliandra (Calliandra calothyrsus) and neem (Azadirachta indica) leaves and wheat straw immobilize phosphorus. Those that mineralize phosphorus are used in what is called biomass transfers.
Main organic plant phosphorus resources used in East Africa, grouped according to whether they mineralize or immobilize phosphorus (Nziguheba Reference Nziguheba and Bationo2007).
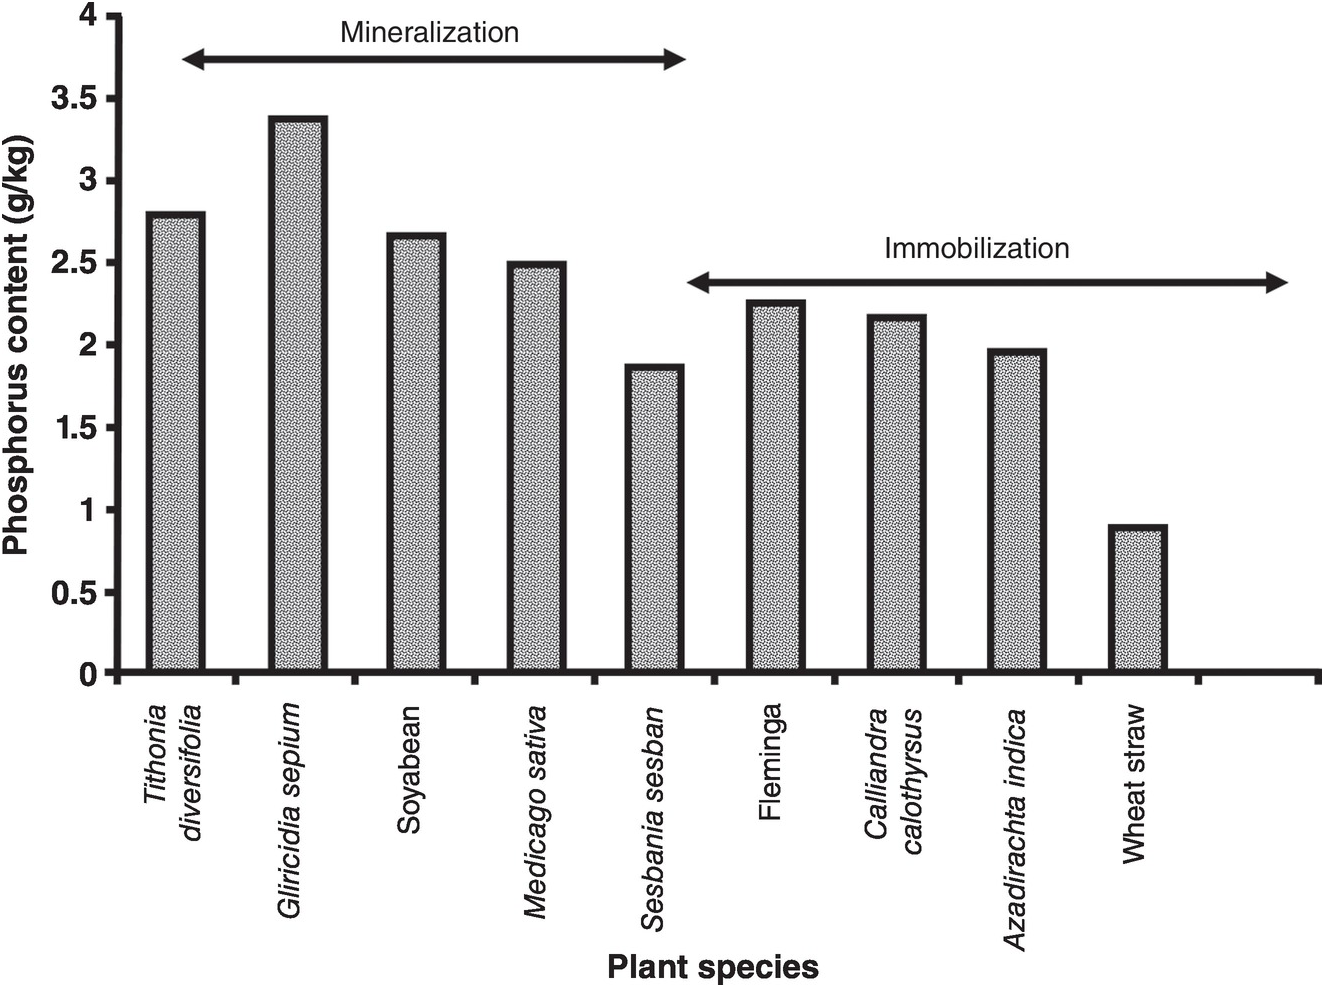
Jama et al. (Reference Jama, Palm, Buresh, Niang, Gachengo, Nziguheba and Amadalo2000) summarized the literature on tithonia, a shrub of the Asteraceae family. Tithonia diversifolia, the Mexican sunflower, is an amazing tropical resource for smallholder farmers. It is a nutrient accumulator with leaf contents of 4 percent N (even though it is not a legume), very high phosphorus contents (0.2–0.6 percent) and 4 percent K. As mentioned above, tithonia roots acidify their rhizospheres. As indicated in Chapter 13, tithonia is classified as a class 1 organic resource (> 2.5 percent N and < 15 percent lignin), which provides a fast nutrient release, similar to soluble fertilizers. It grows naturally in roadsides from sea level to about 1800 m in humid and subhumid Africa (Fig. 14.10) but not in semiarid climates. It also grows in Latin America where it originated. It is also used as an effective nutrient source for flooded rice and in indigenous fallow systems in Asia and it has been studied in Sri Lanka (Jama et al. Reference Jama, Palm, Buresh, Niang, Gachengo, Nziguheba and Amadalo2000).

Research in acid Oxisols and Inceptisols of Vietnam (Cong and Merckx Reference Cong and Merckx2005; Pypers et al. Reference Pypers, Verstraete, Cong and Merckx2005, Reference Pypers, Bimponda, Lodi-Lama, Lele, Mulumba, Kachaka, Boeckx, Merckx and Vanlauwe2012) showed that tithonia biomass transfers in acid soils temporarily eliminated aluminum toxicity, preventing exchangeable Al3+ from precipitating phosphorus sufficiently to carry a germinating crop over the initial growth when phosphorus is needed the most. (The temporary effect of organic inputs on aluminum toxicity has also been shown in Chapter 9.)
Other species of the Asteraceae family (formerly known as Compositae), such as Lantana camara and Chromolaena odorata probably have similar nutrient accumulation properties. Other species of Asteraceae are abundant in secondary “daisy” fallows in the Peruvian Amazon.
Biomass transfer technologies (Fig. 14.11) are more profitable in high-value crops such as vegetables, and possibly in small-scale organic farming systems. It is not practical to apply tithonia at rates higher than 5 tons of dry mass per hectare on crops in Africa, because of the high labor costs of gathering it from roadsides or field boundaries. This rate provides about 15–20 kg P/ha, which may not be sufficient in soils with high phosphorus sorption capacity, but probably is so in soils with low phosphorus sorption capacity. Nevertheless, nutrient accumulators like tithonia can play a strategic role in the management of soils in the tropics. The following information shows examples of the use of tithonia in Africa.
Farmer transferring tithonia biomass to planting holes after cutting branches from the roadside in the previous photo. The greatest limitation of biomass transfer technologies is high labor costs.
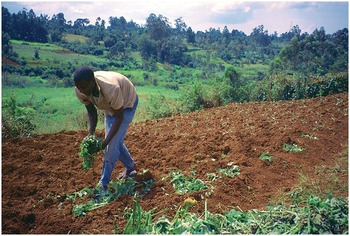
One strategy is to combine tithonia with phosphorus fertilizers. Nziguheba et al. (Reference Nziguheba, Merckx, Palm and Mutuo2002a) did that using one low phosphorus rate (15.5 kg P/ha) applied as NPK fertilizer and tithonia alone or in combination with several proportions of the two inputs. All treatments received enough nitrogen and potassium, so they would not be limiting and these eutric Oxisols were not aluminum-toxic.
Table 14.16 indicates that maize yields were low, reaching about 2 t/ha, no doubt because of the low phosphorus rates used. Maize yields increased with the increasing proportion of phosphorus from tithonia in the mixture. The highest yield was obtained with all the phosphorus applied as tithonia. This was not significantly different from the application of 1.8 t/ha + NPK (36 percent tithonia-P), but both were significantly higher than the yields with NPK alone. This led Nziguheba et al. (Reference Nziguheba, Merckx, Palm and Mutuo2002a) to recommend the proportion of one-third tithonia-P in the mixture as the most advantageous in terms of gains in yields, cost-benefits and availability of tithonia. The relative agronomic efficiency and phosphorus recovery will be discussed below.
| Treatments T = tithonia (t/ha) | kg P/ha added | Phosphorus from Tithonia (%) | Average yields (t/ha) | Applied phosphorus recovered by four crops | Applied phosphorus remaining in topsoil after four crops | Net benefits (US $/ha) | ||
|---|---|---|---|---|---|---|---|---|
| Tithonia | NPK | (RAEP)a | (kg P/ha) | (kg P/ha) | ||||
| N and K | 0 | 0 | 0 | 0.82 | - | 0 | 0 | –448 |
| NPK | 0 | 15.5 | 0 | 1.86 | 28 | 4.3 | 11.2 | 50 |
| NPK + T (0.45) | 1.4 | 14.1 | 9 | 1.75 | 30 | 4.7 | 10.8 | 270 |
| NPK + T (0.9) | 2.8 | 12.7 | 18 | 1.90 | 39 | 6.0 | 9.5 | 365 |
| NPK + T (1.8) | 5.6 | 9.9 | 36 | 2.06 | 36 | 6.0 | 9.5 | 457 |
| NPK + T (3.6) | 11.2 | 4.3 | 72 | 1.94 | 28 | 4.3 | 11.2 | 329 |
| Tithonia (4.8) | 15.5 | 0 | 100 | 2.22 | 41 | 6.4 | 9.1 | 539 |
| SED | 0.16 | 9 | ||||||
a 
Nziguheba et al. concluded that a high-quality organic input such as tithonia can increase maize production to a greater extent than fertilizers at low phosphorus application rates, and that there was a positive interaction in the mixture of organic and mineral phosphorus fertilizers in economic terms, especially with a high proportion of the phosphorus added as tithonia.
Another dimension of the East Africa strategy is to combine tithonia with high-reactivity phosphate rocks and triple superphosphate at high P rates. This was done by Jama and Kiwia (Reference Jama and Kiwia2009), in a 5-year experiment on another Oxisol of western Kenya. They applied a recapitalization or corrective application rate of 250 kg P/ha as Minjingu phosphate rock and triple superphosphate once, and annual broadcast applications of 50 kg P/ha per year, with a cumulative 5-year total equal to the corrective rate. They also compared these treatments with two sources of nitrogen, urea and tithonia, both applied at a rate of 60 kg N/ha per year, which, in the case of tithonia, also added about 6 kg P/ha per year or 30 kg P/ha in the 5-year period (Table 14.17).
| Nitrogen applied (60 kg N/ha/crop) | No phosphorus | Broadcast once (250 kg P/ha) | Annual 50 kg P/ha | ||
|---|---|---|---|---|---|
| Triple superphosphate | Minjingu phosphate rock | Triple superphosphate | Minjingu phosphate rock | ||
| Average maize grain yield (t/ha) | |||||
| Urea | 0.9 | 3.8 | 3.7 | 3.7 | 3.5 |
| Tithonia | 1.9 | 4.1 | 3.9 | 4.0 | 3.8 |
| Percentage relative yield (100 = TSP 250 + 30 kg P/ha tithonia) | |||||
| Urea | 22 | 93 | 91 | 92 | 85 |
| Tithonia | 48 | 100 | 96 | 98 | 93 |
| Percentage marginal rate of return to capital (US $/ha)a | |||||
| Urea | 10 | 145 | 99 | 125 | 149 |
| Tithonia | 154 | 97 | 117 | 88 | 109 |
a [Gross benefit – Labor cost/Capital cost] × 100. TSP = triple superphosphate.
Maize yields averaged about 4 t/ha, about twice that of Table 14.16 with a low phosphorus rate. There were no significant differences between triple superphosphate and Minjingu phosphate rock at either fertilization strategy. When tithonia was used yields increased but again the differences with urea were not significant, except at the zero phosphorus where tithonia doubled yields. The relative yields showed a similar trend, with all treatments with tithonia being slightly higher, but at the zero phosphorus rate tithonia alone produced almost half the yield of the phosphorus treatments, in sharp contrast with urea. The marginal rates of return to capital (including a 20 percent annual interest rate) were high with all phosphorus treatments, somewhat lower with tithonia, because of the labor costs. Tithonia with no phosphorus applied had the highest returns to capital but low yields.
This experiment also shows that Minjingu phosphate rock can be as profitable as TSP, showing what a high-reactivity phosphate rock, directly applied to a pH 5.1 soil with high phosphorus sorption capacity, can do.
The effects of phosphate rock plus cattle manures or composts made from smallholder farms and household refuse depend on the reactivity of phosphate rocks. A review of research on the combination of phosphate rocks and organic inputs indicates that high-quality manure inputs (C:P ratios < 150) increased the solubility of low-reactivity phosphate rocks, but decreased or did not affect the solubility of high-reactivity rocks, apparently because of the calcium contained in the phosphate rocks and in the organic inputs, which increases soil pH and thus decreases the dissolution of phosphorus from the rocks (Nziguheba Reference Nziguheba and Bationo2007). It is worth remembering that when poultry manure is used, it has such a low N:P ratio that when trying to apply the correct amount of nitrogen, there may be excess phosphorus applied.
14.9 Residual Effects and Efficiency of Utilization
Unlike mineral nitrogen fertilizers that have a short residual effect or none at all, phosphorus fertilizers – mineral or organic – can have long residual effects, because of the phosphorus sorption and release processes.
The parameters used for nitrogen, nitrogen recovery (REN) and agronomic use efficiency (AEN) in Chapter 13 are not directly applicable to phosphorus, unless they are calculated for several consecutive crops to estimate the residual effect. Unlike nitrogen where 15N is a stable isotope, phosphorus isotopes are not; the half-lives of 32P and 33P, 14.3 and 25.4 days, respectively, makes their use difficult (Syers et al. Reference Syers, Johnston and Curtin2008). Hence, their use is restricted to confined, short-term experiments, and rarely in the field.
The percentage of phosphorus recovery (REP) becomes more relevant when the residual effect of several crops is calculated. The formula to be used is given in Eq. 14.10:
 (14.10)
where Uf is the phosphorus uptake by a phosphorus fertilization treatment, Uc is the phosphorus uptake by the control; numbers 1 … n are the consecutive crops and F is the sum of phosphorus fertilizer added during the trial. All units are in kg P/ha.
Only 10–20 percent of the phosphorus fertilizer applied is generally recovered by the first crop (Syers et al. Reference Syers, Johnston and Curtin2008) leaving the rest in the soil, assuming no losses from runoff and erosion. The second crop recovers only 20–80 percent of that which the first crop did (Hedley and McLaughlin Reference Hedley, McLaughlin, JT Sims and Sharpley2005); that amounts to an additional 2–16 percent recovered, so the total phosphorus recovery of the first two crops ranges from 12 percent to 36 percent.
Equation 14.11 is used to estimate the amount of residual (also called legacy) phosphorus remaining in the topsoil, called, for lack of a better symbol, RRP:
or their equivalents in kg P/ha.
14.9.1 Phosphorus Balance Studies
Four phosphorus balance studies, using the above parameters, give a good idea of the magnitude of the residual phosphorus that stays in agricultural soils.
Sattari et al. (Reference Sattari, Bouwman, Giller and van Ittersum2012) reported residual effects of added phosphorus at the global scale; they calculated the inputs in inorganic fertilizers and manure, and the phosphorus removed by crop harvests every year as outputs. Absent from their calculation were phosphorus removals by livestock production and by runoff and erosion as well as phosphorus added as mineral salts for livestock. In spite of these limitations Sattari and co-workers provide a global picture of residual soil phosphorus that accumulated in world soils during a 40-year period.
Table 14.18 shows the enormous amounts of phosphorus that accumulated in soils, ranging from 215 kg P/ha during 40 years in Africa and North America to 820 kg P/ha in Western Europe during the same time span, where large quantities of manure were added.
| Region | Phosphorus added as fertilizer and manure | Phosphorus recovery by crop harvests | Residual (legacy) phosphorus remaining in soil | Percentage phosphorus recovery, REP | Percentage residual phosphorus, RRP |
|---|---|---|---|---|---|
| (kg P/ha per year over 40 years) | |||||
| Africa | 320 | 105 | 215 | 66 | 34 |
| North America | 465 | 250 | 215 | 54 | 46 |
| Latin America | 980 | 250 | 730 | 26 | 74 |
| Eastern Europe/Former Soviet Union | 430 | 120 | 310 | 28 | 72 |
| Asia (south and east) | 690 | 250 | 440 | 36 | 64 |
| Oceania | 560 | 100 | 460 | 18 | 82 |
| Western Europe | 1170 | 350 | 820 | 30 | 70 |
| World | 4615 | 1425 | 3190 | 31 | 69 |
For Africa as a whole, the phosphorus inputs were the same for fertilizers as from manure (in 1965, 0.2 Tg P per year each), but phosphorus fertilizer doubled (0.4 Tg P per year) and phosphorus manure (0.6 Tg P per year) tripled in 2007. In south and east Asia, phosphorus fertilizer increased from 0.8 Tg P in 1965 to 10 Tg per year in 2007, while manure increased from 2 to 4.5 Tg P per year, very likely the effect of the Asian Green Revolution. Sattari et al. (Reference Sattari, Bouwman, Giller and van Ittersum2012) indicated that global phosphorus recovery by plants increased with time, from 30 percent in 1961 to ~ 45 percent in the 2000s, except in Africa. The bottom line of this study is that 69 percent of the applied phosphorus remained in the soil.
A second global balance study was calculated from the crop side and only for 1 year, providing a snapshot. MacDonald et al. (Reference MacDonald, Bennett, Potter and Ramankutty2011) used 123 crops and cultivated pastures during the year 2000. Their results indicate that the global inputs of fertilizer (14.2 Tg P) and manures (9.6 Tg P) exceeded the global removal of phosphorus by crop harvests (12.3 Tg P). This provided an additional 11.5 Tg P to the residual soil pool, which is 48 percent of what was added to the soil that year. MacDonald et al. also found that about 70 percent of the cropland and cultivated pastures had a positive phosphorus balance and the remaining 30 percent had a negative (depleting) balance. The geographic distribution of phosphorus balances is shown in Fig. 14.12.
Phosphorus balances during the year 2000, expressed in kg P/ha per year at a 50 × 50 km resolution (MacDonald et al. Reference MacDonald, Bennett, Potter and Ramankutty2011).
According to this impressive map, the largest positive balances in tropical Latin America were found in Brazil, Ecuador, Colombia and Venezuela, but surpluses occurred throughout the region, except for large deficits in parts of Paraguay and Bolivia, with smaller deficits in Cuba, Haiti, parts of southern Mexico and northeast Brazil.
In tropical Asia, enormous surpluses were found in China (both tropical and temperate parts), Vietnam and most of India, Bangladesh and Thailand. Only a few areas showed deficits, including Myanmar, Malaysia, New Guinea and parts of Australia.
Tropical Africa showed small areas of large surpluses in Ethiopia, South Sudan, Tanzania, Malawi, Zimbabwe, Angola and South Africa, but MacDonald et al. (Reference MacDonald, Bennett, Potter and Ramankutty2011) indicated that although such surplus areas appear to be widespread, they actually cover less than 2 percent of Africa’s cropland, including, I assume, large commercial farms. The map also shows small deficits throughout tropical Africa.
The temperate region shows large phosphorus surpluses in China, Japan, Pakistan, South Korea, Chile, Uruguay, much of Western Europe, the eastern seaboard of the United States and California. There are moderate surpluses elsewhere in the temperate zone, except for depletion in Eastern Europe and Russia and extreme depletion in Argentina and parts of the northern United States.
MacDonald et al. (Reference MacDonald, Bennett, Potter and Ramankutty2011) also noted that cereal crops accounted for about 50 percent of the phosphorus fertilizers and manure applied in the year 2000. This is much lower than the share of nitrogen inputs applied to cereal crops, indicating a more even application of phosphorus across the many farming systems.
A third balance study compared examples of subnational regions known for their surpluses and deficits (Table 14.19). Vitousek et al. (Reference Vitousek, Naylor, Crews, David, Drinkwater, Holland, Jones, Katzenberger, Martinelli, Matson, Nziguheba, Ojima, Palm, Robertson, Sanchez, Townsend and Zhang2009) observed enormous phosphorus surpluses in the North China Plain, amounting to 90 kg P/ha per year, a great pollution potential for runoff and erosion to waters in these loess soils (Alfisols and Mollisols) with low sorption capacity. The second region, the US Midwest, is responsible for the eutrophication in the Mississippi River and the anoxic “dead” zones in the Gulf of Mexico. But the data presented actually show a negative phosphorus balance, after the effective environmental controls put in place in this region over the past 20 years. The third region, western Kenya, shows a small phosphorus accumulation, as opposed to the nitrogen depletion shown in Chapter 13. The current rapid increase in phosphorus fertilization in this region is likely to increase phosphorus accumulation by the dominant Oxisols, Ultisols and reddish Alfisols.
| North China Plain | United States Midwest | Western Kenya | |
|---|---|---|---|
| kg P/ha per year | |||
| Inputs: | |||
| Mineral fertilizer | 92 | 14 | 8 |
| Manure | 18 | 2 | 0.5 |
| Total: | 110 | 16 | 8.5 |
| Outputs: | |||
| Grain harvest removal | 20 | 23 | 4 |
| Stover removal | – | – | 3 |
| Total: | 20 | 23 | 7 |
| Balance | +90 | –7 | +1.5 |
The fourth “study” is my compilation of eight well-run studies from the literature, ranging from 2 years’ to 145 years’ duration. Table 14.20 summarizes the various data sets.
| Soil, topsoil texture, location, reference, phosphorus sorption (high if > 100 kg P/ha is needed to reach 0.01 mg/L PL in soil solution), number of applications, crops | Treatments | Years | Total phosphorus applied | Applied phosphorus recovered by crops | Applied phosphorus remaining in topsoil (legacy phosphorus) | |||
|---|---|---|---|---|---|---|---|---|
| Mineral | Organic | |||||||
| kg P/ha | (REP) | (kg P/ha) | (RRP) | kg P/ha | ||||
| Clayey Rhodic Eutrudox, pH 5.4; western Kenya; Nziguheba et al. (Reference Nziguheba, Merckx, Palm and Mutuo2002a) (Table 14.16); high phosphorus sorption; maize (–P control not subtracted) | NPK | 2 | 15.5 | 4.3 | 28 | 11.2 | 72 | 8.6 |
| Tithonia | 15.5 | 6.4 | 41 | 9.1 | 59 | 10.7 | ||
| Sandy Alfisol (Psammentic Paleustalf), pH 5.1; Sadoré, Niger, calculated from data by Bationo (Reference Bationo2008), insignificant phosphorus sorption; one application; millet; no control | SSP (mean of broadcast treatments) | 2 | 8.2 | 6.5 | 79 | 1.7 | 21 | 13.0 |
| Clayey Typic Palehumult, pH 4.8; Hawaii; Linquist et al. (Reference Linquist, Singleton, Cassman and Keane1996); high phosphorus sorption; one application for 4 years; soybean–maize; control not subtracted | 4 years fertilized +3 residual years | 7 | 155 | 82 | 53 | 73 | 47 | 164 |
| 930 | 145 | 73 | 785 | 27 | 290 | |||
| Sandy, Oxic Paleustult; Maravilhas, Pernambuco, Brazil; Ball-Coelho et al. (Reference Ball-Coelho, Salcedo, Tiessen and Stewart1993); low phosphorus sorption; several applications; sugar cane |
| 10 | 260 | 104 | 41 | 154 | 59 | 210 |
| Clayey Typic Haplustox, Planaltina, Brazil; de Souza and Lobato (Reference de Sousa, Lobato, Yamada, Stipp and Abdalla2004), Table 14.14; high phosphorus sorption; one application | TSP maize | 13 | 70 | 43 | 61 | 27 | 39 | 86 |
| 560 | 196 | 48 | 364 | 52 | 392 | |||
| Sandy Typic Paleudult, pH 3.9; Yurimaguas, Peru; calculated from Beck and Sanchez (Reference Beck and Sanchez1994); low phosphorus sorption; rice, maize, soybean | Full fertilizer yearly to annual rotation minus control | 18 | 1420 | 662 | 37 | 758 | 63 | 1324 |
| Sandy, calcareous soil, pH 8.7; Ludhiana, Punjab, India; Aulakh et al. (Reference Aulakh, Kabba, Baddesha, Bahl and Gill2003); low phosphorus sorption; yearly applications | Peanut summer crop rotated yearly with winter crops | 25 | 231 | 124 | 30 | 107 | 70 | 248 |
| 426 | 177 | 41 | 249 | 59 | 354 | |||
| 621 | 263 | 40 | 358 | 60 | 526 | |||
| Silty clay loam, Alfisol, pH 7; exhaustion land, Rothamsted, UK; Syers et al. (Reference Syers, Johnston and Curtin2008); low phosphorus sorption; annual crops, wheat, potatoes, barley 46 years (1856–1901), fertilized with 1410 kg P/ha, followed by none for 99 years (1902–2001) | Phosphorus fertilizer minus control (–P) | 145 | 1410 | 584 | 41 | 824 | 59 | 1170 |
This table is comprised of soils of different texture, mineralogy, SOM and phosphorus sorption levels. It includes trials with a residual effect after stopping phosphorus applications, as well as those where phosphorus applications were frequent, mostly yearly. From this disparate evidence, the following conclusions can be made:
Phosphorus fertilizer recovery by crops averaged 58 percent, ranging from 28 percent to 79 percent without a trend of decreasing recovery with increasing rates of application, which is commonly the case. The low number of trials (13) may be the reason for this.
Crops on soils with clayey textures generally recovered more fertilizer phosphorus than those with sandy textures, although there were some exceptions. Crops on clayey soils with variable charge (Oxisols and Ultisols in this table) had recovery values in a similar range to crops on clayey soils with permanent charge.
Regardless of soil, texture, mineralogy or length of trial, the median RRP value was 59 percent, with only 3 out of 13 trials showing values lower than 40 percent. The standard deviation is ±15. These values assume negligible runoff, erosion and leaching losses.
Even with 99 years since the last application of phosphorus fertilizer, in the classic exhaustion trial at Rothamsted, UK, almost 59 percent of it remained in the soil (coincidentally the same as the median value).
The legacy phosphorus, therefore, is a very significant amount. Let’s calculate it. Total world phosphorus fertilizer inputs (mineral and organic) totaled 23.8 Tg P in the year 2000 (MacDonald et al. Reference MacDonald, Bennett, Potter and Ramankutty2011). Assuming the average phosphorus remaining in the soil is 59 percent, the legacy phosphorus represents 17 Tg P remaining in the soil that year. As indicated in Fig. 14.3, 140 Tg of phosphate rock were extracted every year in the early 2000s. Assuming an average content of 13 percent P in phosphate rock, this amounts to 18.2 Tg P per year. Therefore, legacy phosphorus remaining in the soil from mineral and organic fertilizer additions, 17 Tg P is equivalent to 93 percent of the annual phosphate rock extraction. In other words, the amount of legacy phosphorus in the soil is about nine-tenths of what we mine as phosphate rock annually.
So, what happens to this truly residual phosphorus? It is definitely not lost, because it stays in the soil, mainly in the topsoil, probably in the more recalcitrant Pi and Po fractions. The only fractionation dynamics exercise I was involved with was the 18-year field trial in Yurimaguas, Peru, in the same sandy Ultisol (Beck and Sanchez Reference Beck and Sanchez1994, Reference Beck and Sanchez1996). About 80 percent of the increases in total phosphorus in the fertilized treatment were accounted for by the increases in five Hedley fractions: sorbed (NaOH-extractable) Pi; slow Po (NaOH-extractable Po); passive (sonic) Po; Ca-Pi (HCl-extractable) and residual (H2SO4-extractable) Pi, shown in Table 14.21. The remaining increases were in the labile Pi fraction and soil solution Pi, with decreases in the active Po (bicarb Po). It will vary in other soils, but it seems reasonable that what stays is in the more recalcitrant fractions.
| Fractions | Method | Time 0 | Change in 18 years | |
|---|---|---|---|---|
| +Fertilizer | 0 | |||
| (kg P/ha) | ||||
| Inorganic: | ||||
| Soil solution Pi | Resin Pi | 4 | +12 | –1 |
| Labile Pi | Bicarb Pi | 10 | +35 | +3 |
| Sorbed Pi | NaOH Pi | 24 | +82 | –9 |
| Primary min | Sonic Pi | 2 | +9 | +6 |
| Ca-Pi | 1 M HCl Pi | 0 | +8 | 0 |
| Residual Pi | H2SO4 Pi | 76 | +76 | +38 |
| Total Pi | Sum | 116 | +222 | +37 |
| Organic: | ||||
| Active Po | Bicarb Po | 24 | –5 | –5 |
| Slow Po | NaOH Po | 64 | +34 | +5 |
| Passive Po | Sonic Po | 10 | +11 | +6 |
| Total Po | Sum | 98 | +40 | +6 |
| Total P | Sum | 214 | +262 | +43 |
| Total residual: H2SO4 Pi + HCl Pi+ NaOH Pi +NaOH Po + sonic Po | 174 | +197 | +38 | |
| RRP (remaining in the soil – legacy phosphorus 1) | 75 | 88 | ||
| Additional data: | ||||
| Total phosphorus added (kg P/ha) | 23 | 1458 | 103 | |
| Harvest removal (kg P/ha) | 700 | 38 | ||
| Phosphorus remaining in topsoil (kg P/ha) | 758 | 65 | ||
| RRP (remaining in the soil – legacy phosphorus 2) | 52 | 63 | ||
Table 14.21 shows data from this tropical version of an exhaustion trial. In the control plot, yields went down to zero in the third crop and stayed so for the rest of the 18-year trial (Sanchez et al. Reference Sanchez, Villachica and Bandy1983). Still, there was a small increase in total phosphorus (43 kg P/ha) in the control plot.
This sandy loam soil was very acid (pH 3.9) with low soil fertility and variable charge under a high-rainfall, humid tropical climate. The Rothamsted exhaustion trial was in a clayey, fertile Alfisol (pH 7) with permanent charge in a humid temperate environment. It continued to produce crops throughout the 99-year period (Syers et al. Reference Syers, Johnston and Curtin2008). This shows the extremes – the acid, infertile soil stereotype of the tropics and the younger, fertile soil that is stereotypic of the temperate zone. (As mentioned above there are wide variations between these extremes in both tropical and temperate regions.) I do not know of any data from soils of either high or low phosphorus sorption capacity where all the phosphorus added was totally released to crops.
Table 14.21 also shows two ways of calculating legacy phosphorus, the first one, using the Hedley fractionation and the second the balance approach. The Hedley fractionation method gives a higher percent legacy phosphorus (72–88 percent) than the balance method used in other studies (52–63 percent). Additional research may explain why, but since the Hedley fractionation involves sequential extractions it may be subject to more errors, as Roel Merckx indicated earlier in this chapter.
14.9.2 Increasing Phosphorus Use Efficiency and Decreasing Environmental Damage
There is no question that the world’s cropland soils are being loaded with phosphorus. Is this good or bad? It is bad if much of this phosphorus is lost by runoff and erosion, entering water bodies, which may result in eutrophication. It is good, however, if part of that residual stock can be made available to plants, lowering the fertilizer needs and thus the rate of phosphate rock extraction. The question of how this enormous resource is used requires innovative research. Several possibilities exist.
The first and most obvious one is to use more realistic methods for determining the optimum rates of phosphorus required, such as the Linear Response and Plateau model as described in Chapter 12 over the quadratic methods, because the recommended rates are much lower (Anderson and Nelson Reference Anderson and Nelson1975). We have learned in this chapter that the recovery of applied phosphorus by plants decreases with increasing rates of application. MacDonald et al. (Reference MacDonald, Bennett, Potter and Ramankutty2011) found the same relationship in their metadata study. Again, this is the advantage of being where the linear part meets the plateau part of the yield response function. Phosphorus application rates can decrease by significant amounts without yield decreases. Sattari et al. (Reference Sattari, Bouwman, Giller and van Ittersum2012) made this point forcefully.
The second is to use crop cultivars that are more efficient in phosphorus acquisition, further lowering the rates of phosphorus fertilizer to apply. Brazilian breeders have done this with maize, lowering the critical soil test level from 20 to 5 mg/kg Mehlich 1 P.
The third is to find out how to mobilize the half of the residual phosphorus that plants are not able to take up over decadal time scales. This is a major research question.
The fourth is to prevent runoff and erosion losses of phosphorus. This includes farm fields fertilized with phosphorus, not only inorganic sources but particularly manure applications. Soil conservation structures are a good option in fields subject to runoff by intense rainfall, particularly after the applications of phosphorus fertilizers and manures. This is also the case where fertile farmland is being transformed into housing developments, roads and industrial sites.
The fifth is to reverse the uncoupling of ruminant animals no longer able to graze from pastures. Livestock are now spending fattening periods in confined animal feeding operations (CAFOs). Manure piles (or sometimes small mountains) accumulate, unprotected near CAFOs of both ruminants and monogastric livestock. Much of this manure is land-applied, repeatedly, to fields close to the feeding facilities, leading to large phosphorus surpluses. Such fields mineralize lots of phosphorus, which will probably end up in surface waters. Cattle return most of the phosphorus they eat as feces and urine. Under grazing, this is a very efficient recycling system that really benefits the soil and avoids manure being accumulated as a waste product (see Chapter 18).
The sixth is improving the phosphorus capture in sewage sludge treatment plants, using iron and aluminum oxides to retain phosphorus and take it out of the sludge. Pattnaik et al. (Reference Pattnaik, Yost, Porter, Masunaga and Attanandana2008), working on how to minimize phosphorus levels from occasional overflows of dairy effluents in Hawaii, found innovative systems that eliminated a high percentage of phosphorus from such effluents.
Finally, something that is now regulated in rich countries: and that is decreasing the phosphorus content of detergents and other domestic chemicals.
14.10 Summary and Conclusions
Phosphorus is a complicated subject in soil science and particularly so in the tropics. Contrary to carbon and nitrogen cycles, which are basically organic, phosphorus involves both organic and inorganic stocks. Some reactions are very fast, some very slow, and many of them are not well understood.
Phosphorus deficiencies in relation to plant needs are very common in the tropics. In large areas of tropical South America (Cerrado, Llanos) and Africa (Sahel), phosphorus is the first nutrient deficiency that has to be corrected in agriculture, ahead of nitrogen.
Phosphorus Cycling
The global phosphorus cycle is different from those previously described in that the cycle exists only at a geologic time scale. Tectonic uplift in geologic time raises apatite-rich phosphate rocks to land and continental shelves at an annual rate of 111–185 Tg of phosphate rock per year. This is within the range of the world’s annual extraction rate of phosphate rock, currently estimated at 140 Tg of phosphate rock per year.
There is no phosphorus cycle at the human time scale, because we have one source (phosphate rock) and one sink (marine sediments) without a feedback loop to make it a cycle. Much of the phosphorus that is added to the soil tends to remain there, often building up large residual stocks in the soil, part of which stays there for the long term.
Soil Stocks and Flows
Between the source and the sink there are many phosphorus fractions or pools, inorganic and organic. These stocks are connected by several opposite fluxes: dissolution–precipitation; sorption–desorption; mineralization–immobilization; decomposition of organic inputs–plant uptake. In addition there are several one-way physical transfers: harvest removals of crop and livestock products, crop residue returns, manures, fertilizer applications, erosion and runoff to surface waters, and sewage.
With phosphorus, the focus is on the topsoil because phosphate ions are strongly held there (except in sandy soils) and this is where the sorption of fertilizer phosphorus occurs.
The primary soil mineral fraction is present in the sand and silt fractions. Apatites and other minerals are slowly dissolved by the soil’s acidity and organic acid secretions from soil microorganisms, roots and mycorrhizae. The resulting phosphate anions are short-lived in the soil solution because they are rapidly sorbed as secondary phosphorus minerals or immobilized by microorganisms in soil organic matter (SOM). This is the origin of soil organic phosphorus (SOP).
The secondary phosphorus minerals that are formed in the soil are grouped into three active fractions and one recalcitrant fraction in terms of their solubility. In decreasing order of solubility they are calcium-bonded phosphates, which are more prevalent in neutral to calcareous soils, aluminum-bonded phosphates and iron-bonded phosphates, both of which are most common in acid soils. The least soluble is the residual Pi (i = inorganic) fraction, considered the sum of occluded and reductant-soluble fractions. The transformation of one fraction of secondary inorganic phosphorus into another is controlled mainly by soil pH and calcium, in the soil solution. As soils become more acid, the activity of iron and aluminum increases and the relatively soluble calcium phosphates are converted into less soluble aluminum and iron phosphates.
Organic phosphorus is variable in soils of the tropics. Organic phosphorus mineralization is the main flux supplying soil solution phosphorus to plants in natural systems, but not in fertilized agricultural systems. Most SOP compounds are bonded to oxygen in ester bonds (–C–O–P). More than half of the organic phosphorus is composed of monoesters, mainly inositol phosphate (phytate). Phosphate ester bonds can be readily broken by one extracellular enzyme, phosphatase, which is produced by microorganisms, roots and mycorrhizae. Iron oxides sorb inositol phosphates more strongly than phosphate anions, perhaps protecting them from enzyme attacks.
When fertilizing annual crops, only 3–10 percent of the applied phosphorus becomes organic phosphorus. Pastures convert more (5–30 percent) and perennial crops, agroforestry and forestry plantations the most (17–44 percent).
The Hedley sequential fractionation of both Po and Pi fractions has become useful in the tropics, although some scientists think otherwise.
Phosphorus Sorption
Phosphorus sorption (ex-fixation, ex-retention) is the transformation of phosphorus in the soil solution into solid, sparingly soluble forms of phosphorus on the surface of soil clays by processes that make them not readily available to plants.
Three mechanisms of phosphorus sorption by soils are recognized: precipitation, in three-dimensional amorphous or crystalline solids such as calcium phosphates; adsorption, in two-dimensional films or sheets where phosphate ions are chemically bonded to reactive surfaces of soil clays; and absorption, a slow, continuing reaction, where phosphate anions penetrate into the matrix of iron and aluminum oxides. Some scientists suggest that the slow reaction is the formation of a second bond of a phosphorus molecule to an oxide surface.
The latter two processes are collectively called sorption in the soils literature, or sometimes the fast and slow reactions. Dissolution is the opposite process of precipitation while desorption is the opposite process of sorption.
In alkaline soils (> pH 7) phosphate ions are precipitated by calcium and magnesium as relatively insoluble compounds, which are slowly dissolved by organic acids.
Fox and Kamprath developed the most widely used analytical procedure for developing phosphorus sorption curves. The amount of phosphorus sorbed (PS) to give a soil solution concentration of 0.2 mg P/L PL was then considered the agronomically relevant estimate of phosphorus sorption. Data presented in this chapter suggest a concentration of 0.01 mg/L PL or lower fits better to provide 80 percent of the maximum crop yields and is well related to the critical levels of many phosphorus soil tests.
High phosphorus sorption can be estimated in the field for topsoils using two attributes of the Soil Functional Classification (FCC) system.
Phosphorus sorption largely depends on the three core soil properties: texture, mineralogy and SOM. Phosphorus sorption increases with increasing clay content. Clayey soils with permanent-charge mineralogy have little phosphorus sorption, those with kaolinitic and oxidic mineralogy have high phosphorus sorption levels and those with allophanic mineralogy have the highest. Among the kaolinitic and oxidic mineralogies, the less crystalline the iron and aluminum oxide coats and films are, the higher the phosphorus sorption. In soils with high oxide contents, organic radicals of SOM can block exposed hydroxy groups on the surfaces of iron or aluminum oxides and thus decrease phosphorus sorption capacity.
The high phosphorus sorption capacity of some soils can be ameliorated by liming aluminum-toxic soils, and silicate amendments in soils low in silica, as well as by adding inorganic phosphorus fertilizers. To a lesser extent, phosphorus sorption can temporarily be decreased by repeated applications of high-quality leafy organic inputs. One practical implication is that phosphorus sorption curves should be constructed after lime and silicate applications in order not to overestimate the amount of phosphorus required.
Phosphorus Release
Eventually, much of the phosphorus sorbed is released back to the soil solution, particularly when plant roots remove phosphate ions from the soil solution, creating a concentration gradient and causing phosphate ions to be released from sorbed sites or precipitates and move towards the roots by diffusion. In addition, the active pool of SOP can be mineralized in response to phosphorus nutrient demand by microorganisms.
Phosphorus release is not quantitatively the reverse of sorption. There is a hysteresis.
Soil Tests
Phosphorus soil tests are empirical determinations that attempt to extract, in a few minutes, an amount of phosphorus that will correlate with a plant’s response to phosphorus fertilization throughout the crop’s life.
When used and interpreted properly, soil tests can distinguish soils that will probably respond to phosphorus fertilization from those that are not likely to do so. The point of inflection is called the critical soil test level. Soil tests do not tell you how much phosphorus to add.
Critical levels have been developed all over the tropics for the main crops. In general, the Bray 1 hovers around 8–14 mg/kg P, Mehlich 1 around 12–30 mg/kg P and Olsen around 30 mg/kg P. These values roughly correspond to 0.01 mg/L PL in the phosphorus sorption curves.
What is needed is a meta-analysis of algorithms that translate one major soil test method into others on a wide range of soil textures, mineralogy and SOM levels for different crops across the tropics and the world, with the appropriate boundary conditions.
Phosphorus Requirements of Plants
The external phosphorus requirements of plants are most practically measured by the soil tests that correlate best with about 80 percent of maximum crop yields in specific regions. The internal phosphorus requirement is the percentage of phosphorus in plant tissue that also correlates best with 80 percent of maximum crop yields. Internal requirements vary with stages of growth as well as between species and cultivars.
It is now possible to select varieties or cultivars of crop and pasture species that have a lower external phosphorus requirement for 80 percent maximum yield than those presently used. Fortunately, aluminum tolerance and “low phosphorus tolerance” often occur jointly and therefore cultivars can be bred for joint tolerance.
Embrapa scientists in the Cerrado of Brazil have found maize hybrids that are high-yielding, aluminum-tolerant and able to yield 6–8 t/ha of grain with as little as 5 mg/kg of available phosphorus by the Mehlich 1 method, in contrast with the usual critical level of about 20 mg/kg P by the same method, saving considerable phosphorus fertilizer.
The physiological mechanisms responsible for these cultivar and species differences are not well understood. The main ones that affect phosphorus uptake are differences in effective root volume (particularly root hairs and mycorrhizal associations) and rhizosphere exudation.
Phosphorus Fertilizers
All phosphorus fertilizers, including the organic ones, originate from phosphate rock. Superphosphates and other soluble inorganic fertilizers are the product of reacting phosphate rock with acids. Organic fertilizers come from the immobilization of phosphate ions that originated from the dissolution of phosphate rock by microbes.
Phosphorus fertilizer management in soils with low to moderate phosphorus sorption capacity is usually a simple proposition. Fertilizers should be at least 40–50 percent water-soluble to insure an adequate phosphorus supply early in the crop growth stages, when needed the most. Single and triple superphosphate and diammonium phosphate meet this requirement and can be used effectively in most soils with low to moderate phosphorus sorption capacity.
Phosphorus fertilizer management in soils with high phosphorus sorption capacity is based on an initial broadcast “corrective” application, followed by small, banded maintenance phosphorus applications every year. The various options were shown by the classic experiment that started in 1972 in a clayey Oxisol near Brasilia and continued for 13 years. The highest broadcast rate of 280 kg P/ha provided the highest maize yields for 13 years.
Igneous and metamorphic phosphate rock deposits are the least soluble; they are almost never used for direct application and relatively little for phosphate rock production. Sedimentary resources (of marine origin) are more soluble and consist largely of fluorapatite and francolite, accounting for the vast majority of phosphate rock production and soluble phosphorus fertilizers. Many of the sedimentary deposits can be used for direct application in acid soils. Biogenic deposits (guano) are the most soluble, great for direct application in acid soils, but only locally important.
Tropical Latin America has a wide variety of medium to high reactivity phosphate rocks. Brazil has mainly low-reactivity phosphate rocks, which are widely used. Tropical Africa appears to have medium-reactivity phosphate rocks in West Africa, while the low-reactivity ones predominate in East and southern Africa, due to the largely sedimentary geology of West Africa in comparison to the largely mountainous/plateau backbone of East and southern Africa. Surprisingly, there seem to be few known phosphate rock deposits in tropical Asia.
Phosphate rock dissolution releases a lot of calcium, which can increase soil pH. The reactivity of phosphate rocks is higher in soils with low exchangeable Ca2+ levels. High phosphorus sorption in Oxisols and Ultisols enhances the dissolution of phosphate rock particles. The higher the SOM content the better the dissolution of phosphate rock will be.
Phosphate rocks with high (>5.9 percent) neutral ammonium citrate solubility can be applied directly to most annual and perennial crops. Those of medium to high neutral ammonium citrate solubility (3.4–5.9 percent) can be applied directly to low phosphorus-demanding crops like many forage species, sugar cane and tree crops. Phosphate rocks of low neutral ammonium citrate solubility (< 3.4 percent) can be applied directly to tea, perennial tree crops, rape and cabbage.
Brazilian scientists tried many combinations of their phosphate rocks with superphosphate, banded applications, which were summarized in five strategies depending on how quickly the farmer wishes to achieve the target of 80 percent of the maximum yield: in 2 years, 4 years, 6 years, 8–10 years and one that perpetuates poverty in soils with high phosphorus sorption capacity.
In contrast with the large mechanized farms of Brazil, East African scientists, also confronted with high phosphorus sorption soils but with smallholder farms, have developed strategies based on combining soluble fertilizers, biomass transfers of high-quality plant resources, manures and high-reactivity biogenic Minjingu phosphate rock.
Organic plant inputs can immobilize or mineralize available phosphorus in the soil, with the critical level being about 0.25 percent P in their leaves. Given the high phosphorus content (~ 0.2–0.6 percent) and high quality, Tithonia diversifolia fresh leaves act very much like soluble phosphorus fertilizers, combining well with superphosphates and showing similar residual effects. It is not practical to apply tithonia at rates higher than 5 tons of dry mass per hectare per crop (which provides about 15–20 kg P/ha) because of the high labor costs of gathering it from roadsides or field boundaries. Nutrient accumulators like tithonia and other members of the Asteraceae family can play a strategic role in the management of soils in the tropics.
The effects of cattle manures and composts made from smallholder farms and household refuse depend on the reactivity of phosphate rocks. When these inputs are of high quality (C:P ratios < 150) they increased the solubility of low-reactivity phosphate rocks, but decreased or did not affect the solubility of high-reactivity rocks, apparently because of increasing pH and calcium contained in the phosphate rocks as impurities and in the organic inputs. Poultry manure has such a low N:P ratio that when trying to apply the correct amount of nitrogen, there may be phosphorus pollution.
Phosphorus Recovery by Crops and Phosphorus Remaining in the Topsoil
Unlike mineral nitrogen fertilizers that have a short residual effect or none at all, phosphorus fertilizers – mineral or organic – can have long residual effects, because of the phosphorus sorption and release processes. Only 10–20 percent of the phosphorus fertilizer applied is generally recovered by the first crop. The total phosphorus recovery of the first two crops ranges from 12 percent to 36 percent.
A compilation of trials ranging from 2 years’ to 145 years’ duration, comprising soils of different topsoil textures, mineralogy and phosphorus sorption levels, shows remarkable trends:
Regardless of soil texture, mineralogy or length of trial, the majority (59 percent median) of the phosphorus fertilizer applied remained in the topsoil. Even after 99 years since the last application of phosphorus fertilizer, almost 60 percent of it remained in the soil in the classic exhaustion trial at Rothamsted, UK.
The phosphorus fertilizer recovered by crops ranged from 28 percent to 79 percent, with a mean of 58 percent recovered in the 13 trials.
In a clayey Brazilian Oxisol, 61 percent of the 70 kg P/ha rate was recovered in 13 years, but this value was only 35 percent for a rate of 560 kg P/ha. This may simply be the effect of the lower rates being at the linear portion of the phosphorus response curve. This suggests the lowering of application rates as a general policy.
So, what happens to this truly residual phosphorus? It is definitely not lost, because it stays in the soil, probably in the more recalcitrant inorganic and organic phosphorus fractions.
In a sandy, low phosphorus sorption Ultisol in Yurimaguas, Peru, about 80 percent of the increases in total phosphorus remained in the soil after 18 years of fully fertilized continuous cultivation. The increases could be accounted for by the increases in five Hedley fractions: sorbed Pi, slow Po, passive Po, and residual Pi and the non-recalcitrant Ca-Pi fraction, which probably represents recent superphosphate applications that had not reacted.
Two “exhaustion” trials showed similar results. The 99-year trial in a permanent-charge Alfisol, with pH 7, in Rothamsted, UK still kept 59 percent of the phosphorus added in the topsoil, while the Yurimaguas case, in a variable-charge Ultisol, with pH 3.9, kept 52 percent of the added phosphorus, virtually all of it in the same four recalcitrant fractions as in its fertilized counterpart. I do not know of any data from either high or low phosphorus sorption soils where all the phosphorus added was totally released to crops.
There is no question that the world’s cropland soils are being loaded with phosphorus. Is this good or bad? It is bad if much of this phosphorus is lost by runoff and erosion, entering water bodies, which may result in eutrophication. It is good, however, if about half the residual phosphorus is released by desorption and mineralization from the different inorganic and organic fractions making available phosphorus that plants can utilize.
Legacy phosphorus is a very significant amount. Total world phosphorus fertilizer inputs (mineral and organic) totaled 23.8 Tg P in the year 2000. Assuming the average phosphorus remaining in the soil is 59 percent, the legacy phosphorus represents 17 Tg P. About 140 Tg phosphate rock were extracted every year in the early 2000s. Assuming an average content of 13 percent phosphorus in phosphate rock, this amounts to 18.2 Tg P per year. Therefore, the legacy phosphorus remaining in the soil from mineral and organic fertilizer additions, 17 Tg P is equivalent to 93 percent of the annual phosphate rock extraction. In other words, the amount of legacy phosphorus in the soil is about nine-tenths of what we mine as phosphate rock annually.
Increasing Phosphorus Use Efficiency and Decreasing Environmental Damage
Several options now exist that could increase the efficiency of phosphorus fertilizer use. These options would not only make better use of the existing phosphate rock reserves, but also decrease the environmental damage resulting from soil phosphorus. They include using the linear response and plateau model, which results in lower recommendations of how much phosphorus to add without sacrificing yields; using crop cultivars that are more efficient in phosphorus acquisition; preventing runoff and erosion losses; and reversing the uncoupling of ruminant animals, no longer able to graze.
In addition, there is a research imperative: find out how to mobilize the legacy phosphorus in soils.


