

Introduction
My interest in understanding how to control the movement of molecules began in an unusual way. I started my postdoctoral career working with the late Judah Folkman, attempting to isolate the first inhibitor of angiogenesis (blood vessel growth). To do so, it was critical to develop a bioassay for angiogenesis inhibitors, nearly all of which were macromolecules. We conceived of using a rabbit cornea assay where we could directly visualize blood vessel growth (Langer et al., Reference Langer, Brem, Falterman, Klein and Folkman1976) through an ophthalmic microscope. However, that assay could take up to several months, so it was critical to have a very small biocompatible controlled release polymer system that would not cause inflammation in the cornea, and that could slowly and continuously release macromolecules (e.g. peptides, proteins, and nucleic acids) for long time periods. When I started my investigations, it was widely believed that only low-molecular weight lipophilic compounds – but certainly not ionic molecules, peptides, or proteins – could be slowly released from biocompatible polymers. Dr. Folkman contacted many experts, including Paul Florey, a Nobel laureate in chemistry for his work on polymers, and they told him this couldn't be done – large molecules couldn't slowly leak out of a biocompatible polymer for any appreciable period of time (Cooke, Reference Cooke2001).
Developing a method to control the movement of macromolecules and ionic species from biocompatible polymers
Nonetheless, it was crucial to create these polymer systems if we were going to isolate angiogenesis inhibitors. Thus, I began studying this problem by examining different polymers with a known safety record in humans (Langer et al., Reference Langer, Rhine, Hsieh and Folkman1980). I studied polymers such as silicone rubber, ethylene-vinyl acetate, poly(lactic-co-glycolic acid) (PLGA) copolymers, and various hydrogels. I dissolved them in certain solvents (such as methylene chloride) and mixed them with biomolecules (often at different temperatures). I tried to approach this problem rationally (an ideal example of a rational approach would be that of the Swedish chemist Jacob Berzelius) but also by trial and error. From a rational standpoint, I had thought of some general concepts about using polymers with different swelling capacities and polymer porosities. I wanted to develop a system that might be leaky enough to allow release, but the problem was that to get such a system to release these molecules slowly was extremely challenging because our systems were very small – less than 1 mm in diameter, and often much smaller. So, on the one hand, if the drug would leak out at all, it would do so almost immediately. On the other hand, as scientists had told Dr. Folkman, the polymers themselves were impervious to ionic species (or macromolecules), so there would probably be no release at all. The challenge was: how could we get release, but slowly and reproducibly – for months? So I experimented and tested hundreds of combinations – different polymers, different solvents, various loadings of a drug, and different ways of creating the pellets. In one illustrative set of studies, I made polymer casting solutions by dissolving polymers in different solvents: poly-2-hydroxyethyl methacrylate (Hydron®) in an absolute alcohol at 37 °C; ethylene-vinyl acetate co-polymer in methylene chloride at 37 °C; and poly(vinylalcohol) by auto-claving in distilled deionized water (Langer and Folkman, Reference Langer and Folkman1976).
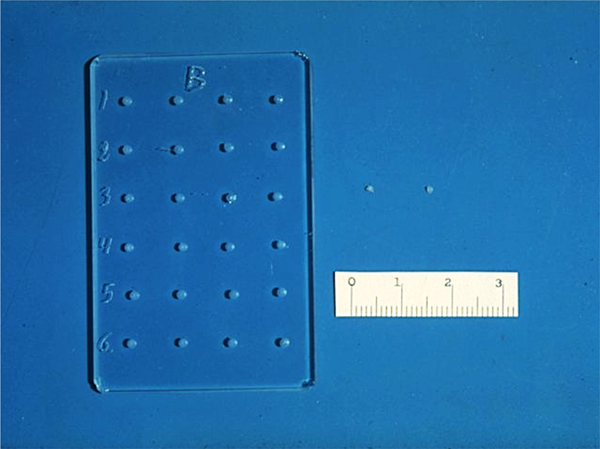
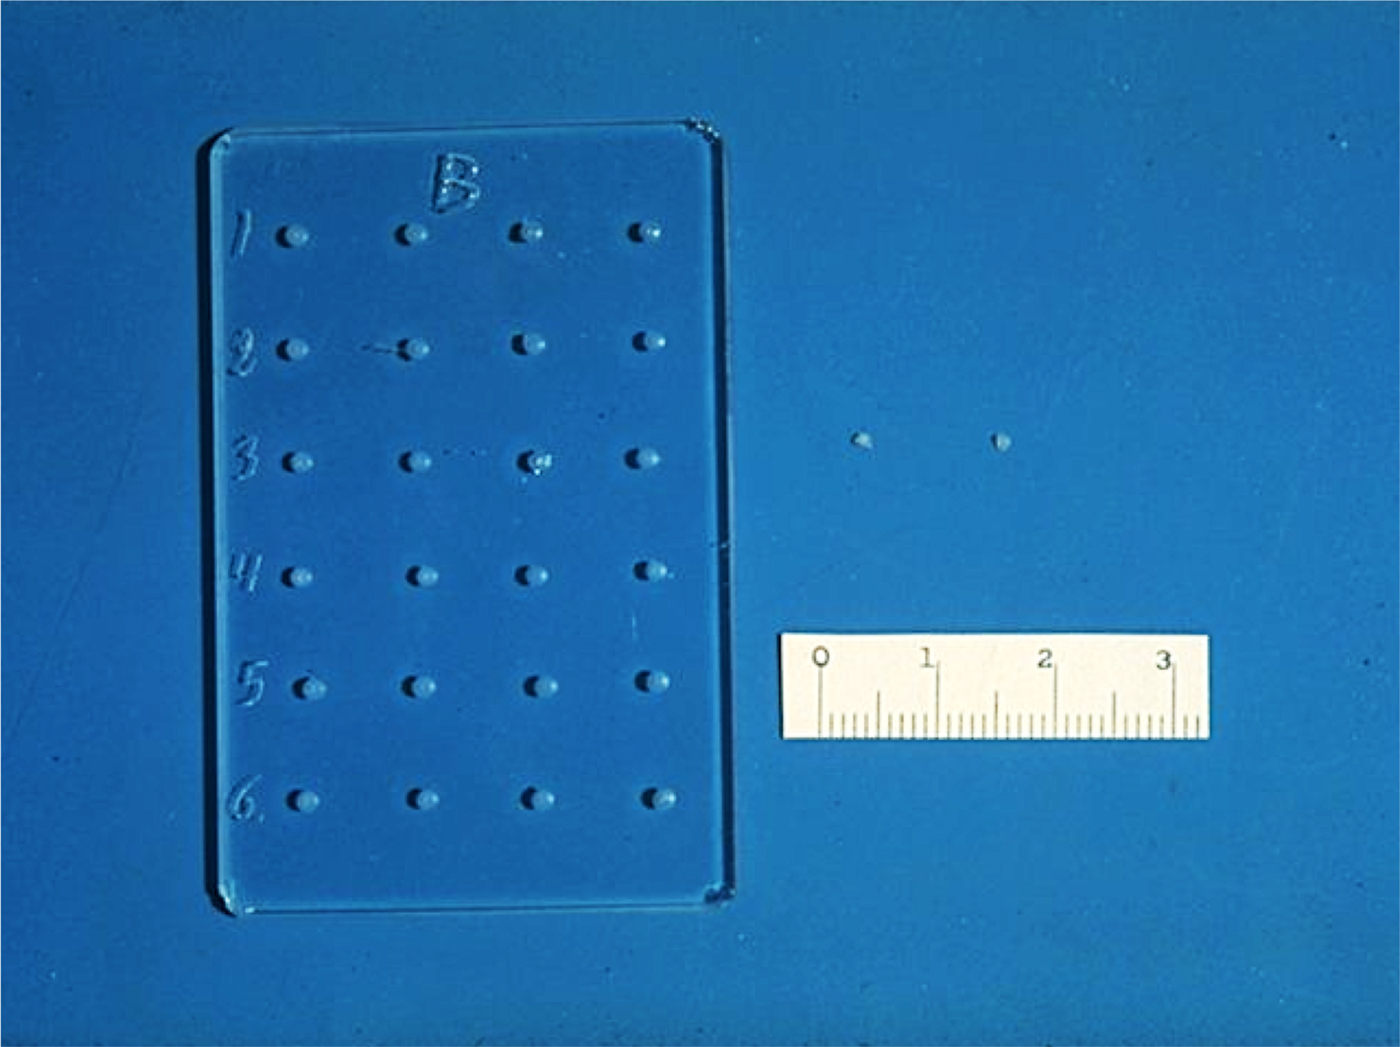
The slow-release pellets were made by mixing the molecules to be released with 100 µJ of casting solution and then placing a small amount of the resultant mixture in a tiny mold we designed (Fig. 1). The molds were then dried under vacuum overnight causing the solvent to evaporate with the molecule trapped within the polymer matrix. The dried polymer system was then rehydrated, and gently removed from the mold (Langer and Folkman, Reference Langer and Folkman1978).
Glass mold and ethylene-vinyl acetate copolymer pellets. Scale is in mm.
To further slow the diffusion of the molecules from the polymer matrix, I started making ‘sandwiches’ with a coat of pure polymer. Pure polymer solution was placed in the mold, allowed to dry under vacuum, and the solvent evaporated overnight. The polymer-molecule solution was then placed over this layer and dried under vacuum. Finally, a top layer of pure polymer was added and vacuum dried, resulting in a three-layer polymer system with the molecules in the middle layer. Alternatively, I could make polymer ‘sandwiches’ by removing the dry polymer containing molecules from its mold and suspending it in a puddle of pure polymer solution for approximately 20 s. Pure polymer adhered to the polymer-molecule surface, coating it and forming a ‘sandwich.’ This ‘sandwich’ was then vacuum-dried. I developed other variations as well (Langer and Folkman, Reference Langer and Folkman1978).
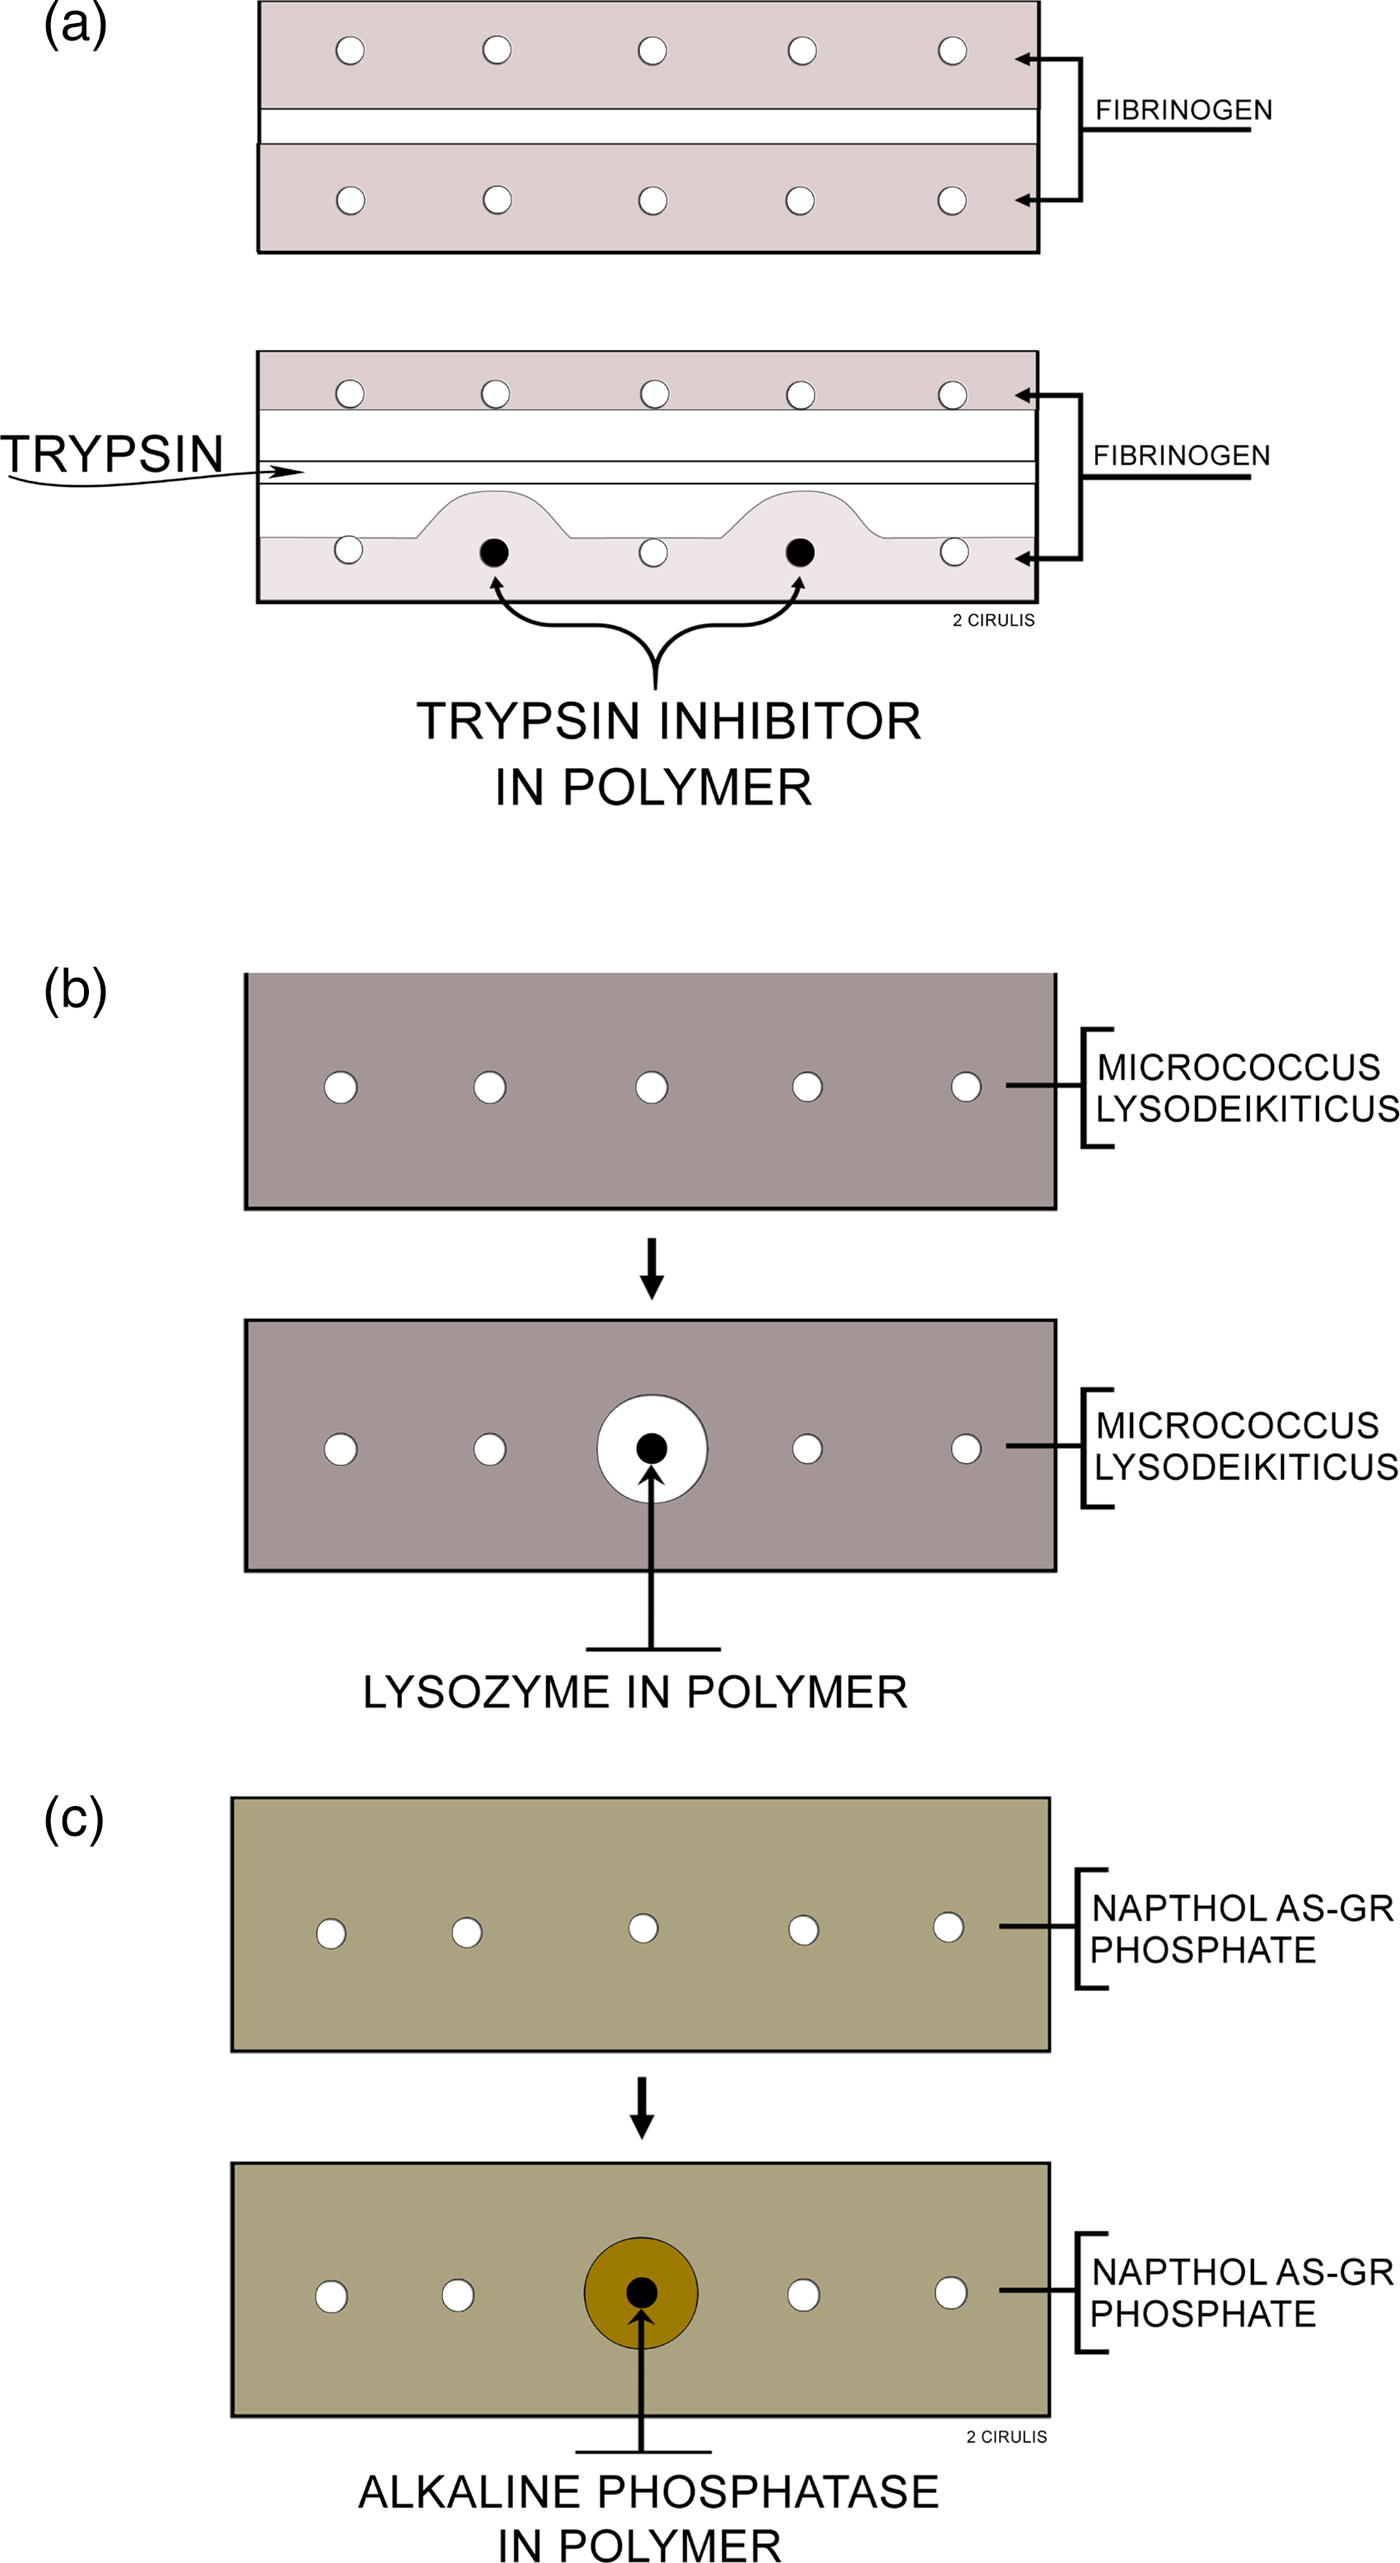
I studied whether molecules were being released in several ways. Importantly, the molecule needed not only to come out of the polymer continuously, but it also had to be biologically active. Biological activity was key, particularly since many people told me that some of the solvents I was using, such as methylene chloride, would destroy biologic activity of proteins and other macromolecules. I thought I could visually study biochemical activity and release using certain types of agar diffusion gels (Langer and Folkman, Reference Langer and Folkman1976) (Fig. 2). I had the idea that these gels would change color if enzymes (e.g. lysozyme, alkaline phosphatase) or enzyme inhibitors (soybean trypsin inhibitors) were released from the pellets in active form. This way, I could see every day with my own eyes whether release was occurring or not. The way I did these studies was that I would insert polymer pellets containing 300 µg of either soybean trypsin inhibitor, lysozyme, or alkaline phosphatase into the polymer pellets and incubate them in 20 cm3 volumes of lactated Ringer's solution at 37 °C. I changed the solution five times during the first day of incubation, daily each of the next 9 days, and every 2 days during subsequent incubation. Before each change, the pellets were blotted dry on an absorbent tissue to remove, in part, adherent solution, and then washed with additional Ringer's solution. Pellets were removed from incubation periodically, washed with Ringer's solution, and placed into wells on agar slides. More Ringer's solution was used to fill the remaining space in each well (Langer and Folkman, Reference Langer and Folkman1978).
Agar slides used to assay polymer pellets: (a) Trypsin inhibitor: the slide contains 1% agar and 0.1% fibrinogen in 0.1 M Tris buffer, pH 8. Trypsin is loaded into the center trough and digests the opaque fibrinogen. When the trypsin approaches a well containing a polymer releasing inhibitor, a zone is formed. (b) Lysozyme: the slide contains 1% agar, 0.03% micrococcus lysodeikticus in 0.05 M phosphate buffer, pH 7. Polymers releasing lysozyme digest the opaque bacteria forming a clear zone around the polymer. (c) Alkaline phosphatase: the slide contains 1% agar, 0.08% Naphthol AS-GR phosphate, and 0.1 M Tris buffer, pH 8. Polymers releasing alkaline phosphatase cause the formation of zones which appear as orange precipitates, due to the formation of Naphthol AS-GR, on a translucent yellow slide. From Langer and Folkman (Reference Langer and Folkman1978).
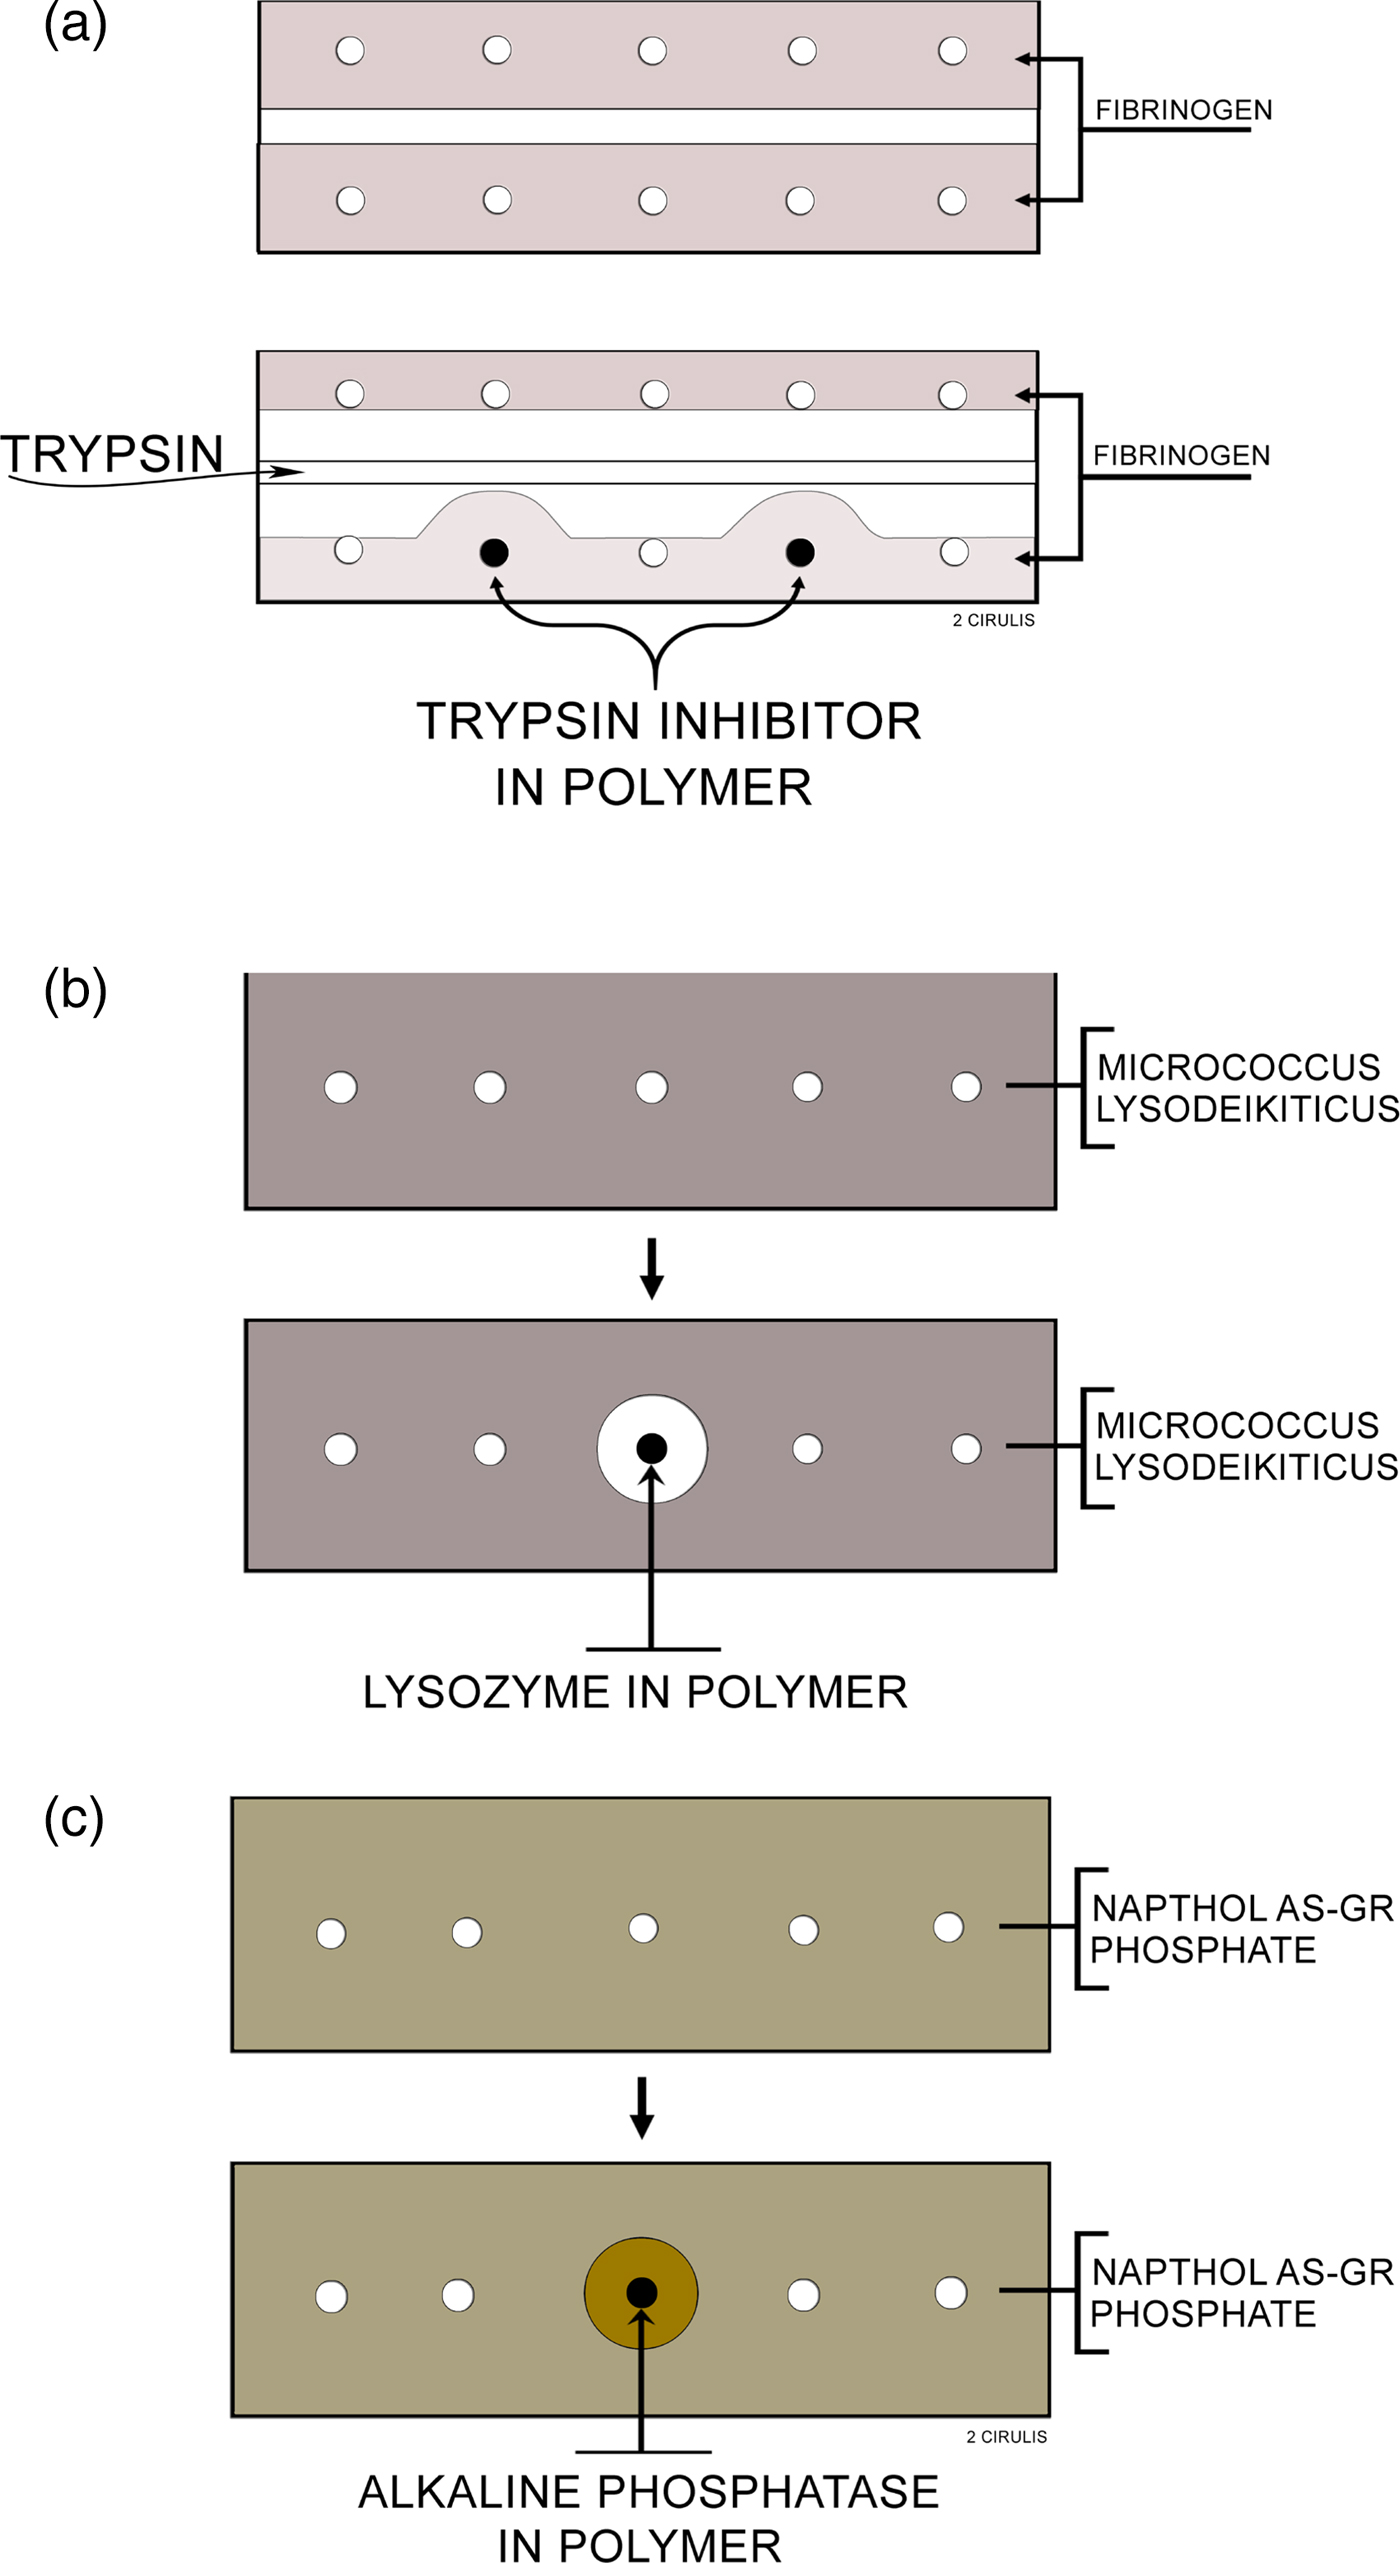
Almost every formulation I tested produced a color change in each of the three gels in the first few hours and sometimes up to a day. But then there was nothing: no color change at all on day 2. I tested hundreds of systems and I was very discouraged. Then finally, I found a formulation made of ethylene-vinyl acetate copolymer sandwiches that did result in a color change – and it kept changing every day, for over 100 days. I was incredibly excited to see this happen with my own eyes.
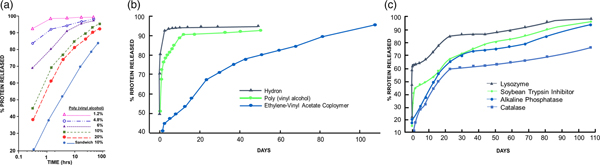
I also used protein assays to measure release (though they did not measure biologic activity). However, these assays showed me how I could vary chemical polymer formulation parameters to obtain different release rates. In one set of tests, poly(vinylalcohol), Hydron, and ethylene-vinyl acetate copolymer were examined for their ability to release soybean trypsin inhibitor (mol. wt. 21 000). The polymer to water ratio in the casting solution of poly(vinylalcohol) was important in determining release rates. The effects of various poly(vinylalcohol) concentrations in the casting solution on the rate of release of soybean trypsin inhibitor are summarized in Fig. 3a. Increasing the polymer concentration in the casting solution significantly decreased the initial rate at which protein was released. A threshold level was reached at about 10% poly(vinylalcohol), since further increases in polymer concentration did little to retard diffusion out of the pellet. Polymer concentrations above 20% resulted in solutions so viscous that they were technically difficult to work with (Langer and Folkman, Reference Langer and Folkman1976).
(a) Release of soybean trypsin inhibitor from poly(vinylalcohol). The concentration of protein in the casting solution was 12 mg cm−3. (b). Release of soybean trypsin inhibitor from polymer ‘sandwiches.’ Protein concentration in casting solution was 50 mg cm−3. (c). Release of proteins from ethylene-vinyl acetate copolymer ‘sandwiches.’ Protein concentration in casting solution was 50 mg cm−3. From Langer and Folkman (Reference Langer and Folkman1976).
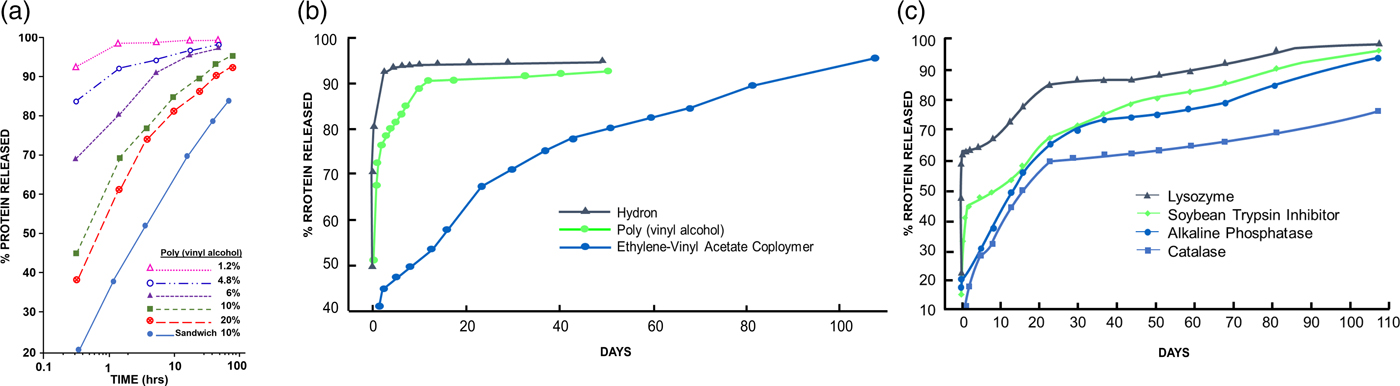
The results in Fig. 3a illustrate two additional features of these controlled release systems. First, a ‘burst' effect was observed in which a large percentage of protein was released during the first hour or so of incubation. Second, by constructing a polymer ‘sandwich,' the rate of diffusion was, in fact, significantly retarded. Water was also added to the Hydron–alcohol–protein casting solution. The greater the water to polymer ratio, the greater was the rate of protein release from the pellet. The release of soybean trypsin inhibitor from Hydron, poly(vinylalcohol), and ethylene-vinyl acetate copolymer ‘sandwiches' is shown in Fig. 3b. Casting solutions were 12% Hydron, 10% poly(vinylalcohol), and 10% ethylene-vinyl acetate copolymer. These concentrations minimized initial rates of release from each of the individual polymer systems and still allowed viscosities low enough so that the solutions were easy to work with. Molecules diffused out of Hydron relatively rapidly, somewhat more slowly from poly(vinylalcohol), and least rapidly from ethylene-vinyl acetate copolymer. The ‘burst' was evident for all three slow release systems. Release profiles for four different molecules from ethylene-vinyl acetate copolymer ‘sandwiches’ (Fig. 3c) showed that the molecules were continuously moving out of the pellets. Release lasted over 100 days. This result confirmed the agar gel studies (Langer and Folkman, Reference Langer and Folkman1976).
This discovery was initially ridiculed by the scientific community. My first nine grant applications were rejected. No chemical engineering department in the country would hire me as a faculty member. So I ended up joining the Nutrition Department at MIT. But the year after I joined, the department head who hired me left, so the senior faculty told me I should leave too. As my colleague, Michael Marletta, recalled, ‘One evening, I went to a faculty dinner at a Chinese restaurant with Bob Langer and some senior MIT professors. A senior scientist sat quizzing us while smoking a cigar. When the older scientist heard Langer's concepts for polymeric drug delivery, he blew a cloud of smoke in Langer's face and said, “You better start looking for another job.” I thought I was in a Fellini movie’ (Lash, Reference Lash2014). Although much later, the National Academy of Sciences would cite this work as ‘being responsible for much of today's drug delivery technology’ (National Academy of Sciences, 1999) and Nature would cite this work for ‘founding the field of controlled release drug delivery’ (Pearson, Reference Pearson2009), these repeated rejections at this early stage of my career were devastating to me.
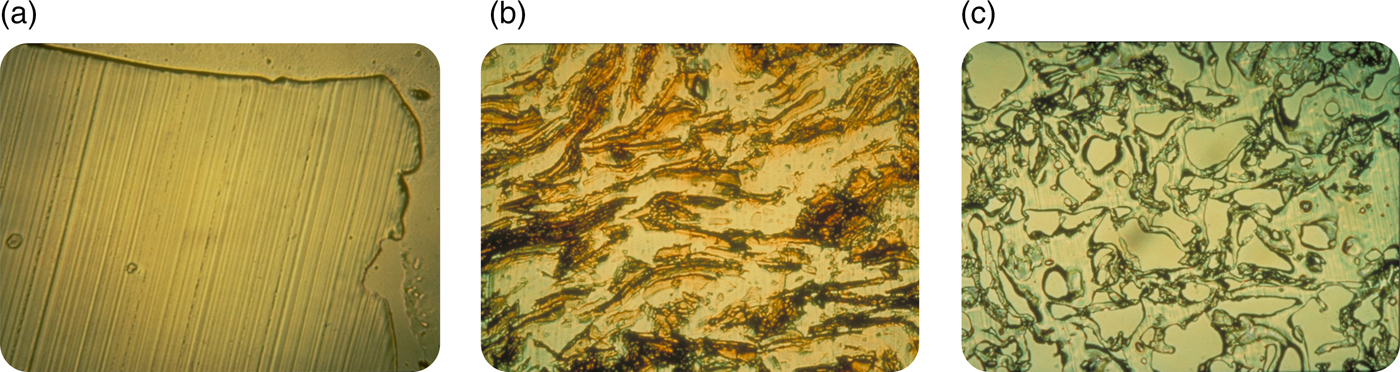
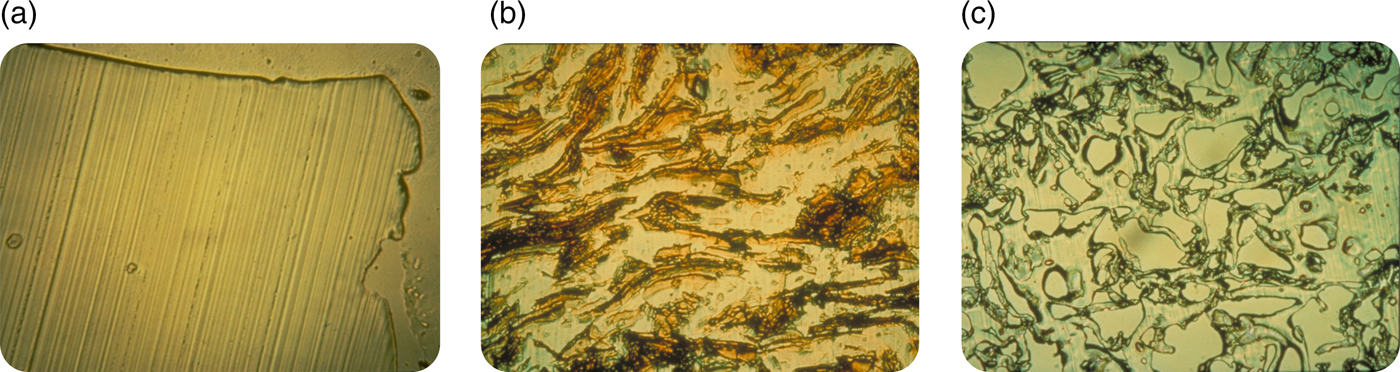
Nonetheless, I believed in what I was doing and I kept trying to persevere. I felt it was important to understand the mechanism of release from these systems. To determine how biomolecules could be continuously released from these seemingly impenetrable polymers, Rajan Bawa in our lab employed a cryomicrotome (normally used by pathologists) to cut thin sections through polymer matrices. This method helped to elucidate the polymer microstructure. When no biomolecule was placed in the polymer matrix, no pores were found (Fig. 4a), and molecules of 300 daltons or greater were unable to diffuse from one side of a thin (5 µm) polymer matrix section to the other. However, if a biomolecule was placed in a polymer matrix and sectioned, a phase separation was observed (Fig. 4b). When these systems were released for a year and then thin sections were cut, pores were left behind in place of the biomolecules that were originally there (Fig. 4c). The pores were created by this phase separation. In observing these pore structures by scanning electron microscopy, we found that the pores were large enough for molecules, even of several million daltons molecular weight, to pass through. However, the connections between pores were quite narrow and the pores themselves were very convoluted, slowing the net rate of molecular movement out of the matrix (Bawa et al., Reference Bawa, Siegel, Marasca, Karel and Langer1985). Using approaches such as controlling polymer molecular weight or composition (Hsu and Langer, Reference Hsu and Langer1985) and biomolecule particle size and concentration (Rhine et al., Reference Rhine, Hsieh and Langer1980), enabled us to tailor-make these systems to achieve different release rates. By controlling implant geometry, molecules could slowly be released at a constant rate (Hsieh et al., Reference Hsieh, Rhine and Langer1983). We also developed ways of formulating different polymers into microspheres and other structures (Cohen et al., Reference Cohen, Siegel and Langer1984, Reference Cohen, Yoshioka, Lucarelli, Hwang and Langer1991; Sefton et al., Reference Sefton, Brown and Langer1984). Furthermore, we developed mathematical models to understand and predict release, both of non-degradable and degradable systems (Balazs et al., Reference Balazs, Calef, Deutch, Siegel and Langer1985; Bawa et al., Reference Bawa, Siegel, Marasca, Karel and Langer1985; Saltzman and LangerReference Saltzman and Langer1989; Batycky et al., Reference Batycky, Hanes, Langer and Edwards1997).
Optical microscopy micrographs of controlled release polymers: (a) pure ethylene-vinyl acetate copolymer cast without drug (lines represent knife marks); (b) ethylene vinyl acetate copolymer matrix containing myoglobin crystals prior to release and (c) same system as (b) after 1 year.
I also remember Dr. Folkman suggesting we file a patent. In the 1970s, Boston Children's Hospital, where I started research, had not filed a patent before. However, they agreed to let us file one. But for 5 years in a row, the patent examiner rejected the patent application. Then the head of the Hospital's Technology Transfer Office told me the patent would never be allowed and that I should stop trying to convince the examiner, since explaining the science wasn't working. However, I don't like to give up. However, as discussed earlier, when we started our research, many people told us this was impossible – that it could never work. I wondered if anyone had written that down. So I did a Science citation search of our 1976 paper in 1982 and I found many papers citing us. One of them, written by five of the top polymer scientists in the world, stated:
‘Generally, the agent to be released is a relatively small molecule with a molecular weight no larger than a few hundred. One would not expect that macromolecules, e.g. proteins, could be released by such a technique because of their extremely small permeation rates through polymers. However, Folkman and Langer have reported some surprising results that clearly demonstrate the opposite’ (Stannett et al., Reference Stannett, Koros, Paul, Lonsdale and Baker1979).
‘Surprising’ was an important word for the patent examiner. When the examiner saw that, he said if I could get affidavits from all five scientists that they really wrote that, he would allow the patent. So I wrote them and they were all nice enough to write back that they really wrote it, and so the examiner agreed to allow the patent (U.S. Patent 4391797). Over time, this discovery enabled the practical use of many peptides, charged low-molecular weight pharmaceuticals, proteins, and nucleic acids. Since such molecules have extremely short half-lives in the body (minutes in some cases), a controlled release system must often be used and is the key for lasting therapeutic effects (I discuss some examples later).
Utilizing these polymer systems to isolate the first angiogenesis inhibitors
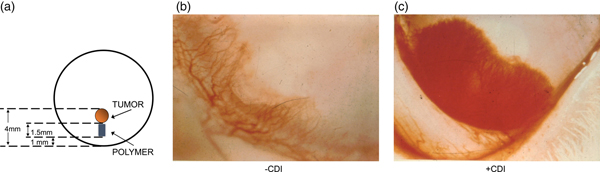
These controlled release systems enabled us to isolate the first substances that could inhibit the vascularization of tumors (Langer et al., Reference Langer, Brem, Falterman, Klein and Folkman1976). Using the rabbit cornea and the controlled release pellets as a bioassay for tumor induced vascularization, we assessed the inhibitory effect of many different purified fractions. Pellets of polymer and pieces of tumor (V2 carcinoma) were placed into corneal pockets in over 1000 corneas (Fig. 5a). Normally, the tumors grew as thin plaques, inducing vessels to sprout from the edge of the cornea 4–6 days after implantation. Vessel length and tumor diameter were measured every few days.
Rabbit corneal pocket assay. (a) Schematic diagram of rabbit cornea with tumor and polymer. (b) Photograph of the lower third of a rabbit cornea containing tumor and polymer plus inhibitor. Vessels are sparse and fail to grow in a zone surrounding the polymer. The tumor has not become vascularized. (c) Photograph of cornea containing tumor and polymer (without inhibitor). Vessels appear as a dense carpet sweeping over the polymer. At this time, the tumor has already vascularized and is growing rapidly. From Langer et al. (Reference Langer, Brem, Falterman, Klein and Folkman1976).
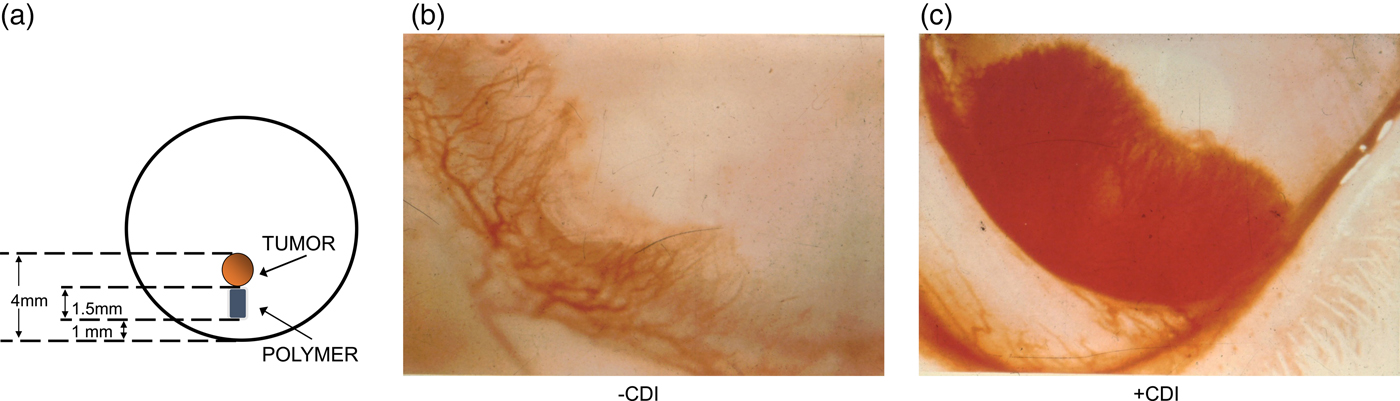
When polymer pellets were empty or if a fraction was inactive (as was almost always the case), vessels appeared as a dense carpet sweeping over the polymer toward the tumor (Fig. 5b). When vessels penetrated the tumor, it grew rapidly into a large protruding mass occupying nearly the entire cornea. Very similar results were obtained when polymer pellets containing substances without inhibitory activity were tested. By contrast, when an inhibitor was present, vessels were sparse, grew slowly, and failed to grow in a zone surrounding the polymer (Fig. 5c). By the 4th week many vessels were regressing. It was remarkable to see the blood vessels stopped in their tracks or even regressing with my own eyes every day.
This study established that angiogenesis inhibitors did, in fact, exist and the above controlled release polymer systems have proven fundamental to the isolation and study in vivo of nearly all angiogenesis stimulators and inhibitors (e.g. see Polverini et al., Reference Polverini, Cotran, Gimbrone and Unanue1977; Schor et al., Reference Schor, Schor and Kumar1979; McAuslan and Gole Reference McAuslan and Gole1980; Pliskin et al., Reference Pliskin, Ginsberg and Carp1980), including inhibitors of epidermal growth factor (Gospodarowicz et al., Reference Gospodarowicz, Bialecki and Thakral1979), fibroblast growth factor (Shing et al., Reference Shing, Folkman, Sullivan, Butterfield, Murray and Klags-brun1984), and vascular endothelial growth factor (Connolly et al., Reference Connolly, Heuvelman, Nelson, Olander, Eppley, Delfino, Siegel, Leimgruber and Feder1989). The references just cited are but a few early examples of the thousands of studies that have used these polymer systems to isolate and test angiogenesis factors. Without this polymer assay, the isolation of these inhibitors would likely not have been possible. As Judah Folkman noted in his abstract for the 2006 Symposium Celebrating Thirty Years of Robert Langer's Science:
‘Early research in tumor angiogenesis was propelled by the pioneering work of Robert Langer who discovered how proteins and other macromolecules could undergo sustained release from polymers that could be implanted into the avascular cornea of animals and into other tissues. This advance provided a general platform for the subsequent discovery and purification of angiogenesis regulatory molecules. It is difficult to imagine how such proteins could have been isolated and their angiogenic activity identified without Langer's contribution.’
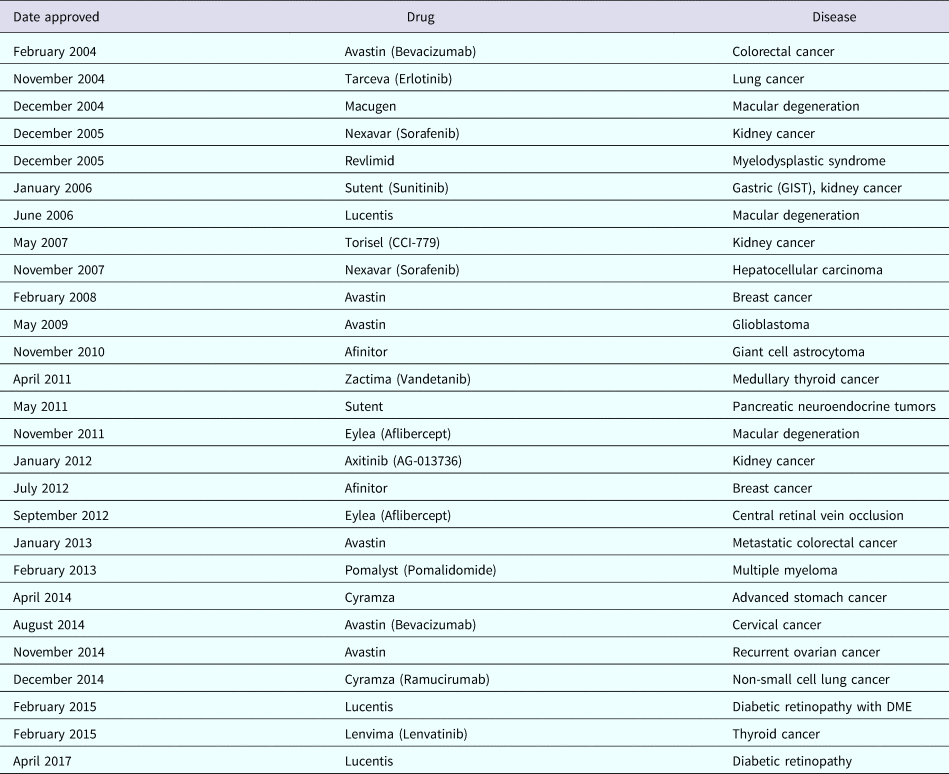
Similarly, as Cramer has written, ‘The first proof that numerous angiogenic proteins stimulate new vessel formation arose from an elegant feat of chemical engineering by Robert Langer, who devised a polymer bead. The bead, when placed in the avascular cornea, slowly and continuously released these proteins to stimulate the formation of new vessels’ (Cramer, Reference Cramer1998). The National Academy of Sciences' (1999) Beyond Discovery Report, Polymers and People, notes that ‘Robert Langer and Judah Folkman used this approach to isolate the first angiogenesis inhibitor.’ Numerous angiogenesis inhibitors have now been approved by regulatory authorities and are in clinical use (a partial list is provided in Table 1). They are expected to be used by 500 million patients worldwide (Carmeliet, Reference Carmeliet2005).
Examples of angiogenesis inhibitors approved for clinical use

Translating scientific discovery to benefit mankind in biology and medicine
The above controlled molecular release research has also had a significant impact on developmental biology, starting with Silberstein and Daniel's paper in Developmental Biology (Silberstein and Daniel, Reference Silberstein and Daniel1982), where they used our ethylene acetate-based implants to study the development of mammary and salivary glands. Many other investigators have used these molecules involved in implants to release different substances to study developmental processes. Park and Hollenberg provide an early review of this research and its impact (Park and Hollenberg, Reference Park and Hollenberg1993) and numerous investigators have used these implants to study such areas as eye specific segregation (Reh and Constantine-Paton, Reference Reh and Constantine-Paton1985; Cline et al., Reference Cline, Debski and Constantine-Paton1987), development of neural maps (Simone et al., Reference Simone, Prusky, O'Leary and Constantine-Paton1992), development of visual cortex (Liang et al., Reference Liang, Yu and Robertson1995), spinal cord development (Kalb and Hockfield, Reference Kalb and Hockfield1990), and many other developmental processes.
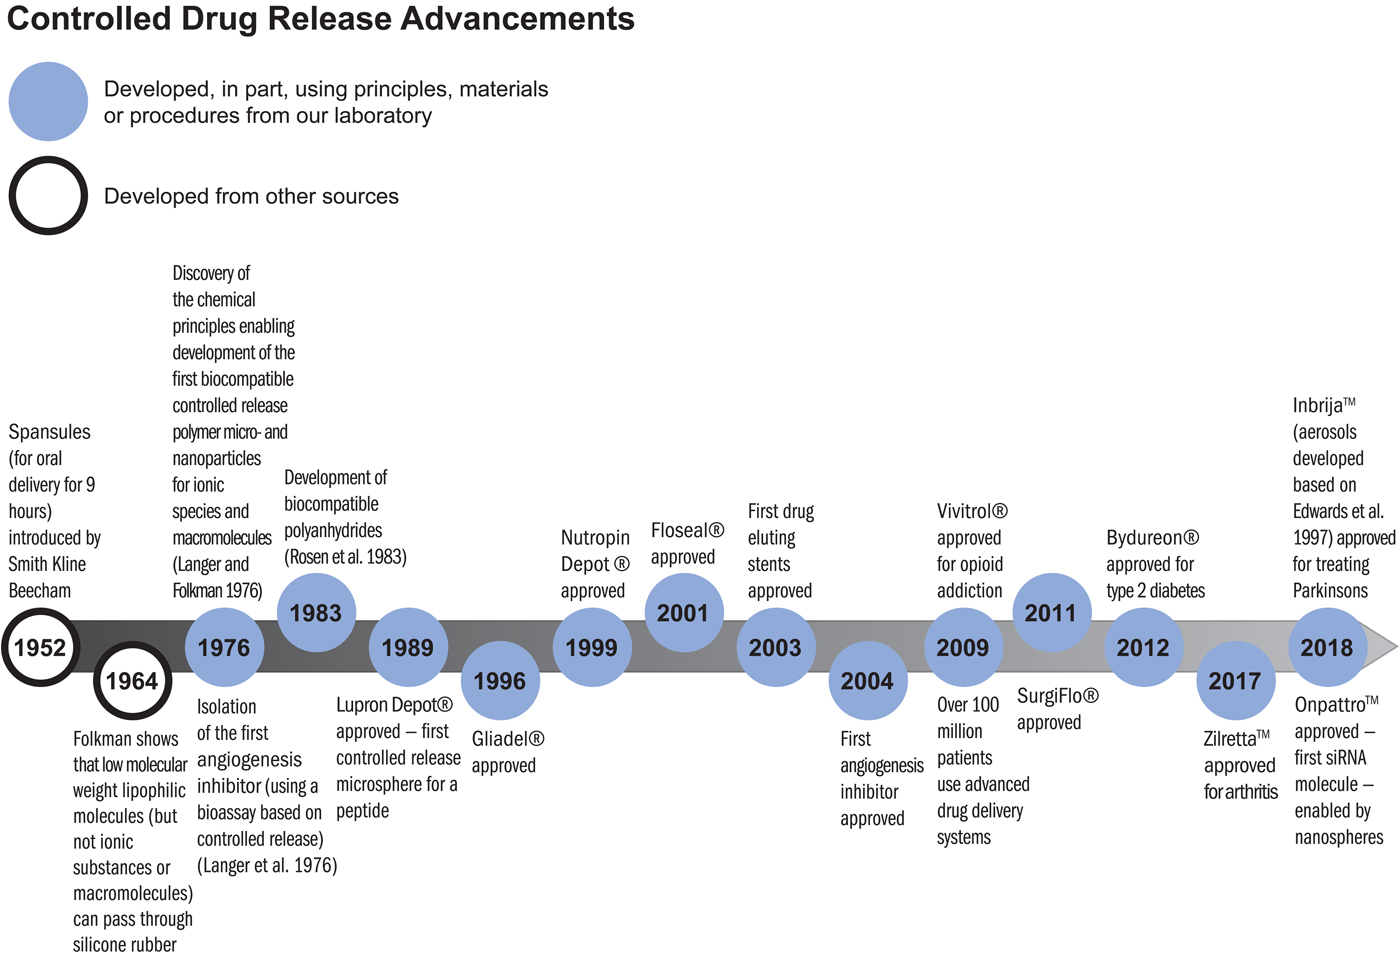
The principles established for the controlled movement of molecules have been essential to the development of numerous clinically used therapeutics. As former Nature editor, Phil Ball, described the field:
‘It was widely believed at first that polymer delivery systems would not be equal to clinical use of these systems. But in 1976, Langer and colleagues found that certain polymers, generally ones that were highly hydrophobic (water-repellent) such as copolymers of ethylene and vinyl acetate, could be mixed with powdered proteins and formed into microspheres that would release the proteins at a steady, slow rate, persisting sometimes for up to one hundred days. There seemed to be no limit to the size of the large molecules that could be released controllably in this way, nor to their nature: proteins, nucleic acids, and polysaccharides (sugar polymers) could all be used. In 1989, a controlled release system of this sort – microspheres made from a safe biocompatible copolymer of lactic and glycolic acid – was approved by the Food and Drug Administration (FDA) for use with a large-molecule peptide drug that combats prostate cancer. This was the first polymeric controlled-release system for peptide-based drugs to find medical approval, and it now provides the mostly widely used treatment for advanced prostate cancer’ (Ball, Reference Ball1999).
There are numerous controlled release polymer systems used by patients worldwide that continuously release these peptides for up to 6 months from a single injection (Lupron Depot, Zoladex, and Decapeptyl). Similar microspheres or other polymer systems containing bioactive molecules have led to new treatments for schizophrenia (Risperdal Consta), alcoholism, opioid addiction (Vivitrol), arthritis (Zilretta), controlling bleeding (Floseal, Surgiflo), pituitary dwarfism (Nutropin Depot), type-2 diabetes (Bydureon), and many other diseases (see timeline below). These systems have been used by many millions of patients every year.
Impact in unexpected areas
Sometimes our travels take us to places that lead to new, unexpected areas of science and technology. In the 1980s, I visited Israel and was invited to the Aquaculture Center in Eilat. There, I met Yonathan Zohar who then came to my lab to do a sabbatical. He used the ethylene vinyl acetate copolymer system and other polymer systems we developed to release GnRHa (gonadotropin-releasing hormone agonist) to induce spawning and control reproduction in fish. These hormonal delivery systems have had a major impact on the fast-growing aquaculture industry globally. It provided the industry with a means of inducing fish to spawn in captivity, whereas otherwise they would not, thus opening the spawning bottleneck and enabling hatchery-based aquaculture. These polymer-based GnRHa delivery systems have been used in fish hatcheries around the world to induce spawning and egg/juvenile production in scores of fish species, ranging from salmon to branzini (European seabass) to the bluefin tuna. Over the years, Zohar's group has published many papers on the development and use of the technology (for some examples, see Mylonas et al., Reference Mylonas, Richardson, Minkinnen and Zohar1995, Reference Mylonas, Gissis, Magnus and Zohar1997, Reference Mylonas, Bridges, Gordin, Belmonte Ríos, García, De la Gándara, Fauvel, Suquet, Medina, Papadaki, Heinisch, De Metrio, Corriero, Vassallo-Agius, Guzmán, Mañanos and Zohar2007; Sorbera et al., Reference Sorbera, Mylonas, Zanuy, Carrillo and Zohar1996; Fukaya et al., Reference Fukaya, Ueda, Sato, Kaeriyama, Ando, Zohar, Urano and Yamauchi1998; Mylonas and Zohar Reference Mylonas and Zohar1998; Zohar and Mylonas Reference Zohar and Mylonas2001; Holland et al., Reference Holland, Hassin and Zohar2003; Marino et al., Reference Marino, Panini, Longobardi, Mandich, Fionia, Zohar and Mylonas2003; Taranger et al., Reference Taranger, Vikingstad, Klenke, Mayer, Stefansson, Norberg, Hansen, Zohar and Andersson2004). According to Zohar, aquaculture is now a ~$230 billion industry globally, and this controlled release technology made it possible to complete the life cycles of many fish species allowing diversification in the industry and in general through reliable egg/juvenile production, significantly enhancing the economic feasibility of the industry.
Synthesizing new molecules and materials to control the movement of molecules
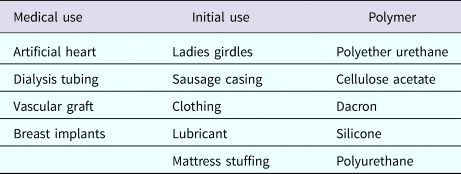
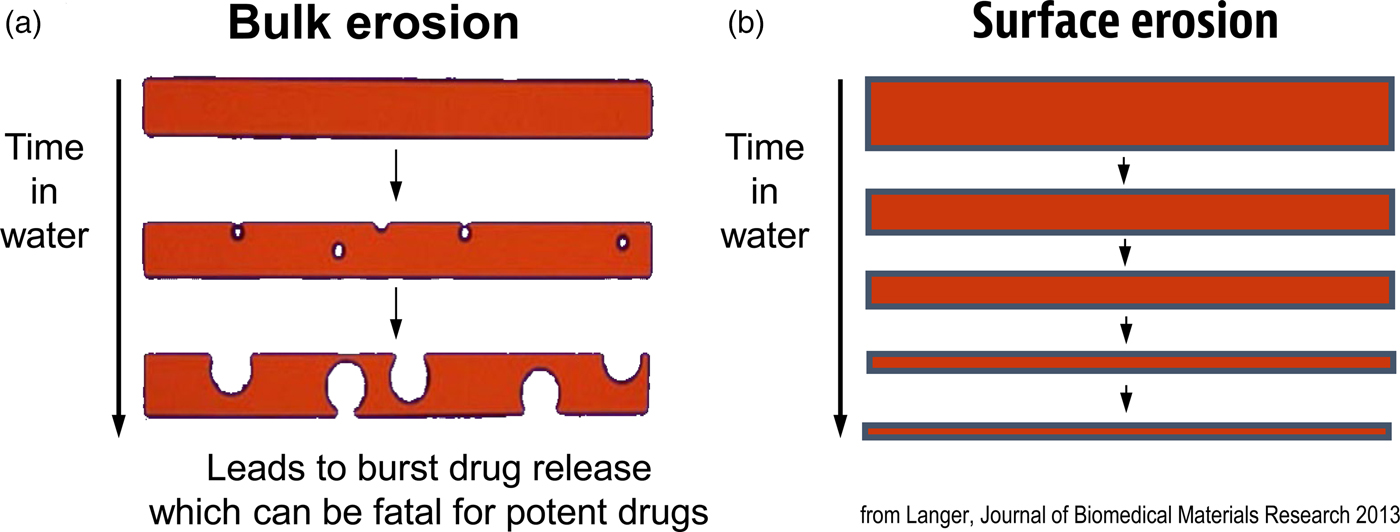
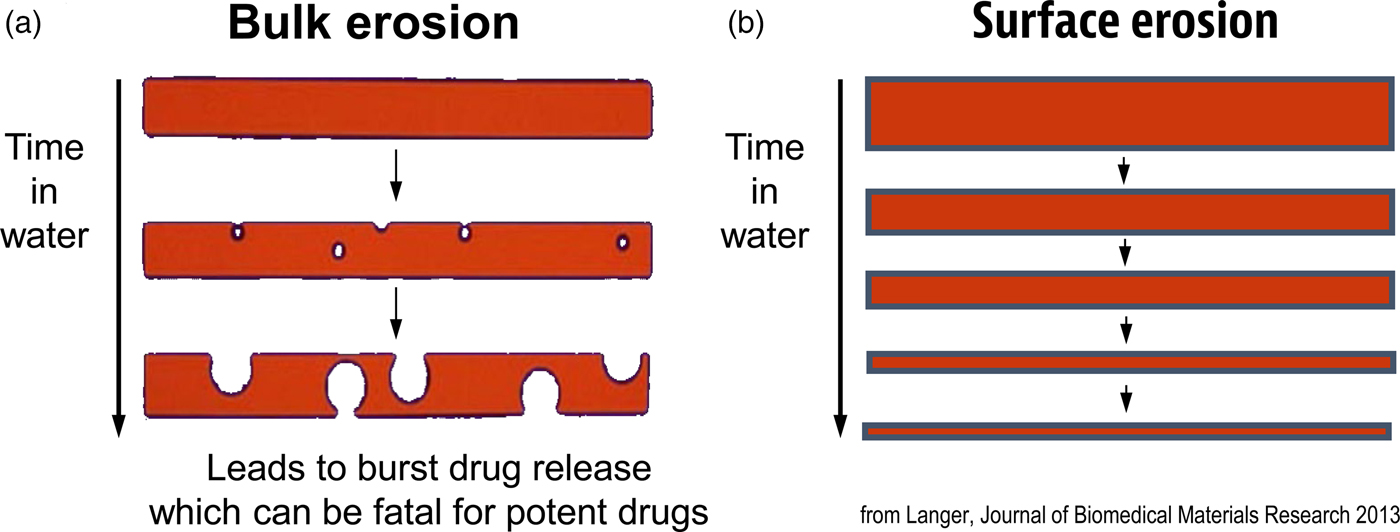
Another important focus has been creating new materials for controlling the movement of molecules. In many cases, scientists used ‘off the shelf’ materials that somehow resembled the organ or tissue they were trying to fix (see Table 2). An example was the artificial heart where a polyether urethane was used, even though it was originally derived from a ladies' girdle because it had good flexural properties (Peppas and Langer, Reference Peppas and Langer1994). In contrast, I thought that chemical engineering design principles might provide a useful way of creating biomaterials with nearly ideal properties. One example of this is controlling molecular release, where almost all polymers degrade by bulk erosion, which could lead to ‘molecular dumping.’ From an engineering standpoint, surface erosion could prevent such ‘dumping’ (Fig. 6). We hypothesized that a number of issues must be addressed from a chemistry and engineering standpoint to do this. The first is whether the materials should degrade enzymatically or hydrolytically. Enzymatic degradation could lead to a variation from person to person, because enzyme levels could vary between individuals. In addition, the cellular response to the material could change over time. However, all individuals have excess water; thus, we would hypothesize that hydrolysis as a mechanism should lead to a very high degree of reproducibility. Therefore, the first design criterion would be that the polymer should hydrolytically degrade. The second criterion involves the nature of the monomers. If one were to achieve surface erosion it would be important to use hydrophobic monomers that make it difficult for water to permeate the matrix. The third issue is to enable the polymer to degrade at desired rates. Here, it is important to create chemical bonds that are very hydrolytically reactive. By examining various bond chemistries, we hypothesized that the anhydride bond was optimal. The fourth issue is to determine the correct monomers. Working with chemists/toxicologists such as Michael Marletta, we selected monomers that could be synthesized into polymers but would also theoretically degrade to safe products or be fully excreted. Using these criteria, monomers, such as carboxyphenoxypropane and sebacic acid (SA) were chosen (Rosen et al., Reference Rosen, Chang, Wnek, Linhardt and Langer1983; Leong et al., Reference Leong, D'Amore, Marletta and Langer1986).
Polymers in medicine and their origins

Idealized diagram of polymer matrices displaying surface erosion.
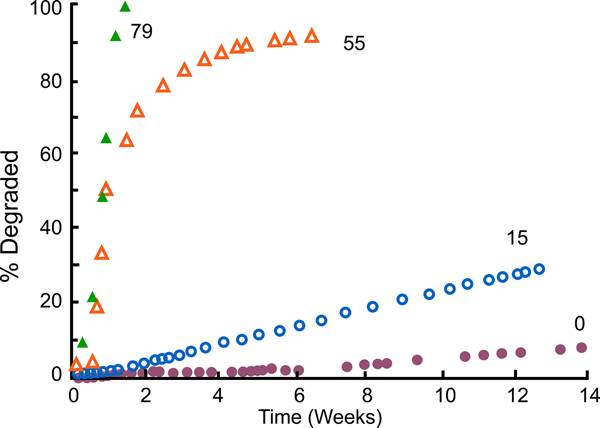
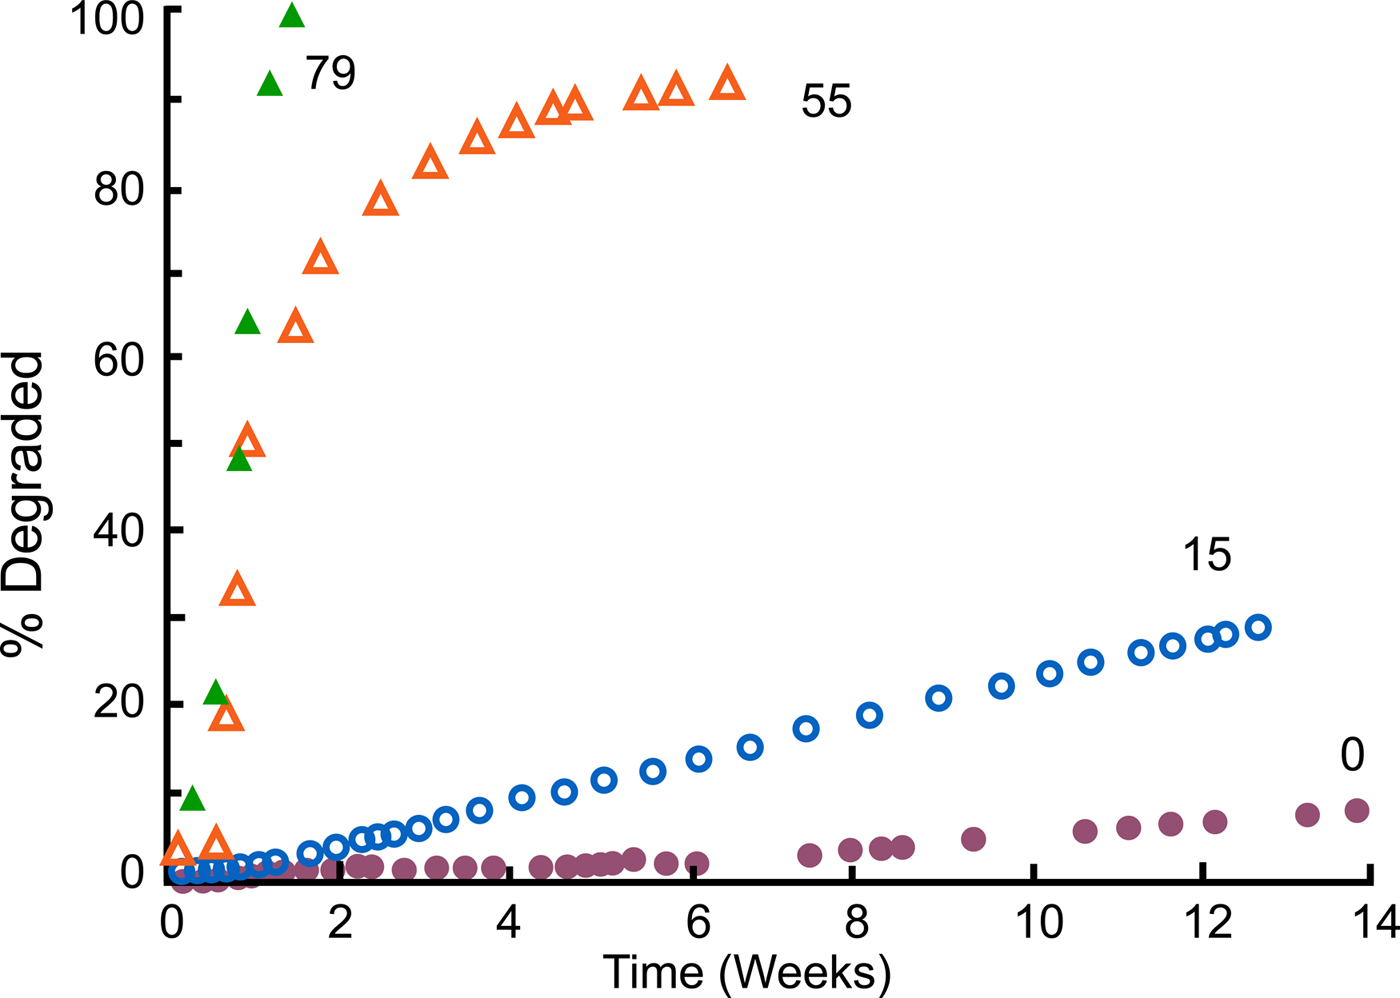
We synthesized these polymers (Leong et al., Reference Leong, Brott and Langer1985; Domb and Langer Reference Domb and Langer1987; Domb et al., Reference Domb, Ron and Langer1988b, Reference Domb, Gallardo and Langer1989). When we did so, not only did we achieve surface erosion (Tamada and Langer, Reference Tamada and Langer1993), but we also acquired the ability to control the degradation rate. For example, by using varying amounts of SA – say, from 0%, to 15%, to 55%, to 79% – we attained degradation rates that ranged from weeks to years (Leong et al., Reference Leong, Brott and Langer1985) (Fig. 7). The result was that we could simply dial in the monomer ratio and target whatever degradation (and release) time periods we desired for whatever material we synthesized.
Degradation profiles of compression molded poly[bis(p-carboxyphenoxy)propane anhydride] and its copolymers with SA in 0.1 M phosphate buffer (pH 7.4) at 37 °C. From Leong et al. (Reference Leong, Brott and Langer1985).
Controlled release for treatment of brain cancer
Based on these results, we thought we might be able to create new therapies. An example is the work we did on brain cancer therapy with neurosurgeon Henry Brem (Brem and Langer, Reference Brem and Langer1996). Dr. Brem visited my laboratory in 1985 when he was a young doctor just starting his medical career at the Johns Hopkins University. At that time, he was looking for a way to treat brain cancer in its worst form – glioblastoma multiforme. This disease is uniformly fatal; regardless of the type of treatment patients receive, they normally died within a year at that time. In addition to that, the chemotherapy drugs normally used to treat this cancer are extremely toxic. One of these drugs is BCNU, or 1,3-bis(2-chloroethyl)-1-nitrosourea. In brain cancer chemotherapy, the drug is administered to the patient intravenously and travels throughout the entire body, with devastating side effects to the liver, kidney, and spleen.
To avoid these side effects, Dr. Brem and I conceived of ‘local chemotherapy’ (Brem and Langer, Reference Brem and Langer1996). In this case, a neurosurgeon would operate on the patient to remove as much of the tumor as possible, which is the standard procedure; then, prior to closing up the patient, the surgeon would line the surgical cavity with a polymer wafer-containing BCNU. Normally, BCNU has a lifetime of only 12 min. Our goal was to extend this lifetime by placing the BCNU molecules in a polymer wafer that would prevent the drug from being destroyed quickly. What Dr. Brem and other neurosurgeons at Johns Hopkins wanted was a degradable polymer that would not accumulate in the brain, one that had surface erosion characteristics that would prevent sudden drug release, and one that, based on their animal studies, would last for a month. Because we could target different molecular release time frames by changing the copolymer composition, we were able to develop a controlled molecular drug delivery system that would protect the BCNU from degradation and not accumulate in the brain. The resulting system allowed doctors to produce high concentrations of the drug in the brain, where the drug was desired, and low concentrations in the rest of the body, where it would cause harm.
One of the key issues in academic research, of course, is receiving funding. Our polymer drug delivery system research received a very negative reception when we tried to get funding to support its development. We wrote grants to the National Institutes of Health and other funding agencies. These grants are then reviewed by study sections, which consist of other scientists. When I wrote our first grant in 1981, it was reviewed by chemists who stated that we would not be able to synthesize the polymers. However, Howie Rosen, one of my graduate students at the time, synthesized them for his thesis (Rosen et al., Reference Rosen, Chang, Wnek, Linhardt and Langer1983). After Rosen had accomplished this synthesis, we sent the grant back for another review, which stated: ‘The grant should still not be funded because the polymers will react with whatever drug molecule you put in.’ However, Kam Leong, Robert Lindhardt, and others in our lab showed there were no such reactions (Leong et al., Reference Leong, D'Amore, Marletta and Langer1986). When we returned the grant for the next review, we received the comment that, although we'd solved some problems, the polymers were fragile and would be likely to fracture because of their low-molecular weight, which was 7000. This time, Avi Domb, in our lab, found the right catalysts, reaction times, and temperature conditions to increase the molecular weight of the polymers to 250 000, at which point they were not fragile (Domb and Langer, Reference Domb and Langer1987). Edith Mathiowitz developed these systems into microspheres (Mathiowitz et al., Reference Mathiowitz, Saltzman, Domb, Dor and Langer1988, Reference Mathiowitz, Dor, Amato and Langer1990). After the grant had gone back for yet another evaluation, the reviewers said that it should not be funded because new polymers would not be safe. Another graduate student, Cato T. Laurencin, did extensive studies showing the polymers were very safe in animals (Laurencin et al., Reference Laurencin, Domb, Morris, Brown, Chasin, McConnell, Lange and Langer1990). Then we returned the grant and the reviewers stated the drug would not diffuse far enough in the brain to be effective. Mark Saltzman showed this statement to be incorrect (Fung et al., Reference Fung, Shin, Tyler, Brem and Saltzman1996, Reference Fung, Ewend, Sills, Sipos, Thompson, Watts, Colvin, Brem and Saltzman1998; Haller and Saltzman, Reference Haller and Saltzman1998). These kinds of negative reviews continued until 1996 (fortunately we were able to receive industrial funding), when the Food and Drug Administration (FDA) approved this treatment – the first time in more than 20 years that the FDA had approved a new treatment for brain cancer, and the first time they had ever approved polymer-based local cancer chemotherapy.
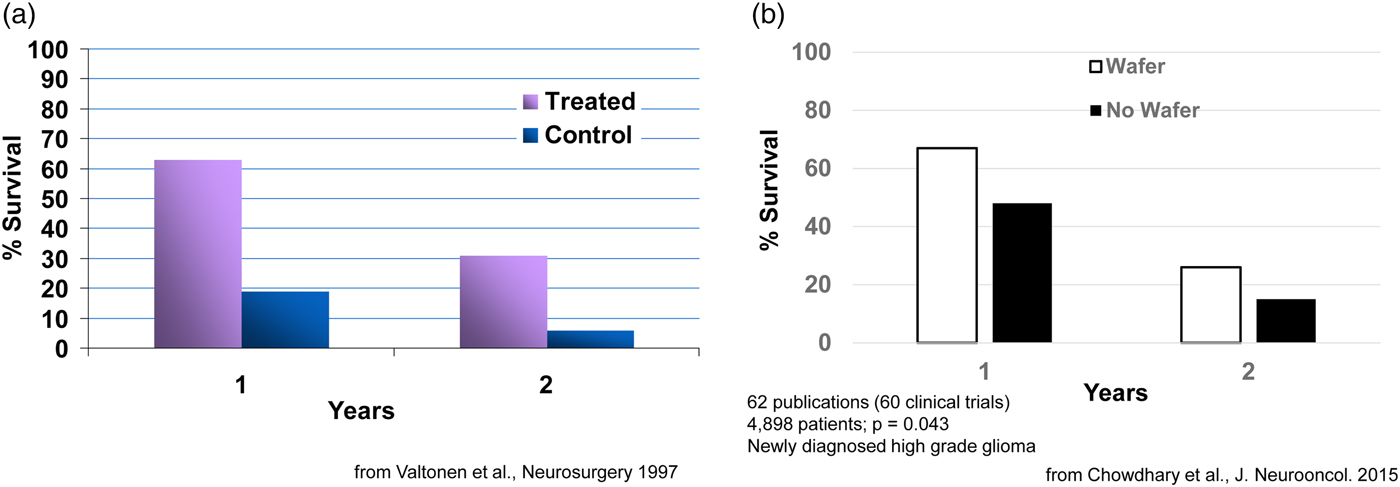
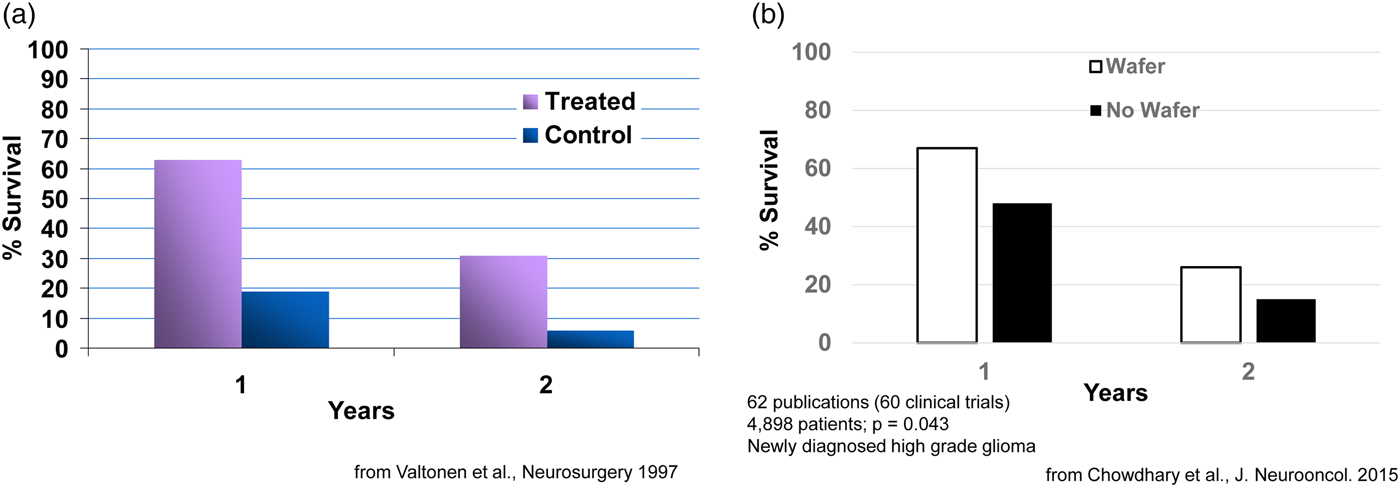
Clinically, what happens is: during the brain cancer surgery already required to remove the tumor, the BCNU-containing wafers, which are about the size of a United States dime, are inserted into a human brain. Seven or eight wafers are usually inserted before the surgeon closes the brain. This approach delivers extremely high sustained levels of chemotherapy directly to the tumor with virtually no systemic side effects. This fundamental advance in polyanhydride chemistry and its translation to a therapeutic has extended the life of numerous patients, from a few weeks to many years in some cases. For example, in an early study, 63% of patients in the treated group had survived, while only 19% in the control group (receiving the best conventional treatment) had survived. At the end of 2 years, 31% in the treated group had survived versus 6% in the control group (Fig. 8a) (Valtonen et al., Reference Valtonen, Timonen, Toivanen, Kalimo, Kivipelto, Heiskanen, Unsgaard and Kuurne1997). This system, called Gliadel, was approved in 1996 and is still used today (now 23 years later) (for a summary of 60 clinical studies, see Fig. 8b) (Chowdhary et al., Reference Chowdhary, Ryken and Newton2015). It has been approved for use in over 30 countries around the world. This principle of localized drug delivery is now being used in many other areas such as polymer–drug coated cardiovascular stents. For example, the NIH 2004 Overview of Research Activities states that ‘Langer's work has made possible the drug-eluting stent which became available to patients with heart disease in 2003.’ Such stents have been used in tens of millions of patients.
Survival of cancer patients treated with Gliadel.
Unexpected uses of new chemical polymers and materials
Sometimes it is difficult to predict where the materials we develop will have the greatest impact.
Over the years, we have synthesized many new polymers. One example was developing a new synthesis for poly(hydroxamic acid) (Domb et al., Reference Domb, Cravalho and Langer1988a). Interestingly, although our initial intent was to develop protective coatings for implantable medical devices, these polymers became widely used as a flocculent (Superfloc) to decontaminate swimming pools and other areas. We also synthesized the first degradable shape-memory polymers (Lendlein and Langer, Reference Lendlein and Langer2002; Lendlein et al., Reference Lendlein, Jiang, Junger and Langer2005), the first degradable electrically conducting polymers (Zelikin et al., Reference Zelikin, Shastri, Lynn, Farhadi, Martin and Langer2002), as well as materials that could change surface characteristics by throwing a simple switch (Lahann et al., Reference Lahann, Mitragotri, Tran, Kaido, Sundaran, Hoffer, Somorjai and Langer2003). These materials allow new potential uses in medicine or other areas, e.g. self-tying sutures for shape-memory polymers.
Another approach to create biomaterials developed by David Lynn, now on the faculty of University of Wisconsin–Madison, and Dan Anderson, now on the MIT faculty, when they were postdoctoral fellows in our laboratory at MIT involves creating libraries of polymers. For example, we synthesized poly β-aminoesters, by developing chemical and robotic methods that lend themselves to high-throughput parallel synthesis and screening approaches. We synthesized thousands of such polymers and developed screening assays to identify useful polymers based on DNA binding, solubility, and cell transfection (Lynn and Langer Reference Lynn and Langer2000). Some of these polymers displayed higher transfection efficiencies in cells than standard non-viral vectors such as lipofectamine and polyethylenimine. This approach is currently being extended to the synthesis and screening of thousands of polymers and lipids and is accelerating the rate at which non-viral vectors are discovered for clinical applications. It has already led to a number of widely used gene therapy reagents (distributed by Sigma-Aldrich, Clontech, Stemgent, and others). Interestingly – and again an example of how one can never always anticipate all possible applications – some of these polymers have also become widely used as hair care products (from Unilever/Living Proof). Parallel synthesis is also leading to a better understanding of structure/function relationships that can be applied to the design of other types of polymer-based vectors.
Approaches such as those discussed above are not only useful for DNA delivery, but for new methods of gene therapy such as RNA interference (RNAi) and messenger RNA (mRNA) therapy as well. In particular, with my former postdoc, Dan Anderson, we have created libraries of thousands of lipids and they are being used as delivery systems for RNAi and mRNA (Akinc et al., Reference Akinc, Zumbuehl, Goldberg, Leshchiner, Busini, Hossain, Bacallado, Nguyen, Fuller, Alvarez, Borodovsky, Borland, Constein, de Fougerolles, Dorkin, Jayaprakash, Jayaraman, John, Kotelianski, Manoharan, Nechev, Qin, Racie, Raitcheva, Rajeev, Sah, Soutschek, Toudjarska, Vornlocher, Zimmermann, Langer and Anderson2008; Dahlman et al., Reference Dahlman, Barnes, Khan, Thiriot, Jhunjunwala, Shaw, Xing, Sage, Sahay, Speciner, Bader, Bogorad, Yin, Racie, Dong, Jiang, Seedorf, Dave, Sandu, Webber, Novobrantseva, Ruda, Lytton-Jean, Levins, Kalish, Mudge, Perez, Abezgauz, Dutta, Smith, Charisse, Kieran, Fitzgerald, Nahrendorf, Danino, Tuder, von Andrian, Akinc, Schroeder, Panigrahy, Kotelianski, Langer and Anderson2014).
Extensions to nanomedicine
The original controlled-release materials we developed were small particles; in many cases these were microspheres. However, nanoparticles are often critical for delivering significant payloads of any drug into cells, particularly newer potential drugs such as siRNA.
Yet, once polymeric nanoparticles are injected into the body, they are destroyed almost immediately by macrophages, and are unstable and often aggregate. These characteristics made their use essentially nonexistent. To address these issues, we defined seven key characteristics we wanted to build into nanoparticles to address these problems (Gref et al., Reference Gref, Minamitake, Peracchia, Trubetskoy, Torchillin and Langer1994). We found that nanoparticles composed of a block copolymer of polyethylene glycol (PEG) and any other material such as poly lactic acid, and an added drug, could circulate for hours in vivo, be stable on the shelf for years, and not aggregate. These principles are now being widely used by many scientists and companies to practice ‘nanomedicine.’ A lipid nanoparticle with PEG (Onpattro) has just been approved by the FDA to treat a protein-misfolding disease – ATTR amyloidosis. Another nanoparticle we helped develop (Inveltys) has recently been approved to treat post-operative inflammation and pain following ocular surgery (Linnehan, Reference Linnehan2018).
Controlling the movement of molecules by external forces
Even though by 1980 we were able to continuously release ionic molecules of any size or charge, a problem central to the field of sustained-release technology is that all vehicles developed up until that time displayed drug release rates that were either constant or decayed with time. There had been no way to change or modulate the release rate on demand, once release has commenced. Furthermore, in many cases constant or decreasing drug release rates, as achieved with most drug-delivery systems, do not always mimic the body's natural pattern of providing chemicals. For example, for drugs such as insulin, pulsating delivery is desirable.
Magnetic control of molecular release
The first approach involving external forces to control the movement of molecules within materials involved incorporating magnetic beads in an elastic polymer (Langer et al., Reference Langer, Rhine, Hsieh and Folkman1980; Hsieh et al., Reference Hsieh, Langer and Folkman1981). When an oscillating magnetic field was applied (e.g. as may someday be achieved in a wristwatch-like device) more molecules were released. This occurred reversibly and repeatedly over several months. The external magnetic field appears to cause alternative expansion and contraction of the drug-carrying pores. Key factors for achieving pulsatile release are magnetic bead strength, magnetic field strength, polymer elasticity, magnetic bead size, and polymer matrix structure (Edelman et al., Reference Edelman, Kost, Bobeck and Langer1985).
Ultrasound control of molecular release
We also discovered that ultrasound enhances transport of molecules entrapped within polymer systems. The enhancing effect of ultrasound on molecular release appears largely due to cavitation. Critical parameters in controlling molecular movement from polymers are ultrasound frequency, molecular mass of the incorporated drug, and polymer matrix structure (e.g. size of pores in the polymer network) (Kost et al., Reference Kost, Leong and Langer1989).
Electrical control of molecular release
A third, and perhaps the most advanced approach, involves electrical control. In one case, we developed a solid-state silicon microchip that can provide controlled release of single or multiple chemical substances on demand (Santini et al., Reference Santini, Cima and Langer1999). The release mechanism is based on the electrochemical dissolution of thin anode membranes (as described below) covering microreservoirs filled with chemicals in solid, liquid, or gel form.
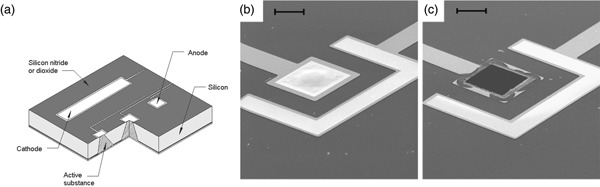
This microchip involves no moving parts. Release from a particular reservoir is initiated by applying an electric potential between the anode membrane covering that reservoir and a cathode. Figure 9a shows a cut-away portion of a prototype microchip containing reservoirs filled with the chemical to be released. The first microchips were 17 mm by 17 mm by 310 µm and contained 34 reservoirs. Device size could be reduced to <2 mm, depending on the particular application. A device of the size used in these initial studies (17 mm) has enough surface area to accommodate over 1000 reservoirs.
A prototype microchip for controlled release showing the shape of a single reservoir. (a) Fabrication of these microchips began by depositing ~0.12 µm of low stress, silicon-rich nitride on both sides of prime grade, silicon wafers using a vertical tube reactor. The silicon nitride layer on one side of the wafer was patterned by photolithography and electron cyclotron resonance enhanced reactive ion etching to give a square device (17 × 17 mm) containing multiple 480-μm-square reservoirs. The silicon nitride served as an etch mask for potassium hydroxide solution at 85 °C, which anisotropically etched square pyramidal reservoirs. (b, c) Removal of an anode membrane to initiate release from a reservoir. Scanning electron micrographs of a gold membrane anode covering a reservoir are shown before (b) and after (c) the application of +1.04 V with respect to SCE for several seconds in PBS (scale bar: 50 µm). From Santini et al. (Reference Santini, Cima and Langer1999).
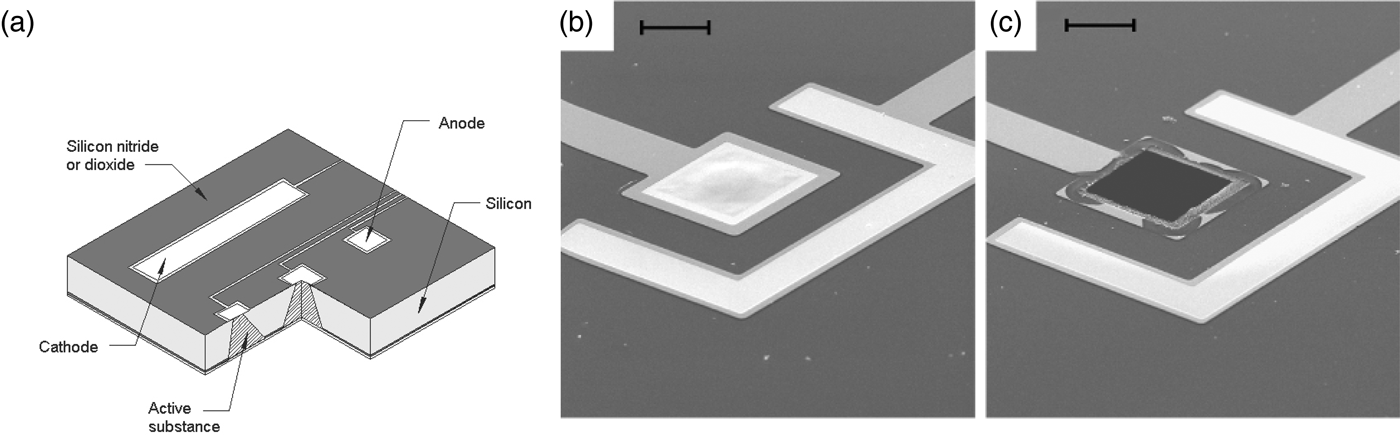
The devices were fabricated by a sequential process using silicon wafers and microelectronic processing techniques including ultraviolet photolithography, chemical vapor deposition, electron beam evaporation, and reactive ion etching. Each device contained reservoirs that extended completely through the wafer. The reservoirs were square pyramidal, had a volume of 25 nl, and were sealed on the small square end (50 × 50 µm) by a 0.3-μm-thick, gold membrane anode. Gold was originally chosen as a model membrane material because it is easily deposited and patterned, has a low reactivity with other substances and resists spontaneous corrosion in many solutions over the entire pH range. However, the presence of a small amount of chloride ions creates an electric potential region which favors the formation of soluble gold chloride complexes. Holding the anode potential in this corrosion region enables reproducible gold dissolution. Potentials below this region are too low to cause appreciable corrosion, whereas potentials above this region result in gas evolution and formation of a passivating gold oxide layer that causes corrosion to slow or stop. Other metals such as copper or titanium tend to dissolve spontaneously under these conditions or do not form soluble materials on application of an electric potential. Although it is used as a model compound in these initial studies, gold has also been shown to be a biocompatible material (Santini et al., Reference Santini, Cima and Langer1999). Subsequently, we also found platinum alloys to be useful (Farra et al., Reference Farra, Sheppard, McCabe, Neer, Anderson, Santini, Cima and Langer2012).
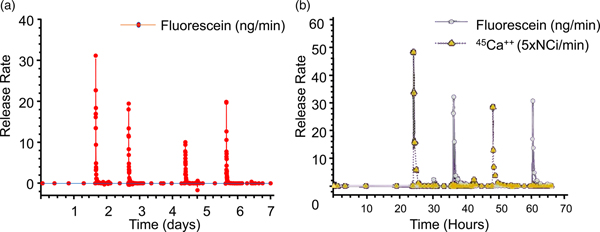
The objective of our initial release experiments was to see if pulsatile release of a single compound could be obtained from a microchip. Release was achieved from a reservoir of a prototype device immersed in phosphate-buffered saline (PBS) by applying a potential of +1.04 V with respect to a saturated calomel reference electrode (+1.04 V with respect to SCE) to the gold anode covering that reservoir. The use of a reference electrode ensured that the potential of the gold membrane anode remained in the gold corrosion region during activation. Figures 9b and 9c show a gold membrane anode before and after a potential was applied in PBS. Release of the fluorescent model compound, sodium fluorescein, from a reservoir was detected by fluorescence spectroscopy within a minute or two after the potential was applied (Fig. 10a).
(a) Single compound release in vitro and (b) multiple compound release. From Santini et al. (Reference Santini, Cima and Langer1999).
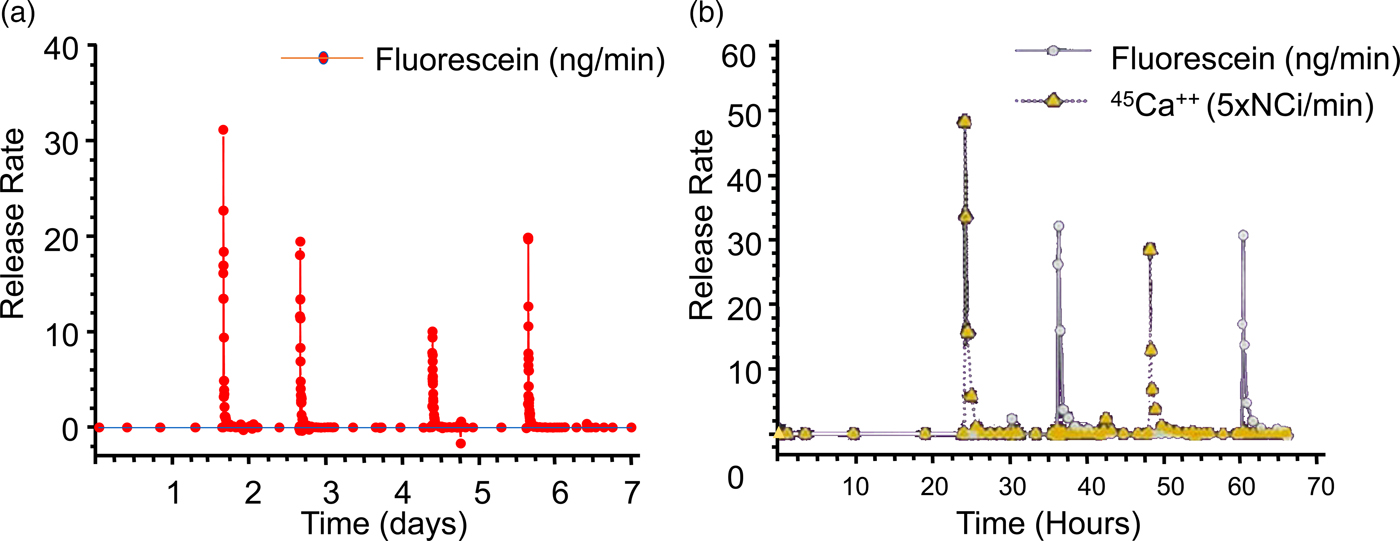
Subsequent release experiments were designed to determine if the independent release of multiple compounds could be obtained from a single device. Reservoirs containing one of two model compounds were opened by applying +1.04 V with respect to SCE to the corresponding anode immersed in saline solution without phosphate buffer. Pulsatile release of both 45 Ca2+ ions and sodium fluorescein over a period of several hours was observed, showing that multiple compounds can be released at precisely desired times from a single microchip (Fig. 10b).
These chips are now being studied in humans. The first clinical trial of an implantable microchip-based drug delivery device involved a human parathyroid hormone fragment [hPTH(1-34)] being delivered from the device in vivo. hPTH(1-34) is the only approved anabolic osteoporosis treatment, but requires daily injections, making patient compliance an obstacle to effective treatment (only 23% of patients maintain treatment). Furthermore, a net increase in bone mineral density requires intermittent or pulsatile hPTH(1-34) delivery, which most implantable drug delivery products are unable to achieve. The microchip-based devices, containing discrete doses of lyophilized hPTH(1-34), were implanted in eight osteoporotic postmenopausal women for 4 months and wirelessly programed to release doses from the device once daily for up to 20 days. A computer-based programer, operating in the Medical Implant Communications Service band, established a bidirectional wireless communication link with the implant to program the dosing schedule and receive implant status confirming proper operation (Farra et al., Reference Farra, Sheppard, McCabe, Neer, Anderson, Santini, Cima and Langer2012).
The electrically-controlled release device dosing produced similar pharmacokinetics to multiple injections and had lower coefficients of variation. Bone marker evaluation indicated that daily release from the device increased bone formation. There were no toxic or adverse events due to the device or drug, and patients stated that the implant caused no change in the quality of life (Farra et al., Reference Farra, Sheppard, McCabe, Neer, Anderson, Santini, Cima and Langer2012).
Control of molecular delivery through physiologic barriers
We have also developed new approaches for delivering molecules through different physiologic barriers. These approaches are discussed below.
Controlled delivery to the lung
Local delivery to the lung has been used in the treatment of respiratory diseases such as asthma and more recently for protein therapies such as DNase for cystic fibrosis. The deep part of the lung also has potential advantages for systemic delivery of molecules, including: a large surface area, thin tissue lining, and a limited number of proteases. Most current lung delivery systems deliver drugs in liquid form and many incorporate chlorofluorocarbon propellants which may be environmentally dangerous. In addition, many of these systems do not deliver the drug reproducibly or efficiently; generally, less than 10% of the drug is received by the lung from the device due, in part, to aerosol aggregation because the aerosols are so small (about 2 µm diameter). In addition, repeated delivery every few hours is often necessary.
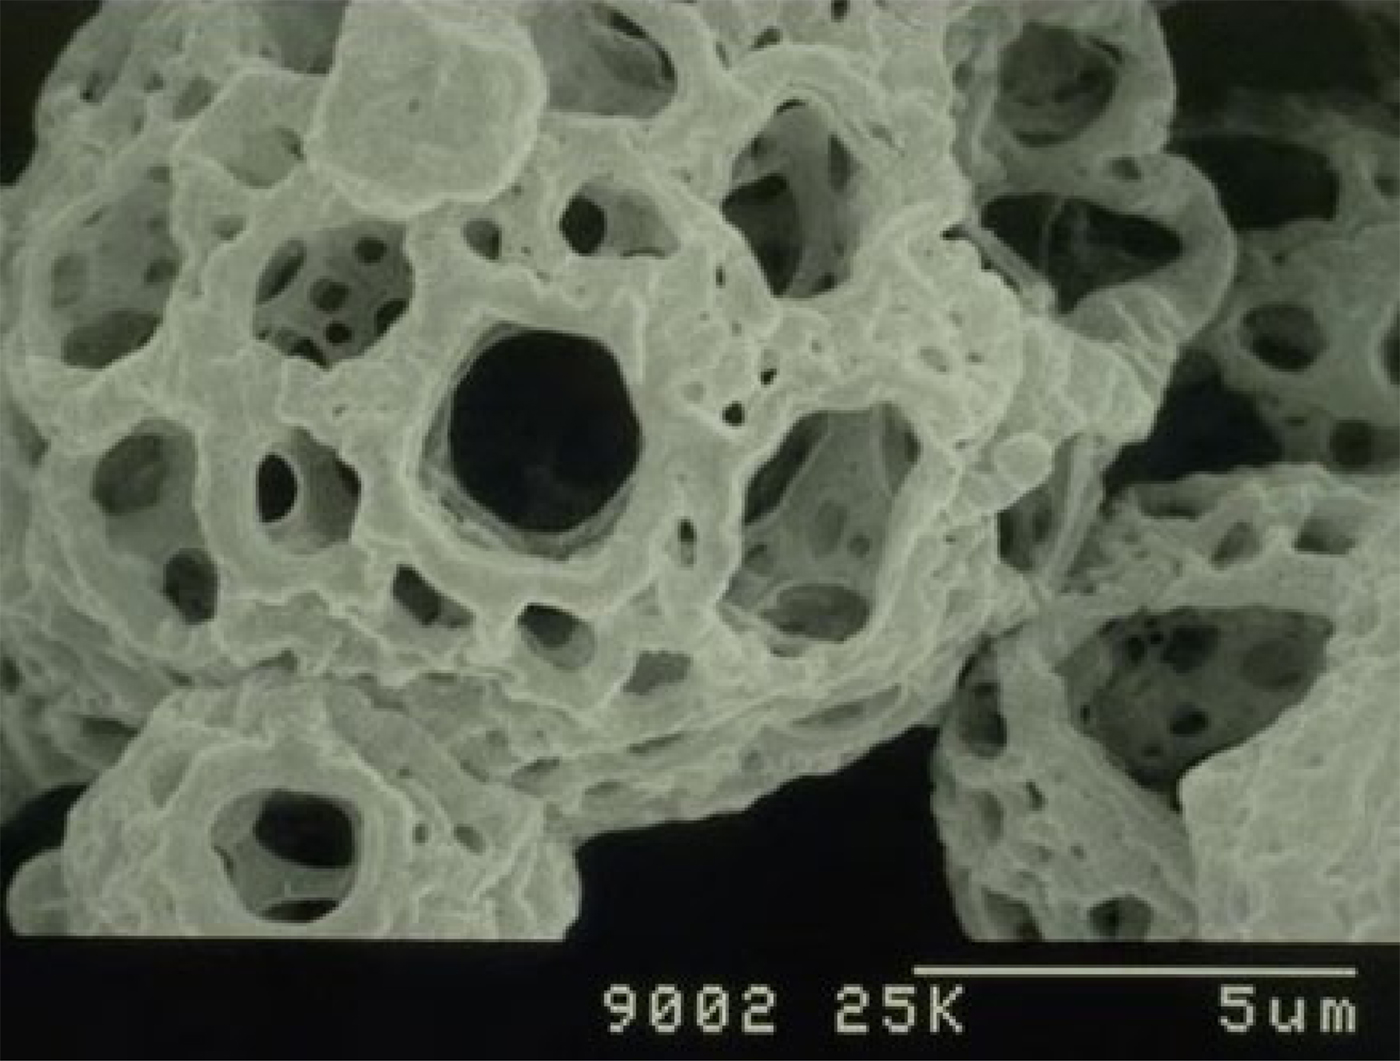
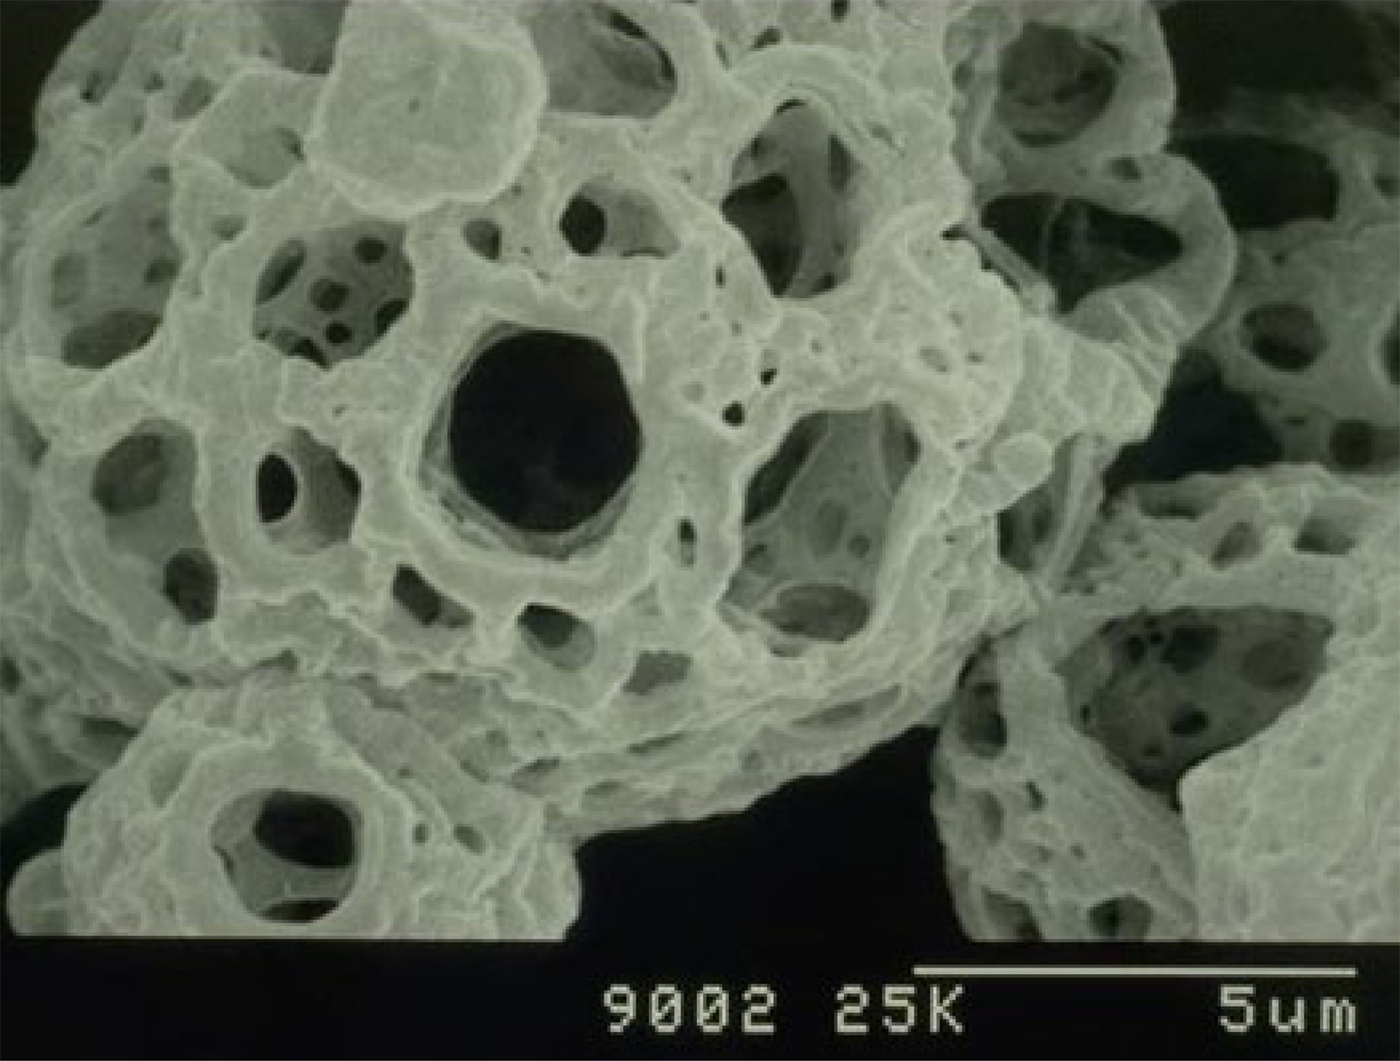
For decades, scientists attempted to address the above issue by designing different inhalers that could break apart aerosol aggregates or have other features. However, in the early 1990s, David Edwards came to my lab and we took a radically different approach – designing new aerosols by changing aerosol geometry. Prior work always involved designing small diameter (about 2 mm diameter) nonporous aerosols. Our approach was to create large (5–20 µm), highly porous particles with extremely low densities. By lowering their density, we hypothesized that the aerodynamics of the particles would be altered making it possible for unusually large particles to enter the lungs through an airstream. We further hypothesized that increasing aerosol particle size would lead to decreased particle aggregation, creating far greater inhalation efficiency, as well as decreased phagocytosis by alveolar macrophages. The decreased phagocytosis can result in sustained drug release. We then created such large and highly porous aerosols (Fig. 11) and found that over 10 times the number of molecules could be delivered this way, compared with conventional aerosols and inhalers. We also found that molecules could be delivered to animals using these particles for over 4 days from a single inhaled dose (Edwards et al., Reference Edwards, Hanes, Caponetti, Hrkach, Ben-Jebria, Eskew, Mintzes, Deaver, Lotan and Langer1997). This capability enables simple small inhalers that can contain 70 mg of substance (before this, the delivery of 10 mg was difficult) to be delivered in a single dose. These aerosols have led to entirely new treatments for Parkinson's disease (Inbrija) and other diseases.
Scanning electron microscopy images of porous aerosols. Adapted from Edwards et al. (Reference Edwards, Hanes, Caponetti, Hrkach, Ben-Jebria, Eskew, Mintzes, Deaver, Lotan and Langer1997).
Controlled delivery of molecules through the skin
I was also interested in seeing if we could control the delivery of the ionic molecules and large macromolecules through the skin. Transdermal delivery offers real advantages compared with oral pills, in that it avoids first-pass metabolism, and enables long-term therapy. Compared with injections, it avoids pain and the risk of accidental scars. However, the skin – just like polymers – has significant barrier properties, and thus only a few very low-molecular weight lipophilic molecules have been successfully delivered transdermally.
We thought of several ways to control the movement of molecules through the skin. The first was ultrasound. We had already shown that ultrasound could enhance molecular transport through polymers, so we wondered whether it would work on skin. In our first study, we discovered appropriate ultrasound conditions to deliver mannitol, insulin, and physostigmine transdermally (Levy et al., Reference Levy, Kost, Meshulam and Langer1989). However, a number of groups tried to use ultrasound to transport other molecules through skin and told us it did not work (though they also used different ultrasound conditions). So, we systematically investigated the possible mechanism of ultrasound-enhanced permeation, including temperature effects, transport through hair follicles and sweat ducts, mixing effects, and acoustic cavitation. We found that the acoustic cavitation was the dominant mechanism. By understanding this mechanism, we immediately realized we could get greater transport if we used very low ultrasound frequencies (Mitragotri et al., Reference Mitragotri, Blankschtein and Langer1995). We also did extensive research on the structural changes in the skin during ultrasound exposure and developed mathematical models to predict optimal delivery (Johnson et al., Reference Johnson, Blankschtein and Langer1997; Tang et al., Reference Tang, Mitragotri, Blankschtein and Langer2001, Reference Tang, Blankschtein and Langer2002; Polat et al., Reference Polat, Deen, Langer and Blankschtein2012). As a result of these studies, SonoPrep became the first system to receive FDA approval using ultrasound. Ultrasound has also been used for glucose monitoring in humans (Kost et al., Reference Kost, Mitragotri, Gabbay, Pishko and Langer2000) and has been used to deliver methylprednisolone and cyclosporine in humans to treat alopecia.
A second approach we examined to enhance molecular movement through the skin was electroporation (Prausnitz et al., Reference Prausnitz, Langer and Weaver1993a, Reference Prausnitz, Seddick, Kon, Bose, Frankenburg, Klaus, Langer and Weaver1993b, Reference Prausnitz, Pliquett, Langer and Weaver1994, Reference Prausnitz, Corbett, Gimm, Golan, Langer and Weaver1995, Reference Prausnitz, Gimm, Weaver, Guy, Langer and Cullander1996a, Reference Prausnitz, Lee, Liu, Pang, Singh, Weaver and Langer1996b). Our lab used scanning fluorescence microscopy to image transport polymers during electroporation and found localized transport regions were observed, through which molecules could diffuse more easily. We also found that skin electrical resistance dropped by up to 1000-fold within microseconds. Electroporation induced delivery of DNA vectors is now being extensively used in human studies for the delivery of vaccines for treating Zika virus, Ebola virus, MERS, HIV, and Hepatitis B, and is also being used in different cancer treatments (Mitragotri, Reference Mitragotri2013).
Our lab has also analyzed how chemical enhancers affect skin permeability through a combination of experimental techniques and two-photon microscopy. We developed mathematical models for describing skin permeability, using a theory of charge, fluid mass, and transport through porous media under passive conditions, but also in the presence of the types of external forces that can enhance penetration, such as discussed above (Edwards and Langer, Reference Edwards and Langer1994; Johnson et al., Reference Johnson, Berk, Blankschtein, Golan, Jain and Langer1996, Reference Johnson, Blankschtein and Langer1997). Mitragotri wrote a review and provided an analysis of some of our contributions to controlling molecular movement through the skin (Mitragotri, Reference Mitragotri2013).
Controlled oral delivery through new materials and systems
One of the biggest problems in medicine is patients not taking their pills. Estimates are that this problem costs patients up to 289 billion dollars a year with hundreds of thousands of deaths per year in the USA alone (Viswanathan et al., Reference Viswanathan, Golin, Jones, Ashok, Blalock, Wines, Coker-Schwimmer, Rosen, Sista and Lohr2012). Thus, we were interested in developing super-long-acting oral dosage formulation terms (1 week or more) that might, in some cases, last for the entire course of treatment in order to greatly improve patient compliance. We hypothesized that, for an oral sustained delivery dosage form to have a very prolonged gastric residence, it should (i) have a shape and size (such as a capsule, or be able to be placed in a capsule) that can be ingested by a person, (ii) have the ability to adopt a conformation that enables it to be placed in a capsule (or similar swallowable structure), but when it goes in the gastric cavity and the capsule dissolves, it adopts a second shape that delays or prevents passage through the pylorus (e.g. have shape memory or superelastic properties), (iii) be able to carry large loadings of the therapeutic agent, (iv) provide controlled release of the agent for long time periods (weeks or months), (v) maintain stability of the therapeutic agent in a low-pH gastric environment for an extended duration, (vi) degrade/dissolve or dissociate into forms that can exit the stomach and pass through the gastrointestinal (GI) lumen with no potential for obstruction or perforation, and (vii) have safety mechanisms that enable dissociation of the macrostructure in the event of inadvertent passage through the pylorus to avoid downstream intestinal obstruction (particularly at the ileocecal valve) (Bellinger et al., Reference Bellinger, Jafari, Grant, Zhang, Slater, Wenger, Mo, Lee, Mazdiyasni, Kogan, Barman, Cleveland, Booth, Bensel, Minahan, Hurowitz, Tai, Daily, Nikolic, Wood, Eckhoff, Langer and Traverso2016).
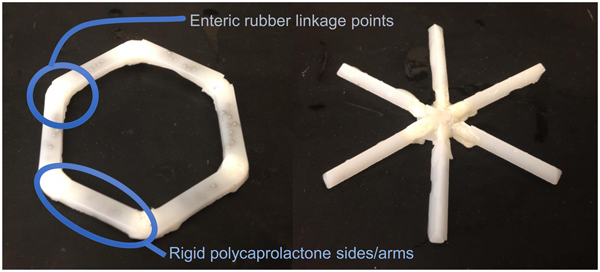
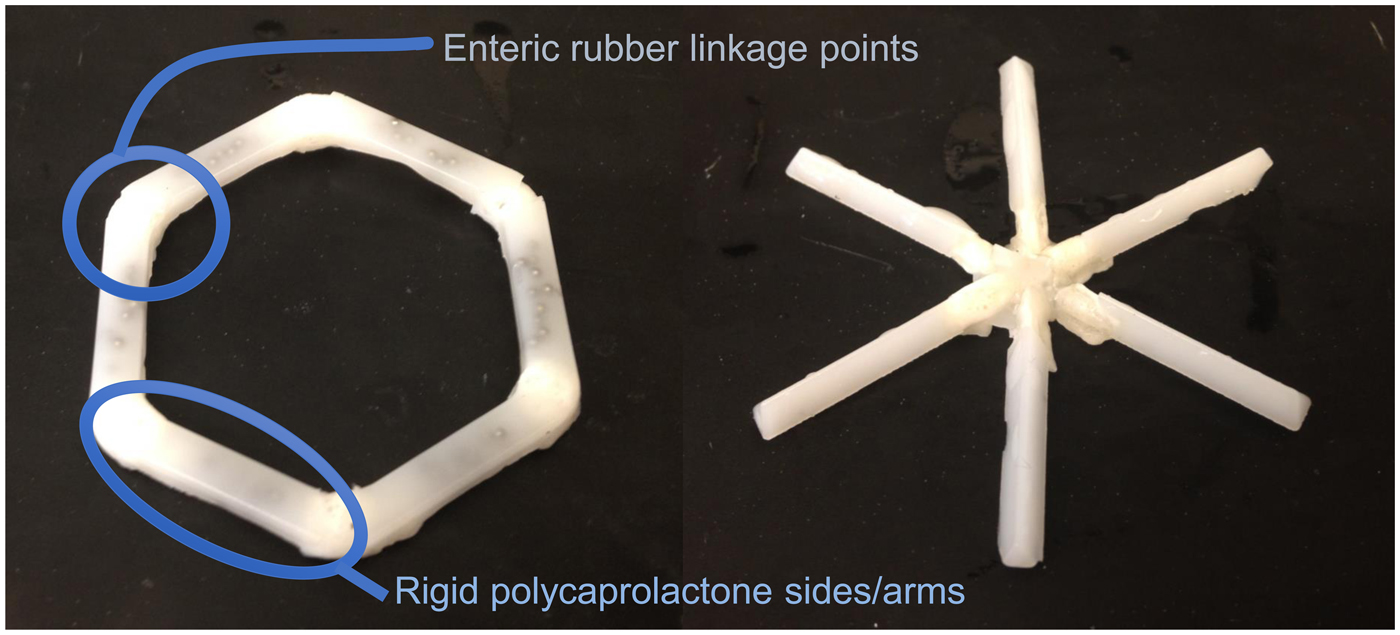
We conceived of designs that fulfilled the above criteria (Fig. 12). In one case it was a ‘polygon' of alternating rigid and flexible elements and in a second case, it was a ‘stellate’ or ‘star-shaped’ family in which rigid elements project from a central flexible component. A combination of flexible recoil element(s) that enable the dosage form to be deformed addresses the first two design constraints, whereas rigid polymeric elements serve as a drug delivery matrix and address the third through fifth constraints. Degradable and/or dissolvable elements within the formulation that selectively dissolve in near neutral pH but remain stable in the acidic gastric environment can be used to control the duration of gastric residence and improve safety by reducing the size of the fragments during passage, addressing the final two constraints. We synthesized new polymers (Zhang et al., Reference Zhang, Bellinger, Glettig, Barman, Lee, Zhu, Cleveland, Montgomery, Gu, Nash, Maitland, Langer and Traverso2015); we also selected poly(ε-caprolactone) (PCL) for the rigid drug release matrix because of its bio-compatibility, low-temperature melt processing, and established use in controlled drug delivery (Bellinger et al., Reference Bellinger, Jafari, Grant, Zhang, Slater, Wenger, Mo, Lee, Mazdiyasni, Kogan, Barman, Cleveland, Booth, Bensel, Minahan, Hurowitz, Tai, Daily, Nikolic, Wood, Eckhoff, Langer and Traverso2016). As discussed later, we have used these systems to controllably release molecules for several weeks in pigs. These systems have now been tested safely in human patients as well.
Initial prototypes of gastric residence vehicle. Two families of geometric arrangements of flexible and rigid elements able to fit into a capsule. From Bellinger et al. (Reference Bellinger, Jafari, Grant, Zhang, Slater, Wenger, Mo, Lee, Mazdiyasni, Kogan, Barman, Cleveland, Booth, Bensel, Minahan, Hurowitz, Tai, Daily, Nikolic, Wood, Eckhoff, Langer and Traverso2016).
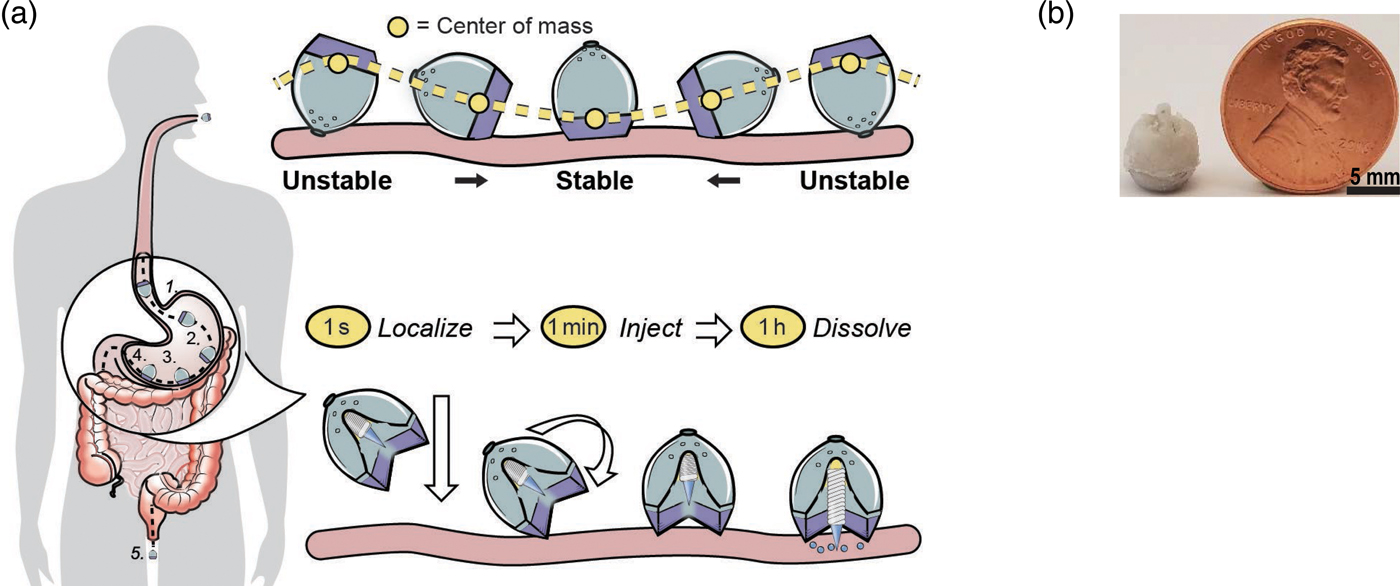
We were also interested to see if it was possible to deliver proteins such as insulin orally. This is extremely difficult because orally administered proteins must navigate extremes of pH, protease-rich environments, thick mucus layers, and cellular tight junctions prior to achieving systemic bioavailability. Pre-clinical technologies for GI-based macromolecule delivery, including permeation enhancers, nanoparticles, and mucus adhering devices enhance uptake, but are generally not capable of safely achieving bioavailabilities of more than 1%. With respect to safety and efficacy, the stomach's 4–6 mm thick wall provides a broader protective layer and more space to insert medication compared with the 0.1–2 mm thick intestinal walls. Additionally, gastric tissue regenerates quickly. Routine procedures by gastroenterologists utilizing 5 mm 25G ‘Carr-Locke’ needles for GI injection provide strong clinical evidence for this action's safety. Furthermore, by delivering into the stomach tissue rather than the small intestine, the dose delivery time is likely to be more predictable given the recognized variability in gastric emptying. While the idea of delivering biologic drugs to the GI tract via injection has been previously hypothesized and tested via endoscopic procedures, we wanted to develop an ingestible small applicator [self-orienting millimeter scale applicator (SOMA)] which autonomously inserts drug-loaded milliposts into the stomach lining. To do this required three advances: (1) creating a system that would land in the stomach facing precisely the same way every time (this requires self-orientation); (2) a formulation that consists of the drug that comes out of the device – these are milliposts; (3) a way to trigger the drug to come out of this system (Abramson et al., Reference Abramson, Caffarel-Salvador, Khang, Dellal, Silverstein, Gao, Frederiksen, Vegge, Hubálek, Water, Friderichsen, Fels, Kirk, Cleveland, Collins, Tamang, Hayward, Landh, Buckley, Roxhed, Rahbek, Langer and Traverso2019) (Fig. 13).
An oral gastric delivery system for macromolecules. (a) SOMA localizes to the stomach lining, orients its injection mechanism toward the tissue wall, and injects a drug payload through the mucosa. The drug dissolves and the rest of the device passes out of the body. (b) A fabricated SOMA next to a United States penny. From Abramson et al. (Reference Abramson, Caffarel-Salvador, Khang, Dellal, Silverstein, Gao, Frederiksen, Vegge, Hubálek, Water, Friderichsen, Fels, Kirk, Cleveland, Collins, Tamang, Hayward, Landh, Buckley, Roxhed, Rahbek, Langer and Traverso2019).
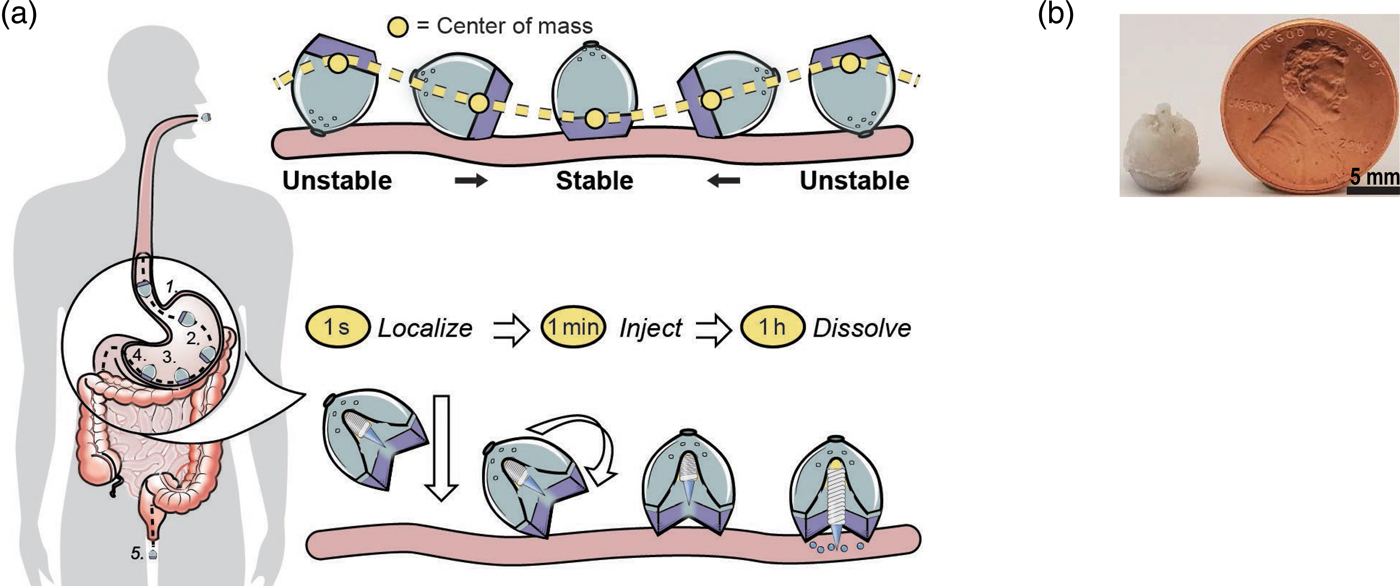
To achieve the first goal, we were inspired by nature – in this case, by a self-orienting leopard tortoise (Stigmochelys pardalis). We designed a system optimized for rapid self-orientation with the capacity to resist external forces (e.g. fluid flow, peristaltic motion, and exercise) upon reaching a stable point. For the SOMA, we sought a self-orienting shape similar to the tortoise's, ensuring that the milliposts did not misfire into the lumen if a patient leaned over during actuation. As a model system, we used a combination of low-density PCL and high-density stainless steel to produce the low center of mass needed for the SOMA to self-orient. Because stainless steel is not typically ingested, we performed oral acute and sub-chronic toxicity experiments in rats. No inflammation or signs of toxicity were observed. This is consistent with prior studies, including ones on dental braces. We tested the SOMA for self-orientation and persistence of mucosal engagement 300 times ex vivo in swine stomachs and 60 times in vivo in fasted swine. To measure proper device orientation, we performed endoscopy on and took X-rays of the swine after administering the devices. The SOMA oriented in 100% of trials (Abramson et al., Reference Abramson, Caffarel-Salvador, Khang, Dellal, Silverstein, Gao, Frederiksen, Vegge, Hubálek, Water, Friderichsen, Fels, Kirk, Cleveland, Collins, Tamang, Hayward, Landh, Buckley, Roxhed, Rahbek, Langer and Traverso2019).
To achieve the second goal, we fabricated Active Pharmaceutical Ingredient (API) milliposts, using insulin as a model API. By compressing a mixture of up to 80% human insulin combined with 200k molecular weight poly(ethylene) oxide under the pressure of 550 MPa, we loaded up to 0.5 mg of insulin in a sharp, conical structure measuring 1.7 mm in height and 1.2 mm in diameter. In total, the millipost measured 7 mm in length. Compared with liquid or solvent casted formulations, our formulation loaded up to 100 times more API per unit volume. Our studies on the milliposts showed high insulin stability. We also created a time delayed actuation mechanism with forces capable of inserting drug loaded milliposts into stomach tissue without causing perforation of the stomach. We used a spring as a power source because of its low space requirement and ability to release energy along one axis nearly instantaneously. We loaded the SOMAs with stainless steel springs. Histology and micro computed tomography imaging from in situ and ex vivo experiments demonstrated that milliposts inserted into the submucosa of swine stomach tissue after being ejected from a SOMA with a 5 N spring.
To achieve the third objective of providing a controlled actuation event in the gastric cavity, we used an osmotic approach to trigger the spring. We utilized sucrose and isomalt to develop a hydration-dependent actuator. By varying the sucrose/isomalt concentration, we could trigger the release of the insulin milliposts from the SOMA at any desired time (e.g. 50 min, so it would be in in the stomach). Vents placed in the SOMA allowed GI fluid to dissolve and actuate the barrier. We then administered milliposts loaded with 0.3 mg of human insulin to swine and measured blood glucose and API levels. Endoscopically dosed SOMAs localized to the stomach wall and self-oriented and then injected milliposts into the tissue. Histology confirmed that the SOMA delivered milliposts through the mucosa without injuring the outer muscular layer of the stomach. A week after dosing the SOMAs, we performed endoscopies and saw no tissue damage or abnormalities. Insulin delivered orally in this way showed the same efficacy and duration as when injected through the skin (Abramson et al., Reference Abramson, Caffarel-Salvador, Khang, Dellal, Silverstein, Gao, Frederiksen, Vegge, Hubálek, Water, Friderichsen, Fels, Kirk, Cleveland, Collins, Tamang, Hayward, Landh, Buckley, Roxhed, Rahbek, Langer and Traverso2019).
Future directions
Controlling the movement of molecules to improve heath in the developing world
Vaccines
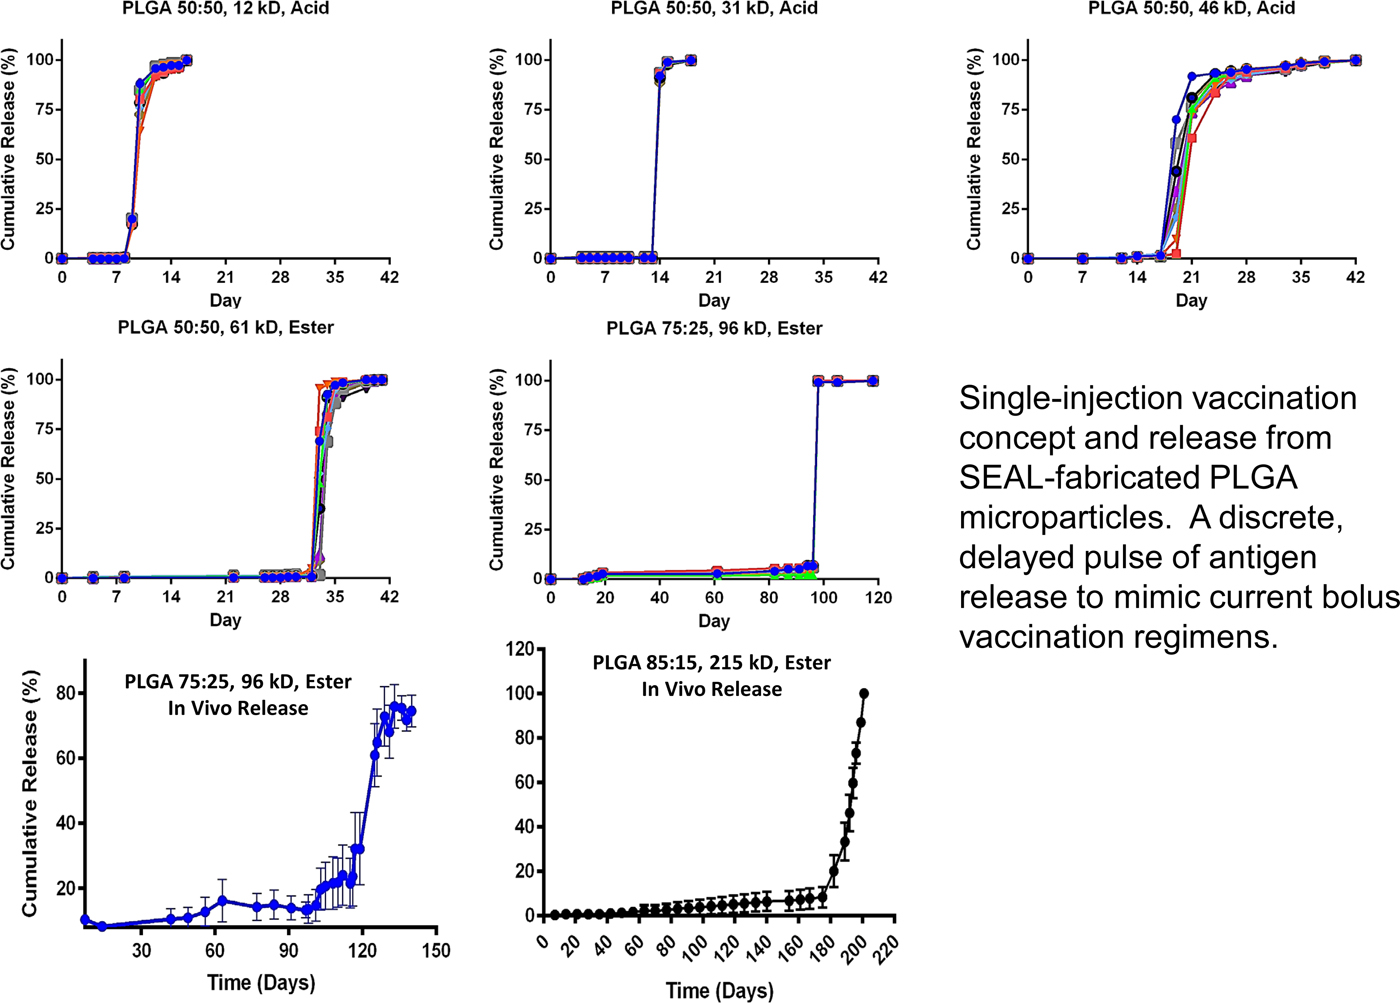
Bill Gates came to visit me in 2012 because he wanted to see if we might be able to extend some of the principles we developed to create new medicines for the developing world. One area of great imperative is vaccines, because patients often do not return for second or subsequent injections. In 1979, we published the first paper illustrating a single-step method of vaccination (Preis and Langer, Reference Preis and Langer1979). The Gates Foundation was particularly interested if it would be possible to create microparticles that release their contents in distinct, delayed bursts without any prior leaking.
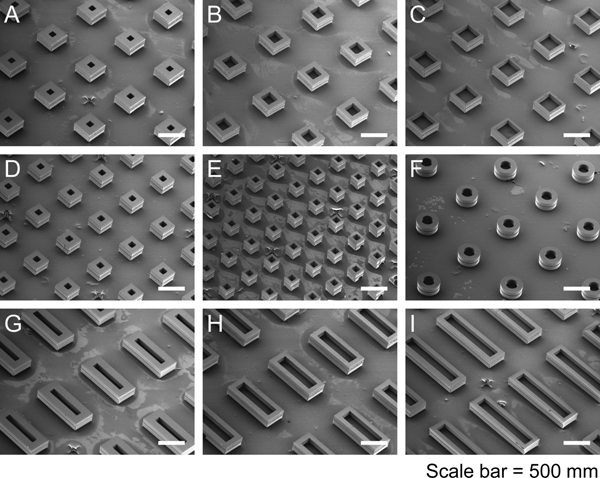
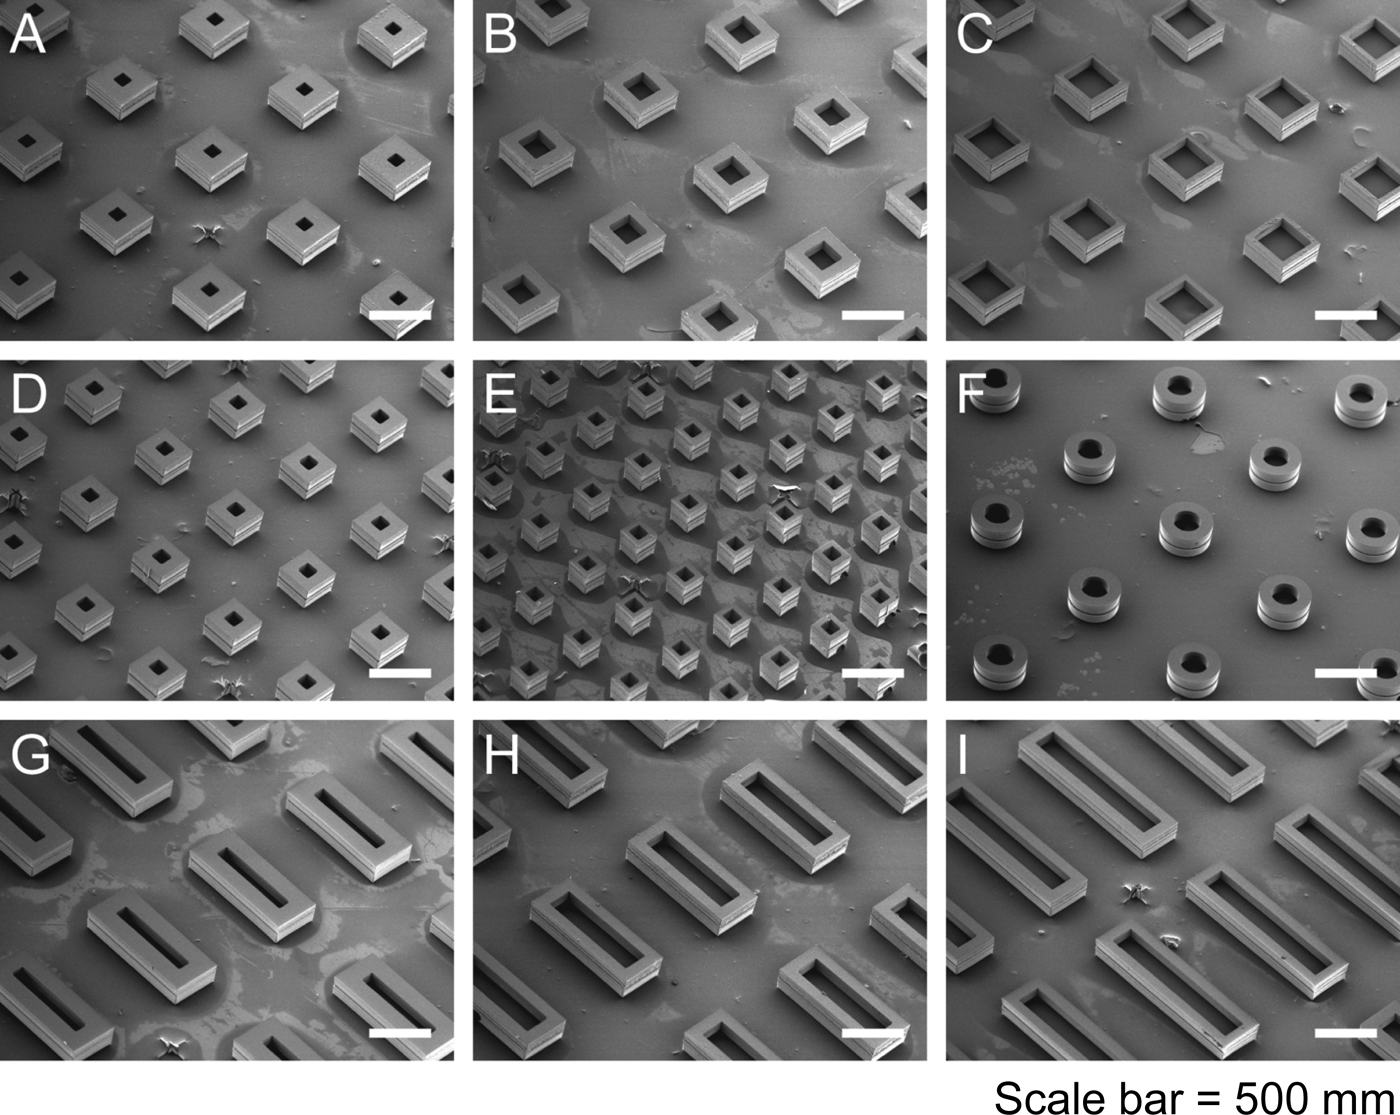
Again, we thought of using polymers to accomplish this. First we thought about 3D printing polymers, but, while high-resolution, stereolithographic 3D-printing can produce nanoscale features, they require photoactive processing additives (some of which have unknown safety profiles in humans) and are not compatible with materials relevant for biomedical applications, such as PLGA and polycaprolactone. These processes also rely on liquid polymerization or cross-linking and may not be compatible with the encapsulation of drugs or other sensitive molecules owing to the presence of the liquid prepolymer solution that could cause denaturation. Alternatively, heat-based fused deposition modeling, although theoretically compatible with any thermoplastic polymer, lacks the control needed to create microstructures with high resolution. To address these issues, we developed a new high-resolution microstructure fabrication technique to create microdevices with complex geometries using a variety of commercially safe materials, including lactide–glycolide copolymers, the most widely used biodegradable polymers for human applications. This approach, termed StampEd Assembly of polymer Layers (SEAL), combines technology used for computer chip manufacturing with soft lithography and an aligned sintering process to produce small (⩽400 mm) polymeric structures. Two or more silicon molds with complementary patterns are etched by standard microfabrication techniques. Polydimethylsiloxane (PDMS) is then cured on the surface of each silicon wafer to produce inverse elastomeric molds. A polymer is heated and pressed into the PDMS molds to produce the laminar microstructure components of interest. The first layer is then delaminated onto a separate surface, such as glass, by heat-assisted microtransfer molding. Subsequent layers of the final structure are assembled by a layer-by-layer sintering process to produce an array of microstructures (Fig. 14). We created a number of different PLGA microparticles, each intended to pulse at a different pre-determined, desired period of time to deliver timed pulses of antigens, so that essentially any vaccine would be able to be delivered on whatever schedule was desirable in a single injection. To create these microparticles, fillable bases were molded using thermoplastic polymers and transferred to a glass slide to expose the empty particle core. Particle cores were filled with a model drug solution by using a BioJet Ultra picoliter dispensing apparatus, aligned with capping polymer lids, pressed together, and briefly heated to seal the particles (McHugh et al., Reference McHugh, Nguyen, Linehan, Yang, Behrens, Rose, Tochka, Tzeng, Norman, Anselmo, Xu, Tomasic, Taylor, Lu, Guarecuco, Langer and Jaklenec2017).
Particle base geometries. SEAL-fabricated controlled-release microparticles. From McHugh et al. (Reference McHugh, Nguyen, Linehan, Yang, Behrens, Rose, Tochka, Tzeng, Norman, Anselmo, Xu, Tomasic, Taylor, Lu, Guarecuco, Langer and Jaklenec2017).
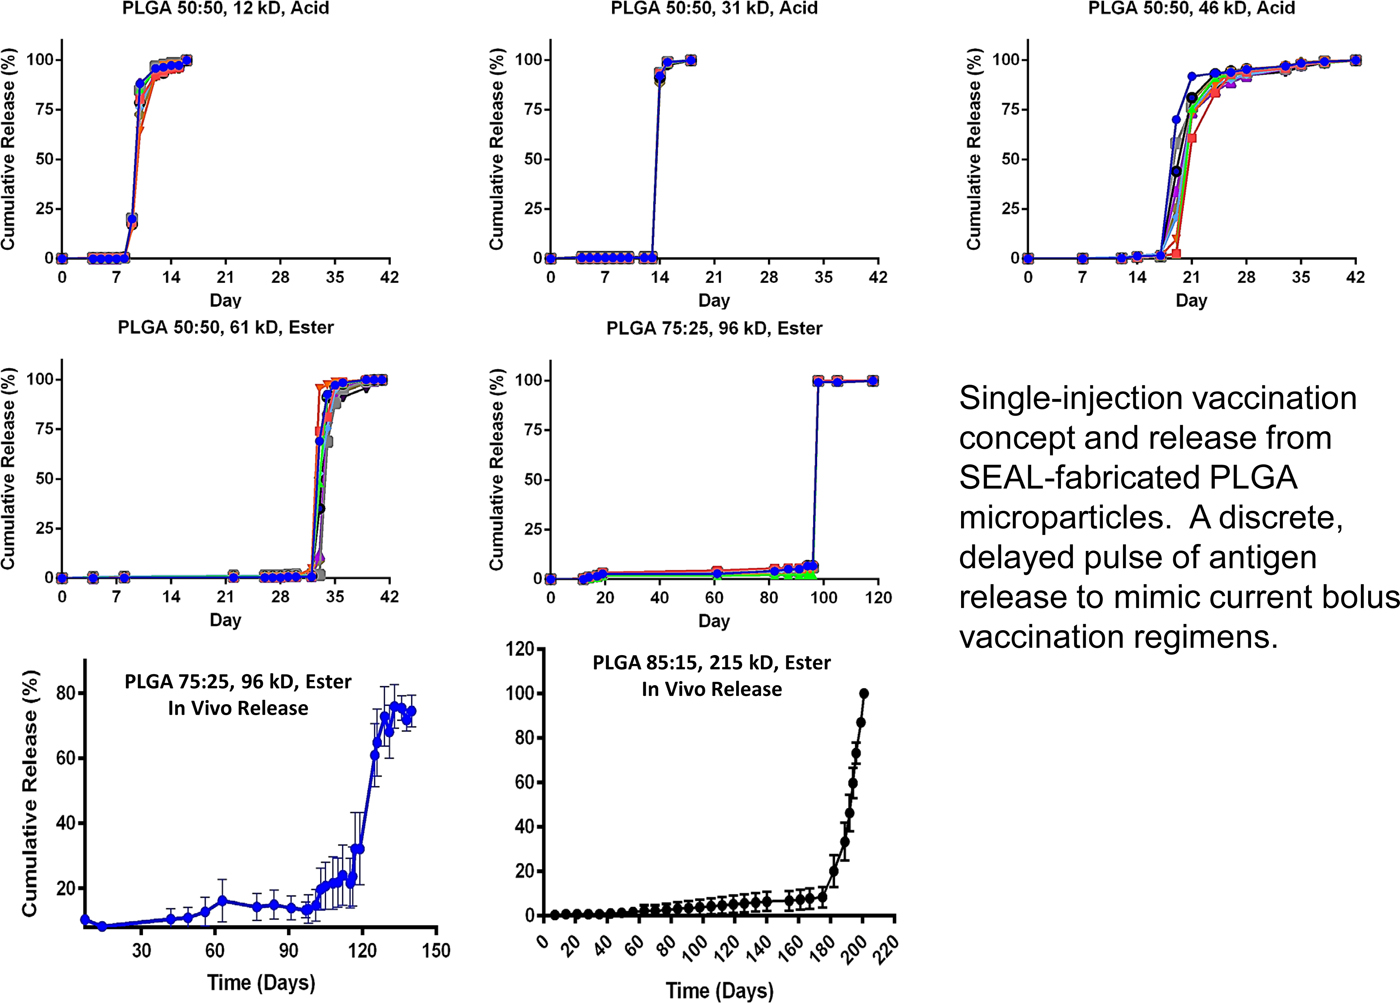
To achieve controlled periodic release, we fabricated microparticles using seven different PLGA polymers (by changing molecular weight or LA/GA ratio, or both) with varying properties and filled the microparticles with fluorescently labeled dextran to observe release kinetics. Particles composed of different PLGA compositions were released in vitro at 10, 15, 34, 98, 126, and 180 days, respectively (Fig. 15). No measurable leakage was observed prior to release, indicating that this platform releases its contents as a sharp pulse after degradation of the polymer barrier. When the particles were subcutaneously injected into mice, release times were almost identical to those in vitro, as indicated by an ~50-fold increase in fluorescence upon release. We also developed microparticles that could be released at any specific time – up to nearly 300 days. Particles could also be lyophilized or frozen at −20 °C without altering release kinetics. These results are especially exciting because they enable the production of various injectable microparticles that release their payloads in distinct, delayed bursts without prior leakage. Although a number of groups, including our own, have created layered microparticles using microfluidic and other approaches, those methods produce particles with continuous release, whereas this new approach shows rapid drug release after a material-dependent delay (McHugh et al., Reference McHugh, Nguyen, Linehan, Yang, Behrens, Rose, Tochka, Tzeng, Norman, Anselmo, Xu, Tomasic, Taylor, Lu, Guarecuco, Langer and Jaklenec2017).
Core–shell kinetic library. From McHugh et al. (Reference McHugh, Nguyen, Linehan, Yang, Behrens, Rose, Tochka, Tzeng, Norman, Anselmo, Xu, Tomasic, Taylor, Lu, Guarecuco, Langer and Jaklenec2017).
Long Term Oral Delivery
Despite major advances in the 20th century, malaria, AIDS, and other diseases continue to scourge large portions of the world, especially sub-Saharan Africa and Southeast Asia. Globally, there were an estimated 214 million cases in 2015, and 438 000 lives were lost. More than 90% of the mortality from malaria is caused by the protozoan parasite Plasmodium falciparum despite the availability of multiple effective therapies.
Factors contributing to the disease's resiliency include poverty, antimalarial resistance, and poor health care infrastructure (Bellinger et al., Reference Bellinger, Jafari, Grant, Zhang, Slater, Wenger, Mo, Lee, Mazdiyasni, Kogan, Barman, Cleveland, Booth, Bensel, Minahan, Hurowitz, Tai, Daily, Nikolic, Wood, Eckhoff, Langer and Traverso2016).
Indoor residual spraying with insecticidal agents, insecticide-treated bed nets, and treating individuals with symptomatic disease have been the basis of malaria control and have led to an estimated 40% reduction in clinical disease since 2000. However, additional interventions are needed to eliminate this disease. One strategy is mass drug administration (MDA) to humans with parasite clearing and prophylactic drugs, such as Coartem (artemether-lumefantrine) or Eurartesim [dihydroartemisinin-piperaquine (DP)], to treat or prevent malaria. Prolonged delivery of malaria preventative chemotherapies could have a significant impact on malaria transmission because humans are the only known reservoir for this infection. The effectiveness of MDA depends on obtaining sufficient and prolonged drug blood levels in the majority of the population, which can be difficult in resource-constrained or remote locations, and increases the cost of the MDA approach. Nonadherence, a well-recognized barrier to effective care in the developed world, has also been shown to contribute to MDA failure in the developing world during repeat dosing regimens (Bellinger et al., Reference Bellinger, Jafari, Grant, Zhang, Slater, Wenger, Mo, Lee, Mazdiyasni, Kogan, Barman, Cleveland, Booth, Bensel, Minahan, Hurowitz, Tai, Daily, Nikolic, Wood, Eckhoff, Langer and Traverso2016).
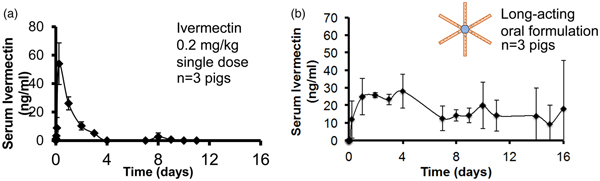
Ivermectin is a well-known and safe drug that has been administered more than a billion times around the world since its approval in 1987 for the treatment of onchocerciasis (African river blindness). Upon approval, Merck committed to providing Ivermectin free of charge to the World Health Organization (WHO) to help eradicate onchocerciasis (river blindness). Ivermectin is also active against lymphatic filariasis, which infects 68 million people worldwide, and is effective for the control of scabies during MDA campaigns. In addition, ivermectin kills the Anopheles mosquito that transmits malaria. Oral ivermectin, with a half-life of 18 h in humans, achieves serum concentrations that kill the mosquito after a blood meal and prevents malaria transmission to another per-son. Serum levels of 8 ng ml−1 [well below the maximum serum concentration (C max) of commercial ivermectin] are sufficient to achieve this effect. Modeling studies and field evidence indicate that coadministration of ivermectin could augment the efficacy of MDA regimens that administer artemisinin combination therapies through a mosquitocidal effect and malaria transmission blockade. This strategy has the potential to effectively interrupt vector transmission of malaria and could reduce prevalence within endemic regions. Using the oral systems discussed previously, we developed a single-encounter oral, ultra-long-acting form of ivermectin that can achieve sustained therapeutic serum drug concentrations for at least a week or more (Bellinger et al., Reference Bellinger, Jafari, Grant, Zhang, Slater, Wenger, Mo, Lee, Mazdiyasni, Kogan, Barman, Cleveland, Booth, Bensel, Minahan, Hurowitz, Tai, Daily, Nikolic, Wood, Eckhoff, Langer and Traverso2016).
We characterized our dosage forms in vivo in pigs for safety and efficiency. Representative serial abdominal X-rays after administration revealed the stellate-shaped dosage forms exiting the gelatin capsule in the gastric cavity and adopting a residence form. Of the 107 capsules administered on 35 occasions (to 15 different pigs), all 107 capsules deployed properly within 5 min, as confirmed by radiographic transition from an encapsulated to an unencapsulated appearance. After we identified favorable ivermectin formulations in vitro, dosage forms varying in their excipient profile and drug loading were prepared for administration in the pigs animal model for identification of optimal ultralong pharmacokinetic profiles. After administration at time 0, serum samples were collected at various times and analyzed by liquid chromatography-tandem mass spectroscopy for serum ivermectin concentration. One to three dosage forms per pig containing ivermectin formulations with 15–20% (w/w) drug load to total polymer composition were administered. We observed sustained serum levels within a target therapeutic range (8–40 ng ml−1) for malaria transmission reduction for more than 10 days (Fig. 16) (Bellinger et al., Reference Bellinger, Jafari, Grant, Zhang, Slater, Wenger, Mo, Lee, Mazdiyasni, Kogan, Barman, Cleveland, Booth, Bensel, Minahan, Hurowitz, Tai, Daily, Nikolic, Wood, Eckhoff, Langer and Traverso2016). Our results predicted that this long-lasting ivermectin delivery dosage form increased and sustained the effect of an MDA significantly. Individuals that are repeatedly not covered in an MDA (correlated coverage) can jeopardize the campaign's success. Including a long-lasting ivermectin delivery dosage form can reduce this negative effect.
Sustained oral Ivermectin. Goal: a single encounter oral therapy that could be widely administered in Africa for sustained delivery of an anti-malarial/anti-helminth. From Bellinger et al. (Reference Bellinger, Jafari, Grant, Zhang, Slater, Wenger, Mo, Lee, Mazdiyasni, Kogan, Barman, Cleveland, Booth, Bensel, Minahan, Hurowitz, Tai, Daily, Nikolic, Wood, Eckhoff, Langer and Traverso2016).
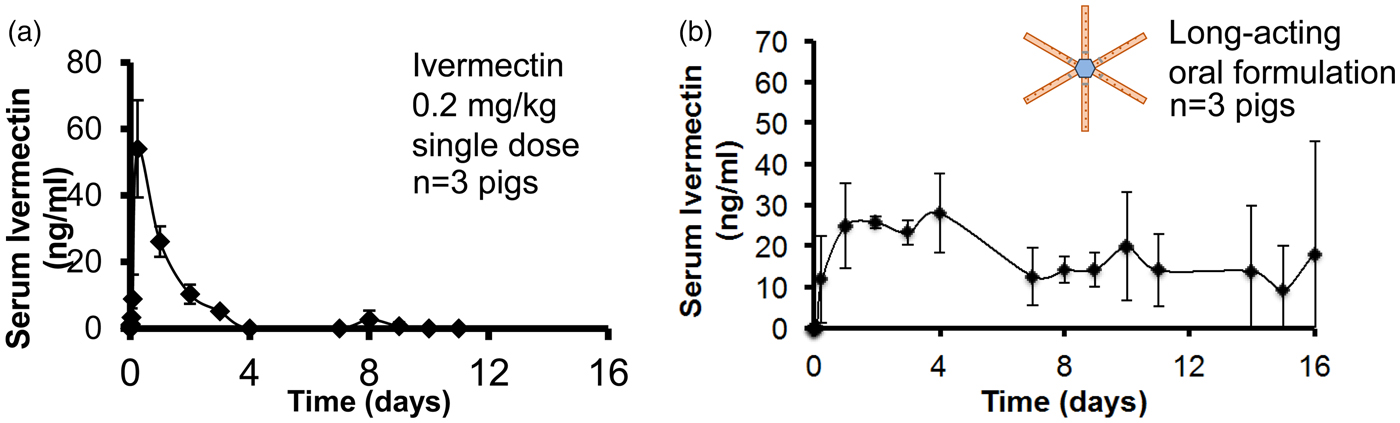
We have also used these systems to release three different drugs at once for the treatment of HIV (Kirtane et al., Reference Kirtane, Abouzid, Minahan, Bensel, Hill, Selinger, Bershteyn, Craig, Mo, Mazdiyasni, Cleveland, Rogner, Lee, Booth, Javid, Wu, Grant, Bellinger, Nikolic, Hayward, Wood, Eckhoff, Nowak, Langer and Traverso2018). These ultra-long-acting delivery systems have now been tested with model drugs in humans. Initial results show safety and efficacy in all 50 patients thus far tested.
Controlled delivery of nutrients
Another area where we have applied our approaches is human nutrition in the developing world where micronutrient deficiencies are prevalent. They impact nearly two billion people and cause up to two million childhood deaths per year, as well as numerous disabilities and diseases, including cognitive and physical disorders, anemia, blindness, birth defects, and impaired growth in children. In particular, many populations in developing world countries consume staple foods that often require extensive cooking, which introduces heat, moisture, and oxidation challenges, leading to: (i) degradation of vitamins, rendering them biologically inactive which impairs effectiveness, or (ii) chemical changes to minerals which makes the food unpalatable. As such, the development of technologies that address these stability challenges can potentially have an enormous impact on global health. To address these issues, we hypothesized that an encapsulation system employing an appropriate pH sensitive polymer could potentially remain stable in boiling water for hours yet dissolve rapidly in acidic stomach conditions. We examined over 50 polymers and discovered that poly(butylmethacrylate-co-(2-dimethylaminoethyl)methacrylate-co-methylmethacrylate) (1:2:1) (abbreviated BMC) had a unique combination of: (i) stability in boiling water for hours, yet rapid dissolution in gastric acid at body temperature, (ii) proven safety in humans (BMC is widely used in food and pharmaceutical products. It is already used commercially and has a history of being shown to meet the requirements to be accepted by the FDA and also generally regarded as safe), and (iii) ability to effectively encapsulate nutrients with a wide range of chemical and physical characteristics (Anselmo et al., Reference Anselmo, Xu, Buerkli, Zeng, Tang, McHugh, Behrens, Rosenberg, Duan, Sugarman, Zhuang, Collins, Lu, Graf, Tzeng, Rose, Nguyen, Le, Guerra, Freed, Weinstock, Sears, Nikolic, Wood, Oxley, Moretti, Zimmermann, Langer and Jaklenec2019).
We studied our system with 11 different micronutrients and found that this microparticle platform enabled the individual encapsulation of all 11 distinct micronutrients (MN) (iron, iodine, zinc, and vitamins A, B2, niacin, biotin, folic acid, B12, C, and D) (Fig. 17). In vitro studies established that encapsulation significantly improved stability of the micronutrients against heat, light, moisture, and oxidation. In vivo studies in mice confirmed rapid micronutrient release in the stomach and absorption in the intestines. Specifically, encapsulated vitamin A exhibited statistically indistinguishable differences in absorption as compared with free vitamin A in animal models, highlighting that encapsulation in BMC did not influence absorption. Two separate human studies with iron were performed. When the iron loading was 20%, iron bioavailability was statistically the same as non-encapsulated iron. We also found that BMC had UV-protective abilities; this can likely be attributed to the increased refractive index due to encapsulation in BMC, which will lower light exposure to encapsulated micronutrients (Anselmo et al., Reference Anselmo, Xu, Buerkli, Zeng, Tang, McHugh, Behrens, Rosenberg, Duan, Sugarman, Zhuang, Collins, Lu, Graf, Tzeng, Rose, Nguyen, Le, Guerra, Freed, Weinstock, Sears, Nikolic, Wood, Oxley, Moretti, Zimmermann, Langer and Jaklenec2019).
Eleven heat-stable micronutrient formulations. From Anselmo et al. (Reference Anselmo, Xu, Buerkli, Zeng, Tang, McHugh, Behrens, Rosenberg, Duan, Sugarman, Zhuang, Collins, Lu, Graf, Tzeng, Rose, Nguyen, Le, Guerra, Freed, Weinstock, Sears, Nikolic, Wood, Oxley, Moretti, Zimmermann, Langer and Jaklenec2019).
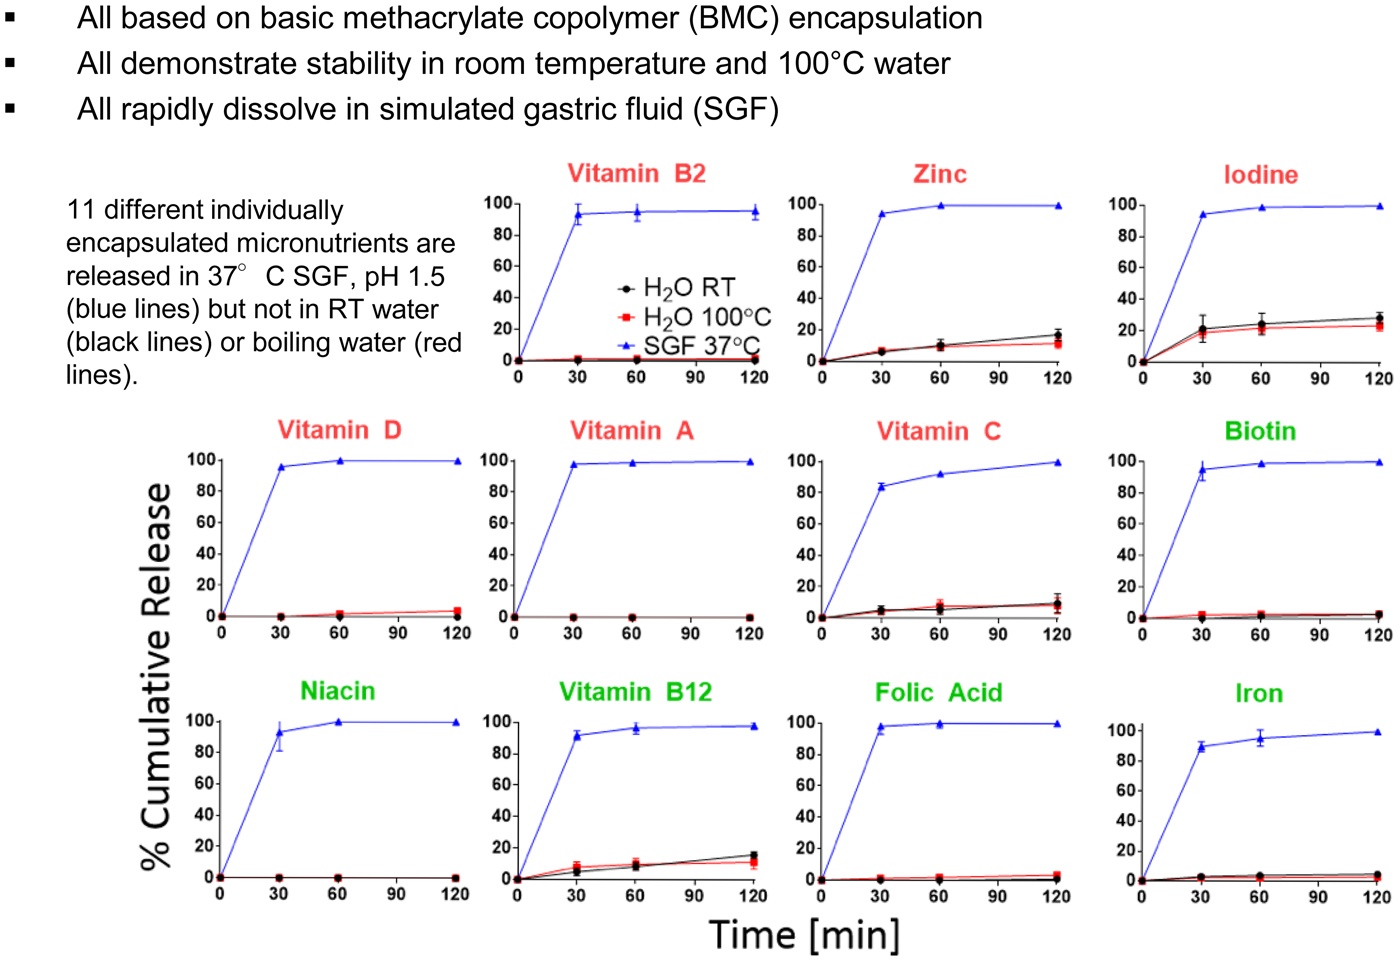
Recently, the Joint Food and Agriculture Organization of the United Nations and the World Health Organization (FAO/WHO) Expert Committee on Food Additives (JECFA) gave us a positive response for BMC, specifically for micronutrient encapsulation for food fortification at their 86th annual meeting in June of 2018 when we submitted our application for approval. As such, any potential concerns about the toxicity appear to have been addressed; furthermore, the doses described here and the potential doses that may be used in practice would unlikely exceed the published limitations for oral exposure. This positive reception paves the way toward potentially eliminating micronutrient malnutrition.
Other areas
We are also further adapting some of the other technologies that have been discussed in this paper for the developing world. In one case we are creating simple aerosolizers and large porous aerosols to deliver large amounts of lung surfactant to treat respiratory distress syndrome for infants. In another case, we are converting the microchip discussed earlier into a birth control system with 200 wells (one for each month for 200 months, or equivalently 16 years and 8 months) that can be turned on or off by the woman herself or a health care specialist in her area, so that she can do family planning in the way she desires.
Controlling the movement of molecules into cells
We have also developed new ways to control the movement of molecules into mammalian cells. Interestingly, this occurred serendipitously. My colleague, Klavs Jensen, and I had received an NIH grant to develop methods of inserting molecules into cells using a microfluidic device and a jet. However, the cells were often deflected away from the jet's stream, so Armon Sharei, our student, started forcing the cells toward the jet by passing the cells through smaller channels within the chip.
One day, Armon decided to run the cells through the system without the jet and found that the molecules still entered the cells (Fig. 18). Thus, we realized that constricting, or squeezing the cells must be temporarily opening up small holes in the cell membranes, as opposed to the jet doing so. We continued to study this approach and found that it was useful for inserting 30 different types of materials from genes to quantum dots into at least 20 different types of cells – all that were tested. Squeezing was also more effective than other methods. For example, we began comparing the squeeze approach to cell penetrating peptides and electroporation with respect to how many colonies of IPS cells were obtained by inserting the four genes that convert fibroblasts to IPS cells. We got 150 colonies by the squeeze approach, 11 colonies by electroporation, and two colonies by using cell-penetrating peptides (Sharei et al., Reference Sharei, Zoldan, Adamo, Sim, Cho, Jackson, Mao, Schneider, Han, Lytton-Jean, Basto, Jhunjhunwala, Lee, Heller, Kang, Hartoularos, Kim, Anderson, Langer and Jensen2013) (Fig. 19).
Technology: CellSqueeze. From Sharei et al. (Reference Sharei, Zoldan, Adamo, Sim, Cho, Jackson, Mao, Schneider, Han, Lytton-Jean, Basto, Jhunjhunwala, Lee, Heller, Kang, Hartoularos, Kim, Anderson, Langer and Jensen2013).
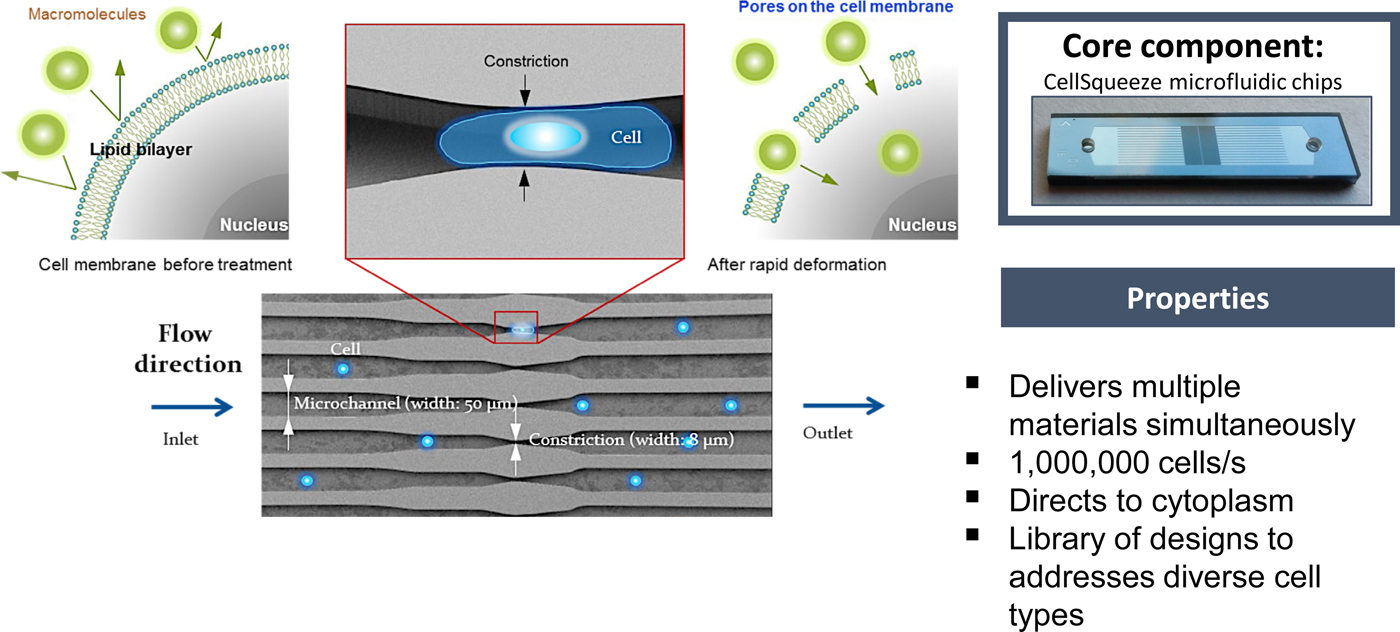
Reprograming of human. Fibroblasts via protein Tfs. From Sharei et al. (Reference Sharei, Zoldan, Adamo, Sim, Cho, Jackson, Mao, Schneider, Han, Lytton-Jean, Basto, Jhunjhunwala, Lee, Heller, Kang, Hartoularos, Kim, Anderson, Langer and Jensen2013).

Squeezing the cells was also safer, with fewer cells dying and far fewer changes in the transcriptome than electroporation (DiTommaso et al., Reference DiTommaso, Cole, Cassereau, Buggé, Hanson, Bridgen, Stokes, Loughhead, Beutel, Gilbert, Nussbaum, Sorrentino, Toggweiler, Schmidt, Gyuelveszi, Bernstein and Sharei2018). There are vast potential implications of being able to safely transport molecules into cells – including creating better, safer, cancer-killing cells, and the capacity to fundamentally change cell function.
Concluding remarks
This review paper has analyzed discoveries relating how to control the movement of molecules through materials, physiologic barriers, and even mammalian cells. It has also summarized approaches involved in developing ways to control transport through materials and the synthesis of entirely new materials and biomaterials. Some 15 journals are already fully or largely devoted to these areas. A Google search of ‘Controlled Drug Release’ yields several hundred million search results.
Developing ways to control the movement of molecules has enabled many fields and countless products that are broadly impacting the world. In medicine, it has enabled numerous new therapies, some of which are discussed in this review. In a related fashion, it has created better nutrition and had a major impact on aquaculture. In areas such as pesticides, herbicides, and fertilizers, it provides safer ways to administer these molecules to the environment so that they are not just ‘dumped,’ but rather are delivered steadily over time. Controlled release has also contributed to new cosmetics, new ways of aiding animal health (e.g. flea collars), and new approaches for delivering fragrances and household products (e.g. air fresheners).
There are still enormous challenges ahead and extensive basic research that must precede any solution to these challenges. For example, someday I believe there will be intelligent materials that can respond to environmental or physiologic signals. Such materials might be able to also inform us when transdermal delivery systems are depleted, when foods go bad, or provide us with critical clinical or environmental data. One example is creating materials that can release molecules by responding to signals in the body [e.g. by using enzyme sensors (Fischel-Ghodsian et al., Reference Fischel-Ghodsian, Brown, Mathiowitz, Brandenburg and Langer1988)] (e.g. an enzyme might detect glucose, and this glucose would react in the presence of the enzyme and cause a pH shift inside the polymer–drug matrix, increasing the solubility of the insulin. Thus, more insulin would diffuse out of the polymer matrix). Perhaps someday there will be molecular delivery microchips that contain sensors that will cause the chip to deliver molecules in response to environmental signals. There are other major challenges as well. Understanding how molecules are transported in the brain, nerves, ear, and other areas could improve the understanding and treatment of numerous diseases. In addition, targeting molecules to specific cells, e.g. cancer cells, could open new possibilities for medical treatments. This may require advances in receptor biology and the consequent discovery of new targeting molecules to specific cells.
The future will be determined by the students and the scientists of tomorrow. As I've come to realize, in school one is judged by how well one answers questions, but in real life, we are judged by the questions we ask.
One of my goals is to try to help my students cross the bridge from being researchers who can give good answers to those who can also ask good questions. I feel very fortunate that over 300 scientists who have passed through our lab are now professors all over the world, and an equal number are working in companies or have started their own companies. Still others are working in government-related research or other capacities. It is my hope that the innovations and findings discussed in this paper, which have now already been estimated to have improved the lives of billions of people (Queen Elizabeth Prize for Engineering, 2015; Science History Institute, 2015) and the findings to come by scientists all over the world will pave the way for students of the future to utilize chemistry to make the world a better place, and to relieve suffering, and prolong life, on our planet.