Introduction
Protein–ligand binding is one of the most ubiquitous and diverse processes in biology. Proteins bind to each other to form vital complexes such as hemoglobin; DNA in higher organisms is found mostly in complex with the histones and other proteins; and when the ligand is a small molecule, it can be the substrate that binds to an enzyme in the course of a biochemical reaction. Binding of small molecules to proteins is of interest for yet another important reason: early stages of structure-based drug discovery (Gilson & Zhou, Reference Gilson and Zhou2007; Gohlke & Klebe, Reference Gohlke and Klebe2002; Jorgensen, Reference Jorgensen2004) often involve identifying a ligand that binds to the target protein with high affinity.
Regardless of the nature of receptor–ligand binding, understanding the mechanisms involved requires detailed knowledge of the nature and origins of changes in physical states of the participating proteins and ligands. It is well known that structural complementarity plays a critical role in the binding process, and so it is not surprising that structural re-arrangements that can accompany protein–ligand binding have been extensively explored (Goh et al. Reference Goh, Milburn and Gerstein2004; Holmes et al. Reference Holmes, Jon, Jahn and Schroder2003; Boehr & Wright, Reference Boehr and Wright2008), including variations in ligand-binding mode to the same receptor (Mobley & Dill, Reference Mobley and Dill2009). The ‘induced fit’ mechanism, whereby the protein adjusts its shape to better accommodate the ligand, has long been in textbooks (Voet & Voet, Reference Voet and Voet1995). Structure–energy relationships in the binding process have also been systematically investigated (Bordner & Abagyan, Reference Bordner and Abagyan2005; Elcock et al. Reference Elcock, Sept and Mccammon2001; Ofran & Rost, Reference Ofran and Rost2003; Sheinerman & Honig, Reference Sheinerman and Honig2002).
In contrast, relatively little was known until recently about the magnitude, prevalence, and detailed origins of changes in charge states of receptors and ligands that accompany the binding. These changes are directly related to binding-induced changes in pK Footnote 1 values of ionizable groups in proteins and their ligands. In part, the relative underdevelopment of this field compared to its close ‘relative’ – studies of structural changes in protein–ligand binding – can be attributed to the difficulties associated with experimental determination of pK and protonation state changes in a complex formation. Even today, only a handful of relevant data points exist. Moreover, even though rigorous physics-based methods able to compute titratable group pK s based on atomic resolution protein structures have existed for at least two decades (Alexov et al. Reference Alexov, Mehler, Baker, Baptista, Huang, Milletti, Nielsen, Farrell, Carstensen, Olsson, Shen, Warwicker, Williams and Word2011; Bashford & Karplus, Reference Bashford and Karplus1990; Gilson, Reference Gilson1993; Yang et al. Reference Yang, Gunner, Sampogna, Sharp and Honig1993), no ‘large scale’ studies of pK changes in protein–ligand appeared until recently.
It is important to realize that energetic consequences of binding-induced protonation state changes may be as large as those caused by partial protein unfolding or destabilizing mutations. For example, at pH=6.5, the cost of changing the ionization state of a single group with pK=4.5 is larger than 2 kcal/mol – a realistic scenario in protein–ligand binding. This relatively large energy should not be surprising if one draws an analogy between ligand binding and protein folding: both processes often involve burial (desolvation) of large parts of the protein. It was well known for a long time that energetic costs of several kcal/mol are often associated with burial of certain ionizable groups inside folded proteins. In fact, it is this effect that leads to the observed pH dependence of protein stability (Tanford, Reference Tanford1970; Yang & Honig, Reference Yang and Honig1992). Not surprisingly, the change in the protonation state of the complex relative to that of the separated receptor and its ligand is also a prerequisite for the observed (Blundell et al. Reference Blundell, Mahoney, Cordell, Almond, Kahmann, Perczel, Taylor, Campbell and Day2007; Djurdjevic-Pahl et al. Reference Djurdjevic-Pahl, Hewage and Malthouse2005) pH dependence of receptor–ligand binding (Bidwai et al. Reference Bidwai, Ok and Erman2008; Hansen et al. Reference Hansen, Olsen, Bernichtein, O'Shea, Sigurskjold, Goffin and Kragelund2011; Maiti & Drohat, Reference Maiti and Drohat2011; Sackett et al. Reference Sackett, TerBush and Weliky2011). The change of protonation states of titratable groups during particular reaction is the cause of pH-dependence of most enzymatic reactions (Voet & Voet, Reference Voet and Voet1995) as well. Since evolution cares about survival and reproduction only, which is related to biological activity and networks on the cellular level, one can ask whether the pH-dependence of activity of biological macromolecules is somehow related to their pH-dependence of stability and interactions (Talley & Alexov, Reference Talley and Alexov2010). In addition, how the pH-dependent properties are related to the subcellular and tissue pH? (Garcia-Moreno, Reference Garcia-Moreno2009; Kundrotas & Alexov, Reference Kundrotas and Alexov2006; Mitra et al. Reference Mitra, Zhang and Alexov2011). Is it possible that macromolecular interactions have evolved toward specific pH, and can tolerate small deviations around it. Alternatively, they may have evolved to be strongly pH-dependent to sense or regulate the local pH (Mitra et al. Reference Mitra, Zhang and Alexov2011). These issues must be considered when discussing protonation state changes in ligand binding and their possible effects on practical computations.
Until recently, many questions related to the magnitude, prevalence, detailed physical origins, and practical implications of changes in the charge state of receptor proteins (and ligands) on complex formation were not explored on a statistically large scale. Even though earlier case studies suggested that accounting for possible changes in the charge state on binding may be important for structure-based drug design, practical, automated ligand docking, and affinity ordering (scoring) methods (Taylor et al. Reference Taylor, Jewsbury and Essex2002) routinely ignored the possibility of ionization state changes on the binding. Occasional manual intervention, e.g., based on ‘visual inspection’ of polar hydrogens was reported (Warren et al. Reference Warren, Andrews, Capelli, Clarke, LaLonde, Lambert, Lindvall, Nevins, Semus, Senger, Tedesco, Wall, Woolven, Peishoff and Head2005), but it is still a common practice to perform a docking calculations with a single protonation state of both the ligand and receptor. Useful prediction of ligand-binding affinities is still challenging (Ge & Roux, Reference Ge and Roux2010; Gilson & Zhou, Reference Gilson and Zhou2007; Lee & Olson, Reference Lee and Olson2008; Rodinger et al. Reference Rodinger, Howell and Pomes2008; Singh & Warshel, Reference Singh and Warshel2010; Wang et al. Reference Wang, Deng and Roux2006; Warren et al. Reference Warren, Andrews, Capelli, Clarke, LaLonde, Lambert, Lindvall, Nevins, Semus, Senger, Tedesco, Wall, Woolven, Peishoff and Head2005; Woo & Roux, Reference Woo and Roux2005; Woo, Reference Woo2008; Zhou & Gilson, Reference Zhou and Gilson2009).
The situation is now changing rapidly. Reduced computational costs and improved accuracy of practical pK calculations (see recent reviews (Alexov et al. Reference Alexov, Mehler, Baker, Baptista, Huang, Milletti, Nielsen, Farrell, Carstensen, Olsson, Shen, Warwicker, Williams and Word2011; Nielsen et al. Reference Nielsen, Gunner and Garcia-Moreno2011)), along with availability of such methods as fast web-based tools (Anandakrishnan et al. Reference Anandakrishnan, Aguilar and Onufriev2012; Bas et al. Reference Bas, Rogers and Jensen2008; Dolinsky et al. Reference Dolinsky, Czodrowski, Li, Nielsen, Jensen, Klebe and Baker2007), have facilitated large-scale analysis of ionization state changes in protein–ligand binding. Promising methods begin to appear that consistently take variability of receptor/ligand ionization (protonation) states into account (Park et al. Reference Park, Gao and Stern2011). In this brief review, we will attempt to summarize what is known, and what challenges lie ahead.
Origins of protonation state changes in receptor–ligand binding and related corrections to binding affinity
Any ionizable (titratable) group in a protein is involved in a number of electrostatic interactions, both with the other groups and with the solvent. Ultimately, it is the change of these interactions on ligand binding that is responsibleFootnote 2 for the change in the group's pK and charge (protonation) state. The general idea of electrostatic origin of observed pK shifts of ionizable groups in proteins, relative to their values in solution, is at the core of most methods for pK prediction in proteins, both historic and modern (Antosiewicz et al. Reference Antosiewicz, McCammon and Gilson1994; Bas et al. Reference Bas, Rogers and Jensen2008; Bashford & Karplus, Reference Bashford and Karplus1990; Beroza et al. Reference Beroza, Fredkin, Okamura and Feher1991; DelBuono et al. Reference DelBuono, Figueirido and Levy1994; Demchuk & Wade, Reference Demchuk and Wade1996; Georgescu et al. Reference Georgescu, Alexov and Gunner2002; Khandogin & Brooks, Reference Khandogin and Brooks2006; Kieseritzky &Knapp, Reference Kieseritzky and Knapp2008a; Mongan et al. Reference Mongan, Case and McCammon2004; Nielson & Vriend, Reference Nielson and Vriend2001; Sham et al. Reference Sham, Chu and Warshel1997; Simonson et al. Reference Simonson, Carlsson and Case2004; Song et al. Reference Song, Mao and Gunner2009; Spassov & Yan, Reference Spassov and Yan2008; Takahashi et al. Reference Takahashi, Nakamura and Walda1992; Tanford & Kirkwood, Reference Tanford and Kirkwood1957; Tanford & Roxby, Reference Tanford and Roxby1972; Ullmann & Knapp, Reference Ullmann and Knapp1999; Yang et al. Reference Yang, Gunner, Sampogna, Sharp and Honig1993).
As a reasonable first approximation, assume that ionizable groups that change their charge states upon ligand binding do not interact with each other; arguments in favor of the approximation are given in (Mason & Jensen, Reference Mason and Jensen2008). Within this simplification, the pK change of a given ionizable group in the receptor protein can be decomposed into two distinct contributions (Bashford & Karplus, Reference Bashford and Karplus1990),
 $${\rm \rmDelta p}K \equals \rmDelta {\rm p}K^{{\rm Born}} \plus \rmDelta {\rm p}K^{{\rm Back}} \comma $$
where the first term is the so-called ‘Born’ contribution or desolvation penalty, and the second is the ‘background’ contribution. The Born term describes the energetic costs associated with changing the degree of solvation of the group. Typically, these are unfavorable costs of desolvating the group by replacing the solvent–water and ions–in the binding pocket with the ligand, Fig. 1 a. Structural re-arrangements caused in the receptor by the ligand binding, Fig. 1 c, may also contribute to ΔpK Born by virtue of changing the solvation pattern of the group. For example, a solvent exposed glutamic acid in the binding pocket may have a pK near its model compound value in solution (about 4.5), thus carrying a net charge of −1 at neutral pH=7.0. Upon complexation, it may find itself buried inside a low dielectric medium (protein+ligand). If it were to stay charged, the energetic penalty would be large. Assuming the proton charge in this case is smeared over a sphere of radius R=3 Å, the unfavorable cost of transferring it from water ∊w=80 to protein interior ∊p=4, is ΔG≈166[kcal/mol](1/∊p−1/∊w)e 2/R≈12 kcal/mol. On the other hand, if the group picks up a proton from the solvent at this pH, the cost is only 2.3 kBT(pH−pK)≈3.4 kcal/mol, and there is no desolvation penalty to bury the now neutral group. This energetically more favorable scenario is realized, and the group becomes neutralized, Fig. 1 a. Another way of thinking about the process in this example is that the group's pK is shifted up by (12 kcal/mol)/(2.3 k BT)≈8.8 pK units upon ligand binding. Its new pK≈13.3 is now larger than the pH of the solvent, and the group picks up a proton.
The ΔpK Back term in Eq. (1) sums up the effects of altering electrostatic interactions between the group in question and the solute ‘background’ charges surrounding it. These effects can be further broken down into two contributions: interactions of the group with the ligand partial charges, Fig. 1 b, and altered interactions with partial charges within the receptor protein following conformational rearrangements in the receptor induced by formation of the complex, (Fig. 1 c). These re-arranegemnts may propagate towards a distant ionizable group, altering its local electrostatic environment (e.g., by changing the hydrogen bonding network) thereby causing the pK shift. Note that alterations of hydrogen-bonding networks, interactions with molecular quadrupoles, etc. are included in ΔpK Back. For example, a glutamic acid originally partially buried in the binding pocket of the receptor may already have its pK shifted up due to partial desolvation, so that the group is protonated and is net neutral at pH=7.0. On complexation, however, the extra cost of interaction of the group's proton with a nearby positive charge on the ligand may become larger than the cost of releasing the proton back to the solvent. The group will release the proton to become negatively charged, (Fig. 1 b).
Three main mechanisms behind changes in pK (and state of protonation) of an ionizable group in receptor protein upon ligand binding. (a) Desolvation of the group upon binding of the ligand. (b) Direct electrostatic interaction with the ligand. (c) Structural re-arrangements in the receptor protein caused by the binding.

As we shall see below, all of the three scenarios shown in Fig. 1 are realized in real protein–ligand complexes.
Corrections to the binding affinity: Regardless of the specific mechanism, ionization state changes upon ligand binding cause the binding free energy to become pH-dependent. One of several equivalent expressions (Jensen, Reference Jensen2008) for ΔG (pH) in this case is
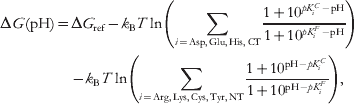 $$\eqalign{{\rm \rmDelta }G\lpar {\rm pH}\rpar \equals \tab{\rm \rmDelta }G_{{\rm ref}} \minus k_{\rm B} T\ln \left( {\sum\limits_{i \equals {\rm Asp}\comma {\rm Glu}\comma {\rm His}\comma {\rm CT}} {{{1 \plus 10^{pK_{i}^{C} \minus {\rm pH}} } \over {1 \plus 10^{pK_{i}^{F} \minus {\rm pH}} }}} } \right) \cr \tab \minus k_{\rm B} T \ln\left( {\sum\limits_{i \equals {\rm Arg}\comma {\rm Lys}\comma {\rm Cys}\comma {\rm Tyr}\comma {\rm NT}} {{{1 \plus 10^{{\rm pH} \minus pK_{i}^{C} } } \over {1 \plus 10^{{\rm pH} \minus pK_{i}^{F} } }}} } \right)\comma }$$
where indices ‘C’ and ‘F’ denote the complexed and the free states of the receptor and ligand, respectively (Mason & Jensen, Reference Mason and Jensen2008). The first term in the above equation is the binding free energy in the reference state of protonation that corresponds to all Asp, Glu, His (no distinction between tautomers is made), and C-terminal (CT) residues held deprotonated, while all Cys, Tyr, Lys, Arg, and N-terminal (NT) residues are protonated. This particular state of protonation is a common, albeit not perfect, assumption in many molecular modeling studies. Note that this state does not necessarily occur naturally at any given pH. The remaining terms in Eq. (2) are the pH-dependent correction to the reference binding free energy. In a way, the correction can be taken as a measure of the (pH-dependent) error associated with the use of the standard protonation state. As we shall see below, both experiment and computation have demonstrated that corrections to the binding free energy that arise from protonation state changes can be as large as the binding free energy estimated without taking the protonation state change into account. Examples of calculations based on Eq. (2) can be found in (Mason & Jensen, Reference Mason and Jensen2008; Palpant et al. Reference Palpant, Houang, Delport, Hastings, Onufriev, Sham and Metzger2010).
The mechanisms of binding-induced pK changes shown in Fig. 1 remain qualitatively the same even if the ionizable groups can no longer be approximated as non-interacting, but a more complex formalism than that based on Eq. 1 or 2 is needed for quantitative prediction of pK shifts. Namely, for a receptor and ligand with N and n ionizable groups respectively, all 2(N +n ) possible protonation micro-states of the protein–ligand system needed to be considered (Bashford & Karplus, Reference Bashford and Karplus1990; Kieseritzky & Knapp, Reference Kieseritzky and Knapp2008b; Misra et al. Reference Misra, Hecht, Yang and Honig1998; Ullmann & Knapp, Reference Ullmann and Knapp1999), and proper Boltzmann averages computed. To handle the combinatorial complexity of the multiple protonation problem, various approximations are used, e.g. Monte-Carlo-based sampling (Beroza et al. Reference Beroza, Fredkin, Okamura and Feher1991), or approaches that single out small clusters of strongly interacting groups (Gilson, Reference Gilson1993; Myers et al. Reference Myers, Grothaus, Narayanan and Onufriev2006). These methods are now available in many packages, including web servers (Gordon et al. Reference Gordon, Myers, Folta, Shoja, Heath and Onufriev2005; Kieseritzky & Knapp, Reference Kieseritzky and Knapp2008b). Once titration curves of the protein and ligand have been obtained, a general thermodynamic linkage relationship (Tanford, Reference Tanford1970) can be used to estimate the pH-dependent correction to the binding energy:
 $${\rm \rmDelta }G\lpar {\rm pH}\rpar \equals {\rm \rmDelta }G\lpar {\rm pH}_{{\rm ref}} \rpar \plus k_{\rm B} T2.3\int_{{\rm pH}_{{{\rm ref}}} }^{{\rm pH}} {{\rm \rmDelta }Q} \lpar {\rm pH}\rpar \,{\rm dpH\comma }$$
where ΔQ(pH) is the difference between the net charge of the complex and the corresponding free protein and the ligand at the given pH, ΔQ(pH)= Q complex (pH) −Q protein (pH)−Q ligand (pH). The reference pHref can be chosen arbitrarily: often, the choice is dictated by computational convenience. For example, at extreme pH values the protonation states of both the complex and the unbound receptor and ligand are obvious. Note that this type of reference state (definite pH) is different from that used in Eq. (2) (definite state of protonation). It is worth mentioning that the same approach is valid for investigating pH-dependence of protein stability, if one replaces bound and unbound states with folded and unfolded states. The approach dates back to Tanford (Tanford, Reference Tanford1970) and Linderstrom-Lang (Linderstrom-Lang, Reference Linderstrom-Lang1924). Examples of calculations based on Eq. (3) can be found in (Alexov, Reference Alexov2004; Misra et al. Reference Misra, Hecht, Yang and Honig1998; Mitra et al. Reference Mitra, Zhang and Alexov2011; Yang & Honig, Reference Yang and Honig1993). An alternative approach not based on Eq. (3) or (2) was recently developed and explored in the context of protein–ligand docking (Park et al. Reference Park, Gao and Stern2011). Note that in general, protein–ligand binding involves complex interplay between multiple protonation, receptor and ligand conformation states, considered on the same footing, without any assumptions of weak coupling. A Monte-Carlo simulation package developed to handle this very general case is now available (Ullmann & Ullmann, Reference Ullmann and Ullmann2012). The approach is based on a full microstate description of the receptor and an average description of its surroundings in terms of chemical potentials. The receptor can be modeled in great detail, including conformational flexibility and many binding sites that can bind different ligand types. It should be mentioned that titration curves of strongly interacting groups can sometimes deviate so much from the standard sigmoidal (Henderson–Hasselbalch) shape, that the usual notion of pK as mid-point of the curve may no longer be meaningful (Bombarda & Ullmann, Reference Bombarda and Ullmann2010; Onufriev et al. Reference Onufriev, Case and Ullmann2001). Coupling to ligand binding may produce non-trivial cooperative effects (Onufriev & Ullmann, Reference Onufriev and Ullmann2004), even without any conformational change in the receptor protein (Spassov & Bashford, Reference Spassov and Bashford1998). In fact, the latter possibility was not included in Fig. 1: proton transfer to a distant group can occur via a concerted change of protonation states in a strongly coupled cluster (Onufriev et al. Reference Onufriev, Smondyrev and Bashford2003). However, based on available data presented in the following sections, this scenario, if it occurs, is definitely not among the common ones in protein–ligand binding.
Magnitude and prevalence of protonation and pK changes in receptor proteins upon ligand binding
What is known from experiment?
Methods that can characterize changes in protonation states of the protein and its ligand upon binding can be divided into two broad classes: ‘macroscopic’ and ‘atomistic’. Below we briefly outline each of them.
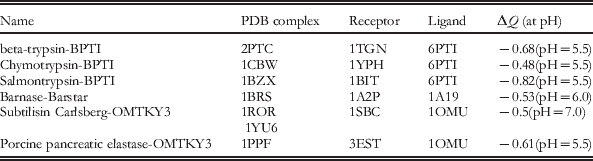
The first (macroscopic) class is represented almost exclusively (Bruylants et al. Reference Bruylants, Wintjens, Looze, Redfield and Bartik2007) by isothermal titration calorimetry (ITC) (Baker & Murphy, Reference Baker and Murphy1996; Perozzo et al. Reference Perozzo, Folkers and Scapozza2004). In this technique, the overall heat of the complex formation is recorded as the ligand is being added to the buffered receptor solution at constant temperature. To detect whether proton transfer from the buffer to the complex has occurred upon binding, the heat of complex formation is measured under different buffer conditions. The stoichiometry of the protonation reaction can also be obtained. Based on thermodynamics, the approach has a clear advantage of being general; it gives direct access to binding affinities. However, by itself, the method can only tell whether a net proton uptake/release has occurred upon binding, but it can not determine which group(s) became protonated or deprotonated. Specific assignments have to be made based on additional information such as computation (Steuber et al. Reference Steuber, Czodrowski, Sotriffer and Klebe2007), mutagenesis (Qasim et al. Reference Qasim, Ranjbar, Wynn, Anderson and Laskowski1995), ultra-high resolution X-ray structures (Steuber et al. Reference Steuber, Czodrowski, Sotriffer and Klebe2007), or NMR data (Blundell et al. Reference Blundell, Mahoney, Cordell, Almond, Kahmann, Perczel, Taylor, Campbell and Day2007; Bruylants et al. Reference Bruylants, Wintjens, Looze, Redfield and Bartik2007). Relatively small number of ITC studies of proton transfer in complex formation have been performed to date, owing to their experimental complexity (Czodrowski et al. Reference Czodrowski, Sotriffer and Klebe2007). For small molecule ligands, readily available literature references are limited to very few cases in complexes with enzymes or antibodies (Czodrowski et al. Reference Czodrowski, Sotriffer and Klebe2007; Gómez & Freire, Reference Gómez and Freire1995; Murphy et al. Reference Murphy, Xie, Garcia, Amzel and Freire1993; Steuber et al. Reference Steuber, Czodrowski, Sotriffer and Klebe2007; Xie et al. Reference Xie, Gulnik, Collins, Gustchina, Suvorov and Erickson1997). In some of these cases, binding-induced protonation state change in the receptor protein was reported. For example, for serine proteases trypsin and thrombin, binding of a series of small molecule ligands at pH=7.8 was investigated (Czodrowski et al. Reference Czodrowski, Sotriffer and Klebe2007): formation of 3 out of 12 complexes was associated with a net proton uptake from the buffer. For protein ligands, a summary of experimental data for five different protein–protein complexes involved in electron transfer is given in (Kresheck et al. Reference Kresheck, Vitello and Erman1995): at near neutral pH, full proton release was observed in one case, and in two cases a partial (∼50%) release was reported. The relative error of the measured net proton uptake can be expected to range from 7 to 20% (Czodrowski et al. Reference Czodrowski, Sotriffer and Klebe2007; Kresheck et al. Reference Kresheck, Vitello and Erman1995). In a separate study, Horn et al. (Horn et al. Reference Horn, Ramaswamy and Murphy2003) investigated ovomucoid third domain binding to subtilisin Carlsberg. It was concluded that one residue changes pK appreciably upon binding, from 8.5 to 6.7. At a pH in the middle of the range, a significant deprotonation of the residue occurs. In another work, a very large pK shift, from 4.4 to 8.7, was reported for a Glu residue in Streptomyces griseus proteinase upon complexation with with turkey ovomucoid third domain protein (Qasim et al. Reference Qasim, Ranjbar, Wynn, Anderson and Laskowski1995). In fact, one can apply the general Eq. (3) to calculate the corresponding net proton uptake/release practically from any experimentally documented pH-dependent binding data. Table 1 provides an example of such experimental data, including the corresponding PDB ID of the structures of the complex, the receptor and the ligand. It should be mentioned that with respect to the proton uptake/release, the collected data set is particularly interesting, since the protonation changes are non integers, and therefore cannot be modeled by manually changing the ionization state (neutral or charged) of any single amino acid. Instead, the modeling would require an ensemble representation where the proton uptake/release may be distributed over several amino acids, and their protonation states may vary within the ensemble. In the simplest case scenario, the ensemble can be represented by a single structure, but different protonation states, or in a more realistic scenario, one should generate an ensemble with both structural and protonation variants. Such ensembles are generated naturally within constant pH Molecular Dynamics (Khandogin & Brooks, Reference Khandogin and Brooks2006; Lee et al. Reference Lee, Salsbury and Brooks2004; Mongan et al. Reference Mongan, Case and McCammon2004; Swails et al. Reference Swails, Meng, Walker, Marti, Estrin and Roitberg2009). For example, in the approach developed by Mongan et al. (Mongan et al. Reference Mongan, Case and McCammon2004), protonation states are accepted or rejected on the fly, according to a Metropolis criterion, during the course of the simulation.
Cases of receptor–ligand complexes experimentally shown to have pH-dependent binding, which was used to calculate net proton uptake/release (the ΔQ (Eq. (3))) at specific pH. Data are taken from (Buckle et al. Reference Buckle, Schreiber and Fersht1994; Buczek et al. Reference Buczek, Koscielska-Kasprzak, Krowarsch, Dadlez and Otlewski2002; Krowarsch et al. Reference Krowarsch, Dadlez, Buczek, Krokoszynska, Smalas and Otlewski1999; McPhalen et al. Reference McPhalen, Svendsen, Jonassen and James1985; Schreiber & Fersht, Reference Schreiber and Fersht1993; Schreiber & Fersht, Reference Schreiber and Fersht1995). Where the experimental 3D structure is unavailable, the closest homolog is listed.

For nucleic acid ligands, proton uptake by receptor protein upon complexation was reported too (Kozlov & Lohman, Reference Kozlov and Lohman2000; Mishra et al. Reference Mishra, Spring and Germann2009). In the case of a single-stranded DNA binding to an Escherichia-coli protein (Kozlov & Lohman, Reference Kozlov and Lohman2000), the proton uptake was observed over a wide pH range (5.0–10.0). Importantly, most of the calorimetry studies that reported thermodynamic parameters of complex formation, such as ΔH or ΔC p, also included corrections from protonation-binding linkage. In some cases (Kozlov & Lohman, Reference Kozlov and Lohman2000), these corrections were as much as half of the total value of the measured parameter.
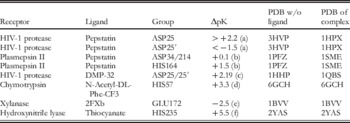
‘Atomistic’ techniques such as X-ray crystallography, neutron-scattering, and NMR can, in principle, pinpoint positions of individual protons in both the bound and unbound states of the complex. In practice, each of the methods has severe limitations when applied to the study of protonation and pK changes upon complex formation–only very few relevant data points exit to-date. The resolution of the absolute majority of currently available X-ray structures is still too low to determine hydrogen positions reliably. While some ultra-high (better than 1 Å) resolution structures are now available, one needs both the complex and the unligated protein structures to tell if a protonation state has indeed occurred upon binding. Our recent (Aguilar et al. Reference Aguilar, Anandakrishnan, Ruscio and Onufriev2010) search of public databases for pairs of protein–ligand complexes along with their matching unligated proteins identified such pairs only at 1.2 Å or lower resolution, which is still not enough for hydrogen assignment from the electron density. While protons are readily available in neutron-scattering structures, these are so few that we were not able to find any (complex+unligated protein) pair. NMR thus remains the key source of residue-specific pK in proteins, with a few hundred of experimental data points now available (Grimsley et al. Reference Grimsley, Scholtz and Pace2009), often used to benchmark computational methods (Antosiewicz et al. Reference Antosiewicz, McCammon and Gilson1994; Georgescu et al. Reference Georgescu, Alexov and Gunner2002; Spassov & Yan, Reference Spassov and Yan2008) that predict pK. However, only a handful of these data points correspond to pairs of protein–ligand complexes and their matching unligated receptors. Protein–protein complexes continue to present challenge to present day NMR, most likely due to their relatively large size. Several recent computational studies reported relevant compilations from experimental literature (Aguilar et al. Reference Aguilar, Anandakrishnan, Ruscio and Onufriev2010; Bas et al. Reference Bas, Rogers and Jensen2008), see a representative sample in Table 2 from (Aguilar et al. Reference Aguilar, Anandakrishnan, Ruscio and Onufriev2010). The only selection criterion used in that compilation was availability of reasonable quality X-ray structures for both the complex and the unligated protein, including the requirement for no missing residues in the middle of the amino-acid sequence. Most of the pK s listed in Table 2 were determined by NMR.
Experimental pK changes in several proteins upon ligand binding. For each group, ΔpK=pK (complex) – pK (unligated receptor). Experimental references are given in ( ): (a) (Smith et al. Reference Smith, Brereton, Chai and Kent1996; Wang et al. Reference Wang, Freedberg, Yamazaki, Wingfield, Stahl, Kaufman, Kiso and Torchia1996), (b) (Xie et al. Reference Xie, Gulnik, Collins, Gustchina, Suvorov and Erickson1997), (c) (Yamazaki et al. Reference Yamazaki, Nicholson, Wingfield, Stahl, Kaufman, Eyermann, Hodge, Lam and Torchia1994), (d) (Cassidy et al. Reference Cassidy, Lin and Frey1997), (e) (Joshi et al. Reference Joshi, Sidhu, Nielsen, Brayer, Withers and Mcintosh2001), (f) (Stranzl et al. Reference Stranzl, Gruber, Steinkellner, Zangger, Schwab and Kratky2004)

The immediate conclusion from Table 2 is that appreciable, and sometimes very large pK shifts do occur upon binding. We stress that a pK shift, even a large one, does not necessarily entail a protonation state change of the group in question, unless the ambient pH is in-between the group's pK values before and after binding. However, in the case of the groups listed in Table 2, most of their measured pK values fall into the biologically relevant pH range (4–8), which means that a protonation state change can occur upon the complex formation under biologically relevant conditions. For example, HIS235 of hydroxynitrile lyase is unprotonated at pH=7.0 (its pK=2.5), while complexation with thiocyanate shifts its pK to 8.0, resulting in protonation of the group (Stranzl et al. Reference Stranzl, Gruber, Steinkellner, Zangger, Schwab and Kratky2004). Clearly, the energy cost of mis-assigning the ionization state of just this one group at pH=7.0 would already be well above the typical error margin of experiments that measure ligand-binding affinity (Gilson & Zhou, Reference Gilson and Zhou2007). However, one can immediately notice that the diversity of both the receptor proteins and their ligands in Table 2 is very limited, reducing generality of any conclusion that can be drawn from the data.
To summarize, various experimental techniques point unambiguously to large pK shifts and protonation state changes that can occur in proteins upon protein–ligand binding. The phenomenon is observed for different classes of biologically relevant ligands such as small molecules, other proteins, or nucleic acids. Corrections to thermodynamic parameters of the complex formation associated with these changes were large enough to warrant consideration and inclusion. However, the scarcity of the experimental data makes it hard to estimate the over-all prevalence of these effects within a reasonable statistical margin. For the same reason, it is impossible to extract, from the currently available experimental data alone, trends in how the binding-induced protonation changes may be distributed in the receptor and the ligand. These questions are important both for fundamental understanding of protein–ligand-binding process and for the development of computational methods that utilize atomistic protein structures to make predictions.
What do calculations tell us?
Given the scarcity of the experimental data, computational methods become particularly valuable in studying pK and ionization state changes in protein–ligand binding.
Earlier studies
Earlier studies, see (Brandsdal et al. Reference Brandsdal, Smalås and Åqvist2006; Elcock et al. Reference Elcock, Sept and Mccammon2001; McDonald et al. Reference McDonald, Willson and McCammon1995; Misra et al. Reference Misra, Hecht, Yang and Honig1998; Sims et al. Reference Sims, Wong, Vuga, Mccammon and Sefton2005; Trylska et al. Reference Trylska, Antosiewicz, Geller, Hodge, Klabe, Head and Gilson1999) for a representative sample, made progress by detailed analysis of a small number of specific proteins, ligands, and ionizable groups. These works often reported large pK shifts and protonation changes in protein–ligand binding, and pointed to the need to take the associated energetic costs into account for accurate prediction of the binding properties. For example, McDonald et al. (McDonald et al. Reference McDonald, Willson and McCammon1995), used continuum electrostatic calculations to investigate the titration behavior of the ionizable residues of the HyHEL-5-hen egg lysozyme complex and its individual components. Several residues of HyHEL-5 had pK values shifted upon binding by more than three pH units. Brandsdal et al. (Brandsdal et al. Reference Brandsdal, Smalås and Åqvist2006) systematically investigated (using free energy calculations) the binding of BPTI with glutamic acid at the primary binding position to trypsin. The predicted pK shift of the key Glu residue upon binding was as large 9.8 units, yielding a pK of 14.3 in the complex. The resulting unusual neutral charge state of the Glu residue was found to be essential to obtain quantitative agreement with the experimental binding data. In another study, Spassov and Bashford (Spassov & Bashford, Reference Spassov and Bashford1998) proposed an alternative mechanism for the cooperative binding of charged ligands to proteins based on electrostatic coupling to ionizable groups. The mechanism was investigated on a monomeric protein (calbindin D9k) containing two Ca2+-binding sites and 30 ionizable groups. Alexov (Alexov, Reference Alexov2004) investigated the role of individual residues in proton uptake/release experimentally measured for three complexes involving aspartic proteases and pepstatin. It was demonstrated that the conformational changes induced by the binding contribute significantly to the calculated pK changes. In addition, it was pointed out that for correct calculations of the binding energy, one should model ionization and conformational changes within the same algorithm that calculates the energy.
Large scale studies
However, it was not until very recently that computational works based on statistically large sets–thousands of computed pK s–began to appear (Aguilar et al. Reference Aguilar, Anandakrishnan, Ruscio and Onufriev2010; Mason & Jensen, Reference Mason and Jensen2008; Kundrotas & Alexov, Reference Kundrotas and Alexov2006). These recent studies have explored and quantified statistical trends in protein–ligand binding in addition to analyzing individual cases in detail. Perhaps the most intriguing finding that has emerged is that changes in pK and ionization states of titratable amino acids occur quite commonly in proteins upon ligand binding. The exact statistics, however, varies appreciably, most likely due to variations in the methodology and data sets used.
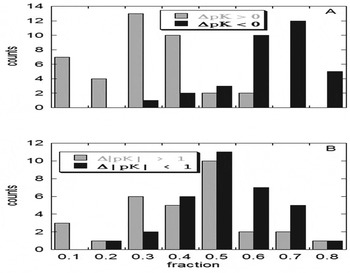
Kundrotas et al. (Kundrotas & Alexov, Reference Kundrotas and Alexov2006) investigated statistical and electrostatic properties of the interfaces for a set of 37 complexes with diverse functions extracted from a database of protein–protein complexes previously developed by the authors. Multi-conformer, continuum electrostatic pK calculations (Georgescu et al. Reference Georgescu, Alexov and Gunner2002) were performed for all 37 selected complexes for the entire complex and for each of the monomers. The structures of the monomers were kept as they were in the complex, i.e., no conformational changes during the complex formation were considered in this study. It was found that 50% of interfacial acidic groups have their pK shifted substantially, that is by more than one pH unit relative to the unbound state. The distribution of the pK shifts is presented in Fig. 2; panel (A) shows that the vast majority (about 80%) of the interfacial acidic groups have a net stabilizing contribution to the association of the complex (dark bars). However, still about 20% of the groups have a destabilizing contribution (white bars). Panel (B) of the same figure shows the distribution of the large pK shift, which peaks at 50%, whereas the distribution of small pK shift results in a broad maximum ranging from 20 to 50%. The finding that 50% of interfacial acidic groups have their pK s shifted by more than one pH unit indicates that individual charged groups, in principle, can contribute notably into the protein binding. Interestingly, the acidic groups were predicted to behave differently from histidines (note that pK shifts associated with Arginines and Lysines were not considered to be important for proton uptake/release, because the corresponding pK s are typically outside the experimental/physiological range of pH). It was demonstrated that the complex formation tends to favor acidic pK s by making them lower in the bound state compared with the unbound state. In contrast, histidine pK s tend to be lower in the complex, indicating that the bound state does not provide enough favorable interactions.
The distribution of pK changes induced by protein–protein binding. (A) all pK changes, (B) large absolute pK changes versus small absolute pK changes. The horizontal axis shows the fraction of interfacial groups satisfying the corresponding pK shift, while the vertical axis indicates in how many (out of 37) protein complexes this shift occurred. Adopted from Kundrotas et al. (Kundrotas & Alexov, Reference Kundrotas and Alexov2006).

In a separate work, Mason et al. (Mason & Jensen, Reference Mason and Jensen2008) used fast empirical methodology (PROPKA (Bas et al. Reference Bas, Rogers and Jensen2008), web-based) to compute pK values of ionizable residues in 75 protein–protein complexes and their corresponding free forms. Two main types of computations were described. In the first type, the individual (unligated) protein structures were taken directly from the structure of the complex just like in the earlier work by Kundrotas et al. (Kundrotas & Alexov, Reference Kundrotas and Alexov2006). However, the other set of computations was based on separate X-ray structures determined for the proteins in the absence of the other proteins. This second type of calculation included effects of binding-induced structural rearrangement on the pK values. With the inclusion of these effects, at least one residue per protein was found to completely change its protonation state in 28% of the complexes. In the computation of the first type (no binding-induced rearrangements), the corresponding number was 12%. In both types of calculations, protonation state change prevalence increased 2-to 3-fold if partial protonation events (probability ⩾0.5) were also counted. Change in net protonation state of the complex relative to the uncomplexed proteins, that is proton uptake/release from solution, occurred in about 30% of the cases. The distinction may be important, as protonation state changes in each of the proteins may occur, e.g., through proton transfer between the proteins, without the net proton uptake/release from the buffer solution. Over-all, changes in protonation states upon complex formation were found to be most pronounced for the formation of complexes of large and conformationally flexible proteins; in some of these complexes multiple protonation state changes were observed. In the same work (Mason & Jensen, Reference Mason and Jensen2008), protonation–conformation coupling was included as a correction to the predicted binding energy for all 75 complexes at pH7 relative to the standard protonation state, Eq. (2). With binding-induced rearrangements considered, the correction was at least 1.4 kcal/mol (corresponding to one order of magnitude change in the binding constant at room temperature of 298 K) in 45% of the complexes. Without binding-induced rearrangements, the corresponding fraction was 23% of the complexes. In both cases, some of the corrections were larger than 4.2 kcal/mol by absolute value, affecting the binding constant by more than three orders of magnitude.
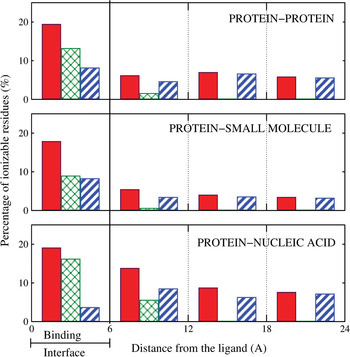
In another recent work, Aguilar et al. (Aguilar et al. Reference Aguilar, Anandakrishnan, Ruscio and Onufriev2010) examined, on an equal footing, pK and protonation state changes in protein–ligand binding for three types of complexes: protein–protein, protein–small molecule, and protein–nucleic acid. Standard continuum electrostatic pK calculations (Bashford & Karplus, Reference Bashford and Karplus1990) (H++ (Gordon et al. Reference Gordon, Myers, Folta, Shoja, Heath and Onufriev2005) web-based) were used, followed by a careful examination of the associated uncertainties–the ‘noise’ level in pK calculations of this type. The study analyzed pK changes upon ligand binding for a total of almost 6000 ionizable residues in 20 protein–protein, 20 protein–small molecule, and 20 protein–nucleic acid complexes, selected on the basis of reasonably high structure quality. For each protein–ligand complex used in the analysis, the experimentally determined X-ray structure of the corresponding unligated protein was also available. The results of the calculation, which included effects of binding-induced structural rearrangement on the pK values, are as follows. In 60% of all protein–small molecule, 90% of all protein–protein, and 85% of all protein–nucleic acid complexes, at least one ionizable residue was found to completely change its charge state upon ligand binding at neutral pH=7.0. Over-all, 9% of all ionizable residues (averaged over all complex types) presented a substantial pK change (|ΔpK|>1.0) due to ligand binding in the biologically relevant pH range from 4 to 8. However, averages do not tell the whole story in this case, as the fraction of ionizable sites with substantial pK changes upon binding differs greatly between receptor proteins (Table 3). Overall, substantial pK changes due to binding were found to occur most often in protein–nucleic acid complexes and least often in complexes of proteins with small molecules. Not surprisingly, for all ligand types the effect is the strongest in the immediate binding interface, (Fig. 3).
Distance distribution of ionizable residues with substantial pK shifts upon ligand binding in biologically relevant pH range, by the specific mechanism causing the shift. Distance is to the bound ligand. The three mechanisms, labeled a, b, and c, are described in Fig. 1. Solid red bars: all three mechanisms combined (a+b+c). Cross-hatched green bars: direct electrostatics (a+b). Striped blue bars: binding-induced structural rearrangements in the receptor(c only). The percentage reported for each region is relative to the total number of ionizable residues located in that region. Adopted from Aguilar et al. (Aguilar et al. Reference Aguilar, Anandakrishnan, Ruscio and Onufriev2010).

Percentages of ionizable residues in receptor proteins that exhibit substantial pK change (|ΔpK|>1) upon ligand binding in the biologically relevant pH range from 4 to 8. Adopted from Aguilar et al. (Aguilar et al. Reference Aguilar, Anandakrishnan, Ruscio and Onufriev2010)

Relative prevalence of various physical causes of pK shifts in ligand binding
Computationally, one can trace (Aguilar et al. Reference Aguilar, Anandakrishnan, Ruscio and Onufriev2010) the origins of the pK changes to the three electrostatic mechanisms discussed above, (Fig. 1). In the binding interface region, direct electrostatic mechanism – which includes desolvation and direct electrostatic interaction with the ligand–is predominant in effecting pK changes in protein–nucleic acid complexes, (Fig. 3). In protein–(small molecule) and protein–protein complexes, both the binding-induced structural rearrangements (‘induced-fit’) and direct electrostatic effects play equally important roles in the interface region. The effect of direct electrostatic perturbation is generally ‘short ranged’, only causing significant pK changes in residues located within ∼6 Å away from the ligand in the majority of protein–protein and protein–small molecule complexes, and weakly extending to 12 Å from the ligand in the case of binding of highly charged nucleic acids. At the same time, pK perturbations due to structural re-arrangements propagate well beyond the immediate interface region (Aguilar et al. Reference Aguilar, Anandakrishnan, Ruscio and Onufriev2010; Bas et al. Reference Bas, Rogers and Jensen2008).
Long-range coupling between ligand binding and protonation
As seen in Fig. 3, a significant number of substantial pK changes apparently occurs well outside the binding interface, sometimes as far as 24 Å away from the ligand, and even further (Aguilar et al. Reference Aguilar, Anandakrishnan, Ruscio and Onufriev2010). For protein–small molecule complexes a similar observation was also made by Bas et al. (Bas et al. Reference Bas, Rogers and Jensen2008), on roughly the same sample size. A natural question arises if these very distant changes are real, or artifacts of the methodology and inevitable structural imperfections? Note that even though the average systematic error of current ΔpK estimates is probably no larger than the threshold ((|ΔpK|>1.0) typically used to filter meaningful pK changes, there still exists a non-zero probability for any such pK change to be a statistical false positive. This is because the underlying methods are far from perfect: the pK values computed from atomic-resolution input structures are known to be sensitive to structural details (Nielsen & McCammon, Reference Nielsen and McCammon2003). Uncertainties in the input X-ray structure will be propagated into errors in the computed pKs. To estimate this type of error, Aguilar et al. analyzed the variation in computed pK values that result from structural deviations between several available X-ray structures of the same protein. In an ideal world, these differences should be zero, but in reality they are sometimes larger than 1 pK unit–events that should be counted as ‘noise’ in distributions such as that in Fig. 3. As it turns out (Aguilar et al. Reference Aguilar, Anandakrishnan, Ruscio and Onufriev2010), the ‘noise level’ in Fig. 3 is lower than the signal everywhere except for protein–small molecule complexes in the region far from the binding interface. A more detailed follow-up statistical analysis could neither confirm nor reject, for the sample size used in Aguilar et al., the possibility of statistically substantial pK changes outside the binding interface in protein–small molecule complexes.
One may also wonder if all residues with substantial pK change in regions far from the ligand belong to a small group of complexes that are ‘unique’ in some way. That is not the case (Aguilar et al. Reference Aguilar, Anandakrishnan, Ruscio and Onufriev2010): the occurrence of substantial pK changes far from the binding interface appears to be a general property of the ligand binding process. Moreover, there appears to be no single dominant type of ligand-induced structural perturbation that alters local electrostatic interactions ultimately responsible for the ‘distant’ pK changes. Those identified in Aguilar et al. were described previously in different contexts (Betts & Sternberg, Reference Betts and Sternberg1999; Dan et al. Reference Dan, Ofran and Kliger2009; Gerstein et al. Reference Gerstein, Lesk and Chothia1994), and by no means exhaust the list of possible structural perturbations associated with ligand-induced pK changes (Bas et al. Reference Bas, Rogers and Jensen2008; Maler et al. Reference Maler, Blankenship, Rance and Chazin2000).
In summary, the ‘long-range pK coupling’ effect is real in protein–protein and protein-DNA complexes, but the results are still inconclusive for protein-(small molecule) binding where the effect, if it exists, is the weakest. The long-range effect might play a role in allosteric regulation: subtle changes on one site of the receptor protein may affect ligand binding properties on another, distant site. For example, strong long-range site-site interactions were experimentally demonstrated to be important in a family of Ca2+-binding proteins (Maler et al. Reference Maler, Blankenship, Rance and Chazin2000).
Interplay among subcellular pH, pH-optimum of ligand binding, and pH of the corresponding reaction
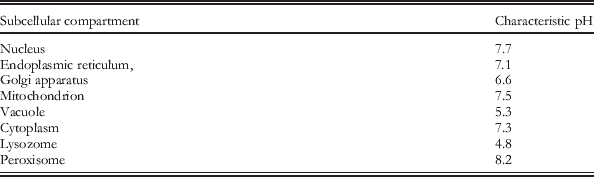
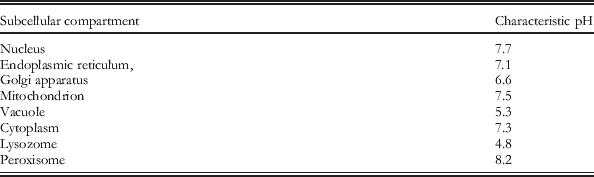
The (negative log of) concentration of hydrogen ions, typically referred to as pH, is an essential characteristics of the cell and living organisms. At the cell level, different cell compartments (organelles) have different characteristic pH as outlined in (Chan et al. Reference Chan, Lovric and Warwicker2006; Kulichikhin et al. Reference Kulichikhin, Greenway, Byrne and Colmer2009). A short sample list of characteristic subcellular pH values is shown in Table 4. In summary, at the cellular level, macromolecules and their complexes can be exposed to pH ranging from value as low as 4.8 and as high as 8.2. Similar wide range of pH can be found at the level of the entire organism, where the pH differs greatly between vital organs and systems. In some organs, the pH is maintained with high precision, while it may vary greatly within others. For example, in human, the normal blood pH is about 7.3; even a small deviation from this optimal value, by as little as fraction of pH unit, can be fatal. For example, if the blood pH drops below 7.0 (acidosis), the effect is depression of the central nervous system resulting in coma. In the opposite case, if the pH increases above 7.8 (alkalosis), the effect is overexcitability of the nervous system that results in convulsions. In contrast, in other parts of the human body, the pH can vary greatly, as for example in the digestive track where it can range from 1.5 up to 7.0 (Davenport, Reference Davenport1996). Broad range of pH, from 4.5 up to 8.0, occurs in kidney (Guyton, Reference Guyton1976). All these examples indicate that biological macromolecules and the corresponding complexes function at very different pH conditions, and depending on their function in terms of subcellular or tissue localization and trafficking, they should have evolved to either adapt to the corresponding pH or sense it. (see, e.g., review by Garcia-Moreno (Garcia-Moreno, Reference Garcia-Moreno2009)).
Subcellular compartments and their characteristic pH.
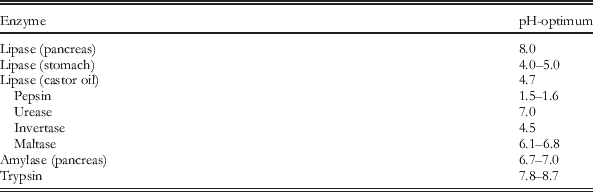
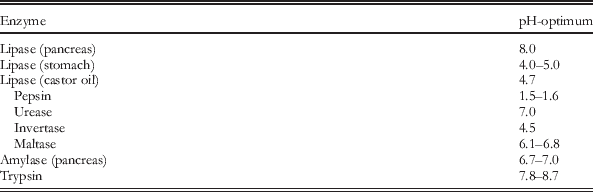
From the evolutionary standpoint, the most important factor is the optimization of biochemical reactions to provide better chances for survival and reproduction. Such evolutionary pressure does not necessary have to be linked with optimized stability of individual macromolecules and affinity of their complexes. However, indirect link may exist since in most cases the optimal biochemical reaction may invoke optimal macromolecular interactions or optimized structural integrity of individual biomolecules. When discussing the optimum pH we will follow the existing literature and term the pH of optimum of reaction, stability or binding, as the pH-optimum (Mitra et al. Reference Mitra, Zhang and Alexov2011; Talley & Alexov, Reference Talley and Alexov2010; Yan & Wu, Reference Yan and Wu2011; Yang et al. Reference Yang, Park, Kim and Yoo2008). In terms of pH-optimum of activity, the pH-optimum varies for different enzymes and biological reactions (Chang et al. Reference Chang, Scheer, Grote, Schomburg and Schomburg2009; Commet et al. Reference Commet, Boswell, Yocum and Popelka2012; Reeves Gibbs et al. Reference Reeves Gibbs, Choudhary and Bergquist2010). Several examples of various pH-optima of the corresponding reaction are shown in Table 5 to indicate the broad range of pH conditions in biology. These biochemical characteristics were conveniently collected into databases, as for example BRENDA database (Chang et al. Reference Chang, Scheer, Grote, Schomburg and Schomburg2009; Schomburg et al. Reference Schomburg, Chang, Ebeling, Gremse, Heldt, Huhn and Schomburg2004), which makes it possible to address questions about plausible correlations among pH-optimum of binding, activity, and stability in a statistical manner.
Examples of various pH-optima of enzyme activity.
Many different approaches exist to predict pH-optimum of binding, but arguably the most convenient is to use Eq. (3) introduced above. One can simply calculate the protonation states of the complex and the unbound monomers as a function of pH, and their difference will represent the net pH-dependent proton uptake/release (ΔQ) induced by the binding. Assuming that the optimum (minimum) of the binding free energy occurs at some point within the pH interval where the receptor and the ligand are stable, ∂ΔG (pH)/∂pH=0 at the pH-optimumFootnote 3. The corresponding net proton uptake/release must then equal zero at this pH according to Eq. (3). The above strategy was used in several cases to explore the idea of the similarity of biophysical properties of proteins known to bind to each other (Kundrotas & Alexov, Reference Kundrotas and Alexov2006). In order to interact, two proteins must co-occur spatially and temporally. Recently, the possibility of co-evolution of pH-optimum of protein stability and pH-optimum of protein interactions was studied and it was demonstrated that they are indeed correlated (Mitra et al. Reference Mitra, Zhang and Alexov2011). The idea was used by other researchers to match entries in two databases: the protein–protein interactions and subcellular location and substantial overlap was reported (Shin et al. Reference Shin, Wong, Davis and Ragan2009).
These observations suggest that, perhaps, native (or sometimes referred to as physiological) macromolecular interactions should not involve proton uptake/release. Indeed, if the pH – optimum of binding and the pH of the environment where the complex is formed are the same or quite similar, then as discussed above, the net charge difference between the complex and the unbound molecules should be zero at pH-optimum. This does not, however, mean that protonation states are not important for the binding or that they do not change upon it. The only quantity that does not change in physiological (native) interactions is the net charge difference between the complex and unbound monomers. Similar observation was reached in another study which modeled the conformational change observed upon ligand binding and phosphorylation for the cAMP-dependent protein kinase (Bjarnadottir & Nielsen, Reference Bjarnadottir and Nielsen2010). It was conjectured that the binding of ligands requires the smallest proton release/uptake around pH 7.0–8.0. Physiological pH for receptor–ligand binding is therefore the pH value where the energy difference between the bound and unbound states reaches its minimum, that is at the pH-optimum of binding. Moreover, a recent work implied that proton transfer between histidines across the interface of the complex changes the protonation states of the bound monomers, but results in zero net proton uptake/release, and thus no pH-independence of the binding (Wang et al. Reference Wang, Witham, Zhang, Li, Hodsdon and Alexov2012).Footnote 4 These suggestions may appear to be at odds with the conclusion from the experimental data and large-scale computational studies reviewed above. The latter indicate that net proton uptake/release due to binding is not an uncommon phenomena in protein–ligand binding, while the above discussion seem to suggest that perhaps the receptor–ligand complexes have evolved to avoid proton uptake/release. There is, however, no immediate controversy. The statement about the pH-optimum suggests that each receptor–ligand complex has evolved toward particular pH-optimum, which is related to its function and subcellular and tissue localization. However, experiments discussed above are typically either performed at neutral pH, or over a range of pH. Obviously, if the experiment is not done precisely at pH-optimum, binding-induced proton uptake/release may be observed. Similarly, the large-scale computational studies we have discussed are typically done on diverse sets of receptor–ligand complexes (presumably each having its own distinctive pH-optimum), and the protonation state changes are reported at a particular pH, e.g., pH=7. The implication is that had these studies been performed at pH-optimum for each complex, the reported prevalence of protonation states changes may have been lower.
Improving docking and scoring outcomes
One of the most recognized approaches to predict 3D structures of receptor–ligand complexes is ab-initio docking (in case of macromolecular binding) or virtual screening/scoring (in case of small molecule binding to a macromolecule). Namely, given the structures of unbound receptor and ligand, one utilizes computational methods to bring them together to predict the 3D structure of the complex. It is outside the scope of this work to review docking and screening methods, but some representative examples can be found in (Carter et al. Reference Carter, Lesk, Islam and Sternberg2005; Schneidman-Duhovny et al. Reference Schneidman-Duhovny, Inbar, Nussinov and Wolfson2005; Schueler-Furman et al. Reference Schueler-Furman, Wang and Bake2005; Spitzer & Jain, Reference Spitzer and Jain2012; Trott & Olson, Reference Trott and Olson2010). Although docking and screening simulations focus on determining the 3D structure of the complex without modeling the binding pathway, the alternative approach known as binding simulations (McCammon, Reference McCammon1998) reveals all association details including the binding constant of the 3D complex structure (Gohlke et al. Reference Gohlke, Kiel and Case2003). Further enlargement of the concept of the binding addresses the issue of modeling supramolecular assemblages (McGuffee & Elcock, Reference McGuffee and Elcock2006). All these approaches differ in their methodology, force fields, and assumptions made. However, despite the differences between the above-mentioned docking algorithms, two major problems are common: (a) how to treat conformational changes induced by the binding and (b) how to model protonation changes caused by the complex formation? Obviously, these two issues are coupled and, ideally, have to be modeled within the same numerical protocol. While the importance of conformational changes induced by the complex formation is very well recognized, and significant efforts have been invested to address it, the possibility that binding may cause protonation changes is rarely incorporated into the docking and the screening models. As discussed in the previous sections, it is quite likely that burial of an ionizable group at the binding interface of the complex can cause its protonation/deprotonation, as demonstrated both experimentally and theoretically. If this possibility is not considered, then the most probable candidate complexes causing such ionization changes are likely to be rejected by the scoring function because of unfavorable interactions. The side-chain orientations will also be incorrect, even after energy minimization, if the ionization states are not assigned according to the new environment at the interface. However, as detailed in literature (Georgescu et al. Reference Georgescu, Alexov and Gunner2002), side-chain orientation and calculations of the ionizable states should ideally be done simultaneously in the same protocol since they are interdependent. The ionized and neutral form of amino acids differ by a single proton, so from geometric perspective their side chains are almost the same and if the ionization/de-ionization does not cause significant rearrangement, the effect of protonation states on the overall shape can be neglected. However, the charge states affect the scoring function. Typically, the scoring function is derived either from statistical analysis of known receptor–ligand complexes, or it is developed based on some set of empirical rules. Many scoring functions of the first type are based on statistical potentials that depend on amino acid composition of the interfaces and pairing frequencies across the interfaces (Jones & Thornton, Reference Jones and Thornton1997; Tsai et al. Reference Tsai, Lin, Wolfson and Nussinov1997). Such scoring functions can also factor in the significant electrostatic and hydrogen-bonding complementarity observed at the interfaces of hetero complexes (McCoy et al. Reference McCoy, Epa and Colman1997). However, standard protonation states for all ionizable groups are typically assumed. Obviously, the resulting scoring function will not favor unusual protonation states, and wild-type receptor–ligand complexes involving non-standard ionization states will be scored unfavorably. Fully empirical scoring functions, on the other hand, should be able to handle cases with unusual protonation states, at least in principle. However, they too will most likely favor ionized states of titratable groups, if they do not properly account for the presence of the solvent, that if no desolvation penalty (Fig. 1) is included.
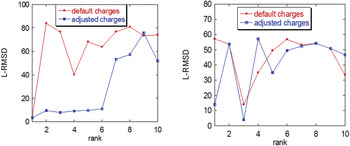
We illustrate the importance of taking into account protonation states for correct prediction of the binding mode using one of the most popular software packages for ab-initio docking, ZDOCK (Pierce et al. Reference Pierce, Hourai and Weng2007). Two cases are considered: a case of hetero- and a case homo-complex, namely PDB codes 1sji and 1xg2 (Fig. 4). For 1sji, Lys 49, Glu 117, and Glu 256 were predicted to be neutral at pH=7.0 in the complex according to pK calculations performed with MCCE package (Georgescu et al. Reference Georgescu, Alexov and Gunner2002). In the case of 1xg2, Asp B 130 was predicted to be neutral, whereas His A 137 was found to be ionized. The charges of these groups were adjusted accordinglyFootnote 5, and docking predictions are made (Fig. 4). For assessment of the predictions, we use the L-RMSD (Mendez et al. Reference Mendez, Leplae, Lensink and Wodak2005), which is the ligand RMSD as defined in the CAPRI experiment (Lensink et al. Reference Lensink, Mendez and Wodak2007).
L-RMSD of the ten best predictions obtained with ZDOCK with standard (default) protonation states and with adjusted protonation states (see text for details). Left panel: homo-complex, PDB ID 1sji. Right panel: hetero-complex, PDB ID 1gx2.

It can be seen that the charge adjustment dramatically changes the quality of the predictions for the homo-complex (1sji), with the adjusted charges (presumably the correct protonation state) resulting in better predictions compared to the default charges corresponding to the standard protonation state (Fig. 4, left panel). For the hetero-complex, the results are shown in the right panel of Fig. 4. Again, it can be seen that the adjustment of the charges, although they are only two in this case, resulted in different predictions that were slightly better than for the complex with the default charges. The above results were obtained by simply turning on/off the charges of the residues predicted to have unusual charge states in the complex. No extra protons were added or removed. Although this simplification has a negligible effect on the shape of the interface, it has a significant effect on the energy and thus on the quality of the predictions. The effect was found to be very pronounced for the homo-complex, while it was very moderate for the hereto-complex. The reason for this difference could be that more protonation states were adjusted for 1sji (three titratable groups), while only two ionizable groups were adjusted for 1gx2. In addition, the adjustments were made assuming that for both cases the physiological pH is about 7.0, and this may favor 1sji predictions over 1gx2.
Although the above example clearly illustrates the importance of correct assignment of protonation states for ab-initio docking, it does not offer a practical solution to real case scenarios where the structure of the corresponding complex is unknown. The other unknown is the relevant pH of the complex formation. As it was discussed in the previous section, some complexes are formed at low physiological pH, whereas others exist at high physiological pH. The critical question with respect to docking is this: does the ligand-binding mode (the binding site and pose of the ligand) changes as ambient pH deviates from the corresponding physiological value? In the vast majority of cases, the answer is ‘no’: pH changes are shown to affect the affinity (binding free energy) but not the binding mode (see example cases listed in Table 1). However, opposite examples do exist as well (Sakurai et al. Reference Sakurai, Oobatake and Goto2001). Thus, in cases where pH variations and, therefore, protonation states, do not affect the binding mode, the protonation states are not critical for predicting the binding mode. However, the correct assignment of protonation states will still be crucial for ranking and scoring of the candidate complexes. A wrong assignment of protonation states may cause the native ligand or the best candidate small molecule not to be ranked at the top of the list, and thus not to be predicted. Even more severe consequences of not treating the possibility of protonation state changes may be expected for calculations of the absolute binding energy. One way to deal with this problem is to allow all ionizable groups (or restricted number of groups located at the interface, assuming that the interfaces of both the receptor and the ligand have been identified first) to sample different protonation states during the docking, scoring, or energy calculations (Park et al. Reference Park, Gao and Stern2011). Of course, in this approach one should know the relevant physiological pH for the investigated complex(es). In cases for which the binding mode changes with pH, the problem is much more complicated. The receptor–ligand interface and the binding mode/pose is different at different pH, so one should define the relevant pH first, as mentioned above. It is quite unlikely that the predictions of alternative interfaces will be very successful, so one should let all ionizable (or at minimum all surface groups) to sample different protonation states during the docking, scoring, or energy calculations. This strategy may not be feasible at present, especially in virtual screening, where one has to screen millions of small molecule candidates. A simple consistency check – whether the assumed, e.g., standard, ionization state stays unchanged upon docking – may be less expensive, and still a better strategy than completely ignoring the possibility of ionization state change.
Individual case studies appear to support the importance of considering the possibility of binding-induced changes in the charge state of the receptor. It was shown both experimentally (Clackson & Wells, Reference Clackson and Wells1995; Lowman et al. Reference Lowman, Cunningham and Wells1991) and theoretically (Massova & Kollman, Reference Massova and Kollman1999) that altering the charge state of the binding interface via specific mutations can affect protein–ligand binding affinity, and can even be used to design complexes with higher affinity (Green & Tidor, Reference Green and Tidor2005; Kangas & Tidor, Reference Kangas and Tidor1999). Quantum-mechanical calculations have demonstrated that docking accuracy (Cho et al. Reference Cho, Guallar, Berne and Friesner2005) and binding affinity prediction (Donnini et al. Reference Donnini, Villa, Groenhof, Mark, Wierenga and Juffer2009) improve when the energy model accounts for the redistribution of ligand charges upon binding. In another recent study (Wittayanarakul et al. Reference Wittayanarakul, Hannongbua and Feig2008), it was shown that accurate prediction of ionization states is a prerequisite for the accurate prediction of binding affinities between HIV protease and some inhibitors. At the same time, results of ‘large-scale’ docking studies are not uniform with respect to conclusions regarding the value of accounting for protonation state changes in binding, in part because of the use of different scoring and energy function. (Krieger et al. Reference Krieger, Dunbrack, Hooft and Kriege2012; Labute, Reference Labute2009; Li et al. Reference Li, Jacobson, Zhu, Zhao and Friesner2007; Milletti et al. Reference Milletti, Storchi and Cruciani2009; Milletti & Vulpetti, Reference Milletti and Vulpetti2010; Rapp et al. Reference Rapp, Schonbrun, Jacobson, Kalyanaraman and Huang2009) On the one hand, it was shown that proper assignment of the protonation states results in better predictions, especially if the receptor is aspartyl protease (Rapp et al. Reference Rapp, Schonbrun, Jacobson, Kalyanaraman and Huang2009). This result is consistent with the above discussion, since aspartyl proteases typically function at lower pH and therefore some acidic groups are expected to have unusual protonation states. The effect of protonation states on the binding results was also studied on a set of three proteins complexed with ligands having different tautomeric forms (Todorov et al. Reference Todorov, Monthoux and Alberts2006). It was demonstrated that the majority of the protonation and tautomeric states of the individual groups within the three proteins can be recovered by the docking procedure. However, another recent study (Ten Brink & Exner, Reference Ten Brink and Exner2009) reported a similar analysis in which the protonation, tautomeric, and stereoisometric states of the ligands were varied; two popular docking programs were employed. It was found that the addition of different ligand protomers sometimes improved the docking results and sometimes did not. This type of improvement could also be receptor-dependent (Park et al. Reference Park, Gao and Stern2011). One possible explanation for the apparent case-dependence of the docking outcomes that consider protonation state changes is as follows. Perhaps the dependence has the same origin as outlined above, namely that different complexes are formed under different pH conditions. Thus, in some cases, standard protonation/tautomer states are already optimal for docking, whereas in other cases for which the binding occurs at lower or higher pH, adding alternative protonation states in the docking protocol should offer an advantage. This case dependence illustrates one intrinsic difficulty of the docking and virtual screening approaches – the fact that the true physiological pH is unknown for the candidate complexes. This is particularly important when inhibitors are designed to compete with natural substrates (Zapata-Torres et al. Reference Zapata-Torres, Fierro, Miranda-Rojas, Guajardo, Salgado, Saez-Briones and Celis-Barros2012). Recent work showed that the sensitivity of the inhibitor and substrate differs with respect to the protonation states (Zapata-Torres et al. Reference Zapata-Torres, Fierro, Miranda-Rojas, Guajardo, Salgado, Saez-Briones and Celis-Barros2012). Case-dependence of the docking outcomes may also stem from variations in the scoring functions used: highly detailed, physics-based scoring functions can be expected to be more sensitive to the proper protonation assignments than knowledge-based functions.
There is little doubt that a truly complete description of protein–ligand binding must consider the possibility of protonation state changes on the same footing with other hard-to-treat effects such conformational changes or water displacement upon binding. Various approaches have recently been developed to account for correct protonation states in ab-initio docking and virtual screening (Krieger et al. Reference Krieger, Dunbrack, Hooft and Kriege2012; Labute, Reference Labute2009; Li et al. Reference Li, Jacobson, Zhu, Zhao and Friesner2007; Milletti et al. Reference Milletti, Storchi and Cruciani2009; Milletti & Vulpetti, Reference Milletti and Vulpetti2010; Rapp et al. Reference Rapp, Schonbrun, Jacobson, Kalyanaraman and Huang2009). An undeniable advantage of methods accounting for protonation changes upon binding is that they reveal the correct physics and provide the details of the binding reaction. Still, it remains to be seen to what extend today's fast, practical virtual screening methods will benefit from careful treatment of protonation state changes. First, there is the possibility that improving just one approximation out of many that these methods must make to achieve robustness and high computational performance may reduce their accuracy, e.g., by destroying some cancelation of errors that the less detailed descriptions may benefit from. Indeed, many practical scoring functions and docking algorithms do not consider protonation states at all, but perform reasonably well (Gohlke et al. Reference Gohlke, Hendlich and Klebe2000; Wang et al. Reference Wang, Lu and Wang2003). Also, as we have seen, while protonation state changes often occur upon ligand binding, they by no means occur all of the time – neglecting this effect entirely may still be acceptable since the goal of virtual screening is often to find some good drug candidates, not all of them.
Outlook
We have presented a review of one aspect of protein–ligand binding process: changes in ionization (protonation, pK) that may occur in the protein when the complex forms. Just like many other binding-related effects, notably conformational changes, changes in the ionization state are complex, and are closely related to other phenomena, such as pH-dependence of binding affinity. Consistent account for these effects is important for both fundamental understanding of one of the most important processes in biology as well as for a very practical reason: early stages of modern drug-discovery often involve computational screening of protein–ligand complexes. Considerable progress has been made, especially recently, in characterizing and understanding binding-induced protonation state changes, as well as incorporating them into computational protocols. At the same time, significant challenges remain.
(1) Experimental characterization of pH and/or protonation state changes upon complex formation remains challenging; to the best of our knowledge, no ‘gold standard’ set of well-characterized structures is available to serve as a reference and test set for computational studies. Such a gold standard set would have included a good number of very high-resolution complexes along with the corresponding unbound proteins and their ligands. All protonation state changes would have been assigned (experimentally) to specific groups, and binding affinities measured at least at some biologically relevant pH.
(2) Experimental difficulties are also likely to hinder verification of some of the intriguing computational predictions (and their implications), such as the existence of the ‘long-range’ effect of binding on pK of distant groups.
In the computational arena, the availability of fast and reasonably accurate methods for prediction of pK and protonation states in atomistic protein structures has facilitated dramatically the inclusion of pK and protonation state changes in studies of protein–ligand complexes and their diverse biological properties. Such computational studies are no longer a prerogative of a few expert groups, but are becoming accessible to a much broader class of researchers, especially through web-based tools that have recently come on-line. This, combined with ever growing computational power, facilitates integration of protonation changes into modeling protocols. Yet, many challenges remain as well. Among them, one important class is related to correct modeling of protonation states in studies of protein–ligand binding, which in turn is important to improving docking, scoring, screening, and energy calculations. We see the following challenges in this area:
(3) Accuracy of methods for energy calculations and scoring, as compared with the magnitude of the binding free energy and the binding free energy difference among competing ligands. Frequently, the binding free energies of different ligands (including small molecules) to the same receptor differ by less than 1 kcal/mol. In order to benefit from the inclusion of protonation states into docking, scoring, screening, or energy calculation protocols, the accuracy of the computation should be better than the free energy differences between alternative ligands.
(4) Accuracy of pK predictions. Success of docking, screening, and free energy calculations that take into account protonation states of the complex, receptor, and ligand, critically depends on the accuracy of the pK predictions (although in some limited cases the necessary experimental data may be available as well). There are many existing methods to compute pK, a large set of them was recently evaluated via pKa-cooperative, an initiative to bring together researchers working in the field of pK calculations (see reviews (Alexov et al. Reference Alexov, Mehler, Baker, Baptista, Huang, Milletti, Nielsen, Farrell, Carstensen, Olsson, Shen, Warwicker, Williams and Word2011; Nielsen et al. Reference Nielsen, Gunner and Garcia-Moreno2011)). The outcome of the last pKa-cooperative meetings indicates that significant progress still needs to be made to achieve better quality pK predictions, especially for reaching accuracy of 1 pK unit for the pK calculations involving buried groups.
(5) The nature of the scoring function in docking and virtual screening. To the best of our knowledge, most docking and virtual screening scoring functions are based on calculating or estimating the interaction energy between the receptor and the ligand in the complex. In this case, the protonation states of the unbound receptor and the ligand become irrelevant for the scoring (although they may be physically very important). The only thing that matters are the correct protonation states in the complex. Docking methods that utilize some form of a free energy calculation, by taking the difference between the free energy of the complex and unbound receptor and ligand, are very few, although such an approach clearly represents the right physics. However, to the best of our knowledge, even these advanced approaches do not take into account the pH-dependent term. Typically they assume that the default pH is neutral pH, and assign the protonation states according to the pK predictions at such pH.
(6) The interplay between protonation states and the pH of complex formation. Even in case that the structures of both the bound and unbound receptor and ligand are known, and one can perform pK calculations, the relevant protonation states cannot be assigned if the pH of the corresponding biochemical reaction of the complex formation is unknown. Simply assuming that all receptor–ligand complexes are formed at neutral pH=7.0 is a great oversimplification. Perhaps the time is ripe for the computational community to add these considerations about the relevant pH when preparing the set of complexes to be instigated, or in the computational protocols that model the docking or binding free energy.
(7) Treatment of non-integer protonation states. At a particular pH of binding, the given titratable group may be partially ionized, or the net proton uptake may be spread over several titratable group resulting in partial protonation changes (non-integer number of protons). As it was outlined many times in the literature, it is not correct to simply assign partial net charges to the appropriate ionizable groups; instead, the macroscopically calculated partial charge must be properly recovered within an ensemble (Alexov, Reference Alexov2004; Park et al. Reference Park, Gao and Stern2011).
(8) A related challenge is consistent treatment of binding-induced protonation state changes on an equal footing with conformational changes. Constant pH Molecular Dynamics is a natural, theoretically well-grounded tool for the job, that also automatically takes care of the partial protonation states issue. However, available implementations are still extremely demanding computationally.
Acknowledgements
A. V. O. and E. A. acknowledge support from the NIH grant numbers (R01 GM076121 and R01 GM093937, respectively). The authors thank G. Matthias Ullmann for useful comments, Holger Gohlke for reading the draft of the manuscript and providing helpful feedback, and Boris Aguilar for help with some of the figures.