Implications
The results of the present study suggest that the mortality losses can be minimised by implementing measures to control both environmental and animal-related factors. Since the upper limit of birthweight is still not reached, there is scope for increasing the birthweight through better nutrition of dam, thereby decreasing the kid mortality. A threshold weight of the dam at kidding could be identified vis-à-vis kid mortality, providing another avenue for control of mortality. For generalisability of the model, external validation may be performed on independent datasets of Sirohi goat from other locations.
Introduction
Mortality among the pre-weaning animals is one of the major factors causing significant economic losses to the goat producers. The untimely exits restrict the number of animals available for future replacement and impact the number of animals reaching marketable age. After birth, the kids face a number of physiological, behavioural and immunological challenges affecting the survival of neonates (Dwyer et al., Reference Dwyer, Conington, Corbiere, Holmøy, Muri, Nowak, Rooke, Vipond and Gautier2016). Numerous studies focusing on the mortality in goats have concluded that generally a higher number of pre-weaning animals die than adults (Sharma et al., Reference Sharma, Nagda, Kumar and Khadda2007; Kumar et al., Reference Kumar, Sharma, Nagda and Rajawat2010), and the mortality during the weaning period may reach as high as 37% of the total mortality (Thiruvenkadan and Karunanithi, Reference Thiruvenkadan and Karunanithi2007). The previous studies have concluded that most of the deaths of goat kids during the weaning period are recorded from the first day after birth to the completion of neonatal age. Both environmental and animal-related factors influence the mortality. Past studies have concluded that birthweight, doe weight at kidding, sex, season of birth, type of birth and year of birth affect the survival of the kids (Subramaniyan et al., Reference Subramaniyan, Thanga, Subramanian and Senthilnayagam2016).
The mortality data constitute a special category of data known as time-to-event data, characterised by whether and when an event occurs during a study period. Further, mortality data are skewed and are subject to ‘censoring’, which occurs when the information about survival times of some individuals is incomplete. The most common form of censoring is ‘right censoring’, in which event of interest (e.g. mortality) for the duration of the study is not observed. The survival data can be analysed by linear and logistic regression methods. Analysis of survival by linear model ignores censoring and skewness inherent in the mortality data (Ellen et al., Reference Ellen, Ducrocq, Ducro, Veerkamp and Bijma2010). Moreover, considering mortality as a binary trait causes severe information loss, because animals dying early or late in the study period cannot be differentiated (Allison, Reference Allison1997; Sawalha et al., Reference Sawalha, Conington, Brotherstone and Villanueva2007). An earlier study has proven the superiority of survival analysis over logistic regression (Southey et al., Reference Southey, Rodriguez-Zas and Leymaster2001). Survival analysis has been used in studies of lamb survival of Scottish Blackface sheep (Sawalha et al., Reference Sawalha, Conington, Brotherstone and Villanueva2007), Lori-Bakhtiari sheep (Vatankhah and Talebi, Reference Vatankhah and Talebi2009) and Iranian Kermani sheep (Barazandeh et al., Reference Barazandeh, Moghbeli, Vatankhah and Hossein-Zadeh2012). The aim of the study was to identify factors influencing the mortality among Sirohi goat kids within the framework of survival analysis.
Materials and methods
Study population and its management
Sirohi goat is a dual-purpose (meat and milk) animal, adapted to semi-arid and arid climates. The animals were maintained at a breeding farm at ICAR-Central Sheep & Wool Research Institute, Avikanagar, located in the Rajasthan State of India. The goats were housed in sheds provided with open paddocks. Generally, the sheds had chain link fencing to facilitate adequate ventilation. The sheds were roofed over with asbestos sheet to protect the animals from the extremes of temperature and rain. The sides of the sheds were covered in winter to prevent the animals from exposure to cold weather, and as an additional measure of protection from cold, firewoods were burnt in indigenous arrangements inside the sheds during night hours. The animals were reared under the semi-intensive system of management, with about 6 to 7 h of grazing during the day and the supplementary feeding in the form of concentrate in the evening. Selective breeding was practised for improving meat and milk production. Mating was practised in two seasons, characterised as major and minor breeding seasons. The females were mated in the months of May through July in major season. Currently, minor season mating is done in the month of November, but different schedules were followed in the past. Immediately after birth, the new born kids were fed colostrum, navel cord was cut and iodine tincture was applied. Then, the neonatal kids and mothers were transferred to kidding pen, where they were kept for 3 to 4 days so that mother and kid bonded with each other. The kids born dead were classified as ‘still born’, and they were not given any identification number. Similarly, the kids dying immediately after birth were not given any identification number. Only the kids surviving for 2 to 4 h were given identification number.The kids were offered ad libitum creep ration, tree leaves and other fodders starting from about 15 to 20 days of age. The kids were weaned at the age of 90 days. The culling before weaning was generally not allowed, except in the unavoidable circumstances (ricket, tetanus, arthritis, severe stunting, etc.).
Data collection
The data were collected from year 1997 to 2017 containing information on 4428 pre-weaning kids. For each animal identity number, date of birth, sex, type of birth, season of birth, birthweight, doe weight at kidding, year of birth and date of exits were retrieved from the database maintained at the institute. The type of birth had three levels: single-born kids, twin-born kids and triplet kids. Sex had two levels: male and female. Based on the similarities of environmental and pasture conditions, the season of birth was divided into two categories: winter season from November through February and other seasons from March through October. The failure time was calculated from the difference between date of birth and date of exit. The animals that were alive at the end of weaning or culled before weaning were recorded as ‘right censored’, and time of exits of all such animals was fixed at 90 days (weaning age). The numbers of single-born, twin-born and triplet-born kids in the dataset were 3812, 605 and 11, respectively. The triplets were excluded from further analysis because their number was very small. The dataset consisted of 4417 animals after removal of triplets. There were 2157 males and 2260 females in the edited dataset. Animals born in winter season and other seasons were 1723 and 2694, respectively. The mean birthweights±SD of male and female kids were 3.4±0.6 kg and 3.1±0.5 kg, respectively. At birth, the single-born kids were heavier (3.3±0.5 kg) than twin-born kids (2.8±0.5 kg).
Statistical methods
The survival of the kids was estimated by product-limit method of Kaplan and Meier (Reference Kaplan and Meier1958):
 $$ {S_t} = \mathop \prod \limits_{{t_i} \le t} 1 - {{{d_i}} \over {{n_i}}}$$
where ti is duration of study at any point i, di is mortality up to point i and ni is number of individuals at risk just prior to ti (Kaplan and Meier, Reference Kaplan and Meier1958).
The Cox proportional hazards model was fitted as follows
 $${\it{\lambda}} \left( {t{\rm{|}}X} \right) = {{\it{\lambda}} _0}\left( t \right)\exp \left\{ {\beta X} \right\}$$
where λ(t│Z) is the hazard for the failing individual.The hazard is a function of some unspecified ‘baseline’ hazard λo(t) and a set of covariates defined by X. β denotes the vector of regression coefficients for different covariates specified in the model. The covariates act to multiply the baseline hazard in a time-independent manner (Cox, Reference Cox1972). The quantities produced by the model are referred to as ‘hazard ratios’. The time-varying coefficient was fitted by extending above basic model as follows
 $${\it{\lambda}} \left( {t{\rm{|}}Z\left( t \right)} \right) = {{\it{\lambda}} _0}\left( t \right)\,\,{\rm{exp}}\left\{ {\beta x + \gamma Xg\left( t \right)} \right\}$$
where β and γ are coefficients of time-fixed and time-varying covariates, respectively (Zhang et al., Reference Zhang, Reinikainen, Adeleke, Pieterse and Groothuis-Oudshoorn2018).
To model heterogeneity, shared frailty model was fitted as
 $${{\it{\lambda}} _{ij}}\left( t \right) = {{\it{\lambda}} _0}\left( t \right)\,\,{\rm{exp}}\left\{ {\beta {x_{ij}} + {w_i}} \right\}$$
where λij(t) is the hazard function for the j th individual belonging to i th group, λ0(t) is the baseline hazard at time t, xij is the vector of p covariates and wi is the random effect for the i th group (Nguti, Reference Nguti2003).
Data analysis
The R package ‘survival’, based on the R statistical environment (R Core Team, 2018), was used for the survival analysis (Therneau and Grambsch, Reference Therneau and Grambsch2000; Therneau, Reference Therneau2015). Mortality and censoring indicator were coded as 1 and 0, respectively (0 means lack of event including culling). The ‘ggplot2’ package (Wickham, Reference Wickham2016), ‘smoothHR’ package (Meira-Machado et al., Reference Meira-Machado, Cadarso-Suárez, Gude and Araújo2013) and base R were used for generation of the plots. The explanatory variables considered for the study were sex, type of birth, season of birth, birthweight, doe weight at kidding and year of birth. Before cox regression, the linearity assumption of birthweight and doe weight was checked, followed by test of proportionality of all the covariates. Proportional hazards assumption of the covariates was assessed by Grambsch-Therneau test and Schoenfeld residual analysis. To deal with time-dependent effect of covariates, linear effect of time was modeled. To estimate heterogeneity in the data, year of birth was modeled as log-normal frailty.
After model selection, the model was internally validated by bootstrapping. The validation of the model was assessed in terms of calibration and discrimination measures. Calibration refers to ‘whether the predicted probabilities of the event agree with the observed probabilities’ (Steyerberg et al., Reference Steyerberg, Harrell, Borsbooma, Eijkemansa, Vergouwea and Habbemaa2001), and it indicates prediction accuracy of a model (Royston and Altman, Reference Royston and Altman2013). Discrimination measures ‘the ability of a model to distinguish between individuals who die and those who survive’ (Serrano, Reference Serrano2012). It was quantified as Harrel’s C statistic (Harrell et al.,Reference Harrell, Lee and Mark1996). Model selection and validation were done by invoking appropriate functions of ‘rms’ package (Harrell, Reference Harrell2018) to perform the bootstrap analysis, specifying 5000 bootstrap samples. Model validation was performed according to Harrell’s approach (Harrell et al., Reference Harrell, Lee and Mark1996):
1. Develop the model using all n subjects and whatever stepwise testing is deemed necessary. Let D app denote the apparent D from this model,where D is any statistic.
2. Generate a sample of size n with replacement from the original sample (for both predictors and the response).
3. Fit the full or possibly stepwise model, using the same stopping rule as was used to derive D app.
4. Compute the apparent D for this model on the bootstrap sample with replacement. Call it D boot.
5. ‘Freeze’ this reduced model, and evaluate its performance on the original dataset. Let D orig denote the D.
6. The optimism in the fit from the bootstrap sample is D boot−D orig.
7. Repeat steps 2 to 6 as many times as is specified.
8. Average the optimism estimates to arrive at O.
9. The bootstrap- or optimism-corrected performance of the original stepwise model is D app−O. This difference is a nearly unbiased estimate of the expected value of the external predictive discrimination of the process which generated D app. In other words, D app−O is an honest estimate of the internal validity, penalising for over-fitting.
The optimism-corrected C was estimated from the formula Dxy = 2C−1 (Harrell et al., Reference Harrell, Lee and Mark1996), by plugging in optimism-corrected Dxy. Dxy and C are Somers’ Dxy and Harrell’s C, respectively.
The R software codes for the above statistical analyses are provided in the Supplementary Material S1.
Results
Kaplan–Meier curve
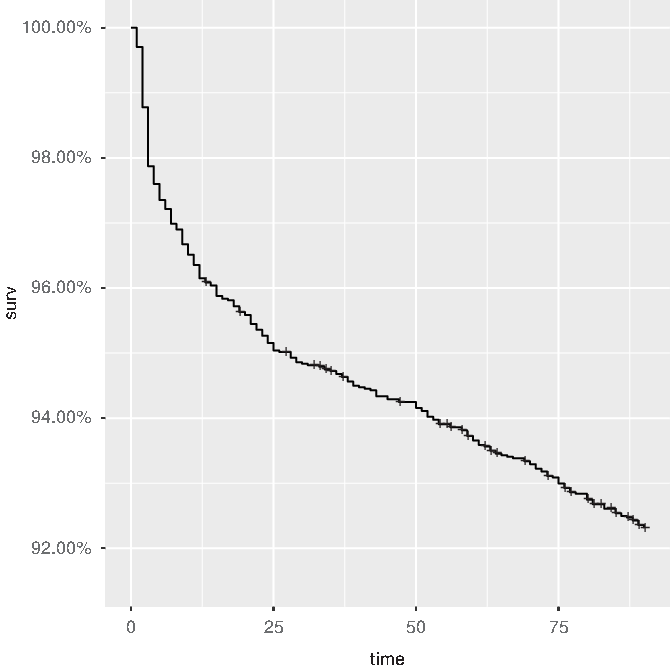
Out of 4417 animals, a total of 343 animals exited the flock through death until the end of weaning period. The majority of the observations were censored, accounting for 92.2% of the total number of observations. The incidence risk of postnatal mortality on the first day after birth was 0.3%, constituting 3.5% of all pre-weaning mortality. The mortality for the entire weaning period was 7.8%. The Kaplan–Meier curve for mortality is displayed in Figure 1. It shows a steep decline in the first few days after birth of the kids, because 37.3% of the total mortality was recorded within the first week.
Plot of Kaplan–Meier curve showing survival against time for Sirohi goat kids. The plot shows a steep decline in survival within first few days followed by gradual non-linear decline. Surv is survival probability.

Cox regression analysis
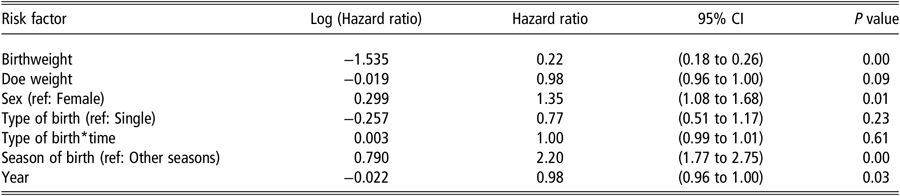
The birthweight was found to be non-linear (Supplementary Figure S1). Doe weight was also moderately non-linear (Supplementary Figure S2). Penalised spline term was included in the model for both birthweight and doe weight for correcting non-linearity. The results of the Cox regression of mortality are reported in Table 1, showing estimates of hazard ratios of the covariates along with their Confidence Intervals (CIs) and actual P-values. As a side note, the thresholds for significance levels are arbitrary (Schneider, Reference Schneider2015), and large P-value does not mean no difference and smaller P-value does not necessarily mean more significant (Kim and Bang, Reference Kim and Bang2016). Also, when n is large, the P-value is small (Kim and Bang, Reference Kim and Bang2016). Therefore, as recommended by Schneider (Reference Schneider2015), we have provided the results as point estimates of hazard ratios with their 95% CI and actual P-values. Further, we have consciously avoided the dichotomisation of results as ‘significant’ and ‘non-significant’.
Hazard ratios (with 95% lower and upper CIs) from Cox hazards model for mortality data of Sirohi goat kids

CI = confidence interval; Time = time to event; Year = year of birth of kids.
Female, Single and Other seasons in parentheses are respective reference categories for the categorical covariates, each having two levels-type of birth (Single and Twin), sex (Male and Female) and season of birth (Winter and Other seasons).
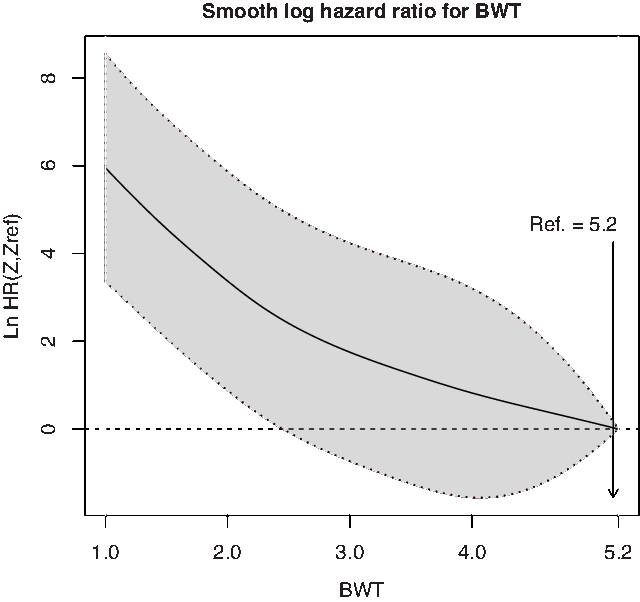
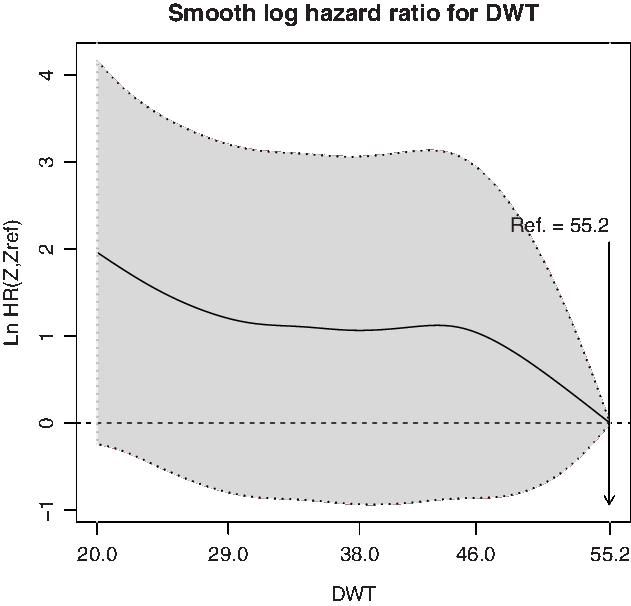
Higher birthweight was associated with decreased hazard of death: the hazard of death decreased by 0.78 after adjustment for the effects of other covariates in the model (hazard ratio: 0.22; 95% CI, 0.18 to 0.26). Plotting the log (hazard ratio) against birth weight showed a non-linear downward sloping effect, with lower birthweight associated with higher hazard and higher birthweight having protective effect (Figure 2). From the figure, it is clear that increasing birthweight decreased the hazard of death. Similarly, higher doe weight was also associated with decreased hazard of death (hazard ratio: 0.98; 95% CI, 0.96 to 1.00). Figure 3 shows that doe weights up to about 32 kg had higher hazards while doe weights higher than about 45 kg had protective effect. Male kids were associated with higher hazard of death by a factor of 0.35 (hazard ratio: 1.35; 95% CI, 1.08 to 1.68). Type of birth had time-varying effect. The Schoenfeld residual analysis and Grambsch-Therneau test (Supplementary Table S1) suggested evidence of violation of proportional hazards assumption by type of birth. From the visual inspection of the residual plot (Supplementary Figure S3(b)), we can see that the residuals for type of birth are monotonically increasing, and they are crossing the zero-slope line at around day 21. An explanation for this is that twins have better survival until around first 21 days compared with singles, and singles have better survival after day 21. We suspected that unmeasured heterogeneity was responsible for time-varying effect of type of birth. From an examination of the mortality (%) by year (Supplementary Figure S4), we see that there are some years when mortality is unusually high, particularly in the years 1998, 1999, 2003, 2004 and 2011. The survival of single- and twin-born kids was highly heterogeneous over the event time (weaning period) in these years. We found that only 11 twin-born kids died out of total 101 deaths within first 21 days of postnatal life; remaining 90 deaths were from singleton categories. Particularly for years 2003 and 2004, only 3 twin-born kids (out of 73 deaths) died within first 21 days. This explains the earlier observation of better survival of twins until around first 21 days. From the frailty models (with year of birth as the log-normal frailty term) fitted on both complete dataset and truncated dataset (dataset from which data pertaining to the years 1998, 1999, 2003, 2004 and 2011 were removed), the variance for frailty term was 0.29 in complete dataset, which was reduced to 0.09 in the truncated dataset, confirming that there was sufficient heterogeneity in the data due to these 5 years. The time-varying effect of type of birth disappeared in the truncated dataset (Supplementary Table S2 and Supplementary Figure S5(b)). Moreover, results from analysis of the truncated dataset showed that twins had higher hazard compared with singletons (hazard ratio: 1.06; 95% CI, 0.70 to 1.59). Thus, the time-varying effect of type of birth was due to heterogeneity introduced by these 5 years. Winter season had 2.20 times higher risks of death as compared with other seasons (hazard ratio: 2.20; 95% CI, 1.77 to 2.75). Finally, with each passing year, there was decrease in the risk of death by a factor of 0.2 (hazard ratio: 0.98; 95% CI, 0.96 to 1.00).
Plot of log (hazard ratio) against birthweight (BWT) of Sirohi goat kids. Birthweight has a downward sloping effect, with lower birthweight associated with higher hazard and higher birthweight having protective effect. The figure was generated using smoothHR package. 5.2 kg is the default reference chosen by the smoothHR package. HR is hazard ratio.

Plot of log (hazard ratio) against doe weight (DWT) of Sirohi goat. Doe weights up to about 32 kg have higher hazards, while doe weights higher than about 45 kg have a protective effect. The figure was generated using smoothHR package. 55.2 kg is the default reference chosen by the smoothHR package. HR is hazard ratio.

Model selection and validation
From the initial six covariates, doe weight was eliminated during resampling validation of the fitted model, and sex, type of birth, season of birth, birthweight and year were retained in the model. The same set of covariates was retained during calibration. The estimates of the optimism from bootstrapping based validation are reported in the Supplementary Table S3, and the estimates are low to very low. The optimism-corrected estimate of the C-statistic (equivalent to Area Under Curve) was 72.3%, showing a reasonably good discrimination. Though doe weight was eliminated during model selection, we have decided to keep it in the final model, keeping in mind its association with kid mortality. So, we considered the final model consisting of birthweight, doe weight, sex, type of birth, season of birth and year of birth.
Discussion
Various estimates of mortality among goat kids during pre-weaning/neonatal period have been reported in the literature. Further, varying patterns of mortality during pre-weaning/neonatal period have been reported by different authors. For example, it has been reported that up to 50% of all pre-weaning mortality among the kids occurs on the first day after birth (Dwyer et al., Reference Dwyer, Conington, Corbiere, Holmøy, Muri, Nowak, Rooke, Vipond and Gautier2016). By contrast, the kid mortality on the first day of postnatal life was low in the current study (3.5%). Almost half of the total mortality was recorded until the second week of age and mortality until neonatal age, with a figure of 64.4% of the total mortality, had a major share of the total pre-weaning mortality. Singh et al. (Reference Singh, Rai and Sharma2008) reported a higher incidence of about 69% until 2 weeks of age in Jamunapari goat kids from India. Casellas et al. (Reference Casellas, Caja, Such and Piedrafita2007) concluded that almost 50% of lambs died during first 2 weeks of life, which is in agreement with this study. Fragkou et al. (Reference Fragkou, Mavrogianni and Fthenakis2010) have suggested a stiff target of 3% neonatal lamb mortality in well-managed flock, with an upper acceptable limit of 5%. The estimate of neonatal kid mortality (5.1%) in this study was marginally above the upper limit. Recently, Gowane et al. (Reference Gowane, Swarnkar, Prince and Kumar2018) reported 4.3%, 5.2% and 4.1% mortality estimates in neonatal lambs of Avikalin, Chokla and Malpura sheep, which are the sheep breeds maintained at the same institute where this study was conducted. The estimate of neonatal mortality in this study was almost similar to those reported by Gowane et al. (Reference Gowane, Swarnkar, Prince and Kumar2018). The total mortality in the present study was higher than the average mortality rate of 4.5% reported by Kumar et al. (Reference Kumar, Sharma, Nagda and Rajawat2010) in a field flock of Sirohi goat.
The birthweight is very important determinant of kid mortality. Higher birthweight is associated with better survival. Vigour, udder-seeking and thermoregulatory ability are dysfunctional in low birth weight lambs (Dwyer et al., Reference Dwyer, Conington, Corbiere, Holmøy, Muri, Nowak, Rooke, Vipond and Gautier2016). Similar reasons could be responsible for high mortality in low birthweight kids of Sirohi goat. Bangar et al. (Reference Bangar, Pachpute and Nimase2016) have reported a better survival with higher birthweight in Deccani sheep lamb (hazard ratio: 0.53; 95% CI, 0.40 to 0.69). Subramaniyan et al. (Reference Subramaniyan, Thanga, Subramanian and Senthilnayagam2016) have also reported the association of birthweight with kid mortality. In the studies of lamb survival, it has been found that lightest and heaviest lambs had a reduced survival probability (Casellas et al., Reference Casellas, Caja, Such and Piedrafita2007; Sawalha et al., Reference Sawalha, Conington, Brotherstone and Villanueva2007), but, in this study, the lightest kids had reduced survival probability while the heaviest kids had enhanced survival probability.
Similarly to birthweight, low doe weight was associated with increased incidence of mortality. Colostrum and milk productions are suboptimal in low weight dams resulting in starvation and poor immunity of kids. Low doe weight is also associated with reduced birthweight, which is related to increased incidence of mortality. Due to undernutrition, maternal care and recognition abilities of the mother are compromised, resulting in poor bond between mother and kid (Dwyer et al., Reference Dwyer, Conington, Corbiere, Holmøy, Muri, Nowak, Rooke, Vipond and Gautier2016). Chowdhury et al. (Reference Chowdhury, Bhuiyan and Faruque2002) and Subramaniyan et al. (Reference Subramaniyan, Thanga, Subramanian and Senthilnayagam2016) have also reported a significant association of doe weight with mortality.
Being male kid was associated with poor survival. Existence of male-linked death has been reported in piglets (Baxter et al., Reference Baxter, Jarvis, Palarea-Albaladejo and Edwards2012) and human beings (Kraemer, Reference Kraemer2000). Impaired thermoregulation in male piglets is one of the factors linked to male-linked death (Baxter et al., Reference Baxter, Jarvis, Palarea-Albaladejo and Edwards2012). At birth, the behaviours like standing, udder seeking and sucking ability are compromised in male lambs and kids compared with female (Dwyer et al., Reference Dwyer, Lawrence, Bishop and Lewis2003). These may be the reasons responsible for greater hazard of death among male kids of Sirohi goat. Similar findings have been reported by other authors in sheep lambs (Southey et al., Reference Southey, Rodriguez-Zas and Leymaster2003; Sawalha et al., Reference Sawalha, Conington, Brotherstone and Villanueva2007), and they have found that male lambs were found to be at a higher risk of death than females. Bangar et al. (Reference Bangar, Pachpute and Nimase2016) have reported an almost similar estimate of hazard ratio (hazard ratio for male: 1.37; 95% CI, 1.05 to 1.80) in Deccani sheep lamb. However, Barazandeh et al. (Reference Barazandeh, Moghbeli, Vatankhah and Hossein-Zadeh2012) have reported that there is no difference between survival of male and female lambs in Iranian Kermani sheep (hazard ratio: 1.00±0.20 SE).
Though the singletons had better survival than twins in this study, we found the contrary in the initial analysis due to heterogeneity in the data. The heterogeneity may be caused due to unmeasured factors, which cannot be modeled in Cox regression. The unmeasured factors may be disease outbreaks, availability of feeds and fodders and condition of pasture. For example, the high kid mortality in the year 2011 was due to pneumonia caused by an unidentified organism. Similarly, Sawalha et al. (Reference Sawalha, Conington, Brotherstone and Villanueva2007) reported smaller hazard of singletons compared with twins during the postnatal period from 1 to 14 days. Subramaniyan et al. (Reference Subramaniyan, Thanga, Subramanian and Senthilnayagam2016) observed better survival in single-born kids of Tellicherry goat. But, Bangar et al. (Reference Bangar, Pachpute and Nimase2016) too found that twin had a lower hazard of death by a factor of 0.21 (hazard ratio: 0.79; 95% CI, 0.32 to 1.96).
Besides animal-related factors, mortality is affected by environmental factors like season of birth and year of birth. The winter season had very high hazard of death in this study, and a higher total mortality estimate was noted in the winter compared with other seasons (57.7% v. 42.3%). The neonates are sensitive to cold exposure, and a sudden drop in winter temperature causes hypothermia resulting in death. On contrary, Singh et al. (Reference Singh, Rai and Sharma2008) reported a higher mortality among kids of Jamunapari goat in the spring season. With each passing year there has been decrease in the risks of death. This could be due to overall improvement in the management in the later years.
Internal validity is a prerequisite for claiming a cause-effect relationship between two variables. In the present study, we found reasonably good estimate of internal validity concluding a good evidence of causality. But, models have the tendency to fit the dataset well on which they have been developed. It is essential to assess the performance of the models through external validation by exposing the models to new data. Thus, to generalise the results of a study, external validity is the next logical step after internal validation. If the study cannot be generalised, then causal effect obtained through internal validation has no meaning at practical levels.
Conclusion
Accurate knowledge about the factors affecting mortality of kids provides guidelines for optimising rearing practices of kids. The Cox regression model developed in this study had reasonably good discrimination ability, and the information generated from the model will definitely help in better management of goat kids. Both environmental and animal-related factors were found to affect the mortality among kids. Kids of low birthweight and male kids were found to have greater hazards of mortality. The singletons had better survival than twins. The winter season was highly unfavourable to the survival of the kids. Special care and management of the low birthweight kids can reduce the mortality losses. The kids need special attention during winter season to protect them from severity of cold weather. The association between the behaviours and mortality among Sirohi goat kids has not been explored till this date. A study is desired in this direction, which may give new insights for better control of mortality.
Acknowledgements
This research was carried out under All India Co-ordinated Research Project (on Goat Improvement). The authors deeply acknowledge with gratitude the financial help received from Indian Council of Agricultural Research for the said project. Authors are thankful for the support and guidance provided by the Director, ICAR- Central Sheep and Wool Research Institute, Avikanagar, for carrying out this research.
Indrasen Chauhan 0000-0002-7727-9252
Declaration of interest
Authors of the manuscript hereby declare that there is no conflict of interest for this research work.
Ethics statement
Approval of the research work by Institute Ethics Committee was not needed because the study did not involve any experiment on live animals.
Software and data repository resources
The dataset used in this research is part of institute data repository of ICAR-Central Sheep and Wool Research Institute, Avikanagar - 304 501, Rajasthan, India, and is not publicly available.
Supplementary material
To view supplementary material for this article, please visit https://doi.org/10.1017/S1751731119001617.