





Introduction
The 20th century has witnessed a significant increase in the revenue-raising capacity of the state (Besley and Persson Reference Besley and Persson2014; Kleven, Kreiner and Saez Reference Kleven, Kreiner and Saez2016). At present, wealthy countries typically collect about 30–45% of GDP in taxes and social contributions (UNU-WIDER 2023).Footnote 1 Their well-established tax systems allow to finance a wide range of public services and social security benefits. The extent of this transformation, however, varies significantly across the globe. For most countries, building an effective fiscal state remains a multifaceted challenge that has yet to be overcome (Besley and Persson Reference Besley and Persson2014; Okunogbe and Tourek Reference Okunogbe and Tourek2024).
This article focuses on the political dimension of this challenge by examining how an important source of political power in democracies – the legislative strength of the government – affects the global expansion of the value-added tax (VAT). The VAT was described as ‘unquestionably the most successful fiscal innovation of the last half-century’ (Bird Reference Bird, Adam, Besley, Blundell, Bond, Chote, Gammie, Johnson, Myles and Poterba2010, p. 363). As an effective, broad-based consumption tax, it made a substantial impact on the way governments finance their operations (Brockmeyer, Mascagni, Nair et al. Reference Brockmeyer, Mascagni, Nair, Waseem and Almunia2024; Ebrill, Keen and Perry Reference Ebrill, Keen and Perry2001; Keen and Lockwood Reference Keen and Lockwood2006, Reference Keen and Lockwood2010). This is especially true in developing countries, where it was widely adopted as a major fiscal tool to enhance revenue mobilisation (Bird and Gendron Reference Bird and Gendron2011; Kato and Tanaka Reference Kato and Tanaka2019). On a global average, it accounts for as much as 25% of total tax revenues, significantly higher than other major tax types such as the personal income tax and the corporate income tax (OECD 2025).Footnote 2 In short, the VAT has turned into a pivotal instrument for the modern tax state (Limberg Reference Limberg2022).
Notwithstanding the above, there is a surprising dearth of research on the role of domestic political dynamics in shaping the growth of the VAT in the comparative political economy literature. Scholars have thoroughly analysed the technical features of the VAT (Ebrill, Keen and Perry Reference Ebrill, Keen and Perry2001; Kowal and Przekota Reference Kowal and Przekota2021; Tait Reference Tait1988), the factors that lead to its adoption (Haffert and Schulz Reference Haffert and Schulz2020; Helgason Reference Helgason2017; Keen and Lockwood Reference Keen and Lockwood2010), the relationship between VAT revenues and economic growth (Cornevin, Corrales and Mojica Reference Cornevin, Corrales and Mojica2024; Erero Reference Erero2021), and the determinants of VAT rate changes (Kemmerling Reference Kemmerling2014; Lierse and Seelkopf Reference Lierse and Seelkopf2016). Yet, the political conditions that influence the evolution of this tax remain underexplored. This is puzzling since taxation, as Piketty (Reference Piketty2014: 630) puts it, ‘is preeminently a political and philosophical issue, perhaps the most important of all political issues’.
Drawing on the seminal work of Levi (Reference Levi1989) on the political determinants of taxation and the literature on political power and policymaking (Hallerberg and Basinger Reference Hallerberg and Basinger1998; Lee Reference Lee2018; Tsebelis Reference Tsebelis1995, Reference Tsebelis2002), I test the argument that governments with strong legislative support raise more revenues from the VAT as an effective tool to enhance public finances in the short term. Specifically, I posit that such governments face fewer constrains on policy innovations that affect VAT revenue collection and are more capable of withstanding the potential political pressures associated with these measures.
The empirical analysis examines this hypothesis based on data from 85 democracies between 1990 and 2020. Throughout this period, the presence of the VAT has grown significantly around the world (OECD 2020). I focus in particular on the revenue implications of the formation of a unified government – that is, a government where the executive’s party has an absolute majority in the legislature. Drawing on a new identification strategy that combines matching methods and difference-in-differences estimation (Imai, Kim and Wang Reference Imai, Kim and Wang2023), I estimate the effect of a unified government on VAT revenues by comparing treated and untreated units on identical treatment history and similar covariate values. The results provide support for this hypothesis by showing that the effect of the formation of a unified government on VAT revenues is both positive and statistically significant. This finding is robust across multiple specifications. By contrast, for the opposite case in which a divided government is established, the effect on VAT revenues is negative and in most cases statistically insignificant. In substantive terms, the main results indicate that on average, the share of VAT revenues in GDP increases up to 0.38 percentage points (pp) or 0.17 standard deviations following a change from divided to unified government. I also show that the effect of the government’s legislative power on VAT revenues is particularly pronounced for a subsample of developing countries. Furthermore, using data on standard VAT rates between 1990 and 2020, I provide suggestive evidence that the observed effect of executive-legislative cohesion on VAT revenues is mainly attributable to improvements in the efficiency of VAT revenue collection.
The contribution of this article is threefold. First, it advances our knowledge and understanding of the rise of the VAT. While previous studies have linked this phenomenon to factors such as fiscal modernisation (Kato and Toyofuku Reference Kato and Toyofuku2018), fiscal pressure (Kemmerling Reference Kemmerling2014: 158; Lierse and Seelkopf Reference Lierse and Seelkopf2016), and trade liberalisation (Bastiaens and Rudra Reference Bastiaens and Rudra2016), this article illustrates the importance of domestic political dynamics in this context. By doing so, it helps bridging the gap between the realisation that domestic politics plays an important role in determining VAT performance (Bird and Gendron Reference Bird and Gendron2011: 193) and the dearth of research exploring this topic. Second, it contributes to the extensive literature in political economy on the relationship between regime type and taxation (eg Boix Reference Boix2001; Cheibub Reference Cheibub1998; Garcia and von Haldenwang Reference Garcia and von Haldenwang2016; Profeta, Puglisi and Scabrosetti Reference Profeta, Puglisi and Scabrosetti2013). Specifically, it reveals that differences in political power can explain variation in fiscal performance within democracies. Whereas electoral pressures were identified as a constraint on the ability of developing democracies to raise revenues from the VAT (Bastiaens and Rudra Reference Bastiaens and Rudra2016), politically powerful governments are seemingly more likely to withstand these pressures. Finally, the article improves our understanding of the politics of taxation in developing countries by pointing out the role of executive-legislative cohesion in shaping the evolution of the VAT. It thus adds to recent contributions (eg López García and Berens Reference López García and Berens2025; Limberg Reference Limberg2022; Orgeira Pillai, Van Den Boogaard, Prichard Reference Orgeira Pillai, Van Den Boogaard and Prichard2024; Prichard Reference Prichard2018) that reduce the bias towards Organisation for Economic Co-operation and Development (OECD) countries in research exploring the political factors that influence taxation (von Haldenwang and von Schiller Reference von Haldenwang and von Schiller2016: 1685).
The global expansion of the VAT
At its core, the VAT is ‘a broad-based tax levied at multiple stages of production, with—crucially—taxes on inputs credited against taxes on output’ (Ebrill, Keen and Perry Reference Ebrill, Keen and Perry2001: 3). It is widely considered a highly efficient fiscal tool for public revenue generation (eg Brockmeyer, Mascagni, Nair et al. Reference Brockmeyer, Mascagni, Nair, Waseem and Almunia2024; Helgason Reference Helgason2017; Keen and Lockwood Reference Keen and Lockwood2006, Reference Keen and Lockwood2010).Footnote 3 This aspect played a major role in the widespread adoption of the VAT across developing democracies (Kato and Toyofuku Reference Kato and Toyofuku2018). As demonstrated by Pomeranz (Reference Pomeranz2015), an important advantage of the VAT lies in its ability to mitigate enforcement constraints by creating verifiable third-party information.
While its initial introduction dates back to 1954 in France (Kowal and Przekota Reference Kowal and Przekota2021: 2), the global expansion of the VAT mainly gained traction between 1990 and 2020. During this period, the number of countries that implemented this tax increased from around 50 to 170 (OECD 2020). Beyond its global presence, the VAT also turned into a major source of public revenues in nearly every country that adopted it. At present, it accounts for about 20–35% of total tax revenues in most democracies. Figure 1 illustrates this pattern by displaying the relationship between the share of VAT revenues in total tax revenues and the overall revenues from this tax, expressed as a share of GDP, in 2020.Footnote 4 As the figure shows, the relative importance of the VAT is particularly noticeable in developing democracies, where it often serves as the principal revenue source (Bird and Gendron Reference Bird and Gendron2011; Kato and Tanaka Reference Kato and Tanaka2019).
The importance of the VAT.
Note: Data for 2020. Author’s calculations based on OECD (2025) and UNU-WIDER (2023). Advanced (developing and emerging) economies are shown in red (blue) based on IMF (2023) categorisation.

Figure 1. Long description
A scatter plot representing the relationship between VAT revenues as a percent of GDP and the share of VAT revenues in total tax revenues for various countries. The horizontal axis represents the share of VAT revenues in total tax revenues, ranging from 10 to 40 percent. The vertical axis represents VAT revenues as a percent of GDP, ranging from 2.5 to 12.5 percent. The data points are labeled with country codes. The plot shows a variety of countries with different VAT revenue shares and VAT revenues as a percent of GDP. Some countries, such as Croatia, Poland, and Brazil, have higher VAT revenues as a percent of GDP and a moderate share of VAT revenues in total tax revenues. Other countries, like Australia and Ireland, have lower VAT revenues as a percent of GDP and a lower share of VAT revenues in total tax revenues. The main trend is that developing and emerging economies tend to have higher levels of VAT revenues as a share of total tax revenues compared to advanced economies.
Previous research has offered various explanations for the rise of the VAT. Kato and Toyofuku (Reference Kato and Toyofuku2018) attributed the expansion of this tax in developing countries to a process of fiscal modernisation. Specifically, they argued that the timing in which the VAT was innovated helps explain why ‘third-wave’ democracies (Huntington Reference Huntington1991) embraced it as their main revenue instrument rather than turning to progressive income taxation. Haffert and Schulz (Reference Haffert and Schulz2020) argued that the adoption of the VAT in the European Union was driven by the willingness to promote market integration. Several studies pointed out that increases in the VAT rate aimed at mitigating fiscal pressures in OECD countries (Kemmerling Reference Kemmerling2014: 158; Lierse and Seelkopf Reference Lierse and Seelkopf2016). Limberg (Reference Limberg2022) identified that political regime matters in this context by showing that globally, the effect of fiscal pressure on the VAT standard rate is positive in democracies but absent in autocracies. Finally, scholars have stressed the role of the International Monetary Fund (IMF) in promoting the introduction (Bird and Gendron Reference Bird and Gendron2011: 19–20; Keen and Lockwood Reference Keen and Lockwood2010) and growth (Crivelli and Gupta Reference Crivelli and Gupta2016) of the VAT in developing countries. In this context, the adoption of the VAT typically took place as part of a broader trade liberalisation process (Bastiaens and Rudra Reference Bastiaens and Rudra2016).
Surprisingly, however, the potential influence of domestic political factors in shaping the global expansion of the VAT has received little attention in the comparative political economy literature.Footnote 5 This is especially striking compared to the much larger volume of research examining the political foundations of income taxation (eg Ardanaz and Scartascini Reference Ardanaz and Scartascini2013; Ballard-Rosa, Martin and Scheve Reference Ballard-Rosa, Martin and Scheve2017; Ganghof Reference Ganghof2024; Scheve and Stasavage Reference Scheve and Stasavage2023) There are, nonetheless, several exceptions. Helgason (Reference Helgason2017) showed the effects of corporatism and proportional representation (PR) on early adoption of the VAT in the OECD. Aizenman and Jinjarak (Reference Aizenman and Jinjarak2008) found that greater political stability and more regulated political participation contribute to greater VAT efficiency. Researchers have also investigated the nature of the relationship between consumption taxation and the size of the welfare state (Beramendi and Rueda Reference Beramendi and Rueda2007; Ganghof Reference Ganghof2006; Kato Reference Kato2003). By contrast, the impact of executive-legislative power dynamics on the evolution of the VAT has not been thoroughly analysed. This perspective is necessary because changes in the legislative power of the government can facilitate or impede the state’s revenue-raising efforts and thereby influence the trajectory of VAT revenues.
Political power and changes in VAT revenues
An extensive body of research in political economy examines the relationship between regime type and taxation (see, eg Boix Reference Boix2001; Cheibub Reference Cheibub1998; Garcia and von Haldenwang Reference Garcia and von Haldenwang2016; Gould and Baker Reference Gould and Baker2002; Profeta, Puglisi and Scabrosetti Reference Profeta, Puglisi and Scabrosetti2013). A common argument among scholars who highlight the potential advantage of non-democracies in this context is that the concentration of power in the hands of autocratic leaders facilitates revenue extraction (Bastiaens and Rudra Reference Bastiaens and Rudra2016; Fauvelle-Aymar Reference Fauvelle-Aymar1999; Olson Reference Olson1993). While the sources of power are fundamentally different between democracies and autocracies, this approach typically overlooks the possibility that political strength also matters in democratic settings. In essence, democratic governments vary significantly in their ability to influence the ‘rules of the game’ (North Reference North1990: 3) that underlie tax collection.
According to the seminal work of Levi (Reference Levi1989: 2), rulers – including, among others, presidents and prime ministers – ‘maximize the revenue accruing to the state subject to the constraints of their relative bargaining power, transaction costs, and discount rates’. Although governments differ in terms of their revenue-raising aspirations, this framework provides a useful analytical tool for assessing the political driving forces of taxation. On the one hand, governments have strong incentives to improve tax collection. Effective revenue mobilisation reduces their reliance on external finance and increases their capacity to influence social and economic outcomes. In addition, revenue-raising efforts are often linked to broader macroeconomic objectives such as maintaining a sustainable fiscal balance. On the other hand, governments have limited administrative and monitoring resources, and their relative bargaining power defines the set of policies that are politically feasible. Miscalculating the magnitude of these constraints can be costly. Rather than gaining more power, the government may strengthen the opposition and undermine its own legitimacy. Thus, revenue-raising efforts constitute both a potential source of power and a significant risk of instability for the incumbent executive (Fauvelle-Aymar Reference Fauvelle-Aymar1999: 391).
In democracies, a key determinant of the bargaining power of the executive is its legislative power. Political leaders backed by strong legislative support have greater latitude in pursuing their policy objectives (Lee Reference Lee2018). With fewer veto players, they are more capable of implementing policies that depart from the status quo (Tsebelis Reference Tsebelis1995, Reference Tsebelis2002). Thus, they can more easily introduce extensive tax reforms (Hallerberg and Basinger Reference Hallerberg and Basinger1998). A widespread political support can also facilitate the enforcement of already established tax laws, especially in developing regions (Grandcolas Reference Grandcolas and Krever2008: 120). By contrast, political leaders with limited legislative power rely on successful negotiations with other coalition members or opposition parties and therefore are likely to face greater obstacles to policy change. This distinction is particularly important in fiscal matters considering the short ‘window of opportunity’ during which newly elected governments tend to implement tax reforms (David and Sever Reference David and Sever2024).
The VAT has several important advantages that make it attractive for democratic governments that aim to improve revenue mobilisation (Limberg Reference Limberg2022). Most prominently, it can effectively generate a significant amount of public revenues in the short term, making it an appealing source of finance for governments that seek to deliver tangible improvements to citizens or improve the macroeconomic conditions. From an administrative perspective, the VAT has an intrinsic self-enforcement mechanism (Pomeranz Reference Pomeranz2015) and, especially in developing countries, is easier to collect at large scale compared to the personal income tax as a major alternative. From an economic perspective, it can minimise distortions of production decisions (Ebrill, Keen and Perry Reference Ebrill, Keen and Perry2001). At the same time, attempts to increase revenues from the VAT as a broad-based consumption tax may come with significant political costs such as increasing pressures from the electorate (Bastiaens and Rudra Reference Bastiaens and Rudra2016; Martin and Gabay Reference Martin and Gabay2018) and opposition parties. The political backlash triggered by VAT reforms in different settings illustrates the potential risk for incumbents from such measures (Bastiaens and Seelkopf Reference Bastiaens and Seelkopf2024). However, governments are more likely to withstand these pressures without making substantial policy concessions when they have more bargaining power. In short, governments with strong legislative support not only face fewer formal impediments to VAT reforms but also have greater political capital to implement potentially unpopular measures.
More specifically, I focus on two mechanisms that might explain the influence of executive-legislative power dynamics on the evolution of VAT revenues. The first is the increase of the statutory VAT rate. In line with the veto player theory (Tsebelis Reference Tsebelis1995, Reference Tsebelis2002), the likelihood of this policy change increases under dominant single-party majority governments compared to coalition governments. The case of VAT policy in South African in the last decade provides a telling example. In 2018, the African National Congress (ANC) government backed by a parliamentary majority raised the standard rate for the first time in 25 years in order to boost tax revenue collection (Crabtree Reference Crabtree2018; Roos, Horridge, Van Heerden et al. Reference Roos, Horridge, van Heerden, Adams, Bohlmann, Kobe and Vumbukani-Lepolesa2020). By contrast, shortly after the 2024 general election, the new ANC-led coalition government had to withdraw its plans to increase the VAT rate due to a strong political backlash from within the government (Rose Reference Rose2025). In Spain, a single-party majority government increased the standard VAT rate from 18% to 21% in 2012 (Salmon Reference Salmon2017: 249) following a convincing electoral victory. Three years later, the share of VAT revenues in GDP rose by about one-fifth (OECD 2025).
The second channel through which governments can increase VAT revenues is by improving the efficiency of VAT collection. In principle, governments that enjoy strong legislative backing can more easily implement measures that increase the ‘C-efficiency’ – the ratio between the actual VAT revenues and the potential VAT revenues (Keen Reference Keen2013; Ueda Reference Ueda2017). These measures include, for instance, the reduction of VAT rate differentials, the introduction of stricter enforcement procedures, and the expansion of the tax base through the elimination of exemptions. Taken together, this channel offers significant scope for increasing tax revenues. In fact, as shown by Keen (Reference Keen2013), the level of the C-efficiency, rather than the standard VAT rates or overall consumption, was the primary factor behind changes in VAT revenues between 1993 and 2010. Various indications suggest that political power matters in this context. Most fundamentally, these measures often put an end to the favourable treatment given to specific products. As such, they are expected to generate political backlash, which governments with more bargaining power are more likely to withstand. In Uruguay, for instance, the formation of a unified government led by Frente Amplio (Broad Front) following the 2004 general election paved the way for a comprehensive tax reform (Lanzaro Reference Lanzaro, Levitsky and Roberts2011: 358–361). Among others, alongside the reduction of the statutory rate, this reform led to the broadening of the VAT tax base by eliminating exemptions on multiple goods and services (Martorano Reference Martorano2014: 703; World Bank 2008: 3). The Slovak government, backed by an absolute majority in the parliament, began implementing from October 2012 an extensive strategy to significantly reduce VAT evasion (Remeta, Perret, Jares et al. Reference Remeta, Perret, Jares and Brys2015). In the following years, the magnitude of evasion declined (Rabatinová Reference Rabatinová2018) and the share of VAT revenues in GDP rose from 5.9% to 6.7% between 2012 and 2016 (OECD 2025) without any change to the standard rate.
In sum, the above discussion suggests that democratic governments with strong legislative backing are expected to raise more revenues from the VAT.
Data and empirical approach
To test the argument that political power influences the evolution of VAT revenues, I construct an unbalanced panel data set for 85 democracies between 1990 and 2020 – the most significant period in the global expansion of the VAT. The sample is confined to countries with a VAT that were democracies for more than five years during this period according to the Boix-Miller-Rosato Dichotomous Coding of Democracy (Boix, Miller and Rosato Reference Boix, Miller and Rosato2013; Miller, Boix and Rosato Reference Miller, Boix and Rosato2022). Countries are coded as democracies or non-democracies in a given year based on the criteria of contestation and participation (Boix, Miller and Rosato Reference Boix, Miller and Rosato2013). In line with related studies (Kim Reference Kim2014; Sirén Reference Sirén2021), non-democratic country-years are excluded from the analysis. I also exclude all countries in which more than half of the observations have missing values in any of the main variables – namely, the dependent variable, the independent variable, and the covariates used in the baseline analysis. The subsections below elaborate on the selection of the main variables and the empirical strategy.
VAT revenues
The main dependent variable is the share of VAT revenues in GDP. It is retrieved from two sources. The primary source is the OECD Global Revenue Statistics Database (GRSD) (OECD 2025), which includes aggregated and disaggregated data on tax revenues from 1990 onwards. Additionally, I include data on VAT revenues from UNU-WIDER (2023) for five countries that are not covered by the GRSD and match the conditions described above.Footnote 6 Prior to the implementation of the VAT in a country, the values are shown as either 0 or missing in these data sets. To ensure consistency, I recode all observations with the value 0 as missing.Footnote 7 I run the analysis separately for each data set and without the recoding procedure in the robustness checks.
The selection of VAT revenues rather than the statutory VAT rate as the main dependent variable is consistent with the theoretical focus on the way political power shapes the revenue-raising capacity of the state.Footnote 8 More specifically, a revenue measure incorporates the multiple channels through which the government can boost public finances through the VAT system. For instance, in addition to changing the standard tax rate, governments can increase revenues by broadening the tax base, by lowering the registration threshold, by unifying VAT rates, by applying stricter enforcement measures, and by introducing technological improvements. A further drawback of analysing changes in VAT rates is that some countries face policy constraints due to regional agreements.Footnote 9 Therefore, the connection between rate changes and revenue changes is not necessarily straightforward, especially when exemptions are widespread (Cnossen Reference Cnossen2015). In fact, as the Georgian tax reform illustrates, significant increases of VAT revenues can follow the reduction of the statutory rate when the latter is accompanied by base-broadening measures as well as improved compliance and enforcement (Akitoby Reference Akitoby2018; OECD 2025).
Due to higher levels of tax evasion, the linkage between VAT rates and revenues is weaker in developing countries, which account for the majority of the sample. In Latin America, for instance, VAT evasion reaches as much as 2.3% of GDP, which is equivalent to 27.6% of potential revenues (Rasteletti and Saravia Reference Rasteletti and Saravia2024). In Tanzania, the VAT revenue loss among small- and medium-sized enterprises was recently estimated at 62% (Ebrahim, Castillo, Leyaro et al. Reference Ebrahim, Castillo, Leyaro, Swema and Haule2024).
Political strength
The main independent variable is allhouse, which comes from the Database of Political Institutions (DPI) (Cruz, Keefer and Scartascini Reference Cruz, Keefer and Scartascini2021). This variable equals 1 when the government is unified – that is, the party of the executive has an absolute majority in the legislature – and 0 otherwise. It has been used in different studies examining the role of the government’s legislative strength (eg Alesina, Ardagna and Trebbi Reference Alesina, Ardagna and Trebbi2006; Finke Reference Finke2023; Garofalo Reference Garofalo2020). When the government is non-unified, it is typically referred to as ‘divided’ (see, eg Leblang and Satyanath Reference Leblang and Satyanath2006). In accordance with the DPI coding (Cruz, Keefer and Scartascini Reference Cruz, Keefer and Scartascini2021), changes in the government’s status during year t are reflected in the data set in year t + 1. Table A1 in the online Appendix presents summary statistics.
To estimate the effect of the government’s legislative power on VAT revenues, I examine the specific instances in which unified governments are formed. Specifically, treated units are country-year observations that represent a change from divided to unified government for which pre-treatment and post-treatment data are available and counterfactual estimates can be constructed, as elaborated below. I also examine the opposite case where the status of the government changes from unified to divided. In total, the main analysis includes 31 observations that represent a change from divided to unified government (see Table A2 in the Appendix) and additional 31 observations that indicate a shift from unified to divided government (Table A3).
Empirical strategy
From a methodological standpoint, the main challenge in assessing the impact of the government’s legislative power on VAT revenues is to isolate the effect of the former from potential confounders. A common practice in the literature is the two-way fixed effects (TWFE) model, which controls for time-invariant differences between countries and time-varying factors that affect all countries. Yet, when treatment effects are heterogenous (Liu, Wang and Xu Reference Liu, Wang and Xu2024) and when units switch between the treatment and control groups (Imai and Kim Reference Imai and Kim2021), the standard TWFE approach may produce biased estimates. Moreover, the TWFE framework may be sensitive to model misspecification (Imai, Kim and Wang Reference Imai, Kim and Wang2023) and lacks systematic instruments to evaluate covariate balance.
To address these concerns, I apply a new methodological approach developed by Imai, Kim and Wang (Reference Imai, Kim and Wang2023) that combines matching methods and difference-in-differences estimation (henceforth PanelMatch). This identification strategy allows to estimate the dynamic effect of a binary treatment – in this case the formation of unified and divided governments – on VAT revenues during a predefined number of years (denoted as F) while providing greater transparency about the counterfactual of interest and the balance between the covariates. Moreover, this framework allows for treatment reversals, meaning that the status of the government within a country can switch multiple times between unified and divided.
The implementation of the PanelMatch framework consists of three stages (Imai, Kim and Wang Reference Imai, Kim and Wang2023). First, each treated observation is paired with a ‘matched set’ – a group of control observations that share the same treatment history over a predefined period denoted as L (Imai, Kim and Wang Reference Imai, Kim and Wang2023: 588, 594). Footnote 10 In the context of this analysis, the main treatment is a change from divided to unified government in a specific country in year t while the corresponding ‘matched set’ consists of countries that had the same government status in the L years before the treatment but did not switch to a unified government in year t. Second, matching or weighting procedures are applied to improve covariate balance between the treatment and control groups, thereby reinforcing the parallel trends assumption. Third, the difference-in-differences estimator is applied for each treated observation. It is calculated as the difference between the change in the share of VAT revenues in GDP before-and-after the treatment and the change in the share of VAT revenues in GDP in the corresponding ‘matched set’ during the same time. The main quantity of interest – the average treatment effect on treated units (ATT) – is ultimately calculated as the average of the individual difference-in-differences estimates.
In the main analysis, the treatment and control groups are matched on identical treatment history in the three years before the treatment to reinforce the validity of the estimates (L = 3).Footnote 11 The results are shown up to three years after the treatment to capture both short- and medium-term effects (F = 3). The standard errors are calculated based on the block bootstrap procedure, which takes within-country time dependence into account (Imai, Kim and Wang Reference Imai, Kim and Wang2023: 598). Figure 2 visualises the distribution of the treatment. It demonstrates that the treatment varies across countries and over time, thereby lending credence to the validity of the estimates drawn from the PanelMatch method (Imai, Kim and Wang Reference Imai, Kim and Wang2023: 591–592). The matching and weighting procedures are based on the lagged values of the following covariates in the three years before the treatment. First, I include the lagged VAT revenues as the dependent variable. Second, I add a binary variable for the existence of left-wing chief executives from Herre (Reference Herre2023). Third, I account for the level of trade openness by including a measure of de facto trade globalisation from the KOF index (Dreher Reference Dreher2006a; Gygli, Haelg, Potrafke et al. Reference Gygli, Haelg, Potrafke and Sturm2019). Finally, log GDP per capita in constant 2015 US$, the rate of economic growth, log population size, and the value-added of agriculture, forestry, and fishing as a share of GDP are retrieved from the World Bank (2023) to account for economic and demographic factors. Observations with missing data in any of the main variables are omitted from the analysis.Footnote 12 The matching procedure in the main analysis is based on Mahalanobis distance with diagonal variance matrix and each matched set consists of up to five control units. A variety of alternative specifications are considered in the robustness checks.
Treatment distribution by country and year.
Note: White-coloured cells represent missing observations (either due to missing data or the existence of a non-democratic government in that year).

I also use the placebo test procedure of the PanelMatch package (I. S. Kim, Rauh, Wang et al. Reference Kim, Rauh, Wang and Imai2025) to assess whether the treatment and control groups follow a similar trend before the treatment. Specifically, the placebo test calculates the changes in the outcome at t = - 1 compared to earlier periods before the treatment. Accordingly, the estimate for the year before the treatment (t - 1) is shown as 0.
Examination of the mechanisms
To provide insight into potential mechanisms, I also examine the specific channels through which political power might influence VAT revenues. For this purpose, I collect data on standard VAT rates between 1990 and 2020. The rates for the years 2006–2020 are primarily retrieved from KPMG Tax Rates Online (KPMG 2025). As detailed in the Appendix, I draw on multiple sources to fill in missing values for this time period and for VAT rates between 1990 and 2005.Footnote 13 In line with theoretical expectations, I focus on two potential channels: increases of the standard VAT rate and improvements in the efficiency of VAT revenue collection. I operationalise the latter using the C-efficiency, which is defined as follows (Ueda Reference Ueda2017; see also Keen Reference Keen2013):
 ${E^C} = {V \over {{T^S}\left( {FC - V} \right)}}$
This variable measures the ratio between the actual VAT revenues, V, and the potential VAT revenues that are calculated as the product of the standard VAT rate, T S, and the final consumption, FC, exclusive of the actual VAT revenues. Hence, higher values indicate higher efficiency levels. The final consumption information is sourced from World Bank (2025) data on final consumption expenditure as a share of GDP.Footnote 14
Results
Main findings
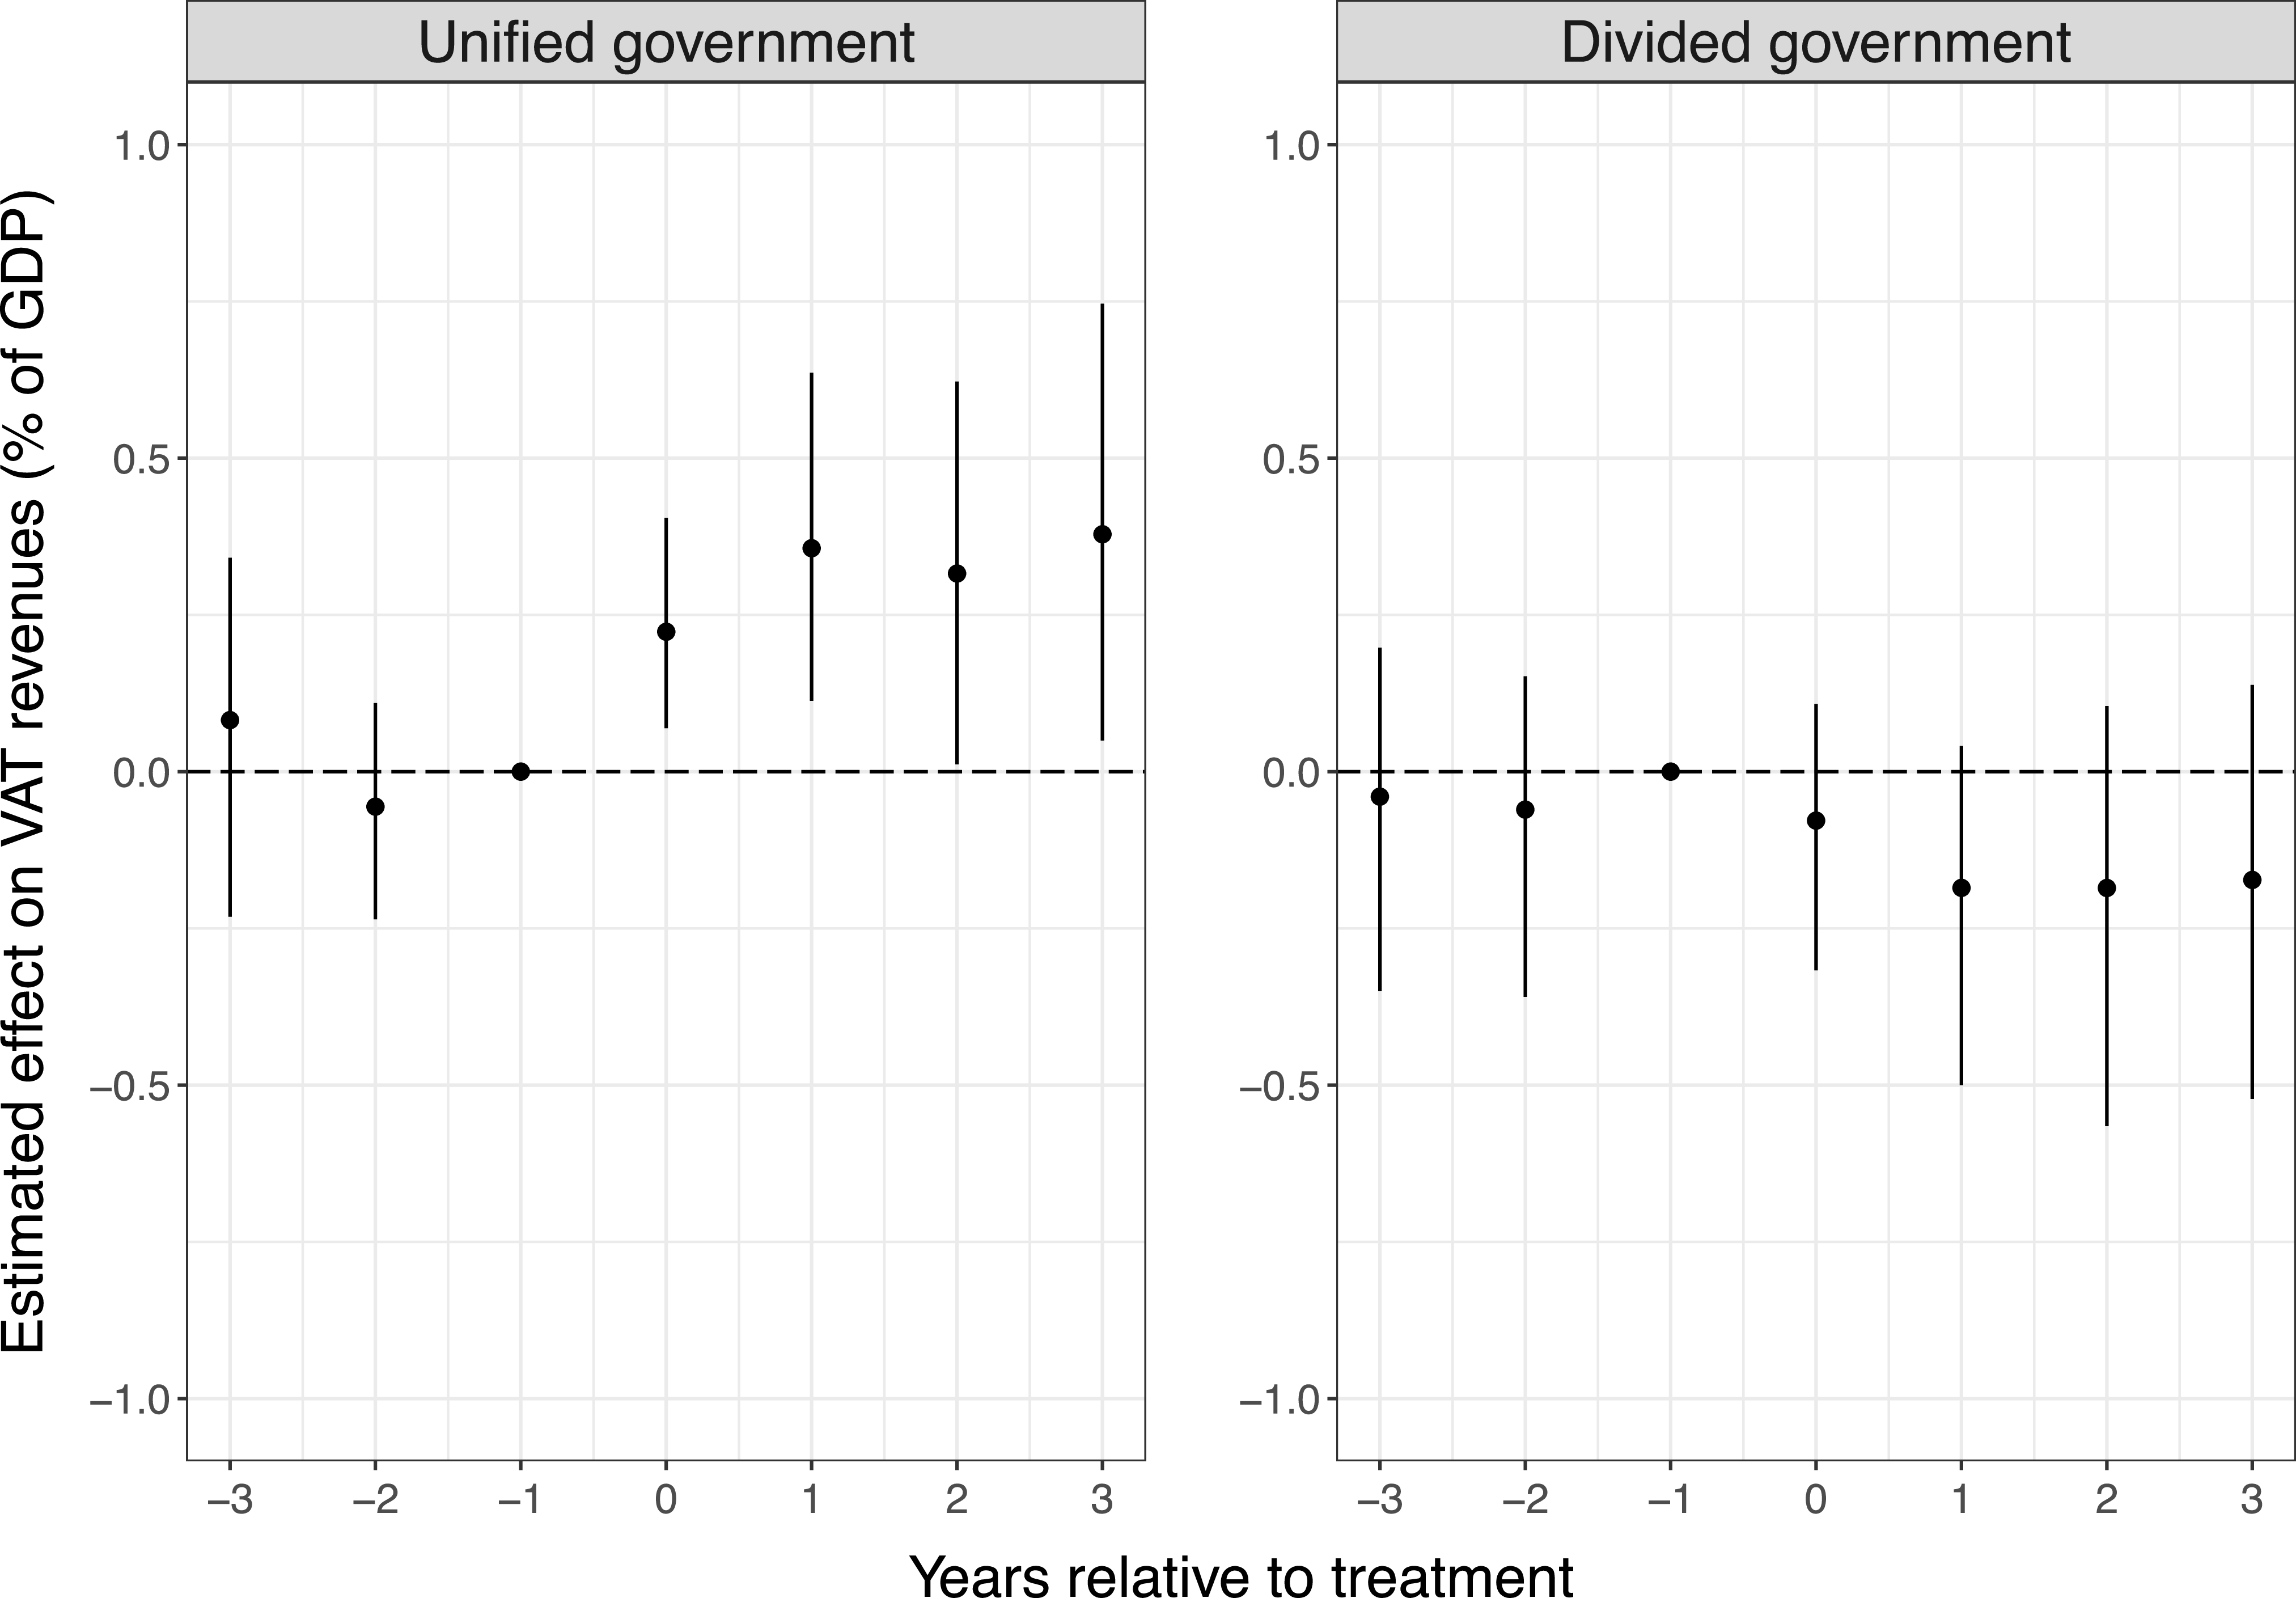
Figure 3 displays the results of the effects of unified and divided governments on VAT revenues. The findings indicate that the impact of a unified government is positive and statistically significant. In particular, the average effect on VAT revenues as a share of GDP reaches 0.38 pp at t + 3, which corresponds to the fourth calendar year after the change from divided to unified government. This represents an increase of 6.2% in VAT revenues relative to the sample’s mean or 0.17 standard deviations. By contrast, the establishment of a divided government has a negative effect on VAT revenues which is statistically indistinguishable from zero at the 5% significance level. In both cases, there is no evidence of a pre-treatment trend as shown by the estimates drawn from the placebo tests. Furthermore, Figure A1 in the Appendix shows using standardised mean differences that covariate balance is significantly improved by the implementation of the matching procedure, thus further reinforcing the parallel trends assumption.Footnote 15 In sum, these findings indicate the role of executive-legislative cohesion in determining the evolution of VAT revenues.
Estimated average effects of unified and divided governments on VAT revenues.
Note: The analysis is based on 31 treated units and corresponding matched sets for each government type. The lines represent 95% confidence intervals based on 1000 bootstrap iterations.

Given that changes in the government’s legislative status often result from elections, I examine whether the observed effect can be explained by a general political honeymoon effect after elections. While the differences between unified and divided governments already provide evidence against this possibility, I address this concern more explicitly by estimating the effect of main elections – that is, executive elections for presidential systems and legislative elections for parliamentary systems and assembly-elected presidential systems (Kyriacou, Okabe and Roca-Sagalés Reference Kyriacou, Okabe and Roca-Sagalés2022). The data come from Cruz, Keefer and Scartascini (Reference Cruz, Keefer and Scartascini2021). I also look into the specific case of government turnovers based on data from the Lexical Index of Electoral Democracy (Skaaning Reference Skaaning2021).Footnote 16 As displayed in Figure A2 in the Appendix, there is no evidence of a positive effect of elections on VAT revenues in both cases.
Robustness checks
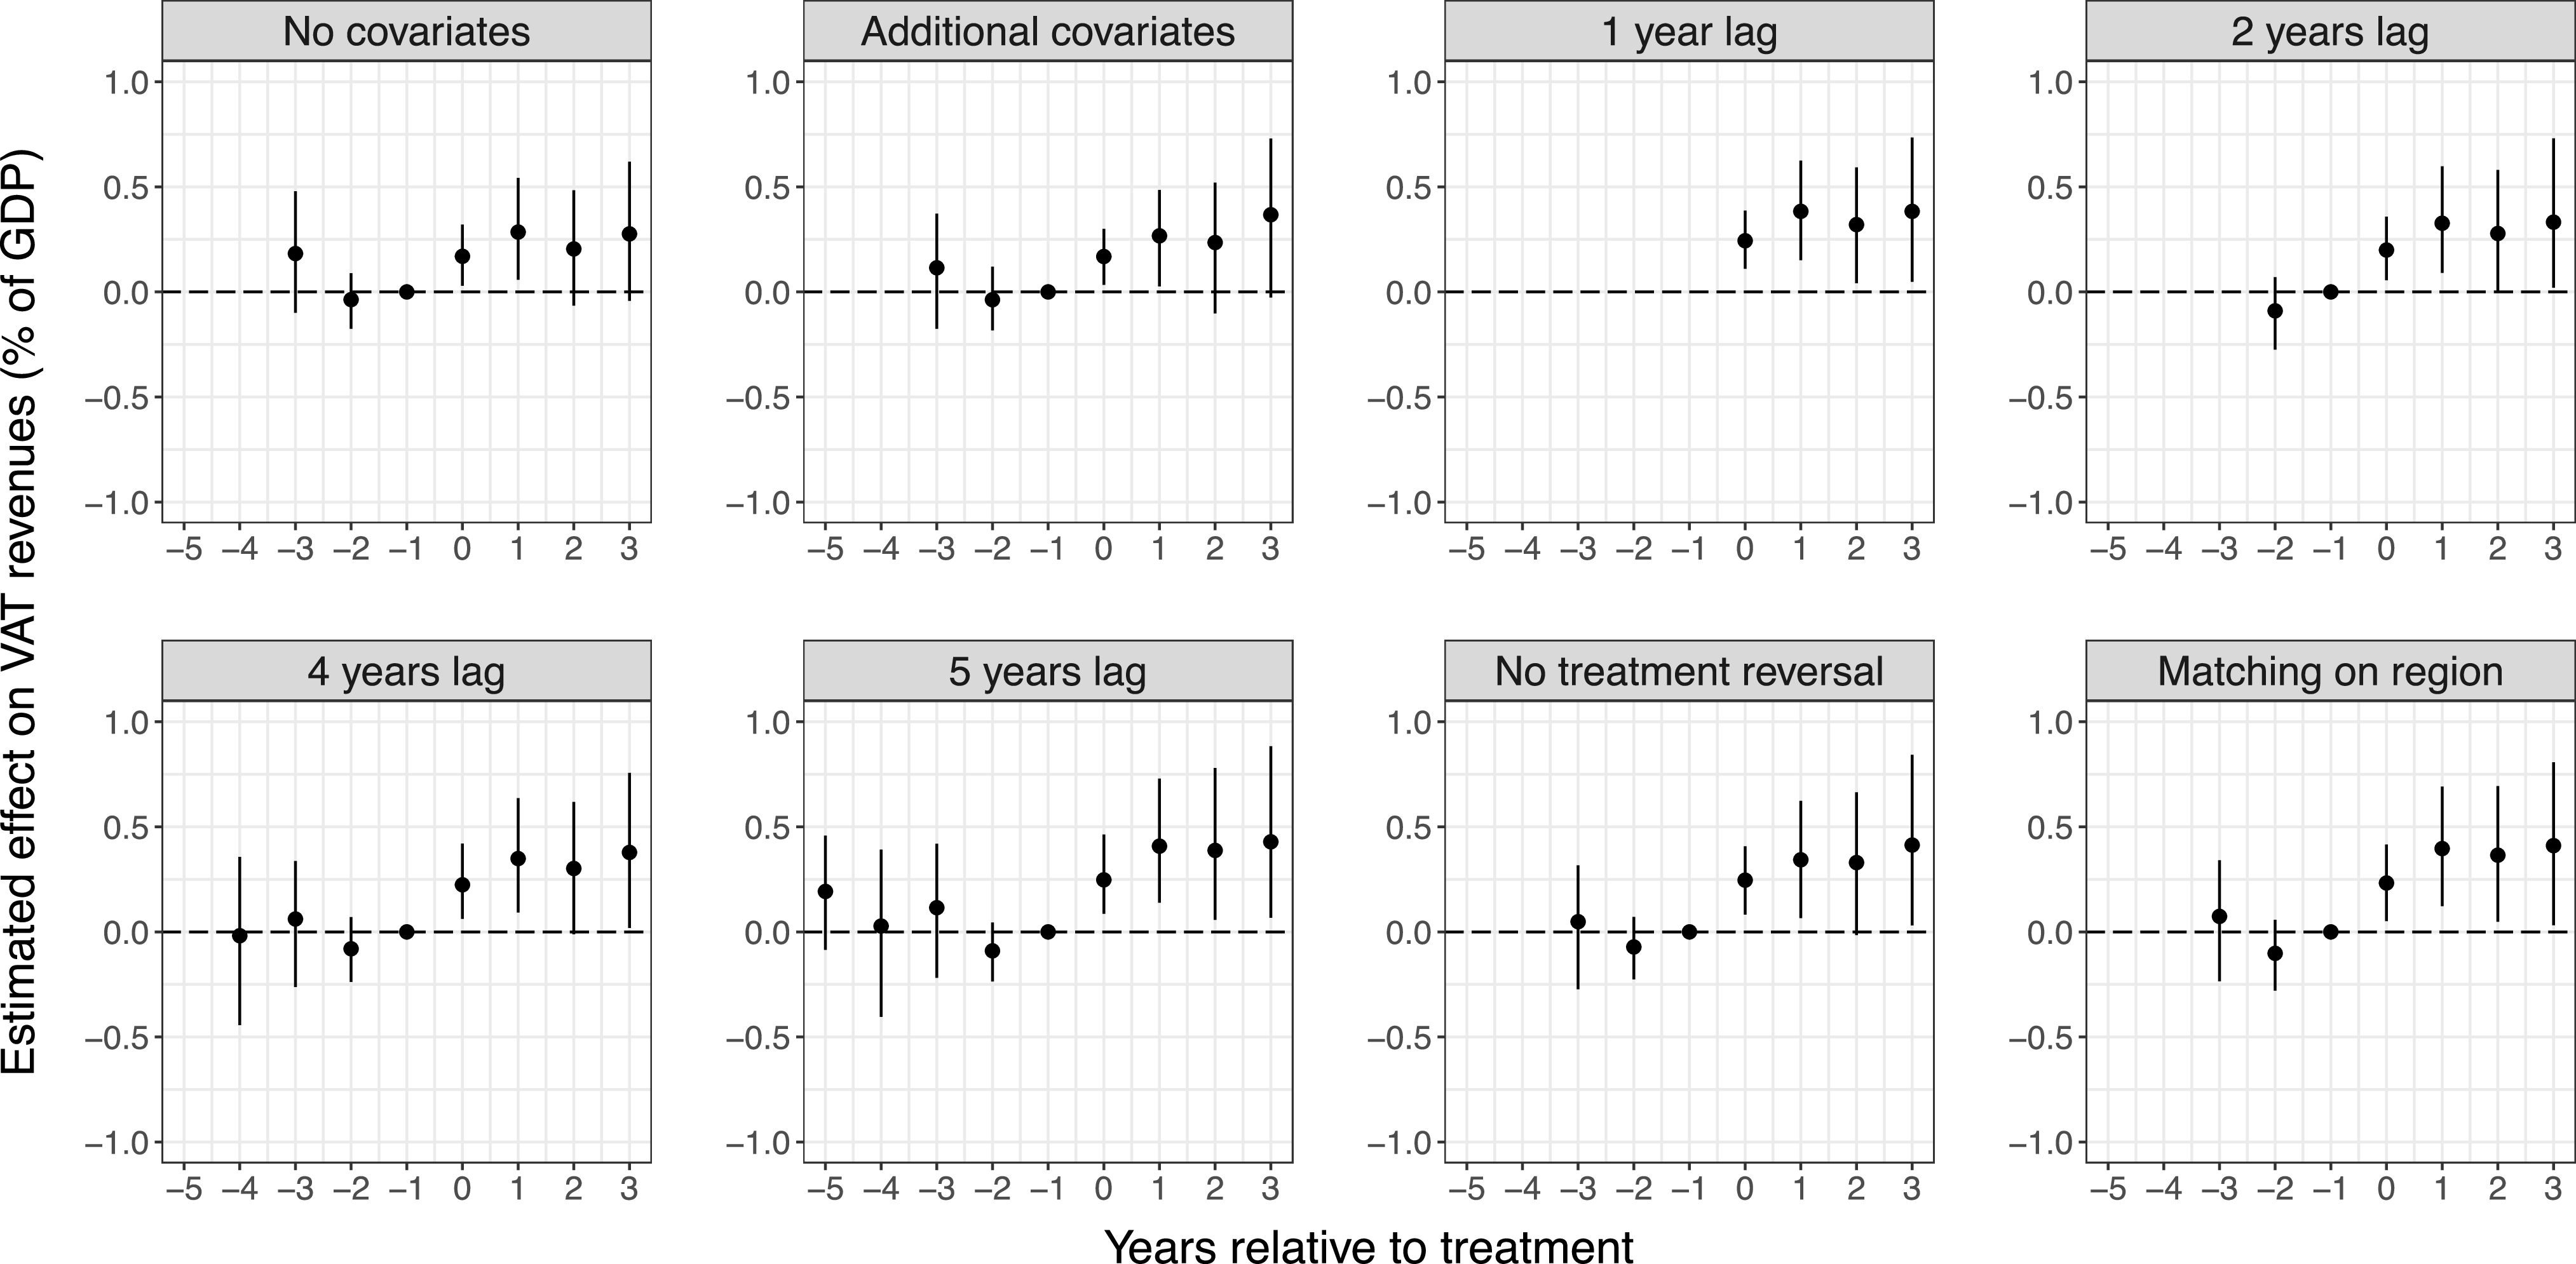
To assess the consistency of the baseline findings, I perform a wide range of robustness checks, which focus primarily on testing whether the positive effect of a unified government holds under alternative specifications. I begin by examining the sensitivity of the results to the specification of the PanelMatch method. First, I match the treatment and control groups only based on identical treatment history in the three years prior to the treatment to verify that the results are not driven by the selection of covariates. Second, I add more covariates to the matching procedure. In addition to the covariates used in the main analysis, I include the annual headline consumer price inflation rate from Ha, Kose and Ohnsorge (Reference Ha, Kose and Ohnsorge2021), binary variables for participation in IMF crisis and non-crisis programmes developed from Dreher (Reference Dreher2006b), and the central government debt as a percentage of GDP (Mbaye, Moreno-Badia and Chae Reference Mbaye, Moreno-Badia and Chae2018).Footnote 17 I also control for the political system and add a binary variable for the existence of main elections in the previous calendar year (Cruz, Keefer and Scartascini Reference Cruz, Keefer and Scartascini2021). Footnote 18 Third, I repeat the baseline analysis for different values of L by defining that the treatment and control groups are matched on identical treatment history and similar covariates values in the two years (L = 2) and four years (L = 4) prior to the treatment. A similar analysis is conducted L = 1 and L = 5. Fourth, I run the baseline analysis when treatment reversal is not allowed, meaning that the estimates are derived only from countries in which the government’s status did not change in the post-treatment period. Fifth, I perform the baseline analysis when the treatment and control groups are also matched exactly on region.Footnote 19 Markedly, as shown in Figure 4, the results are statistically significant across all these alternative specifications.Footnote 20 The average increase in the share of VAT revenues in GDP ranges between 0.28 and 0.43 pp.Footnote 21 I also run these tests for the effect of a divided government and find that the impact on VAT revenues is negative and in two cases also statistically significant (Figure A3).
Robustness checks for the effect of a unified government on VAT revenues.
Note: The lines represent 95% confidence intervals based on 1000 bootstrap iterations.

Figure 4. Long description
Eight scatter plots depict the estimated effect on VAT revenues as a percentage of GDP over time relative to treatment. Each plot shows the years relative to treatment on the horizontal axis, ranging from -5 to 3, and the estimated effect on VAT revenues on the vertical axis, ranging from -1.0 to 1.0. Panel A, titled No covariates, shows the estimated effect without considering any covariates. Panel B, titled Additional covariates, includes additional covariates in the estimation. Panel C, titled 1 year lag, shows the effect with a 1-year lag. Panel D, titled 2 years lag, shows the effect with a 2-year lag. Panel E, titled 4 years lag, shows the effect with a 4-year lag. Panel F, titled 5 years lag, shows the effect with a 5-year lag. Panel G, titled No treatment reversal, shows the effect without treatment reversal. Panel H, titled Matching on region, shows the effect with matching on region. Each plot includes data points with error bars indicating the uncertainty of the estimates.
Next, I evaluate the sensitivity of the results to the matching procedure applied to improve covariate balance. Instead of using Mahalanobis distance matching, I match the covariates on alternative matching and weighting methods, namely propensity score matching, propensity score weighting, covariate balancing propensity score (CBPS) matching, and CBPS weighting.Footnote 22 The results are statistically significant and the effect size reaches up to 0.31–0.37 pp (Figure A4).Footnote 23
Another potential concern regarding the validity of the estimates is the role of electoral system. More specifically, the formation of a unified government is considerably less likely in countries with PR. I address this concern by matching treated and untreated units exactly on a binary variable that equals 1 when the country has PR system in a given year.Footnote 24 The data come from Cruz, Keefer and Scartascini (Reference Cruz, Keefer and Scartascini2021). I also run the analysis for a subsample of all countries that experienced at least one change from divided to unified government or vice versa. The covariates are identical to the baseline model in these specifications. As Figure A5 shows, the effect of a unified government on VAT revenues is positive and statistically significant in both cases.
Furthermore, I verify that the results remain robust when VAT revenues are retrieved only from OECD (2025) or UNU-WIDER (2023) rather than the combination of the two.Footnote 25 I also examine the effect of a unified government on an alternative dependent variable – the share of revenues from general taxes on goods and services in GDP.Footnote 26 In addition to VAT revenues, this category includes revenues from sales tax, turnover tax, and taxes on financial and capital transactions. The main findings hold across all these specifications (Figure A6). The effect size is larger than the main results, amounting to 0.46 pp of GDP when using the OECD GRSD (0.19 standard deviations), 0.48 pp of GDP when using the GRD (0.2 standard deviations), and 0.54 pp of GDP for general taxes on goods and services (0.2 standard deviations). I also consider changes from minority to majority governments and vice versa. In this specification, the threshold for majority government is when the share of government seats in the legislature is greater than 50%, irrespective of the number of parties in the coalition and the differences between these parties. The data are retrieved from the margin of majority variable in the DPI (Cruz, Keefer and Scartascini Reference Cruz, Keefer and Scartascini2021). The overall nature of the relationship follows the same pattern with a positive (negative) effect of majority (minority) governments on VAT revenues (Figure A7). The magnitude of the impact of a majority government, however, is weaker compared to the case of a unified government.
Finally, I implement the fixed effects counterfactual (FEct) estimator, the interactive fixed effects counterfactual (IFEct) estimator, and the matrix completion (MC) estimator as alternative methods (Liu, Wang and Xu Reference Liu, Wang and Xu2024). The covariates are identical to the main analysis except for the lagged values of the dependent variable and the inclusion of country and year fixed effects. By imputing counterfactuals for treated observations through models that rely on data from untreated observations, these estimators correct the potential bias associated with the traditional TWFE approach in the presence of heterogenous treatment effects. Consistent with the baseline analysis, the findings show that the effect of a unified government on VAT revenues is both positive and statistically significant. Whereas the effect size is initially smaller when compared to the baseline estimates, it also increases considerably over time, ultimately exceeding 0.5 pp of GDP in all specifications (Figure A8). One potential interpretation of this finding is that a sustained unified government has a particularly positive impact on VAT revenues. Diagnostic tests are illustrated in Figure A9. In general, the IFect estimator appears the most reliable as it passes both tests for no pretrend, providing evidence in favour of the parallel trends assumption. It also passes one of the two placebo tests, and its failure to pass the placebo equivalence test can potentially be attributed to the relatively small number of treated units. Furthermore, the equivalence test is highly sensitive to the selection of the equivalence range (Liu, Wang and Xu Reference Liu, Wang and Xu2024). I also report the results from a conventional TWFE approach using the seat share of the largest government party as a continuous variable. In these specifications, the relationship between political strength and VAT revenues is positive yet statistically insignificant (Table A5). Nonetheless, these models do not consider the number of political parties in the government as well as the possibility that the effect on VAT revenues emerges over time.
Subsample of developing countries
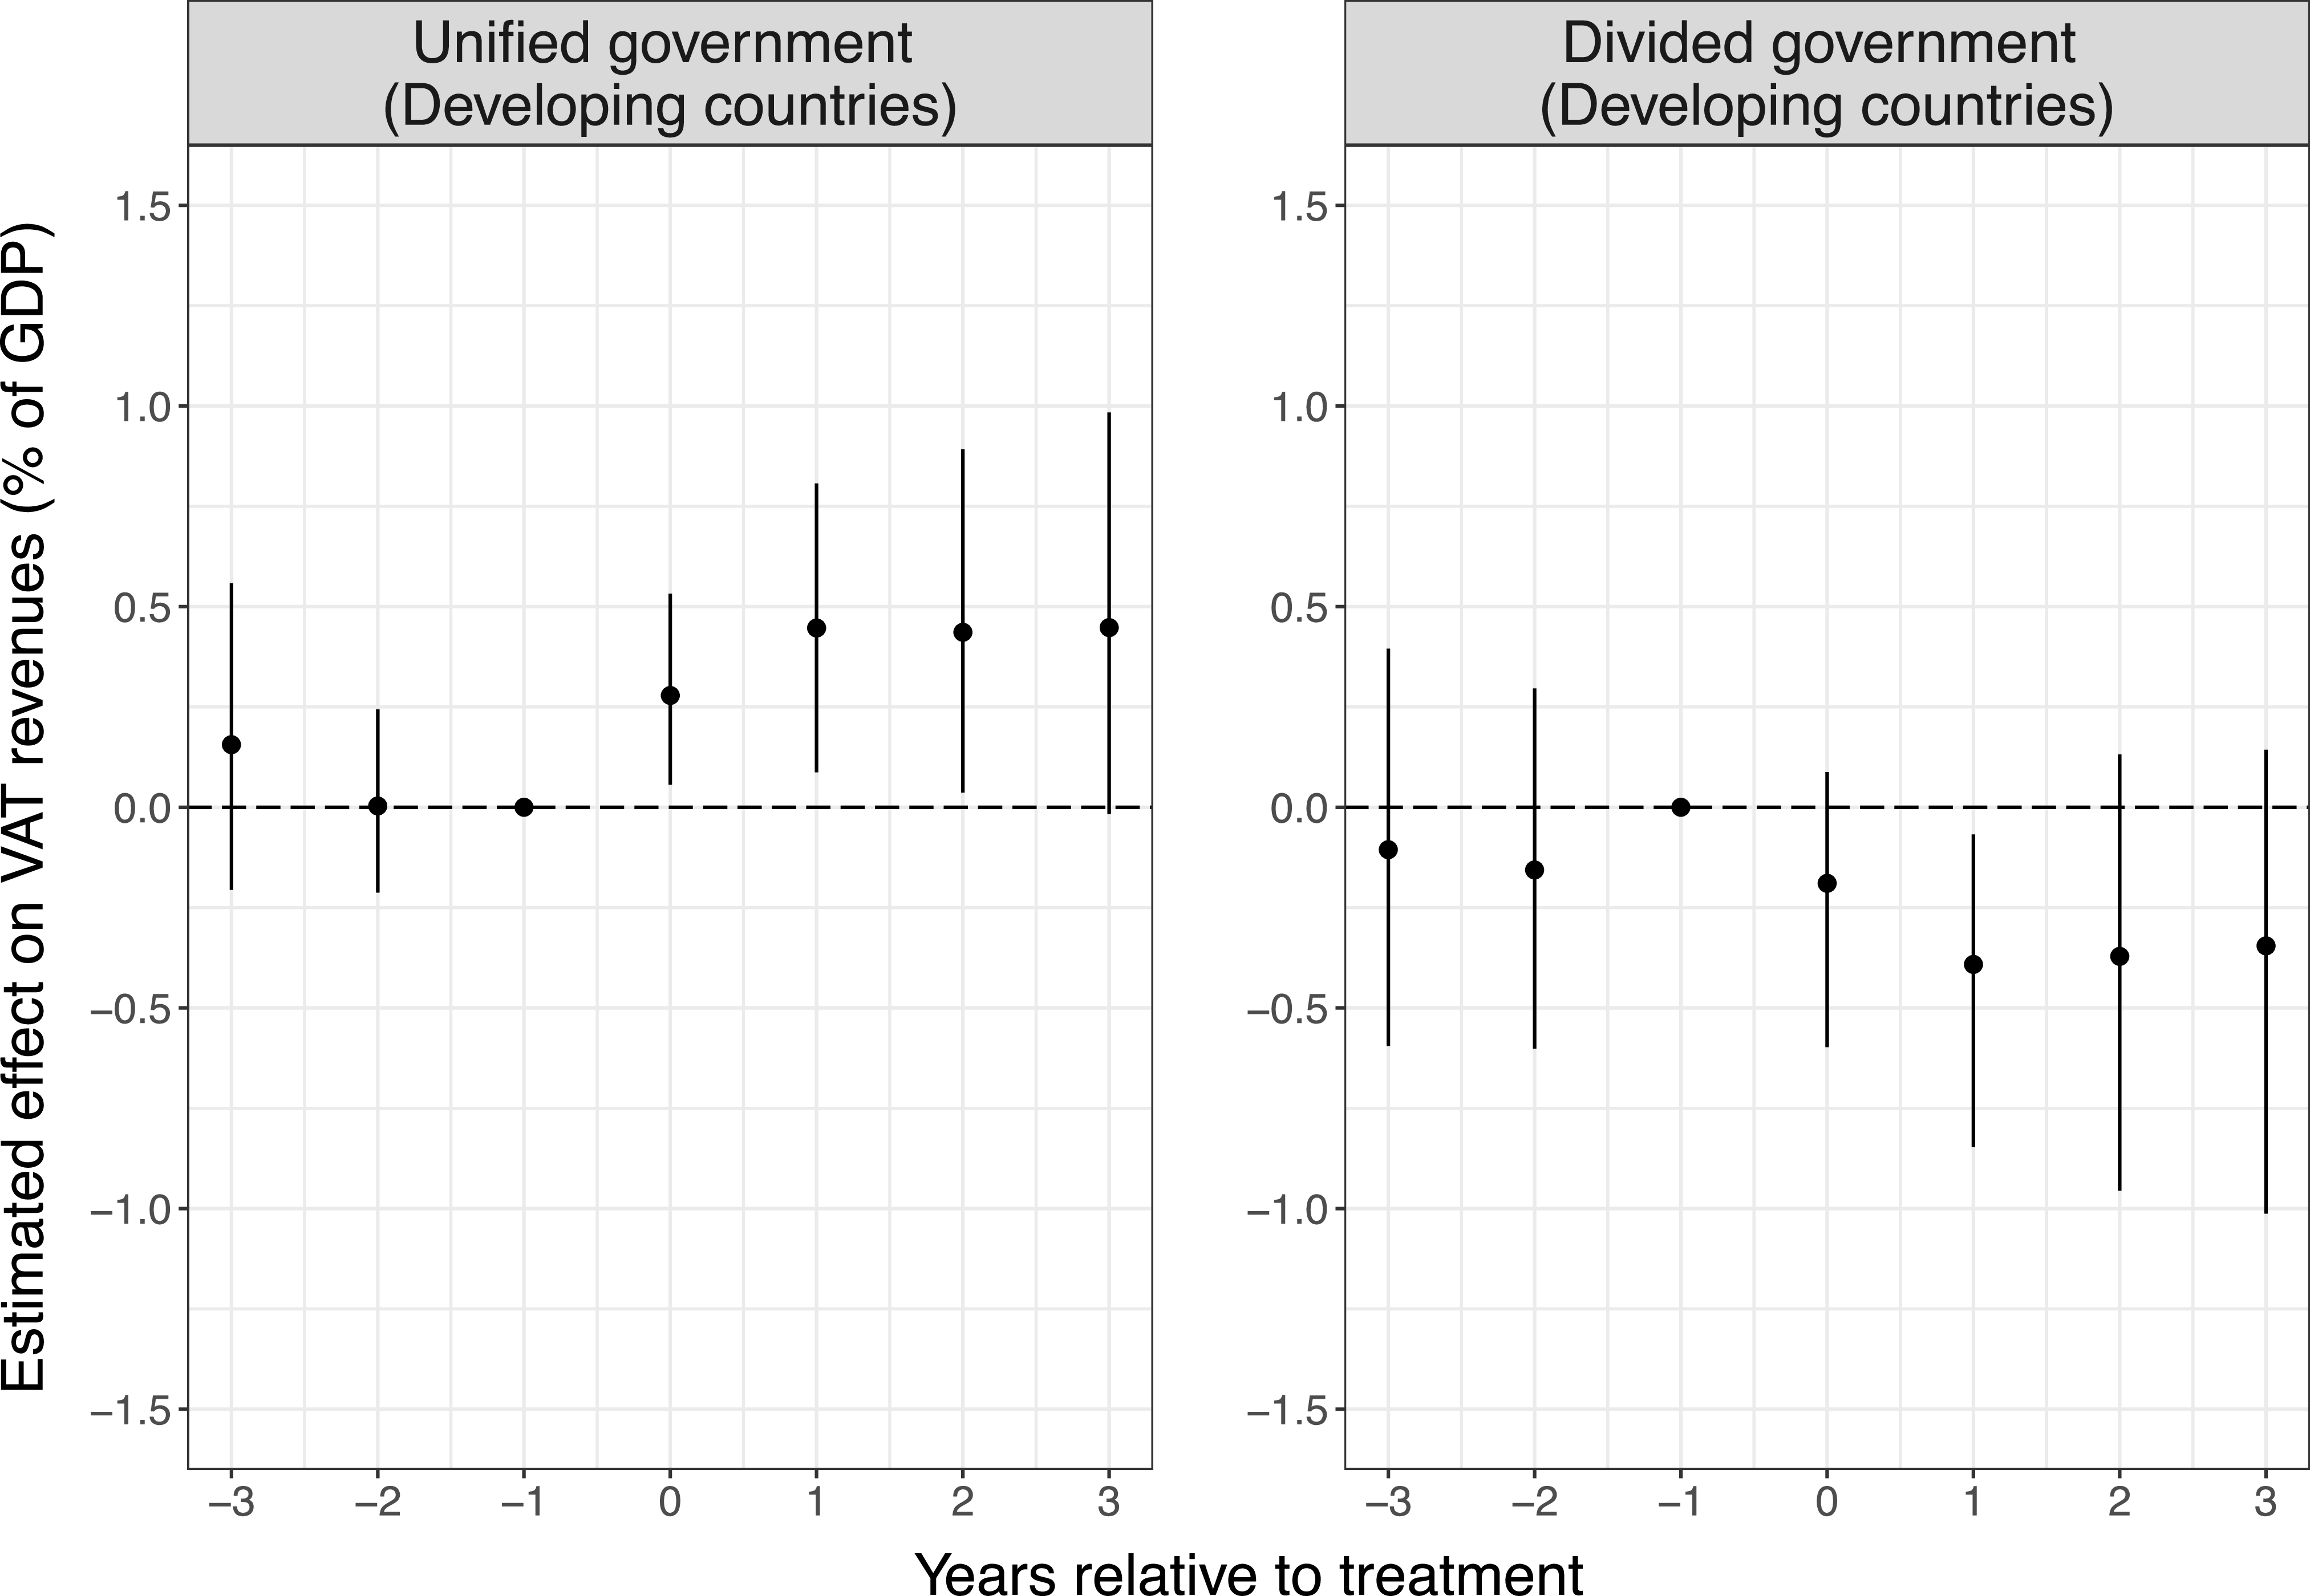
The importance of the VAT as a source of public revenues is particularly pronounced in developing countries (Bird and Gendron Reference Bird and Gendron2011; Kato and Toyofuku Reference Kato and Toyofuku2018). To assess the nature and magnitude of the findings for this subsample of countries, I run the analysis only for the 52 countries in the sample that are defined by the IMF (2023) as emerging and developing economies. The results indicate that the effect of a unified government on VAT revenues is both positive and statistically significant (Figure 5). The effect is larger than the baseline findings, reaching up to 0.45 pp of GDP (0.19 standard deviations) and is statistically significant at the 5% level in the first three calendar years after the formation of a unified government. By contrast, the effect of a divided government on VAT revenues is negative and statistically significant. As shown in Figure A10, the effect of a unified government is also positive and statistically significant across all specifications when using the counterfactual estimators approach (Liu, Wang and Xu Reference Liu, Wang and Xu2024). Overall, these findings reveal the role of executive-legislative cohesion in determining the rise of the VAT in the developing world. Similarly to the full sample analysis, the results when using the largest government party’s seat share as a continuous variable in the TWFE framework are positive but statistically insignificant (Table A6), suggesting that the status of the dominant government party in the legislature can be more influential than the number of seats per se.
Estimated average effects of unified and divided governments on VAT revenues in developing countries.
Note: The analysis is based on 21 (17) treated units and corresponding matched sets for unified (divided) government. The lines represent 95% confidence intervals based on 1000 bootstrap iterations.

Mechanisms
The main findings and robustness checks strongly suggest that governments with greater legislative support raise more revenues from the VAT. In this subsection, I seek to gain further insight into the potential mechanisms that underlie this relationship. As discussed above, I focus on two main channels: increases of the standard VAT rate and improvements in VAT collection efficiency. The model specification is identical to the main analysis with the only exception that the inclusion of the lagged values of the dependent variable in the covariates now refers to the lagged values of the proposed mechanism.
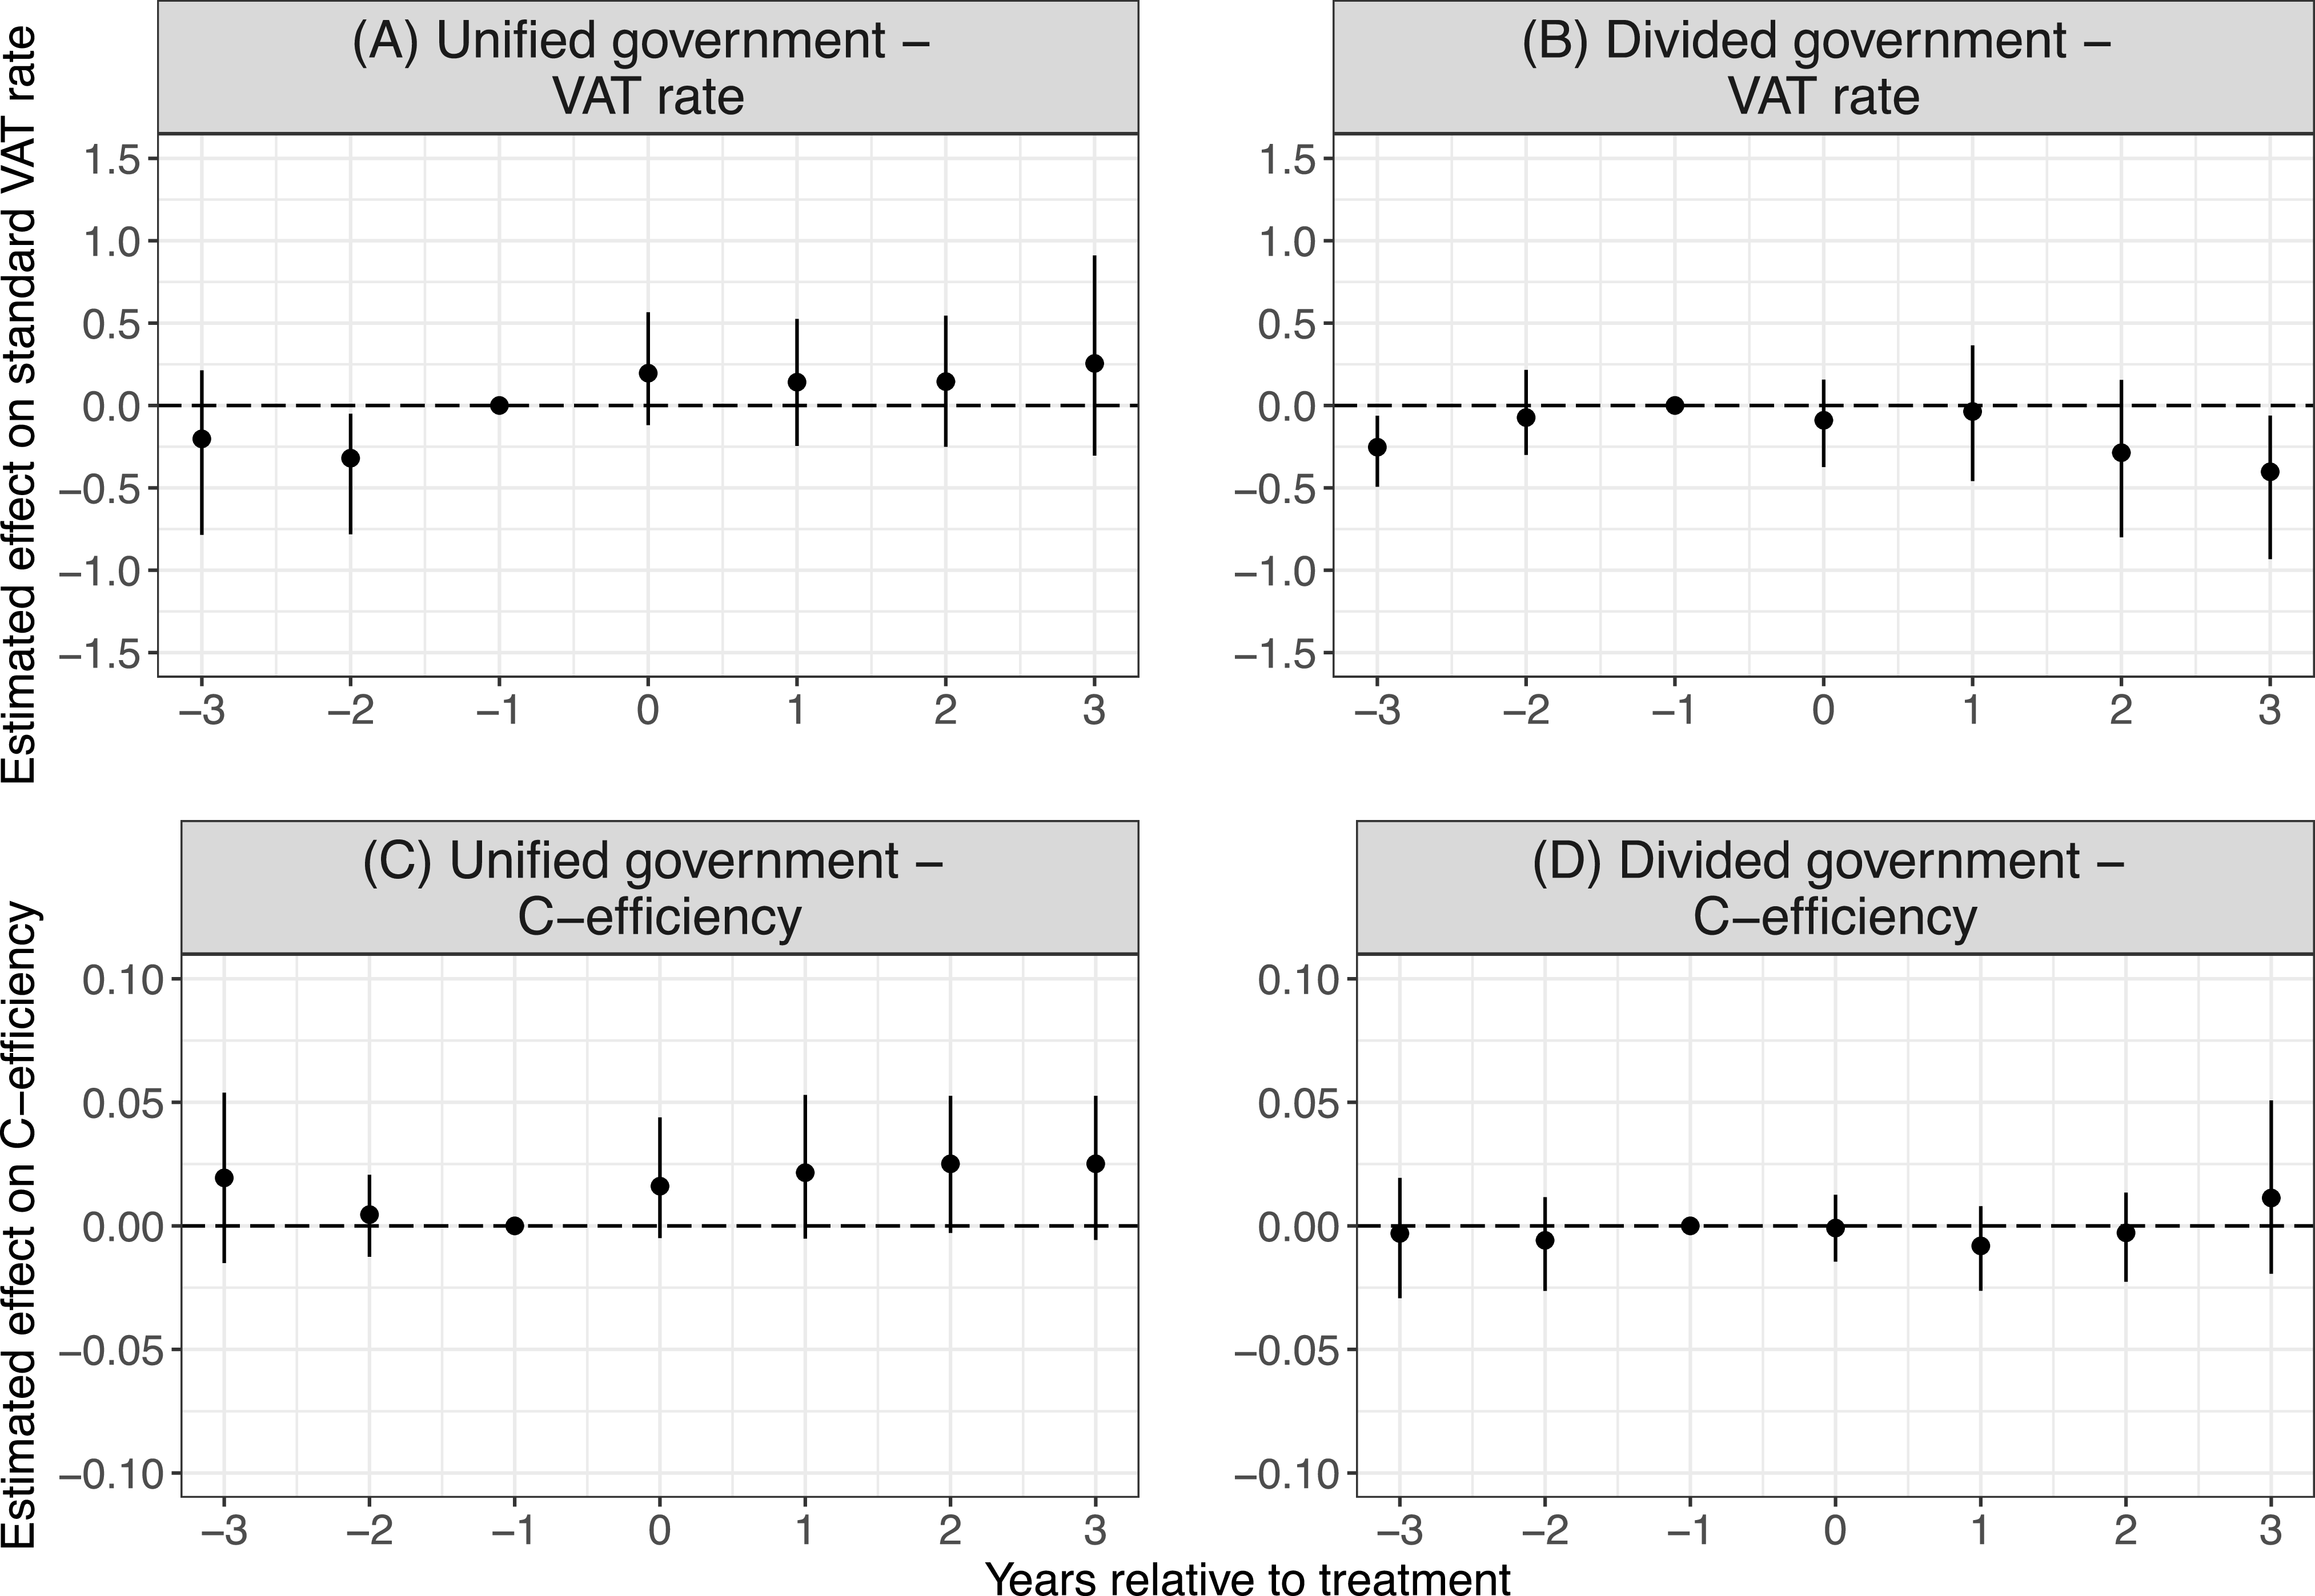
Figure 6 presents the main findings. Specifically, Panels A and B display the effect of unified and divided governments on the standard VAT rate, while Panels C and D present the effect of the two types of government on the C-efficiency. The figure illustrates two suggestive patterns. First, the positive effect of a unified government on VAT revenues seems to result mainly from improved efficiency rather than increases in the standard tax rate. Specifically, as Panel C illustrates, the C-efficiency increases by 0.025 (0.15 standard deviations) at t + 2 for a unified government and the effect is statistically significant at the 10% level. Second, the estimated effect of a divided government on the VAT rate is negative and statistically significant (Panel B).Footnote 27 As Figure A11 shows, the positive effect of a unified government on the C-efficiency is also statistically significant at the 5% level for two of the three counterfactual estimators. Furthermore, employing the TWFE framework with the seat share of the largest government party as the main explanatory variable, the results show that greater legislative power is positively associated with higher standard VAT rates and improved efficiency of VAT revenue collection, but the relationship is statistically significant only for the latter with varying levels of significance ranging between 1% and 10% for different models (Table A7).
Estimated average effects of unified and divided governments on the standard VAT rate and the VAT C-efficiency.
Note: The analysis is based on 29 (30) treated units and corresponding matched sets for unified (divided) government. The lines represent 95% confidence intervals based on 1000 bootstrap iterations.

Figure 6. Long description
The image contains four line graphs. Panel A shows the estimated effect on the standard VAT rate under a unified government. The x-axis represents years relative to treatment, ranging from -3 to 3, and the y-axis represents the estimated effect on the standard VAT rate, ranging from -1.5 to 1.5. Panel B shows the estimated effect on the standard VAT rate under a divided government, with the same axes as Panel A. Panel C shows the estimated effect on VAT C-efficiency under a unified government. The x-axis represents years relative to treatment, ranging from -3 to 3, and the y-axis represents the estimated effect on C-efficiency, ranging from -0.10 to 0.10. Panel D shows the estimated effect on VAT C-efficiency under a divided government, with the same axes as Panel C. Each graph includes data points with error bars indicating the range of estimated effects.
These findings enhance our understanding of the channels through which political power influences VAT revenues. An important caveat, however, is that the results should be interpreted with a degree of caution given the small number of treated units. While this caveat can be applied to the empirical findings in general, it is particularly true for the mechanism analysis due to the fact that changes in the statutory VAT rate unlike changes in VAT revenues do not typically occur every year at the country level.
Conclusion
The VAT is an important component of the modern tax state (Limberg Reference Limberg2022). This article has examined the role of political power in the global expansion of this fiscal instrument. Drawing on existing research on the political determinants of taxation and the drivers of policy innovation (Hallerberg and Basinger Reference Hallerberg and Basinger1998; Levi Reference Levi1989; Tsebelis Reference Tsebelis1995, Reference Tsebelis2002), I have tested the argument that democratic governments with a strong legislative position are expected to raise more revenues from the VAT as an effective tool to improve public finances in the short term. Using data from a global sample of 85 democracies between 1990 and 2020, the empirical findings provide support for this hypothesis. In particular, I have found that the formation of a unified government has a positive and statistically significant effect on the share of VAT revenues in GDP which is robust across multiple specifications. By contrast, the effect of a divided government on VAT revenues is negative and in most cases statistically insignificant. The results are especially pronounced for a subsample of developing countries, where the VAT is often the principal revenue source (Bird and Gendron Reference Bird and Gendron2011; Kato and Tanaka Reference Kato and Tanaka2019).
These findings improve our knowledge and understanding of the rise of the VAT. They suggest that apart from being a product of factors such as fiscal modernisation (Kato and Toyofuku Reference Kato and Toyofuku2018), fiscal pressure (Kemmerling Reference Kemmerling2014: 158; Lierse and Seelkopf Reference Lierse and Seelkopf2016), and trade liberalisation (Bastiaens and Rudra Reference Bastiaens and Rudra2016), the global expansion of this tax has also been driven by domestic political dynamics. Furthermore, the article enhances our understanding of the democracy–taxation nexus. Whereas previous research has focused on the broader relationship between political regimes and tax revenues (eg Boix Reference Boix2001; Garcia and von Haldenwang Reference Garcia and von Haldenwang2016; Olson Reference Olson1993; Profeta, Puglisi and Scabrosetti Reference Profeta, Puglisi and Scabrosetti2013), it shows that variation in political power within democracies matters for fiscal outcomes. Finally, in line with studies such as Prichard (Reference Prichard2018) and von Schiller (Reference von Schiller2018), the findings underscore the importance of the political arena for our understanding of the evolution of tax systems in developing countries. One potential implication of this research therefore is that greater attention should be given to the domestic political landscape in the design, planning, and analysis of tax reforms, echoing Levi’s (Reference Levi1989: 181) observation that ‘The most economically “efficient” policy, even if it could be determined, takes a clear back seat to the most politically acceptable’.
Future research can benefit from comparing the impact of political power on the evolution of the VAT in different countries. Subsequent investigations can also examine whether the nature of this relationship varies across sectors and geographic regions. These two research avenues can deepen our understanding of the mechanisms and contextual factors that influence the relationship between the government’s legislative power and VAT revenues. More broadly, researchers might be interested in evaluating the role of other political factors in shaping the performance of the VAT.
Supplementary material
The supplementary material for this article can be found at https://doi.org/10.1017/S1475676526101558
Data availability statement
Replication files are available at the Harvard Dataverse: https://doi.org/10.7910/DVN/ZMTQ0T
Acknowledgements
I thank the editor and three anonymous reviewers for their insightful feedback and suggestions. I am also grateful to Julian Limberg, Amrita Dhillon, Daniel H. Alves, Matthias Haslberger, as well as the participants in the PGR Seminar Series of the School of Politics & Economics at King’s College London, the 13th International NordWel Summer School in Bremen, and the 2025 EPSA conference in Madrid, for their feedback and comments on earlier drafts.
Financial support
This work received no specific grant from any funding agency, commercial or not-for-profit sectors.
Competing interests
The author declares no conflict of interest.




 Open access

