Introduction
Despite the large interest in exploring cave systems, caves in many parts of the world remain under-studied (Gibert & Deharveng Reference Gibert and Deharveng2002). Compared with their above-ground counterparts, subterranean ecosystems often provide unique conditions that can be challenging for terrestrial and aquatic organisms. Due to lack of light and low nutrient levels, there is little or no primary production (Culver Reference Culver1985). Most aquatic cave systems are thought to be detritus-dependent (Dickson Reference Dickson1975) and probably rely mostly on allochthonous energy inputs. As part of this, excretions from organisms entering the caves, such as bats, are an important source of organic molecules (Ferreira & Martins Reference Ferreira and Martins1998, Kasso & Balakrishnan Reference Kasso and Balakrishnan2013). Since photosynthesis is limited, it is likely that the main contributor of C, N and P is bat guano from bats roosting in the caves. Contrasting results about the composition of bat guano (Emerson & Roark Reference Emerson and Roark2007, Goveas et al. Reference Goveas, Miranda, Seena and Sridhar2006, Sridhar et al. Reference Sridhar, Ashwini, Seena and Sreepada2006) make generalizations about absolute and relative composition of nutrients difficult. However, guano from different bat feeding guilds seems to differ in nutrient content (Emerson & Roark Reference Kasso and Balakrishnan2013, Sridhar et al. Reference Sridhar, Ashwini, Seena and Sreepada2006). As such the trophic composition of roosting bat communities could affect the cave ecosystem. The nutrient hot spot theory by Pierson (Reference Pierson, Kunz and Racey1998) hypothesizes that bat colonies increase organic matter and create nutrient peaks in roosting areas by accumulating guano. This hypothesis has been tested and supported for tree roosts (Duchamp et al. Reference Duchamp, Sparks and Swihart2010), but less attention has been given to the organic input that bats provide in the different cave systems worldwide and how this might influence aquatic invertebrate communities.
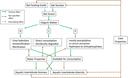
Here we studied the fauna of 12 partly aquatic caves, more specifically closed cenotes, in Yucatán, Mexico, to identify whether size and composition of roosting bat colonies correlated with biomass, diversity and abundance of zooplankton and benthos in these cave systems. Such an integrated approach has benefits since these ecosystem compartments may interact substantially and may influence fluxes of nutrients and energy that fuel populations of cave fauna. We hypothesized that waterbodies of caves with large bat colonies have higher nutrient availability than caves with small colonies and that other water variables may co-vary with bat colony size. Second, we anticipated that the higher nutrient availability in caves with large bat colonies would result in a larger invertebrate biomass. Given that the baseline conditions are oligotrophic, we expect positive effects on diversity of zooplankton and benthos. Finally, we expected that invertebrate communities would vary with bat colony size and potentially with bat community composition. The potential mechanistic relationships underlying such correlations, however, may be complex. Therefore, we have summarized hypothetical links between bat communities and aquatic invertebrate biomass and diversity in a flow chart (Figure 1). While these links cannot be tested using survey data as presented in this paper, they provide a reference against which the empirical correlations of this study can be interpreted and can serve as a starting point for confirmatory experiments.
Flow chart illustrating potential effects of bat colonies on aquatic invertebrate communities in aquatic caves in Yucatan, Mexico. Green continuous arrows symbolize positive effects, brown broad dashed arrows symbolize effects with non-specified directions and blue dotted arrows symbolize a diversifying effect as different feeding guilds have guano with a different chemical composition that could be favourable for various different organisms. Bat numbers and community structure affect guano amounts and properties which in turn are composed of varying amounts of organic matter and nutrients. The amounts and concentrations and the different processes involved in decomposition might affect physicochemical water properties and positively influence biomass and diversity of aquatic invertebrates. Arrow size does not represent the strength of the effect.

Study site
The study was conducted in the state of Yucatán in the northern Yucatán Peninsula, Mexico, where the world’s largest system of anchialine caves and sinkholes can be found (Pohlman et al. Reference Pohlman, Iliffe and Cifuentes1997). The peninsula consists of a low-elevation (maximum 150 m asl) limestone platform (Perry et al. Reference Perry, Marin, McClain and Velazquez1995). Due to the porosity of the rock, carbon dioxide (CO2) reacts with underground water to form carbonic acid (H2CO3) which dissolves limestone and leads to the formation of caves (Perry et al. Reference Perry, Marin, McClain and Velazquez1995). The ceilings of these eventually collapse, resulting in new water-filled sinkholes (Perry et al. Reference Perry, Marin, McClain and Velazquez1995). Even though mostly used for open sinkholes, the term cenote refers to all subterranean waterbodies. Cenotes can be characterized as closed, jug-shaped, cylindrical and plate-shaped (Hall Reference Hall, Pearse, Creaser and Hall1936). Most studies on diversity and physicochemical water characteristics in cenotes focus on open sinkholes which receive sunlight and support photosynthesis (Camargo-Guerra et al. Reference Camargo-Guerra, Escalera-Vázquez and Zambrano2013, Cervantes-Martinez et al. Reference Cervantes-Martinez, Elías-Gutiérrez and Suárez-Morales2002), while next to nothing is known about diversity and conditions in closed cenotes (but see Pohlman et al. (Reference Pohlman, Iliffe and Cifuentes1997) and Pohlman et al. (Reference Pohlman, Cifuentes, Iliffe, Wilkens, Culver and Humphreys2000) for organic cycling in anchialine caves and Schmitter-Soto et al. (Reference Schmitter-Soto, Comín, Escobar-Briones, Herrera-Silveira, Alcocer, Suárez-Morales, Elías-Gutiérrez, Díaz-Arce, Marín and Steinich2002) for a general review).
Generally, cenotes are known to be oligotrophic systems, which are low in nutrients. Especially phosphorus is limiting (Schmitter-Soto et al. Reference Schmitter-Soto, Comín, Escobar-Briones, Herrera-Silveira, Alcocer, Suárez-Morales, Elías-Gutiérrez, Díaz-Arce, Marín and Steinich2002) as captured carbonates in the water column ensure that free phosphorus precipitates making it unavailable for biota (Camargo-Guerra et al. Reference Camargo-Guerra, Escalera-Vázquez and Zambrano2013). In sinkholes, both morphometric variables and physicochemical characteristics especially pH, dissolved oxygen and temperature can affect aquatic biomass and diversity (Camargo-Guerra et al. Reference Camargo-Guerra, Escalera-Vázquez and Zambrano2013, Cervantes-Martinez et al. Reference Cervantes-Martinez, Elías-Gutiérrez and Suárez-Morales2002). Besides that, vegetation surrounding the waterbody seems to be a key factor increasing fish diversity (Camargo-Guerra et al. Reference Camargo-Guerra, Escalera-Vázquez and Zambrano2013) as it provides refuge and food (Zambrano et al. Reference Zambrano, Vázquez-Domínguez, García-Bedoya, Loftus and Trexler2006). Therefore, the diversity in cenotes is likely to be dominantly determined by allochthonous processes, supplying organic matter from outside (Pohlman et al. Reference Pohlman, Iliffe and Cifuentes1997).
Cenotes have a highly diverse fauna, especially in crustaceans (Botello & Alvarez Reference Botello and Alvarez2010), over the whole peninsula. With more than 40 endemic species, the Yucatán Peninsula is considered a biodiversity hotspot (Mercado-Salas et al. Reference Mercado-Salas, Morales-Vela, Suáarez-Morales and Iliffe2013). Bat diversity is also high with more than 30 species (Arita Reference Arita1997). Cenotes are ideal roosting locations for bats as they provide roosting habitat, but also supply fresh water and insect prey (MacSwiney et al. Reference MacSwiney, Vilchis, Clarke and Racey2007, Reference MacSwiney, Bolívar Cimé, Clarke and Racey2009).
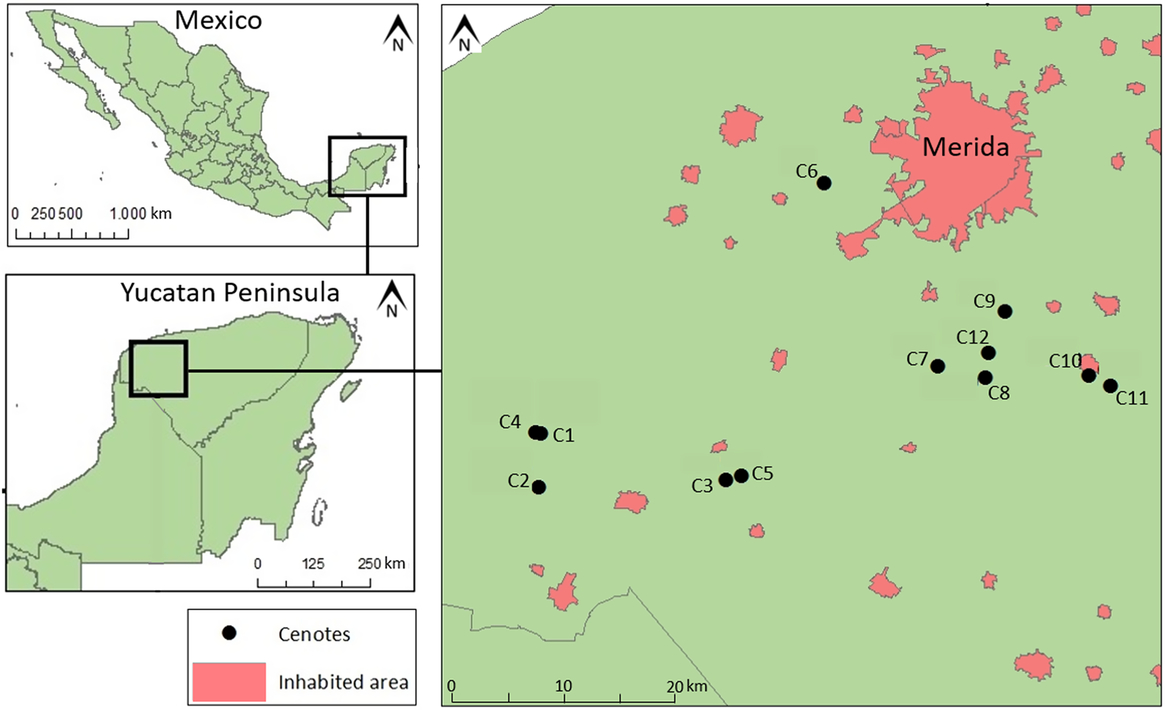
The climate in Yucatán can be divided into three seasons: warm and dry (March–May), rainy (June–October) and stormy with occasional rainfall (November–February) (Schmitter-Soto et al. Reference Schmitter-Soto, Comín, Escobar-Briones, Herrera-Silveira, Alcocer, Suárez-Morales, Elías-Gutiérrez, Díaz-Arce, Marín and Steinich2002). All fieldwork was conducted in the rainy season in August and September 2015. Twelve closed cenotes (Figure 2) were chosen in the physiographic region of Mérida described by Wilson (Reference Wilson1980) to reduce impacts of geographic conditions on aquatic diversity. We only chose caves in which no sunlight reached the waterbodies to limit our study to systems without photosynthesis.
Location of the 12 sampled aquatic caves and major inhabited areas in the north-west of Yucatán, Mexico. Black dots symbolize location of cenotes and pink areas symbolize inhabited areas such as cities and bigger villages.

Methods
Abiotic characteristics
To account for influences of physical cave characteristics, we measured the following morphometric variables: entrance area, entrance to waterbody distance, waterbody area, water depth and roof height. For all distance measurements, a laser distance meter (Leica DISTO™ X310, Leica, Heerbrugg, Switzerland) was used. For all visible surface areas, we measured the bearings of fixed points around the water surface from two points separated by a known distance. Physicochemical water characteristics were measured with a HI 9829 Multiparameter Meter (Hanna instruments, Woonsocket, USA). We took several water measurements in deep pools, however as no evidence of a halocline was found, we used values determined at the water surface (i.e. at a 5–10 cm depth) for analysis. We identified the following values: water temperature (°C) (± 0.15 °C), pH (± 0.02 pH), dissolved oxygen (DO) (%) (± 1.5%), total dissolved solids (TDS) (ppm) (± 1 ppm (mg L−1)), salinity (PSU) (±0.01 PSU), conductivity (µS cm−1) (± 1%), oxidation-reduction potential (ORP) (mV) (± 1.0 mV) and pressure (mbar) (±3 mm Hg within ±15°C from calibration temperature). Furthermore, in vivo chlorophyll and turbidity were quantified using AquaFluor®, a handheld fluorometer and turbidimeter (Turner Designs, San Jose, USA). Chlorophyll a (Chla) was measured in a qualitative way, with a minimum detection limit of 0.3 μg L−1. As Chla was expected to be non-existent or very low and expected not to be associated with aquatic fauna, we measured it to confirm this assumption. Turbidity was measured with a minimum detection limit of 0.5 NTU. We noted fish presence as presence-absence data as fish occurred in very low numbers (maximum = 4). Fish species were not identified. Sediment type was recorded distinguishing between white limestone flakes and dark, sandy sediments. Water flow inside the caves was visually undetectable and was not further measured.
Bat colonies
All colonies were estimated visually during daytime visits. All bats in small colonies were counted and in bigger colonies 1-m2 subsamples were counted and numbers were extrapolated to the whole colony following the procedure in Arita (Reference Arita1996). This was done by three people individually and averages were calculated. Besides that, photographs (camera model DSC-HX1, Sony, Tokyo, Japan) were taken in each cave representing different roosting densities and bats on the photographs were counted (Carpenter et al. Reference Carpenter, Gomez, Waldien and Sherwin2014). The average of visual and photographic counts was used for analysis. Furthermore, auditory signals were recorded with a bat detector, model Pettersson D240-X (Pettersson Elektronic AB, Uppsala, Sweden) and were analysed using the software BatSound Pro 3.31 (Petterson Elektronic AB, Uppsala, Sweden) to identify species and to verify whether more bats were present that could not be seen. Feeding guilds were identified by a combination of visual and auditory information. Considered feeding guilds were insectivores, frugivores and sanguivores. We calculated the total number of bats for each feeding guild and the percentage of each feeding guild.
Invertebrate communities
Zooplankton samples were taken from the top layer of the water column, but direct surface water was avoided as it contained impurities. Samples were taken by collecting 30 L of water with a 1-litre cylindrical hard-plastic bottle with an opening of 6 cm diameter. Each 1-litre filling was poured into a plankton net with a mesh size of 10 µm and all larger particles were collected by an attached sampling bottle. Samples were fixed in 50% isopropylic alcohol and refrigerated. Later, samples were condensed and fixed for storage in 75% ethanol. Benthic fauna was sampled using a hard-plastic tube with a diameter of 5.5 cm. The tube was pushed 4 cm deep into the substrate, resulting in a sample of ~95.03 cm3. The samples were filtered through a sieve with a mesh size of 500 µm and preserved in 75% ethanol in plastic bags.
Nutrient analysis
Water samples for nutrient analyses were taken as compound samples of 500 ml. To get an overview of nutrient availability in the waterbody, four samples of 125 ml were taken at locations that varied in local conditions. In each compound sample, ammonium (NH4 +) (Nessler, spectrophotometry; deviation from the average value of the standard of 0.022 mg L−1, R2 = 0.98), nitrate (NO3 −) (salicylic acid, spectrophotometry; deviation from the average value of the standard of 0.051 mg L−1, R2 = 1.00) and total phosphorus (P) (Olsen, spectrophotometry; deviation from the average value of the standard of 0.023 mg L−1, R2 = 1.00) were analysed by the Laboratorio de Suelos from the Facultad de Medicina Veterinaria y Zootecnia at the Universidad Autónoma de Yucatán.
Species identification and biomass calculations
Organisms found in the samples were counted and identified to the lowest taxonomic level possible or grouped in morphospecies using a stereomicroscope Motic SMZ-171, (Motic, Hong Kong, China) and a microscope Leica DMLB (Leica, Wetzlar, Germany). We calculated biomass using published regression parameters of length-weight regressions. We used Alonso (Reference Alonso, Ramos, Alba Tercedor, Belles I Ros, Gosalbez i Noguera, Guerra Sierra, Macpherson Mayol, Martin Piera, Serrano Marino and Templado Gonzalez1996), Amoros (Reference Amoros1984), Bowman (Reference Bowman1977), Bowman & Iliffe (Reference Bowman and Iliffe1988), Elías-Gutiérrez et al. (Reference Elías-Gutiérrez, Suárez-Morales, Gutiérrez-Aguirre, Silva-Briano, Grandos-Ramírez and Garfias-Espejo2008), Halliday (Reference Halliday2015), Palacios-Vargas & Garcia-Gómez (Reference Palacios-Vargas and García-Gómez2014), Pescador et al. (Reference Pescador, Rasmussen and Harris1995), Smith (Reference Smith1989) and Thyssen (Reference Thyssen, Amendt, Goff, Campobasso and Grassberger2009) for identification and Baumgärtner & Rothhaupt (Reference Baumgӓrtner and Rothhaupt2003), Boates & Smith (Reference Boates and Smith1979), Jimenez et al. (Reference Jimenez, Rennie, Sprules and La Rose2011), McCauley (Reference McCauley, Downing and Rigler1984), Méthot et al. (Reference Méthot, Hudon, Gagnon, Pinel-Alloul, Armellin and Poirier2012), Miserendino (Reference Miserendino2001), Pace (Reference Pace1986), Petersen (Reference Petersen1975), Sabo et al. (Reference Sabo, Bastow and Power2002), Sample et al. (Reference Sample, Cooper, Greer and Whitmore1993), Towers et al. (Reference Towers, Henderson and Veltman1994) and Zalik & Strong (Reference Zalik and Strong2008) for published regressions. An average-sized individual of each taxon was measured in length and if multiple published regressions were found for a taxon, the average weight resulting from the different regressions was used. Biomass of the whole sample was calculated by multiplying the weight of the average individual with the number of individuals of the same taxon and summing the weights of all taxa found per cave. All specimens are deposited at the Community Ecology Laboratory, Vrije Universiteit Brussel.
Statistical analysis
All statistical analyses were conducted using R (version 3.1.2.) and the packages vegan 2.0-10 and FactoMineR 1.27. We checked all physicochemical characteristics for autocorrelation and removed variables with correlation coefficients higher than 0.8. Furthermore, we excluded temperature as a variable from further analysis as cave temperature is very stable diurnally and differences among the caves were minimal (mean = 27.3°C ± 0.62°C).
Exploratory analyses
An exploratory cluster analysis was performed using a complete-linkage method with standardized physicochemical variables converted to a Euclidean distance matrix to visualize broad patterns of similarity in water conditions among caves. We plotted bat abundance as a supplementary variable onto the clustering diagram to illustrate whether caves with similar bat numbers show similar water conditions. In addition, a Mann–Whitney–Wilcoxon test was used to test whether the main clusters of cenotes with similar environmental conditions differ in size of bat colonies. This non-parametric test was used since assumptions for a parametric t-test were violated. We calculated rarefied species richness for both planktonic and benthic communities to correct for differences in sample sizes. Species richness of plankton was rarefied to a standard abundance of 50 and benthos to 10, matching approximately the minimal abundances found for each group in a sample. To explore associations among abiotic and biotic variables, Pearson product moment and Spearman Rank correlation coefficients were calculated with the latter being interpreted when the distributions of variables deviated from normality.
Quantitative analyses
First, we verified which cave properties could best explain bat abundances and bat community composition in the caves. Cave morphometrical variables and pressure, as a proxy for cave depth, were used as predictors in a multiple regression model for total abundance and as predictors in a redundancy analysis model (RDA) to test for differences in the abundances of the three functional groups as a multivariate response. Models were reduced by stepwise removal of non-significant terms until only significant terms remained. Second, to see which variables best explain our response variables biomass and rarefied species richness of plankton and benthos, we ran multiple regressions with physicochemical and morphometric variables, fish presence and sediment type as the most likely direct proximal drivers of this variation in responses on the biota. Third, to assess potential effects of bat numbers and bat community composition on chemical water variables that could be directly linked to defecation and urine (nitrate, ammonium, pH, DO) we ran multiple regression models that test for links between bat numbers (log or square-root (sqrt) transformed) and bat community composition and each of these chemical parameters. As a measure of the trophic composition of bat communities, we used the percentage of frugivores. Since sanguivores were rare, the percentage of frugivores almost equals (100 – percentage of insectivores), ensuring that one of these variables is redundant and the other can be used to capture variation in functional groups. In addition to relative abundances we also explored the importance of absolute abundance of each of the functional groups, separately, as potential predictors. They were added in a full model that was reduced step-by-step. Fourth, using the same general approach we also ran models that explore potential indirect effects of bat numbers and bat trophic composition on freshwater biota, captured by rarefied richness of benthos and zooplankton and their respective biomasses. We acknowledge that structural equation modelling (SEM) can be a good complementary method to separate direct from indirect effects. However, the limited number of observation points in combination with the large number of possible pathways ensured that the method is not feasible for this dataset.
Finally, to test whether invertebrate community composition varies with bat abundance and community composition, we constructed RDAs with Hellinger-transformed species abundances as a response, both for a plankton and benthos data matrix, respectively. Predictors included physicochemical and morphometric variables, fish presence, sediment type, cave location (longitude and latitude) and bat numbers as well as percentage of frugivores. Physicochemical variables were reduced before running the models by only including variables that did not correlate with other variables.
Results
Explanatory analysis
Morphometric and physicochemical characteristics of caves
The sampled caves differed in several environmental conditions. Entrance area (2.75 ± 2.51 m2), entrance to waterbody distances (28.0 ± 36.9 m), surface area of waterbody (92.6 ± 92.6 m2), water depth (0.87 ± 0.57 m) and roof height (2.58 ± 2.36 m) varied substantially. Entrance to waterbody distance correlated positively with roof height (Spearman: rho = 0.61; df = 10; P = 0.040) and water depth (Spearman: rho = 0.71; df = 10; P = 0.010). Pressure was 1018 ± 1.08 mbar and pH was neutral, with a mean of 6.99 ± 0.26. ORP and DO showed mean values of 65.5 ± 25.1 mV and 25.7% ± 8.65%, respectively, while salinity had a mean of 0.375 ± 0.33 PSU. Mean turbidity was 0.97 ± 0.72 NTU. Overall, nutrient concentrations were low, especially total P which was below the detection level of 0.023 mg L−1. NH4 + concentrations were low (0.020 ± 0.013 mg L−1), while NO3 − had the highest concentrations (0.801 ± 0.602 mg L−1). Water chemistry did not show clear trends with water depth.
Environment and bats
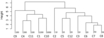
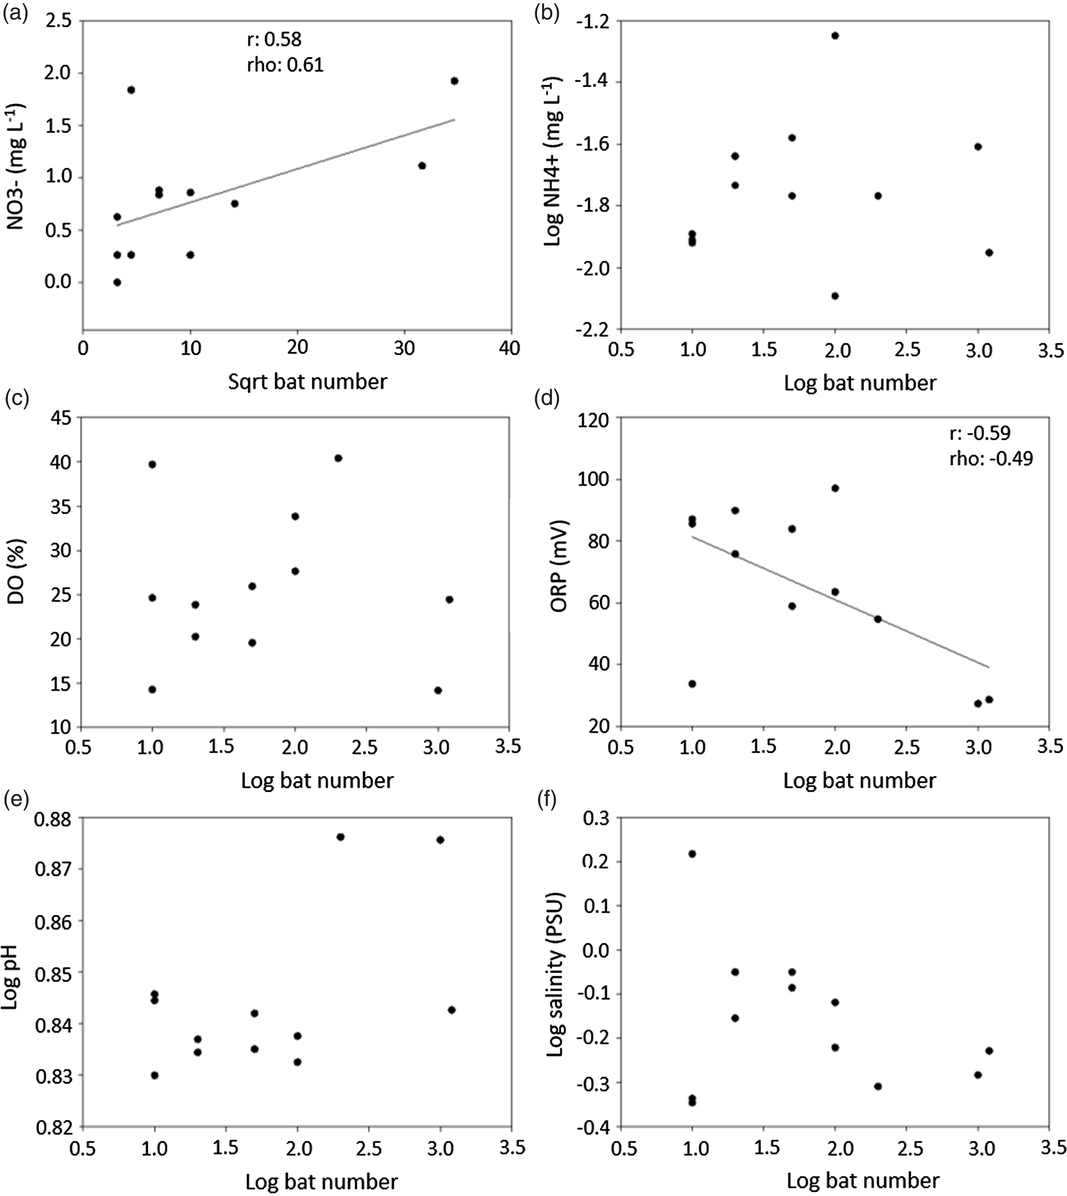
Cluster analysis revealed that cenotes broadly clustered in two groups based on physicochemical conditions (Figure 3). Looking at bat abundance, one group had significantly higher bat abundance than the other (MW–Wilcoxon test, W = 0.5, P = 0.009). Explicit tests of bat numbers with cave characteristics, showed that bat numbers were positively correlated with cave height (Spearman: rho = 0.70; df = 10; P = 0.011) and pressure (Pearson: r = 0.76; df = 10; P = 0.004). Most bats were frugivores and the number of frugivores correlated positively with pressure (Spearman: rho = 0.73; df = 10; P = 0.007). Furthermore, certain physicochemical characteristics were also associated with bat abundance (Figure 4). Bat numbers correlated positively with nitrate in the water (Pearson: r = 0.58; df = 10; P = 0.049) (Figure 4a) and negatively with ORP (Pearson: r = −0.59; df = 10; P = 0.042) (Figure 4d). Insectivore and sanguivore numbers were low, but positive trends could be seen in the correlation of insectivores and sanguivores with NH4 + (Spearman: rho = 0.64; df = 10; P = 0.026 and rho = 0.59; df = 10; P = 0.044, respectively) and additionally of sanguivores with NO3 − (Spearman: rho = 0.59; df = 10; P = 0.042).
Similarity of water characteristics in 12 aquatic caves in Yucatán, Mexico. Dendrogram of the cenotes calculated based on standardized physicochemical variables that were converted to a Euclidean distance matrix. The clustering method used was complete linkage method. Bat numbers were added to the branches after calculations. Based on their physicochemical characteristics, cenotes can be subdivided into two groups.

Associations between bat numbers and key physicochemical characteristics in 12 aquatic caves in Yucatán, Mexico. Nitrate (NO3 −) (mg L−1) (a), ammonium (NH4 +) (mg L−1) (b), dissolved oxygen (%) (c), oxidation reduction potential (mV) (d), pH (e) and salinity (PSU) (f) of the waterbodies in closed cenotes. Pearson r and Spearman rho are shown for significant correlations.

Quantitative analysis
Links between cave characteristics and bats
Total bat abundance was best explained by a linear regression including log-transformed pressure (P = 0.004) and log-transformed entrance area (P = 0.040) (F = 10.1; df = 10; R2 = 0.62, P = 0.005). The RDA with cave morphology and pressure did not explain differences in abundance of the three feeding guilds (F = 1.16; df = 4; P = 0.438).
Links between water chemistry and invertebrates
Most common invertebrates in the zooplankton were copepods, mysids, thermosbaenaceans and cladocerans (Appendix 1), while the benthic community was mainly characterized by oligochaetes and chironomids (Appendix 2). Both benthic biomass and diversity were very low, with a mean biomass of only 12.5 ± 18.1 mg and a mean rarefied species richness of 2.01 ± 1.41 per cave. With only physicochemical and morphometric variables as potential predictors, pelagic biomass could only be explained by pH (F = 14.8; df = 10; R2 = 0.60, P = 0.003). Rarefied pelagic species richness was best explained by a model including ORP, DO and log-transformed salinity (F = 4.48; df = 10; R2 = 0.33; P = 0.040). Of these variables, DO (P = 0.032) and salinity (P = 0.014) were significant. Benthic biomass (square root (sqrt) transformed) was poorly explained by our model that only retained log-transformed water depth and log-transformed NH4 + (F = 4.01; df = 10; R2 = 0.35, P = 0.057) as predictors. Variation in benthic diversity was best explained by log-transformed NH4 + only (F = 9.59; df = 10; R2 = 0.49; P = 0.011).
Link between bats and water chemistry
pH was best explained by a model including sqrt-transformed bat number and number of frugivores (F = 4.69; df = 10; R2 = 0.40; P = 0.040) of which bat number was significant (P = 0.015). Most other variables, including nutrient concentrations, were not significant. Nitrate concentrations could not be explained by a model including percentage of frugivores and number of frugivores (F = 4.06; df = 10; R2 = 0.35; P = 0.055). The model for sqrt-transformed ammonium which included sqrt-transformed bat number, sqrt-transformed percentage of frugivores, sqrt-transformed number of frugivores, sqrt-transformed number of insectivores and sqrt-transformed number of sanguivores was also not significant (F = 3.31; df = 10; R2 = 0.51; P = 0.089). DO could also not be explained with the best model including sqrt-transformed bat number, percentage of frugivores, number of frugivores and number of sanguivores (F = 3.43; df = 10; R2 = 0.47; P = 0.075).
Indirect effects of bats on biota
The addition of bat variables (bat number and percentage of frugivores) to the models explaining invertebrate biomass and diversity showed that these also partly explain pelagic biomass resulting in a model including pH and percentage of frugivores (F = 11.1; df = 10; R2 = 0.65; P = 0.004). While pH was significant (P = 0.002), percentage of frugivores was not (P = 0.091). Pelagic diversity was best explained by log-transformed salinity and sqrt-transformed percentage of frugivores (F = 8.29; df = 10; R2 = 0.57; P = 0.009) after inclusion of bat variables. Of these variables, salinity was borderline significant (P = 0.050), while percentage of frugivores was significant (P = 0.017). Adding bat variables, the best model explaining benthic biomass included DO, log-transformed NH4 +, sqrt-transformed percentage of frugivores and log-transformed water depth (F = 4.11; df = 10; R2 = 0.53; P = 0.050). Of these variables none had P-values < 0.05. The model explaining benthic diversity did not change after addition of bat variables (log-transformed NH4 +: F = 9.59; df = 10; R2 = 0.49; P = 0.011). Furthermore, we did not find direct correlations of biomass and richness with bat numbers.
Invertebrate community composition
Planktonic community structure was best explained by pH and longitude for abundance data (F = 2.73; R2 = 0.26; P(pH)= 0.028; P(long)= 0.023) and by percentage of frugivores for presence-absence data (F = 1.81; R2 = 0.15; P = 0.042). Benthic species community structure was best explained by the latitudinal coordinate of the location for both abundance (F = 2.92; R2 = 0.23; P = 0.015) and presence-absence (F = 2.92; R2 = 0.23; P = 0.029).
Discussion
Here, we investigated whether aquatic caves, specifically closed cenotes, that host larger bat colonies also have higher aquatic invertebrate biomass and diversity. The results partly support our hypotheses. Bat numbers were correlated with nitrate concentrations and redox potential in the water which could be linked to guano addition. Even though, this survey does not suffice to demonstrate direct effects of bat communities on invertebrate communities, overall water quality and biodiversity in these caves seem to co-vary to some extent with numbers and composition of the roosting bat communities.
Cave-roosting bat colonies in Yucatán are small- to medium-sized (with fewer than 10 000 bats) (Arita Reference Arita1996) and colonies examined here were even smaller (≤ 1200 bats). We found associations of some cave characteristics with bat abundance. Bat abundance correlated positively with cave roof height, which is consistent with the results of Arita (Reference Arita1996). Pressure was also positively associated with bat abundance. The background of this relationship is unclear, but bats have a preference for roosting in specific microclimates (Brunet & Medellín Reference Brunet and Medellín2001). As we also found a positive correlation of pressure and cave height, we hypothesize that pressure might be an indicator for cave depth or volume as higher caves might also be deeper and larger.
In accordance with our first hypothesis, caves that hosted larger bat colonies had higher nitrate concentrations. There was no link with ammonium and phosphate was not detectable. Similar, undetectable or very low P concentrations were measured in open cenotes (Alcocer et al. Reference Alcocer, Lugo, Marín and Escobar1998, Herrera-Silveira et al. Reference Herrera-Silveira, Comín, López and Sánchez1998) which can be explained by the precipitation of P with calcium from the limestone (Schmitter-Soto et al. Reference Schmitter-Soto, Comín, Escobar-Briones, Herrera-Silveira, Alcocer, Suárez-Morales, Elías-Gutiérrez, Díaz-Arce, Marín and Steinich2002). In general, organic matter entering the water decomposes via hydrolysis and oxidation including processing of nitrogen via ammonification and nitrification. These chemical reactions are influenced by water properties such as temperature, DO and pH (Strauss & Lamberti Reference Strauss and Lamberti2000, Strauss et al. Reference Strauss, Mitchell and Lamberti2002). pH is especially important in determining nitrification rates when ammonium is present (Strauss et al. Reference Strauss, Mitchell and Lamberti2002). It is unclear whether pH and associated changes in nitrification are important for higher trophic levels in this study. Nitrogen does not seem to be limiting for growth in these caves, as non-detectable concentrations point at phosphorus (Schmitter-Soto et al. Reference Schmitter-Soto, Comín, Escobar-Briones, Herrera-Silveira, Alcocer, Suárez-Morales, Elías-Gutiérrez, Díaz-Arce, Marín and Steinich2002). However, pH as further outlined below correlates with pelagic biomass. Nitrification by itself can cause changes in physicochemical variables, such as a reduction in oxygen (Courchaine Reference Courchaine1968). Therefore, it can be hypothesized that it could indirectly affect animal communities. DO concentrations here were lower than in open cenotes (Alcocer et al. Reference Alcocer, Lugo, Marín and Escobar1998, Camargo-Guerra et al. Reference Camargo-Guerra, Escalera-Vázquez and Zambrano2013), but it is known that oxygen concentrations in Yucatán’s groundwater are lower than in sinkholes (Escobar-Briones et al. Reference Escobar-Briones, Camacho and Alcocer1997). The absence of photosynthesis in closed caves is an additional reason for the low concentrations (Pohlman et al. Reference Pohlman, Iliffe and Cifuentes1997).
From all morphometric variables, we found that only water depth could be linked to benthic biomass which suggests that the range of physical cave characteristics included here does not seem to limit biomass and diversity. Camargo-Guerra et al. (Reference Camargo-Guerra, Escalera-Vázquez and Zambrano2013) found that allochthonous food sources were higher in open cenotes without a shore zone. Besides morphometry, other physical and chemical characteristics could affect aquatic biomass and diversity (Schmitter-Soto et al. Reference Schmitter-Soto, Comín, Escobar-Briones, Herrera-Silveira, Alcocer, Suárez-Morales, Elías-Gutiérrez, Díaz-Arce, Marín and Steinich2002). We found that pelagic biomass correlated positively with pH, whereas Cervantes-Martinez et al. (Reference Cervantes-Martinez, Elías-Gutiérrez and Suárez-Morales2002) found a negative association between pH and planktonic biomass in open cenotes. The pH in these sinkholes was higher (8.3–10.2) than in our study where the maximum pH was 7.5. Assuming that neutral conditions are the best for plankton (Xu et al. Reference Xu, Jørgensen and Tao1999), the higher pH could become limiting for organisms in open cenotes but not in the studied caves.
Pelagic species richness was negatively correlated with physicochemical characteristics such as DO, salinity and redox potential. Cenotes can be influenced by saltwater intrusion depending on their location (Schmitter-Soto et al. Reference Schmitter-Soto, Comín, Escobar-Briones, Herrera-Silveira, Alcocer, Suárez-Morales, Elías-Gutiérrez, Díaz-Arce, Marín and Steinich2002). While we did not find a halocline in the studied cenotes, we found a negative association of salinity and plankton richness. Similarly, Cervantes-Martinez & Gutiérrez-Aguirre (Reference Cervantes-Martinez and Gutiérrez-Aguirre2014) found a negative association of conductivity which generally correlates with salinity, with zooplankton richness. Salinity is known to affect zooplankton richness in shallow brackish lakes (Brucet et al. Reference Brucet, Boix, Quintana, Jensen, Nathansen, Trochine, Meerhoff, Gascón and Jeppesen2010), but also in freshwater systems due to secondary salinity (James et al. Reference James, Cant and Ryan2003). Especially salinities over 1000 mg L−1 have negative effects on plankton abundance and richness in wetlands (Nielsen et al. Reference Nielsen, Brock, Vogel and Petrie2008). Most of the studied caves here have low salinity values (0.45–1.65 PSU) which might be caused by small saltwater intrusions, however the absence of a halocline leaves the origin of the salts unclear. The influence of the low salinity in our study suggests that plankton communities in closed cenotes are sensitive to salinity. Considering this, a likely explanation of decreasing plankton richness with increasing salinity could be that few species with higher salinity tolerances become dominant (Attayde & Bozelli Reference Attayde and Bozelli1998).
We did not find direct associations of bat numbers with plankton biomass, diversity or abundance. However, we found indications for potential indirect effects. There was a trend of increased pH with higher bat numbers. In turn, pH was positively correlated with pelagic biomass. Similarly, redox potential was both negatively associated with bat number and again negatively associated with pelagic richness. At the very least this suggests that bats could possibly be a contributing factor, although this remains to be confirmed. Furthermore, our models explained both biomass and richness better when the percentage of frugivores was included as a predictor variable. This variable captures variation in the composition of the different feeding guilds. The guano of bats from different feeding guilds has been shown to differ in nutrient concentrations (Emerson & Roark Reference Emerson and Roark2007, Studier & Wilson Reference Studier and Wilson1983) but probably also in composition of organic molecules. These different compounds might be consumed by different organisms resulting in a higher diversity. Although still speculative, supporting this hypothesis, we found that pelagic richness was lower when caves were dominated by frugivorous bats.
Effects on benthic communities were less clear from our analyses, possibly due to the relative rarity of benthic organisms. Both benthic biomass and diversity were low and both correlated positively with NH4 + concentrations. This positive association is probably due to bioturbation. Benthic invertebrates can increase N cycling rates as their burrowing activity makes organic matter and oxygen available for processing by microbiota (Kamp & Witte Reference Kamp and Witte2005) which makes ammonium more available (Stief Reference Stief2013). Few studies have tried to explain variation in benthic communities in cenotes and they generally focused on one faunistic group (Gonzalez et al. Reference Gonzalez, Borda, Carvalho and Schulze2012, van Hengstum et al. Reference Van Hengstum, Reinhardt, Beddows, Schwarcz and Gabriel2009), so a comparison is difficult. However, it was found that ostracods are the most abundant benthic group in sinkholes (Smirnov & Elías-Gutiérrez Reference Smirnov and Elías-Gutiérrez2011), while we did not find ostracods. Furthermore, most cyclopoids in cenotes are thought to be benthic (Fiers et al. Reference Fiers, Reid, Iliffe and Suárez-Morales1996, Schmitter-Soto et al. Reference Schmitter-Soto, Comín, Escobar-Briones, Herrera-Silveira, Alcocer, Suárez-Morales, Elías-Gutiérrez, Díaz-Arce, Marín and Steinich2002), whereas we found most cyclopoids in the plankton. However, methodology for sampling these faunistic groups varied between studies which might explain the differences. Another explanation might be that benthic communities differ between open and closed cenotes. However, more studies on benthos in closed cenotes are needed to confirm this. Benthic community structure was best explained by latitudinal position of the caves. This could theoretically be explained by small-scale geographic regionalism in benthic species with limited dispersal abilities. Not much is known about dispersal rates in the groundwater of Yucatán, but groundwater flow in the region is towards the coast in north-westerly direction (Bauer-Gottwein et al. Reference Bauer-Gottwein, Gondwe, Charvet, Marín, Rebolledo-Vievra and Merediz-Alonso2011). It is probably that the more northern cenotes in our study are connected to a different subterranean network compared with the more southern cenotes explaining the faunistic differences, but this remains to be confirmed.
Our main aim was to make a first report of aquatic invertebrate diversity, biomass and composition in closed cenotes that differ in the abundance and composition of roosting bat colonies. We could not find many direct links between bats and invertebrate communities. However, we detected a few significant associations and trends that suggest that these links could exist. Besides limitations of statistical power, several factors can help explain why relationships between bat abundances and cave biota are not expected to be simple. Cave structure including the catchment of the waterbodies and location of the colonies in relation to the water are factors that generate noise in the expected relationship between bats and aquatic biota. Bat guano is variable in nutrients and its composition depends on bat feeding guild (Emerson & Roark Reference Emerson and Roark2007). Detailed analyses of the chemical composition of guano including different organic compounds that are released during decomposition are necessary to understand their effect on aquatic biota. Experiments that test the influence of bat guano addition on invertebrate communities in mesocosms could be attempted to get more evidence. However, mesocosms do not fully reflect the ecosystem as the particular geology and hydrology of closed cenotes cannot be reproduced. Finally, although bat guano is by far the most plausible source of nutrients and organic biomass, stable isotope analysis could be used to confirm the importance of bat guano as the major source of nutrients compared with other potential sources such as influx of dead material and dead terrestrial animals.
Conclusions
Cenotes are special systems which harbour many endemic and as yet unknown species (Schmitter-Soto et al. Reference Schmitter-Soto, Comín, Escobar-Briones, Herrera-Silveira, Alcocer, Suárez-Morales, Elías-Gutiérrez, Díaz-Arce, Marín and Steinich2002). However, until now closed cenotes in the Yucatán Peninsula have remained largely unstudied. This study was a first attempt to understand ecological linkages of aquatic invertebrate communities by exploring patterns that could point at an importance of bats for ecosystems in these caves. While cenotes are important for bats (MacSwiney et al. Reference MacSwiney, Vilchis, Clarke and Racey2007), it was not clear whether bats also are important to support the oligotrophic system inside the caves via nutrient input from guano droppings. We could not find many direct associations between bat and invertebrate communities, but several associations suggest that these are probably not independent. More research is needed to understand ecological interactions in closed cenotes as this study only gives first insights.
Author ORCIDs
Bram Vanschoenwinkel, https://orcid.org/0000-0002-8973-6297
Acknowledgements
We would like to thank the Universidad Autónoma de Yucatán for the logistical support during fieldwork. Further we are grateful for the assistance of students of the Universidad Autónoma de Yucatán during data collection. Last, we would like to thank Giacomo Santini for his valuable feedback.
Appendix 1
List of fauna collected in plankton samples in 12 aquatic caves in Yucatán.

Appendix 2
List of fauna collected in benthos samples in 12 aquatic caves in Yucatán.