1. Introduction
Sub-ophiolitic dynamo-thermal soles or simply metamorphic soles are sheets of metamorphic rock of greenschist to amphibolite facies which are rather thin (< 500 m thick) and lie structurally below an ophiolite complex in many Tethyan-type ophiolites (Williams & Smyth, Reference Williams and Smyth1973; Jamieson, Reference Jamieson1986; Wakabayashi & Dilek, Reference Wakabayashi and Dilek2000, 2003). These soles are rocks of oceanic crust affinity and consist of metabasic rocks and some pelagic sediments. The degree of metamorphism seen in these rocks can be attributed to the high temperatures existing in the hot and conclusively recently formed oceanic crust above the sub-ophiolitic mantle (Wakabayashi & Dilek, Reference Wakabayashi and Dilek2000; Guilmette et al. Reference Guilmette, Hébert, Wang and Villeneuve2009). Based on the observations, such as geochemical nature of the protolith, their structural position below the ophiolites and their metamorphic signatures, tectonothermal soles are thought to have formed during the initiation of the subduction zones (Williams & Smyth, Reference Williams and Smyth1973; Malpas, Reference Malpas1979; Nicolas & Le Pichon, Reference Nicolas and Le Pichon1980; Spray, Reference Malpas1984; Jamieson, Reference Spray, Gass, Lippard and Shelton1986).
Experimental studies have shown that garnet amphibolites can withstand variable ranges of temperature and pressure of around 500–950°C and 0.8–1.5 GPa (existing metastably at higher pressure–temperature (P-T); Kohn & Spear, Reference Kohn and Spear1990; Surour, Reference Surour1995; Liu et al. Reference Liu, Shen and Geng1996; Dale et al. Reference Dale, Holland and Powell2000; Sánchez-Vizcaıno et al. Reference Sánchez-Vizcaıno, Gómez-Pugnaire, Azor and Fernández-Soler2003). They can therefore be used to represent different metamorphic conditions ranging from prograde metamorphism (Miyashiro, Reference Miyashiro1994; Surour, Reference Surour1995; Zhao et al. Reference Zhao, Cawood and Lu1999) to retrograde conditions following high-pressure/ultra-high-pressure (HP/UHP) metamorphism (Sánchez-Vizcaıno et al. Reference Sánchez-Vizcaıno, Gómez-Pugnaire, Azor and Fernández-Soler2003; Lou et al. Reference Lou, Wei, Liu, Zhang, Tian and Wang2013). Amphibolites can also be used to depict metamorphism related to the underplating of magmas derived from the mantle (Wu et al. Reference Wu, Zhao, Sun, Yin, He and Tam2013). The protoliths of these amphibolites can be basalts, volcano-sedimentary or even pelagic sediments, which can form in a variety of tectonic settings such as mid-oceanic ridges (MOR), island arcs or ocean islands. It can therefore be said that garnet amphibolite studies help us in understanding not only the petrogenetic mechanisms, but also aid in constraining the P-T evolution history of an area.
Conventional geothermobarometers such as the garnet-amphibole thermometer of Graham & Powell (Reference Graham and Powell1984), the plagioclase-amphibole thermometer of Holland & Blundy (Reference Holland and Blundy1994) or the garnet-hornblende-plagioclase-quartz barometer of Kohn & Spear (Reference Kohn and Spear1990) is mostly used in garnet amphibolites to establish their P-T conditions. However, there are limitations to this method as a result of the lack of solution models for the different kinds of amphiboles, bad correlations between the empirical constants (Dale et al. Reference Dale, Holland and Powell2000) and the fact that garnet amphibolites generally incorporate multistage formation of mineral assemblages that cannot be addressed by the conventional methods (Wei, Reference Wei2011; Lou et al. Reference Lou, Wei, Liu, Zhang, Tian and Wang2013). In contrast, calculation of phase equilibria with the help of iso-chemical phase diagrams can be considered as a more viable option since they not only give the conditions of formation of a particular assemblage, but also help in deducing a P-T path for the metamorphic evolution of given bulk composition (Moynihan & Pattison, Reference Moynihan and Pattison2013a; Kelly et al. Reference Kelly, Hoisch, Wells, Vervoort and Beyene2015; Qian & Wei, Reference Qian and Wei2016; Catlos et al. Reference Catlos, Lovera, Kelly, Ashley, Harrison and Etzel2018; Craddock Affinati et al. Reference Craddock Affinati, Hoisch, Wells and Vervoort2019; Etzel et al. Reference Etzel, Catlos, Ataktürk, Lovera, Kelly, Çemen and Diniz2019).
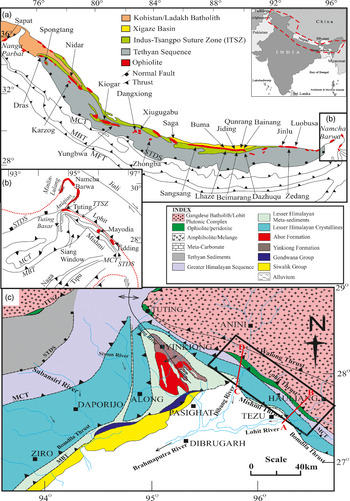
The Himalayan–Tibetan orogen extends from east to west and incorporates the Karakoram and Himalayan ranges to the south and Tibetan plateau in the north (Burg et al. Reference Burg, Brunel, Gapais, Chen and Liu1984; Burchfiel et al. Reference Burchfiel, Zhiliang, Hodges, Yuping, Royden and Changrong1992; Thakur & Rawat, Reference Thakur and Rawat1992; Yin & Harrison, Reference Yin and Harrison2000). The Indus–Tsangpo Suture Zone (ITSZ; Fig. 1a) is an E–W-trending suture zone formed as a result of the collision of the Indian and the Eurasian plates (Aitchison et al. Reference Aitchison, Xia, Baxter and Ali2011; Hébert et al. Reference Hébert, Bezard, Guilmette, Dostal, Wang and Liu2012), which led to the formation of the Himalayan orogen and the Tibetan plateau and the closure of the Tethys ocean (Hsü et al. Reference Hsü, Guitang and Sengör1995; Sengör & Natal’in, Reference Sengör and Natal’in1996; Hébert et al. Reference Hébert, Bezard, Guilmette, Dostal, Wang and Liu2012). The collision occurred during 70–50 Ma and is one of the parts of the Himalayan–Alpine system that is situated between the Mediterranean Sea towards the west and the Sumatra arc to the east (Yin & Harrison, Reference Yin and Harrison2000). Ophiolites are the remnants of the oceanic crust and mantle that are later emplaced onto orogenic belts during convergent tectonics (Gass, Reference Gass1968; Temple & Zimmerman, Reference Temple and Zimmerman1969; Moores, Reference Moores1970; Moores & Vine, Reference Moores and Vine1971; Church & Stevens, Reference Church and Stevens1971; Dewey & Bird, Reference Dewey and Bird1971). The ITSZ ophiolitic rocks delineate the Indian and Eurasian terranes and are the remnants of oceanic crust of Neotethyan age (Nicolas et al. Reference Nicolas, Girardeau, Marcoux, Dupre, Xibin, Yougong, Haixiang and Xuchang1981; Allegre et al. Reference Allegre, Courtillot, Tapponnier, Hirn, Mattauer, Coulon, Jaeger, Achache, Schärer, Marcoux and Burg1984; Reference Girardeau, Mercier and YougongGirardeau et al. 1985a, b; Hébert et al. Reference Hébert, Bezard, Guilmette, Dostal, Wang and Liu2012; Xu et al. Reference Xu, Dilek, Yang, Liang, Liu, Ba, Cai, Li, Dong and Ji2015). The Tuting–Tidding Suture Zone (TTSZ; Fig. 1b), a term given by Acharyya (Reference Acharyya, Ghosh and Varadarajan1987) for the eastern extension of the ITSZ (Thakur & Jain, Reference Thakur and Jain1975; Mitchell, Reference Mitchell1981; Acharyya, Reference Acharyya, Ghosh and Varadarajan1987; Singh & Choudhary, 1990; Gururajan & Choudhuri, Reference Gururajan and Choudhuri2003) is a NE–SW-trending narrow, discontinuous and steeply dipping zone (Fig. 1c) thrust upon the Greater Himalayan Sequence (GHS; Choudhuri et al. Reference Choudhuri, Gururajan and Singh2009). It is tectonically overlain by the magmatic-arc-related Lohit Plutonic Complex (LPC) separated by the Lohit Thrust (Nandy, 1973; Thakur & Jain, Reference Thakur and Jain1975). Rocks of ophiolitic affinity in the TTSZ exposed along the Lohit and Dibang river valleys in east Arunachal Pradesh, NE India, are said to have formed due to subduction in a marginal ocean basin (Singh & Singh, Reference Singh and Singh2011, Reference Singh and Singh2013).
Geological map of study area. (a) Simplified structural zones of Himalaya (from Ghose & Chatterjee, Reference Ghose and Chatterjee2014). MFT – Main Frontal Thrust; MBT – Main Boundary Thrust; MCT – Main Central Thrust; STDS – South Tibetan Detachment System. (b) Enlarged part of the Eastern Syntaxial Bends showing the east Arunachal Ophiolites (modified after Ghose & Chatterjee, Reference Ghose and Chatterjee2014). (c) Map showing the different lithotectonic divisions in the Eastern Himalaya (modified after Choudhuri et al. Reference Choudhuri, Gururajan and Singh2009).

Amphibolites are found in the area occurring as dismembered outcrops associated with the ultramafic rocks, metacarbonates and volcano-sedimentary units, hence considered part of the TTSZ ophiolite complex. Amphibolites existing at the soles of ophiolite complexes are said to be remnants of obduction initiation (Jamieson, Reference Jamieson1986; Boudier et al. Reference Boudier, Ceuleneer and Nicolas1988); study of the TTSZ amphibolites will therefore inform us about the processes involved during formation of the Neotethys ocean basin. The metamorphic history of ‘sole’ amphibolites yield knowledge about the subduction initiation processes and P-T conditions (Whitechurch et al. Reference Whitechurch, Juteau, Montigny, Dixon and Robertson1984; Hacker, Reference Hacker1994), while the P-T conditions existing during the obduction phase of the TTSZ ophiolites help to understand the dominant factors involved during ocean closure and aid in the geodynamic reconstruction of the ocean basins that evolved during Neotethyan time (Hässig et al. Reference Hässig, Galoyan, Bruguier, Rolland, Melis and Sosson2019). Until now, not much work has been done on the metamorphic soles of the ITSZ ophiolites, with the exception of the Xigaze ophiolite (Guilmette et al. Reference Guilmette, Hébert, Wang and Villeneuve2009; Zhang et al. Reference Zhang, Li, Sun, Wang and Duan2019). From the Himalayan orogen, Buckman et al. (Reference Buckman, Aitchison, Nutman, Bennett, Walsh, Saktura, Kachovich and Langlois2017) have reported the presence of amphibolitized meta-sediments in the Spongtang ophiolite, Ladakh, India, and designated them as the metamorphic sole rocks. They use these rocks in explaining the timing and nature of the India–Asia collision and obduction initiation. Apart from this, studies on metamorphic sole rocks in the Himalayan belt are scarce.
Petrogenetic and metamorphic studies of the TTSZ amphibolites will therefore give us basic knowledge about the generation of the Neotethyan oceanic crust, and its subsequent metamorphism during subduction initiation followed by possible changes encountered during obduction of the ophiolites. This study will help to further unravel similar processes which might have occurred in the other metamorphic sole rocks existing throughout the Himalayan belt. Pseudosection modelling using garnet cation concentration changes provides a precise and dependable metamorphic record for convergent tectonic environments (Moynihan & Pattison, Reference Moynihan and Pattison2013a, b; Kelly et al. Reference Kelly, Hoisch, Wells, Vervoort and Beyene2015; Catlos et al. Reference Catlos, Lovera, Kelly, Ashley, Harrison and Etzel2018), which is why we use this technique on the garnet-bearing amphibolites of the TTSZ ophiolites. We also discuss the tectonic environment of the formation and further emplacement of these amphibolites during obduction.
2. Geology of the area
Along the Lohit and Dibang valleys in Arunachal Himalaya, India, ophiolitic rocks are exposed as a continuous belt with outcrops at Tidding and Mayodia, respectively, becoming discontinuous further NW and reappearing again at Tuting in the Siang valley (Figs 1c, 2a, b; Choudhuri et al. Reference Choudhuri, Gururajan and Singh2009). They belong to the eastern part of the East Syntaxial Bend. Unlike the western part, in the eastern part the Lesser and Greater Himalayan Crystalline sequences occur as narrow zones, whereas the Lesser Himalayan sedimentary unit and the Tethys Himalayan sediments are completely absent. The TTSZ rocks lie in direct contact with the LPC separated by the Lohit Thrust in the NE and with the Greater Himalayan Gneisses separated by the Tidding thrust in the SW (Gururajan & Choudhuri, Reference Gururajan and Choudhuri2003, Reference Gururajan and Choudhuri2007; Quanru et al. Reference Quanru, Guitang, Zheng, Chen, Fisher, Sun, Ou, Dong, Wang, Li and Lou2006; Choudhuri et al. Reference Choudhuri, Gururajan and Singh2009). The suture zone rocks show three stages of deformation (Choudhuri et al. Reference Choudhuri, Gururajan and Singh2009). D1 has been related to ophiolite obduction and is manifested by the S1 schistosity. D2 is represented by isoclinal F2 folds, having axial planar foliation S2. The last stage, D3, is observed by the open F3 folds that were related to the formation of the Siang antiform. The ultramafic rocks of the suture zone have been serpentinized to variable degrees and the basic rocks have been metamorphosed to amphibolites. Further, the carbonates associated with the ophiolite complex have also been metamorphosed to marble (Gururajan & Choudhuri, Reference Gururajan and Choudhuri2003, Reference Gururajan and Choudhuri2007; Choudhuri et al. Reference Choudhuri, Gururajan and Singh2009; Misra, Reference Misra2009). Geochronology studies for the LPC reveal zircon U–Pb crystallization ages of 148 and 110 Ma, that is, Late Jurassic – Early Cretaceous (Lin et al. Reference Lin, Chung, Kumar, Wu, Chiu and Lin2013). These ages coincide with those obtained for the Ladakh batholith (Ravikant et al. Reference Ravikant, Wu and Ji2009; Bouilhol et al. Reference Bouilhol, Schaltegger, Chiaradia, Ovtcharova, Stracke, Burg and Dawood2011) and Gangdese batholith (Chu et al. Reference Chu, Chung, O’Reilly, Pearson, Wu, Li, Liu, Ji, Chu and Lee2011), suggesting that all three (LPC, Ladakh and Gangdese Batholith) are part of the same magmatic arc complex that formed prior to the India–Asia collision as a result of the subduction of the Neo-Tethyan oceanic crust (Chu et al. Reference Chu, Chung, Song, Liu, O’Reilly, Pearson, Ji and Wen2006; Ji et al. Reference Ji, Wu, Chung, Li and Liu2009; Lin et al. Reference Lin, Chung, Kumar, Wu, Chiu and Lin2013).
Lithological section of (a) the Dibang valley and (b) the Lohit valley (after Choudhuri et al. Reference Choudhuri, Gururajan and Singh2009). Vertical cross-section of (c) the Dibang valley along the line CD and (d) the Lohit valley along the line AB (after Choudhuri et al. Reference Choudhuri, Gururajan and Singh2009) Sample locations are marked with purple stars in (a) and (b).

Dismembered units of ultramafic rocks intruded at places by mafic dykes exposed along the Lohit and Dibang river sections are called Tidding and Mayodia ophiolites, respectively (Thakur, Reference Thakur1998; Gururajan & Choudhuri, Reference Gururajan and Choudhuri2007). They lie in association with amphibolites and carbonates (Singh & Malhotra, Reference Singh and Malhotra1983; Acharyya, Reference Acharyya, Ghosh and Varadarajan1987) in the downstream direction of the Lohit and Dibang rivers. The lithology of the Tidding and Mayodia ophiolites consists of metavolcanics, amphibolites and limestones in continuous succession with variably serpentinized ultramafic bodies that are intruded by a few mafic dykes and gabbros (Fig. 2a–d). The rocks are intruded at many places by quartzite veins (Choudhuri et al. Reference Choudhuri, Gururajan and Singh2009). The whole section has been metamorphosed, possibly during the obduction of the ophiolites during the Himalayan orogeny. Earlier authors correlated the Tidding ophiolites and its associated metavolcanic sequences to the Indus and other Alpine ophiolites and the Dras island-arc volcanic, respectively (Sharma et al. Reference Sharma, Choubey and Chatti1991). Cr-spinel studies for the serpentinites of Tidding ophiolite suggest their origin in a convergent setting during the initial stages of subduction (Singh & Singh, Reference Singh and Singh2011). Studies conducted on the amphibolites and metabasalts of the Mayodia ophiolites reveal their affinity towards MOR basalt (MORB; Ghosh et al. Reference Ghosh, Mahoney and Ray2007).
Garnet-bearing amphibolites are observed in the Tidding section and occur as dismembered (< 500 m) bodies associated with meta-carbonates and volcano-sedimentary rocks (Fig. 2). Amphibolites without garnet (garnet-absent) are observed in both the Tidding and Mayodia ophiolite sections (Table 1) and occur in similar associations. The amphibolites, along with the meta-carbonate and volcano-sedimentary units, occur as part of a folded ophiolite sequence flanking on both sides of the ultramafics (Fig. 2a–d) and tectonically underlain by the graphite schist of the GHS (also known as the Mishmi Crystalline in the area). The Tidding thrust separates the GHS and the amphibolites of the TTSZ ophiolite complex (Figs 1c, 2a–d; Sharma et al. Reference Sharma, Choubey and Chatti1991; Ghosh & Ray, Reference Ghosh and Ray2003; Gururajan & Choudhuri, Reference Gururajan and Choudhuri2003, Reference Gururajan and Choudhuri2007; Ghosh et al. Reference Ghosh, Mahoney and Ray2007; Choudhuri et al. Reference Choudhuri, Gururajan and Singh2009; Misra, Reference Misra2009). The field relationship therefore suggests that these rocks are part of the metamorphic sole of the TTSZ ophiolites.
Amphibolite samples from the Tuting-Tidding Suture Zone (TTSZ) ophiolites used in the study

3. Sampling and petrography
Sampling was performed on both the traverses (Tidding and Mayodia). Both these traverses are mostly covered in dense vegetation, and outcrops occur as isolated bodies that are often weathered, rather than existing as a single continuous unit. Two samples of garnet-bearing amphibolite (AML 7A and AML 9A) and two samples of garnet-absent amphibolite (AML 1B and AML 10B) were collected from the Tidding ophiolite section. The garnet-bearing amphibolite occurs in contact with meta-carbonates (also known as Tidding limestone; Gururajan & Choudhuri, Reference Gururajan and Choudhuri2003) of the TTSZ ophiolites. The garnet-absent amphibolites occur: (1) as a dismembered outcrop near the vicinity of volcano-sedimentary rocks of the TTSZ ophiolites (AML 1B) and (2) in between the ultramafic rocks of the TTSZ ophiolites and the garnet-bearing amphibolites (AML 10B). Garnet-bearing amphibolites were not encountered in the Mayodia ophiolite section. Three samples of garnet-absent amphibolites (KMH 7, KMH 8A and KMH 8B) were therefore collected from this section. These samples were also collected from dismembered outcrops which lay in between the ultramafics and the meta-carbonates of the TTSZ ophiolites. The detailed sample locations of all the samples are provided in Table 1. Petrography studies were conducted on all the collected samples. We provide detailed descriptions of four samples that show representative mineral assemblages and textures in the following sections.
3.a. Garnet-bearing amphibolites
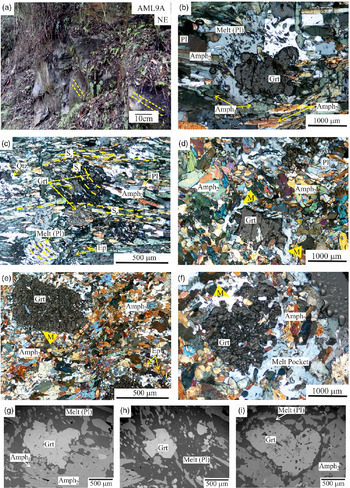
Two samples of garnet-bearing amphibolites (AML 7A and AML 9A) were studied in detail. Both the samples were collected from near the Tidding Bridge in the Tidding ophiolite section, and occur in association with the Tidding Limestone (Fig. 3a). Both samples consist of amphibole, epidote, plagioclase, garnet and quartz, with sphene as accessory phases. Sample AML 7A shows well-defined foliation (Se) marked by the amphibole and epidote grains (Figs 3b, c). Based on their optical properties, the amphiboles can be classified as one of two types: amphibole1 and amphibole2. Amphibole1 appears pale green in colour (300–600 µm in length) and amphibole2 is bluish-green in colour in plane-polarized light (500–800 µm in length). Moreover, amphibole1 shows second-order pale-blue-green interference, whereas amphibole2 shows a second-order pale-yellow to pale-pink interference. Although amphibole1 is less abundant than amphibole2, both appear to be part of the main foliation layer (Se; Fig. 3b). Epidotes are present as small grains within the foliations. Among the foliations are globular felsic patches around which the foliation appears warped (Fig. 3b, c). These patches lack a proper grain boundary and contain small polymineralic inclusions (Fig. 3b, c) and garnets with lobate boundaries (Fig. 3b) inside them. These observations help to designate them as melt patches, which might have formed due to the breakdown of the inclusion minerals and garnets. These melt patches have crystallized to form plagioclase as observed from the Carlsbad twinning in a single melt patch (Fig. 3b, Melt(pl)). The melt patches contain very small-sized polymineralic inclusions (Fig. 3b, c). The inclusions are so small that they are not discernible either under a microscope or with the help of an electron-probe micro-analyser (EPMA) study. These inclusions form a trail (Si) that is oblique to the main foliation pattern (Fig. 3c). Garnet exists completely enclosed within the melt patches (Fig. 3b, c, g, h). Garnet grains are euhedral to anhedral in shape with an approximate size of 300–500 µm, and are devoid of inclusions. The presence of garnets completely surrounded by the melt patches indicates that these melts formed at a later stage relative to the garnet grains (Fig. 3b, c). Plagioclase and quartz exist as small grains in the interfolial domains (Fig. 3c).
(a) Field photograph of a representative garnet amphibolite (AML 9A). The rock shows a NE-dipping foliation at around 45°. Yellow lines mark the foliation. (b–f) Photomicrographs of the garnet amphibolites. (b) Garnet with embayed margins occurring inside a melt patch crystallized to plagioclase (Melt(Pl)). This melt patch shows polymineralic inclusion trail (AML 7A). (c) Melt patches showing internal foliation (Si) defined by polymineralic inclusions and surrounded by external foliation (Se) of amphibole1, amphibole2 and epidote (AML 7A). (d) Garnet grain with corroded boundaries and surrounded by melt film; amphibole1 is also observed (AML 9A). (e) Highly fractured garnet grain with a thin melt film around it (AML 9A). (f) Fractured and broken garnet with corroded boundaries surrounded by melt patches (AML 9A). Back-scattered electron (BSE) images of garnets from (g, h) AML 7A and (i) AML 9A. Mineral abbreviations after Kretz (Reference Kretz1983).

Although sample AML 9A is similar in mineralogy to sample AML 7A, the former shows very weak foliation compared with the latter. Garnets occur as large porphyroblasts surrounded by an equigranular matrix of amphibole, epidote and plagioclase. Garnets are highly fractured, around 400–600 µm in size, broken with corroded boundaries and contain few small-sized inclusions (Fig. 3d–f, i). An interesting feature is the observation of melt films surrounding the garnets (Fig. 3d, e). The amphiboles are either subhedral in shape with prominent two-set cleavage or anhedral with no cleavage (Fig. 3d). Epidote grains can be observed scattered throughout the thin-section, adjacent to the amphibole grains (Fig. 3e).
From the petrography of the garnet-bearing amphibolites, we can deduce that the rocks underwent at least two stages of deformation (D1 and D2); D1 is observed from the foliation in the inclusions of the melt patches (Si) and D2 marks the main foliation (Se). The melt signatures in both the samples indicate that the rocks underwent partial melting conditions. The development of the main foliation in the rock might have occurred during the D2 event. It can further be suggested that mineral inclusions marking Si and garnet were formed at an earlier stage prior to the partial melting, and the main foliation minerals such as amphibole, epidote and sphene, may have developed later.
3.b. Garnet-absent amphibolites
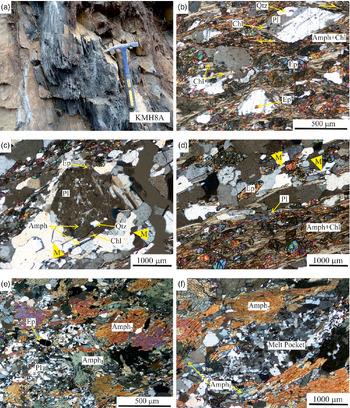
These amphibolites were collected from both the Tidding (Fig. 4a) as well as the Mayodia sections. Two representative samples are discussed in detail. Both samples consist of amphibole, epidote, plagioclase, quartz and chlorite, with sphene as an accessory phase. Sample AML 1B collected from the Tidding ophiolite section exhibits dominant foliation marked by the amphibole and chlorite minerals (Fig. 4b–d). The interfolial domains are marked by plagioclase and quartz. Epidote grains occur in the folial as well as in the interfolial domains (Fig. 4c). Plagioclase grains are deformed and show a right-lateral sense of shear (Fig. 4b). Chlorite can be observed in the tail of the sheared plagioclase grains (Fig. 4b, c). Epidote and amphibole inclusions are observed in plagioclase, suggesting that epidote formed prior to the plagioclase grains (Fig. 4b, c). The interfolial domains show remnants of partial melting that are distinguished by characteristic melt microstructural features such as former melt pools with blocky outlines, tongue-like melt protrusions and linked anatectic melt pools (Sawyer, Reference Sawyer2001; Fig. 4c, d).
(a) Field photograph of a garnet-absent amphibolite (KMH 8A). (b–f) Photomicrographs of garnet-absent amphibolites. (b) Sheared plagioclase grains showing right-lateral sense of shear. Chlorite can be observed in the strain shadow domain of the plagioclase grain (AML 1B). (c) Interfolial domain showing large plagioclase grains with inclusions of amphibole and quartz (AML 1B). (d) Amphibolite showing the main foliation of hornblende and chlorite with epidote and the interfolial domain consisting of quartz and feldspar (AML 1B). (e) Large grains of amphibole2 in a matrix of plagioclase, epidote and amphibole1 (KMH 8A). (f) Amphibolite with large grains of amphibole2 with a lens of melt pockets at the centre (KMH 8A). Mineral abbreviations after Kretz (Reference Kretz1983).

The second sample, KMH 8A, was collected from the Mayodia ophiolite section and shows weak foliation unlike sample AML 1B. The amphiboles that make up the main foliation are of two types: amphibole2 exists as porphyroblasts (600–1200 µm in length) and are situated adjacent to the melt pockets, while amphibole1 occurs as anhedral grains with corroded boundaries (200–400 µm in length), adjacent to amphibole2 (Fig. 4e, f). Melt pockets are randomly distributed throughout the thin-section (Fig. 4f). From the above observations, we can clearly determine a single deformation event for the garnet-absent amphibolites; this event can be correlated with the D2 event observed in the garnet-bearing amphibolites. The presence of melt pockets and other melt microstructures corresponds to the melting signatures observed in the garnet-bearing amphibolites, while the formation of chlorite at the strain shadow zones of plagioclase (Fig. 4b) can be related to a later event.
4. Analytical techniques and methodology
4.a. Whole-rock major oxides
The samples were collected from both Tidding as well as the Mayodia ophiolite sections (Table 1). The presence of garnet in the Tidding section amphibolites makes it more significant in the study of the metamorphism. For the whole-rock major- and trace-element studies, samples were powdered using an agate-disc-incorporated laboratory disc mill, which was then converted into sample pellets. All the major oxides (SiO2, Al2O3, MgO, Na2O, K2O, CaO, TiO2, P2O5, MnO and Fe2O3) along with the majority of trace elements (Sc, Co, Ni, Ba, Cr, V, Cu, Zn, Ga, Sr, Pb, Zr, Rb, Y and Nb) were analysed at Wadia Institute of Himalayan Geology (WIHG), Dehradun, using X-ray fluorescence (XRF) spectroscopy using the Bruker S8 TIGER. The international standards used for calibration of the instrument and validation of samples were BIR-1 (basalt; USGS), MRG-1 (gabbro; CCRMP) and W-1 (diabase; USGS). The error percentage for the trace elements lies between ±2 and ±3% and for the major elements between ±5 and ±6%. Calibration coefficients for the analyses were derived using a modified model after Lucas-Tooth & Pyne (Reference Lucas-Tooth and Pyne1964) which included matrix correction based on intensities. The loss on ignition (LOI) was calculated by heating 5 g of the powdered sample at 150°C to remove any adsorbed water present in the sample, since the study area experiences heavy rainfall (c. 2000 mm annually). This was followed by heating the samples at 850°C.
4.b. Whole-rock REE and trace elements
The rare earth elements (REEs), along with Hf, Ta, Th and U, were analysed using the inductively coupled plasma – mass spectrometer (ICP-MS) PerkinElmer SCIEX ELAN RDC-e in the same institute. The international standards BHVO_1 (basalt; USGS), JB1a (basalt; GSJ), JB-2 (basalt; GSJ) and JB3 (basalt; GSJ) were used for instrument calibration and sample validation. Approximately 0.1 g of powdered sample (<200 mesh) was mixed with 20 mL of HF + HNO3 (2:1 ratio) and c. 2 mL of HClO4 in Teflon crucibles. The crucibles were then heated over a hot plate until the samples were fully digested and dried to form a paste. This was followed by the addition of 20 mL of 10% HNO3 to the sample, which was left on a hot plate for 10–15 minutes until a clear solution was obtained. The clear solution was made up to 100 mL final volume with milli-Q water and analysed by ICP-MS. The analytical precision for the REEs lies between 1 and 8% and the accuracy of analyses is around 2–12%.
4.c. Mineral chemistry
Mineral chemistry studies of selected mafic and ultramafic rocks were performed at the Department of Geology, Banaras Hindu University (BHU), Varanasi using electron microprobe CAMECA SX-5. SX-5 software was used to operate the instrument with the use of a 10 nA current and 15 kV acceleration voltage. For the generation of the electron beam, an LaB6 electron source was used with a beam diameter of 1 μm. The crystal positions (SP1-LiF, SP2-TAP, SP3-LPET, SP4-LTAP and SP5-PC1) with respect to their corresponding wavelength dispersive spectrometer (WDS) were verified using the natural silicate andradite. For calibration and quantification, natural mineral standards, namely periclase, barite, corundum, fluorite, halite, apatite, orthoclase, wollastonite, rutile, rhodonite, haematite chromite, celestine and pure metal V, Ni and Zn standards for Zn, V and Ni supplied by CAMECA-AMETEK were used. The analytical precision for major-element oxides is around 1% and for trace elements around 5%.
4.d. P-T pseudosection modelling
Isochemical phase diagrams or pseudosections were constructed using the software Perple-X v. 6.8.6 (Connolly, Reference Connolly2005; downloaded from http://www.perplex.ethz.ch/) for the garnet-bearing amphibolites to calculate their metamorphic P-T path. The pseudosections were calculated in the MnNCFMASHT (MnO-Na2O-CaO-FeO-MgO-Al2O3-SiO2-H2O-TiO2) system, where all the Fe is considered divalent and P2O5 and K2O were removed due to their negligible amount. The calculations were performed using the dataset of Holland & Powell, Reference Holland and Powell1998 (updated in 2011) for the minerals and water (CORK model; Holland & Powell, Reference Holland and Powell1991, Reference Holland and Powell1998). The solution models used for the various elements were taken from the download file, solution_model.dat. The solution models used are as follows: Gt(HP) for garnet (Holland & Powell, Reference Holland and Powell1998), Pl(h) for plagioclase (Newton et al. Reference Newton, Charlu and Kleppa1980), non-ideal mixing model GlTrTsPg for amphibole (Glaucophane + Tremolite + Tschermakite + Pargasite + Fe2+-bearing components) (Holland & Powell, Reference Holland and Powell1998), Chl(HP) for chlorite (Holland & Powell, Reference Holland and Powell1998), ideal mixing IlGkPy for ilmenite (Holland & Powell, Reference Holland and Powell1998), Omph(HP) for clinopyroxene (diopside-hedenbergite-jadeite, which takes into account both cation-ordered and cation-disordered structures) and Ep(HP) for clinozoisite-epidote (Holland & Powell, Reference Holland and Powell1998). The melt model melt(G) (Green et al. Reference Green, White, Diener, Powell, Holland and Palin2016) was used, since this model was proposed specifically for metabasic rocks.
5. Results
5.a. Whole-rock geochemistry
The analysed samples (Table 2) show very low LOIs of around 0.51–2.80 wt%, indicating that they have not been altered significantly. The studied rocks fall in the basalt field in the total alkali silica (TAS) diagram (Fig. 5a; Le Maitre, Reference Le Maitre1984; Le Bas et al. Reference Le Bas, Le Maitre and Woolley1992), suggesting a sub-alkaline nature for these rocks. Sub-alkalinity can also be determined from their extremely low ratios of Nb/Y (<0.3; Fig. 5b; Winchester & Floyd, Reference Winchester and Floyd1976). The Zr versus P2O5 plot (Fig. 5c) of Winchester & Floyd (Reference Winchester and Floyd1976) highlights the tholeiitic affinity of these rocks. The rocks have moderate values of SiO2 (47.71–64.30 wt%) and low MgO (23.81–48.58 wt%), which is generally found in tholeiitic basalts. The tholeiitic trend of the studied samples is also corroborated on a plot of SiO2/Al2O3 versus Mg no. (Kempton & Harmon, Reference Kempton and Harmon1992; Fig. 5d), ruling out the possibility of their cumulate origin or having crystallized from an ultramafic magma source. The samples contain a low to moderate amount of TiO2 (0.61–1.60 wt%) and CaO (3.82–10.27 wt%). The Fe2O3 (5.64–15.24 wt%) and Na2O (2.66–6.13 wt%) values show large variations, while P2O5 (0.07–0.16 wt%) contents are comparatively low with minor variations. Zr concentrations show a positive correlation with Na2O and TiO2, while there is a negative correlation between Zr and CaO and MgO (figure not shown). Such trends correspond to those observed when a basaltic magma crystallizes fractionally (Wang et al. Reference Wang, Aitchison, Lo and Zeng2008). A positive trend for TiO2 indicates an increase in the formation of the Ti-bearing oxides, which is also seen from the SiO2/Al2O3 versus Mg no. plot (Kempton & Harmon, Reference Kempton and Harmon1992) (Fig. 5d). Negative correlations of CaO and MgO suggest early crystallization and separation of phases such as olivine and Ca-bearing feldspars during the differentiation of magma.
Whole-rock compositions of representative amphibolites from the TTSZ ophiolites

(a) Total alkali silica (TAS) diagram (after Le Maitre, Reference Le Maitre1984; Le Bas et al. Reference Le Bas, Le Maitre and Woolley1992). The dashed line separating alkaline from sub-alkaline rocks is from Irvine & Baragar (Reference Irvine and Baragar1971). Field of mafic rocks of Nidar ophiolite from Ahmad et al. (Reference Ahmad, Tanaka, Sachan, Asahara, Islam and Khanna2008) and field of amphibolites from Xigaze ophiolites from Guilmette et al. (Reference Guilmette, Hébert, Wang and Villeneuve2009). (b) Zr/Ti versus Nb/Y plot for classification of volcanic rocks (after Winchester & Floyd, 1997). from Ahmed et al. (2008). (c) P2O5 versus Zr plot (after Winchester & Floyd, Reference Winchester and Floyd1977). The field of Dong Tso amphibolites from Wang et al. (Reference Wang, Aitchison, Lo and Zeng2008). (d) Mg no. versus SiO2/Al2O3 plot, showing various differentiation trends (after Kempton & Harmon, Reference Kempton and Harmon1992). Symbols as for (c).

In the chondrite-normalized plot of REE (normalizing values from Sun & McDonough, Reference Sun, McDonough, Saunders and Norry1989), it is observed that the samples show resemblance to normal- (N-) and enriched- (E-) MORB values (Sun & McDonough, Reference Sun, McDonough, Saunders and Norry1989; Fig. 6a), where the garnet-bearing amphibolites resemble N-MORB and garnet-absent amphibolites resemble E-MORB. Sample AML 10B shows comparatively high light REEs (LREEs) than the other samples, indicating some sort of enrichment. The heavy REEs (HREEs) pattern of the sample is very similar to the depleted to enriched MORB rocks of the Manipur Ophiolite Complex (MOC; Khogenkumar et al. Reference Khogenkumar, Singh, Singh, Khanna, Singh and Singh2016) in NE India adjacent to the TTSZ ophiolites. The total REE abundance of the samples ranges between 41.05 and 80.21. The samples show slight LREE depletion with a fractionated LREE/MREE ((La/Sm)N = 0.47 to 2.05) and can be compared with MORBs, which form due to the partial melting of a depleted mantle source (Slater et al. Reference Slater, McKenzie, Grönvold and Shimizu2001; Niu et al. Reference Niu, Regelous, Wendt, Batiza and O’Hara2002). Compared with HREE, both LREE and middle REEs (MREE) show mild fractionations ((La/Yb)N = 0.39 to 3.13; (Sm/Yb)N = 0.81 to 1.53). On an N-MORB normalized spider diagram (normalizing values from Sun & McDonough, Reference Sun, McDonough, Saunders and Norry1989; Fig. 6b), samples show depletion in Nb and Ta with enrichment in La, Th and Zr.
(a) Chondrite-normalized REE plot for the TTSZ amphibolites. Note that the garnet-bearing amphibolites show a trend similar to N-MORB, whereas garnet-absent amphibolites show trends similar to E-MORB. The field of Xigaze amphibolites is from Guilmette et al. (Reference Guilmette, Hébert, Wang and Villeneuve2009) and MORB field of the Maniput Ophiolite Complex (MOC) is from Khogenkumar et al. (Reference Khogenkumar, Singh, Singh, Khanna, Singh and Singh2016). (b) N-MORB normalized multi-element spider plot for the TTSZ amphibolites. MORB field of the MOC is from Khogenkumar et al. (Reference Khogenkumar, Singh, Singh, Khanna, Singh and Singh2016) and MORB field of Neotethyan ophiolites of western Turkey is from Aldanmaz et al. (Reference Aldanmaz, Yaliniz, Güctekin and Göncüoğlu2008). Normalizing values and REE patterns of N-MORB and E-MORB are from Sun & McDonough (Reference Sun, McDonough, Saunders and Norry1989).

Positive correlations of Y, La, Yb, Sm with Zr (figure not shown) suggest that they were not mobilized much during hydrothermal alteration (Photiades et al. Reference Photiades, Saccani and Tassinari2003). In a plot of V versus Ti/1000 (Shervais, Reference Shervais1982), the samples fall in the MORB and back-arc basin basalts (BABB) field (Fig. 7a), which corresponds to the Zr versus Ti plot of Pearce (Reference Pearce1982) where the samples fall mainly in the MORB field (Fig. 7b). Zr/Y ratios vary systematically in different tectonic settings; for example, their ratios are slightly lower in island-arc magmas compared with MORBs (Pearce & Norry, Reference Pearce and Norry1979). In a plot of Zr versus Zr/Y (Fig. 7c; Pearce & Norry, Reference Pearce and Norry1979), the samples fall in the field of MORBs. In a plot of Zr/Yb versus Nb/Yb (Fig. 7d; Pearce & Peate, Reference Pearce and Peate1995), which discriminates between different petrogenetic sources, the samples fall in the areas around N-MORB and E-MORB. MORBs show very low ratios of Rb/Y and Th/Zr; Rb/Y versus Nb/Y and Th/Zr versus Nb/Zr (Zhao & Zhou, Reference Zhao and Zhou2007) were therefore plotted for the amphibolites, and it was observed that in both plots the samples fall in the field of MORBs (Fig. 8a, b). In the plots of (Ce/Yb)N versus (Dy/Yb)N and La versus Nd (Fig. 8c, d), the samples fall mainly in the East Rift MORB and N-MORB fields of Haase & Dewey (Reference Haase and Dewey1996) & Aldanmaz et al. (Reference Aldanmaz, Yaliniz, Güctekin and Göncüoğlu2008), respectively.
(a) V versus Ti/1000 plot (after Shervais, Reference Shervais1982). (b) Zr versus Ti plot (after Pearce, Reference Pearce1982). (c) Zr/Y versus Zr plot (after Pearce & Norry, Reference Pearce and Norry1979). (d) Zr/Yb versus Nb/Yb plot (after Pearce & Peate, Reference Pearce and Peate1995). The tholeiitic basalts plot near the N-MORB region while the slightly andesitic basalts plot above the E-MORB region, indicating enrichment from a subduction component. The N-MORB, E-MORB and ocean-island basalt (OIB) values are from Sun & McDonough (Reference Sun, McDonough, Saunders and Norry1989). Symbols as for Figure 5(c).

(a) Plot of Nb/Zr versus Th/Zr (after Zhao & Zhou, Reference Zhao and Zhou2007). (b) Plot of Rb/Y versus Nb/Y (after Zhao & Zhou, Reference Zhao and Zhou2007). Field of Kamchatka lavas is from Kepezhinskas et al. (Reference Kepezhinskas, McDermott, Defant, Hochstaedter, Drummond, Hawdesworth, Koloskov, Maury and Bellon1997). (c) (Dy/Yb)N versus (Ce/Dy)N plot (after Haase & Dewey, Reference Haase and Dewey1996) showing the different petrogenetic sources with their meting trends. Melting starts with garnet lherzolite at the top and ends at spinel lherzolite at the bottom. The field of East Rift MORB field is also from Haase & Dewey (Reference Haase and Dewey1996) and the MORB field of the MOC is from Khogenkumar et al. (Reference Khogenkumar, Singh, Singh, Khanna, Singh and Singh2016). (d) La versus Nd plot with curves depicting continuous partial melting of a single source for both enriched and depleted mantle components. The dotted line shows the trend observed in the MOC lavas (Khogenkumar et al. Reference Khogenkumar, Singh, Singh, Khanna, Singh and Singh2016). Fields for N-MORB and OIB are from Aldanmaz et al. (Reference Aldanmaz, Yaliniz, Güctekin and Göncüoğlu2008). Symbols as for Figure 5(c).

5.b. Mineral chemistry
Since the TTSZ amphibolites are divided into two types based on the presence of garnets, we provide their mineral chemistry in separate tables. The data from the samples are given in Tables 3–6.
Representative microprobe analyses for garnet from amphibolites of the TTSZ ophiolites

Representative microprobe analyses for epidotes and chlorite from amphibolites of the TTSZ ophiolites

5.b.1. Garnet-bearing amphibolites
The main mineral assemblage of the garnet amphibolite samples (AML 7A, Fig. 3 g, h; AML 9A, Fig. 3i) is garnet, amphibole, plagioclase, epidote and quartz, with sphene and chlorite as the accessory phases. Although a few garnet grains do not show fractures (Fig. 3b, c), most of them are broken and highly fractured (Fig. 3d–f). However, points were taken from each area of the broken grains and at intervals of around 30 µm from the intact grains to note any difference in composition. The data are given in Tables 3–6. Even though the garnets do not vary much in their composition, there is a slight difference between the garnets of sample AML 7A and those of AML 9A. The garnets observed in sample AML 7A show a slight compositional difference from centre to edge. The compositions at the centre of the AML 7A garnets are XAlm = 0.54, XGrs = 0.29 to 0.30, XPy = 0.03 and XSpss = 0.13 to 0.14, while those from the edge are XAlm = 0.44 to 0.58, XGrs = 0.36 to 0.45, XPy = 0.01 to 0.04 and XSpss = 0.03 to 0.11. In comparison, all the garnets from sample AML 9A have similar compositions throughout the garnet grain with no centre and edge differences, with XAlm = 0.48 to 0.57, XGrs = 0.33 to 0.43, XPy = 0.07 to 0.09 and XSpss = 0.01 to 0.06. They are generally poor in TiO2 (0.07–0.29 wt%, except in one point from garnet centre with 1.41 wt%) with very little to no Cr2O3 (0.00–0.07 wt%). Amphibole compositions range from tschermakite hornblende to actinolite (Fig. 9). Based on the difference between the two types of amphiboles in the petrography, it is interpreted that the actinolite-hornblende is amphibole1 while the tschermakite-hornblende and magnesio-hornblende are amphibole2. The Al2O3 content does not vary by much, and ranges between 9.20 and 13.41 wt%; the Mg no. remains fairly constant across all of the samples (0.49–0.53 for tshermakitic and magnesio-hornblendes and 0.61–0.67 for actinolite hornblende). Average CaO values are quite high and fall between 9.00 and 11.48 wt%; average Na2O is around 1.87–2.25 wt%. The matrix plagioclase is highly albitic (XAb = 0.82 to 0.87) with very little anorthite content. The analyses obtained from the melt patches show that the melts are purely albitic, with XNa in falling in the range of 0.95–1.00. Epidotes are secondary in nature, which is apparent from their textural positions within the foliations and the interfolial domains. The pistacite content (Ps = [Fe3+/(Fe3++Al)]×100) is around 15%, and TiO2 contents are low at around 0.07–0.14 wt%.
Amphibole classification plot after Leake (Reference Leake1978) showing a variety of amphiboles observed in the TTSZ amphibolites, ranging from tschermakite hornblende up to actinolite. Symbols as for Figure 5(c).

5.b.2. Garnet-absent amphibolites
Two samples from the epidote amphibolites KMH 8A and KMH 8B were studied for mineral chemistry; data are given in Tables 3–6. These amphibolites are devoid of garnet and contain amphibole, melt pockets (crystallized to plagioclase and quartz), epidote and chlorite as major phases, with sphene as an accessory. The amphiboles plot between the magnesio-hornblende and actinolite fields of Leake (Reference Leake1978) classification diagram (Fig. 9). As for the garnet-bearing amphibolites, the actinolite-hornblende and actinolite is amphibole1 and the magnesio-hornblendes are amphibole2. They have Mg no. values ranging between 0.57 and 0.74 with low TiO2 (0.15–0.49 wt%) and high Al2O3 (5.21–15.93 wt%). They generally have high Ca and variable (Na+K) contents (0.85–1.86 and 0.25–1.85, respectively). Melt pockets that have crystallized to plagioclase are albitic with XNa between 0.94 and 1.00. Epidotes have Ps values of around 15% and TiO2 around 0.2 wt%, similar to the epidotes in garnet-bearing amphibolites, suggesting that they might have formed in similar conditions. The chlorite grains show MgO contents of 19.52–20.18 wt%, which makes them moderately magnesian.
5.c. Pseudosection modelling
P-T pseudosections of low- and high-pressure metamorphic phase equilibria were constructed in pressure ranges of 0.8–1.1 GPa and 1.9–2.7 GPa, respectively, at a temperature range of 400–600°C for sample AML 7A, while only the low-pressure pseudosection (0.8–1.1 GPa) was constructed for sample AML 9A. The constructed pseudosections comprise bi-, tri-, tetra-, quini- and hexa-variant P-T fields represented by dark grey, medium light grey, light grey, grey and medium dark grey shades, respectively. Water is taken in excess for both the samples. Isopleth thermobarometry is an important tool where we can use the mole fractions of the end-member phases of a solid solution series to constrain the P-T based on the isopleth intersections. In this study, garnet end-member compositions are used for isopleth thermobarometry.
5.c.1. Sample AML 7A
The high-pressure pseudosection constructed for the sample is shown in Figure 10. Lawsonite disappears at c. 480°C and amphibole starts to appear below 2.5 GPa and above c. 515°C. Chlorite is present in the system up to 2.7 GPa and below c. 530°C. Quartz and H2O are present in all the fields. Since the high-pressure mineral assemblage cannot be determined from the thin-section, garnet isopleth thermobarometry is used to constrain the P-T range as well as the mineral assemblage. Garnets in the sample are very small (300–500 µm) and are low in modal abundance; effective bulk calculations were therefore not considered necessary for the pseudosection modelling. The values taken for this are the garnet centre compositions. It is observed that the isopleths of XAlm, XSpss, XGrs and XPy (0.54, 0.13, 0.30 and 0.03, respectively) intersect to form a small triangle in the P-T range of 2.08–2.1 GPa and 449–452°C (Fig. 10b; the complete range of all the garnet end-member isopleths is given in online Supplementary Fig. S1, available at http://journals.cambridge.org/geo). This P-T range falls in the tri-variant field of garnet-clinopyroxene1-clinopyroxene2-chlorite-lawsonite-quartz-rutile-H2O (Fig. 10a). It can therefore be concluded that this might be the assemblage of the M1 metamorphism. As mentioned above, the solution model used for clinopyroxene is Omph(HP) which includes diopside-hedenbergite-jadeite solid solution series. It can therefore be suggested that the clinopyroxene1 might be diopside, which is common in mafic rocks, and the clinopyroxene2 is probably jadeite, which is common in blueschist facies metamorphism. The obtained mineral assemblage suggests that amphibole and plagioclase did not form during the prograde event. It can therefore be said that the garnets formed during the prograde metamorphism of the rock.
(a) P-T pseudosection of sample AML 7A showing the retrograde (M3) mineral assemblage observed in the thin-section (in red). The oxide compositions of the sample used for the pseudosection are provided above the diagram in molar%. Gt – garnet; Cpx – clinopyroxene; Pl – plagioclase; Chl –chlorite; zo – epidote; sph – sphene; Amph – amphibole; Ilm – ilmenite; pa –paragonite; law – lawsonite; q – quartz. (b) Garnet end-member isopleth intersection is highlighted by an ellipse constraining the P-T field for the rock.

The low-pressure pseudosection is shown in Figure 11. Water is present in all the fields of the pseudosection. Lawsonite disappears early in the topology below 1.05 GPa and c. 400–415°C, whereas chlorite disappears at c. 520–530°C for the entire pressure range. Amphibole appears between 460°C and 525°C for the entire pressure range, while clinopyroxene disappears for a very narrow P-T range between 475°C and 575°C and below 1.07 GPa. The mineral assemblage observed in the petrography studies (plagioclase + garnet + amphibole + chlorite + epidote + sphene + quartz) is observed in the pseudosection as a trivariant field (plagioclase-garnet-amphibole-chlorite-zoisite-sphene-quartz-water) in the P-T range of c. 0.85–1.0 GPa and c. 460–500°C (Fig. 11a). The assemblage corresponds to upper greenschist – lower amphibolite facies metamorphism, and marks the retrograde metamorphic event (M3). The field lies between the cpx-out and chl-out curves. Compositional isopleths of garnet edges are drawn to further constrain the P-T. The isopleths of XAlm, XSpss, XGrs and XPy (0.48, 0.09, 0.38 and 0.025, respectively) intersect in the P-T zone over the range 0.80–0.87 GPa and 500–525°C (Fig. 11b), thus constraining the P-T of the assemblage observed in the petrography. (The complete range of all the garnet end-member isopleths are provided in online Supplementary Fig. S2, available at http://journals.cambridge.org/geo).
(a) P-T pseudosection of sample AML 7A showing the prograde (M1) assemblage (in red). The oxide compositions of the sample used for the pseudosection are provided above the diagram in molar%. Mineral abbreviations as for Figure 10; coe – coesite; acti – actinolite. (b) Garnet end-member isopleth intersection highlighted by an ellipse constraining the P-T field for the rock.

5.c.2. Sample AML 9A
For sample AML 9A, only low-pressure pseudosection was constructed since the garnets of the sample do not show any kind of zoning and are homogenous throughout (Fig. 12). Water is present in all the fields. Here also, lawsonite disappears below 1.05 GPa at c. 400–415°C, whereas chlorite disappears at 550–525°C for the entire pressure range of the pseudosection. Amphibole appears in a temperature range of 460–530°C along the entire pressure range, and clinopyroxene starts to disappear from c. 475°C below 1.08 GPa. The main assemblage is bounded by the chl-out and cpx-out curves. The retrograde assemblage is a well-constrained trivariant field (plagioclase-garnet-amphibole-chlorite-zoisite-sphene-quartz-H2O) at c. 0.85–1.0 GPa and c. 487–520°C (Fig. 12a), also belonging to upper greenschist – lower amphibolite facies. Garnet end-member isopleths form a triangle by the intersection of XAlm (0.50), XSpss (0.06) and XGrs (0.40), to give a P-T estimate of 0.92–1.01 GPa and 512–515°C (Fig. 12b) for the retrograde metamorphism of the sample. (The complete range of all the garnet end-member isopleths is provided in online Supplementary Fig. S3, available at http://journals.cambridge.org/geo).
(a) P-T pseudosection of sample AML 9A showing the retrograde (M3) mineral assemblage observed in the thin-section (in red). The oxide compositions of the sample used for the pseudosection are provided above the diagram in molar%. Mineral abbreviations as for Figure 10. (b) Garnet end-member isopleth intersection highlighted by an ellipse constraining the P-T field for the rock.

5.c.3. Metamorphic P-T path
The petrographical studies showed the presence of melt signatures (former melt pools, melt pseudomorphs, films, etc.) in the amphibolites. This indicates that the rocks have undergone partial melting, which marks the peak metamorphism (M2). Since we already have the M1 and M3 assemblage for sample AML 7A, another pseudosection was constructed for the sample in the P-T range of 0.8–2.2 GPa and 400–700°C to determine whether the given chemical composition would generate melt in any part of its metamorphic history (Fig. 13). It was observed that melt first appears at c. 600°C and c. 1.5 GPa. The first appearance of melt also marks a line of isothermal decompression starting from c. 1.5 GPa up to c. 0.9 GPa (Fig. 13a). The assemblage with the first appearance of melt is melt-ilmenite-garnet-clinopyroxene-amphibole-quartz-rutile-H2O, which lies in the P-T range of c. 1.4–1.8 GPa and 600–675°C. Since the mineral chemistry studies of the rocks indicate that the melt patches are albitic in nature, we have plotted the compositional isopleths for the XAbL of the melt phase, and it is observed that they coincide with the melt-in curve. We also plotted the compositional isopleths for XMg in amphibole and the end-member isopleths for XAb in plagioclase. The XMg isopleth (0.70) of amphibole intersects with the XAbL isopleth (0.90) of melt in the proposed melt assemblage field (Fig. 13b). Further, the XAb isopleth (0.85) for plagioclase and the XMg isopleth (0.50) for amphibole falls in the proposed field for retrograde metamorphism.
(a) P-T pseudosection of sample AML 7A showing the probable M2 phase on the basis of the first occurrence of melt-bearing assemblage. The three metamorphic assemblages are highlighted in red. (b) P-T path of the sample drawn with the three metamorphic events (M1, M2 and M3). The diagram also shows the XMg isopleths for amphibole1 (XMg = 0.70) and amphibole2 (XMg = 0.50). The isopleth for XAb of plagioclase and XAbL of melt is also provided. The oxide compositions of the sample used for the pseudosection are provided above the diagram in molar%.

In the garnet-bearing amphibolites, the XMg of amphibole1 is between 0.61 and 0.67 and that of amphibole2 is between 0.49 and 0.53 (Table 4). This indicates that amphibole1 and amphibole2 formed during the partial melting and retrograde stages, respectively (Fig. 13b). The complete range of all the plagioclase, amphibole and melt end-member isopleths are provided in online Supplementary Figure S4 (available at http://journals.cambridge.org/geo). Matrix plagioclase also formed during the later (M3) stage. Thus, by the pseudosection modelling of the sample AML 7A, we deduce a clockwise metamorphic P-T path having a prograde (M1) at c. 2.1 GPa and 450°C followed by peak temperatures with decompression (M2) between 1.4 and 1.8 GPa and > 600°C and retrograde (M3) at c. 0.85 GPa and 515°C. Since the garnets of sample AML 9A have been completely homogenized, we cannot determine the M1 event for it. However, considering that melt signatures have also been observed in AML 9A and the retrograde P-T of samples AML 7A and 9A is almost similar, we propose that the M2 event (signified by melt) in AML 9A must have occurred under P-T conditions similar to those of AML 7A.
Representative microprobe analyses for amphiboles from amphibolites of the TTSZ ophiolites

6. Conventional geothermobarometry
To further validate the results obtained from the P-T pseudosection modelling, conventional geothermobarometry methods were also applied on both garnet-bearing amphibolites (AML 7A and AML 9A). Conventional geothermobarometry was also used on one sample of garnet-absent amphibolites (KMH 8A). A garnet–hornblende thermometer (grt-hbl; Ravna, Reference Ravna2000) was used for garnet-bearing amphibolites and a hornblende–plagioclase thermometer (hb-pl; Holland & Blundy, Reference Holland and Blundy1994) was used for both garnet-bearing and garnet-absent amphibolites. For the grt-hbl thermometer, garnet edge compositions and amphibole2 values were used; for the hb-pl thermometer, amphibole2 and matrix plagioclase pairs were used to determine the retrograde temperatures since the mineral assemblage obtained for the retrograde metamorphism is also reflected in the petrography studies. The program THERMOCALC v. 3.3.3 (released in October 2009; Powell & Holland, Reference Powell and Holland1988) was also used for average P-T calculations (Powell & Holland, Reference Powell and Holland1994) for both types of amphibolites. For this, the end-member thermodynamic dataset of Holland & Powell (Reference Holland and Powell1998) and the program AX (T Holland and R Powell, http://www.ccp14.ac.uk/ccp/web-mirrors/crush/astaff/holland/ax.html, 2020) was used. The values in AX were calculated at 550°C and 0.6 GPa. The mineral assemblage for samples AML 7A and AML 9A is grt-ep-amph-pl-qtz and for sample KMH 8A is ep-chl-amph-pl-qtz. All calculations were performed with xH2O values of 1.0. The results obtained from these calculations are provided in Table 7.
Results for conventional geothermobarometry for TTSZ amphibolites. Source: Grt–hbl (garnet–hornblende), T R, Ravna (Reference Ravna2000); THERMOCALC, Powell & Holland (Reference Powell and Holland1988); Hb–pl (hornblende–plagioclase), Holland & Blundy (Reference Holland and Blundy1994). P ref – reference pressure.

The average temperatures obtained from the grt-hbl thermometer for sample AML 7A is 390 ± 20°C and for AML 9A is 504 ± 40°C. It is observed that the temperature for AML 7A is comparatively less than the expected values. This low temperature can probably be correlated to some low-temperature local re-equilibration. For the hb-pl thermometer, temperatures for AML 7A were averaging 560 ± 20°C, 570 ± 20°C and 580 ± 20°C, and for AML 9A were averaging 580 ± 30°C, 590 ± 40°C and 590 ± 30°C at reference pressures of 0.6, 0.7 and 0.8 GPa, respectively. From average P-T calculations in THERMOCALC, we observed that the results (averaging 600 ± 40°C and 0.65 GPa for sample AML 7A, 550 ± 20°C and 0.95 GPa for AML 9A, and 490 ± 40°C and 0.89 GPa for KMH 8 A) are similar to the P-T obtained for the retrograde mineral assemblage via the isochemical phase modelling (AML 7A and AML 9A) explained in Section 5.
7. Discussion
7.a. Petrogenesis
Although the basic rocks of the TTSZ ophiolitic complex have metamorphosed to amphibolites, it is still possible to assess their petrogenetic characters with the help of trace elements such as Ti, Zr, Y and Nb, which a have high charge to radius ratio (high-field-strength elements or HFSEs), REEs (e.g. La, Sm and Yb) and transition elements (e.g. Sc, Y and V). These elements do not transport easily in aqueous solutions and remain rather immobile during metamorphic and hydrothermal alteration processes (Beccaluva et al. Reference Beccaluva, Ohnenstetter and Ohnenstetter1979; Pearce & Norry, Reference Pearce and Norry1979; Wood et al. Reference Wood, Joron and Treuil1979; Mahoney et al. Reference Mahoney, Sheth, Chandrasekharam and Peng2000; Niu, Reference Niu2004). Positive correlations between Zr and REEs (figure not shown) indicate that they were not altered during metamorphic and seafloor alteration processes, and can therefore be used to understand the petrogenetic history of the rocks (Photiades et al. Reference Photiades, Saccani and Tassinari2003). Further, the low LOI values (0.51–2.80 wt%) also prove that seafloor processes did not influence the whole-rock geochemistry of the studied rocks to a great extent. From the TAS diagram (Le Maitre, Reference Le Maitre1984; Le Bas et al. Reference Le Bas, Le Maitre and Woolley1992) and Zr versus P2O5 variation plot (Fig. 5a, c), it is clearly observed that the protolith of the studied amphibolites is tholeiitic sub-alkaline mafic rocks. They show similarity with the garnet-bearing amphibolites of the Xigaze ophiolites, south Tibet, which were formed as the metamorphic sole of the Xigaze ophiolites (Guilmette et al. Reference Guilmette, Hébert, Wang and Villeneuve2009) and with the mafic rocks of the Nidar ophiolite (Ahmad et al. Reference Ahmad, Tanaka, Sachan, Asahara, Islam and Khanna2008). They also lie close to the field of Dong Tso amphibolites (Wang et al. Reference Wang, Aitchison, Lo and Zeng2008), which also have similar geochemical affinities (Fig. 5c). The tholeiitic nature of the amphibolites is also visible from the SiO2/Al2O3 versus Mg no. plot of Kempton & Harmon, Reference Kempton and Harmon1992 (Fig. 5d). Sub-alkaline affinities can also be proved by the Zr/Y ratios (Fig. 7c), which are < 4 in the case of N-MORB (La Roex et al. Reference Le Roex, Dick, Erlank, Reid, Frey and Hart1983), and by the low concentration of incompatible elements (Nb/Y < 0.3) (Winchester & Floyd, Reference Winchester and Floyd1977) (Fig. 5b). The high concentration of compatible elements (e.g. Sc) and chondrite-normalized HREE (Fig. 6a) values are indicative of a MORB source melting at relatively shallow depths without the presence of residual garnets (Haase & Dewey, Reference Haase and Dewey1996).
Furthermore, low concentrations of the incompatible trace elements, as observed by the low ratios for Th/Yb, Ta/Yb and Ta/Hf (not shown in table), indicates that the source must be highly infertile and melted extensively (Aldanmaz, Reference Aldanmaz2002). Saccani (Reference Saccani2015) stated that since La and Ce are more incompatible than Yb and Y, respectively, their concentrations will be very low in rocks derived from a depleted mantle source that has undergone an extensive amount of partial melting. This observation conforms to the values obtained from the studied rock samples, where the Ce/Y ratio is 0.19–0.98 and (La/Yb)N is 0.39–3.13, thus indicating a depleted mantle with extensive melting as the source of the TTSZ amphibolites. Haase & Dewey (Reference Haase and Dewey1996) showed that the type of mantle source and degree of partial melting it underwent to form a rock can be explained with the help of a plot of (Ce/Yb)N versus (Dy/Yb)N (Fig. 8c). In this plot, our samples fall in the MORB trend except for one sample that shows a mixed source. The samples correspond to approximately 10–20% partial melting of a depleted spinel lherzolite source and are similar to the Eastern Rift MORB of the Pacific Ocean (Haase & Dewey, Reference Haase and Dewey1996). The ratios of (Ce/Yb)N and (Dy/Yb)N of our samples are also similar to the MORB rocks of the MOC (Khogenkumar et al. Reference Khogenkumar, Singh, Singh, Khanna, Singh and Singh2016). Aldanmaz et al. (Reference Aldanmaz, Yaliniz, Güctekin and Göncüoğlu2008) opined that rocks generated by fractional melting of a source will show a curvilinear trend in a plot of any LREE versus MREE providing there is no mixing of melts. In this regard, the plot of La versus Nd (Fig. 8d) shows somewhat similar observations for the studied rocks where they fall in the MORB array. This trend also corresponds to the trend observed by the mafic rocks of the MOC, NE India (Khogenkumar et al. Reference Khogenkumar, Singh, Singh, Khanna, Singh and Singh2016). It can therefore be suggested that the protolith of the TTSZ amphibolites have been generated by about 10–20% partial melting of a single depleted spinel lherzolite source with little to no amount of magma mixing.
7.b. Metamorphic evolution
Three stages of metamorphism have been identified by petrography observations and phase diagram modelling: the prograde (M1), peak temperatures and decompression (M2), and lastly post-peak decompression and retrogression (M3). Based on microstructural evidence, at least two deformation events (D1 and D2) could be defined. We correlate these two deformations with M1 and M3 metamorphism, respectively. The petrography of the garnet-bearing amphibolites (AML 7A) shows minute polymineralic inclusions in the plagioclase grains (Fig. 3b, c). These polymineralic inclusions are aligned in a direction forming an internal foliation (Si) that is cut by the main foliation (Se) at a high angle (Fig. 3c) and therefore said to have formed during the D1 event. Garnet grains with embayed boundaries are found enclosed within the albitic (Table 5) melt patches (Fig. 3b, c). The garnets are observed to have slightly Mn-rich and Ca-poor centres, which suggests that the central portions have formed at a lower temperature than the edges since MnO in garnets tends to decrease with increasing temperatures (Sturt, Reference Sturt1962; Müller & Schneider, Reference Müller and Schneider1971; Green, Reference Green1977). These garnets have a low compositional gradient marked by XSpss (c. 0.14 for the centre and c. 0.03 for the edge) and XGrs (c. 0.29 for the centre and c. 0.37 for the edge) values. Furthermore, garnet compositions (Table 3) are similar to those obtained from metabasites that have undergone blueschist facies metamorphism in the Variscan suture of the Bohemian massif (Faryad & Kachlík, Reference Faryad and Kachlík2013).
Representative microprobe analyses for feldspars and melts from amphibolites of the TTSZ ophiolites

This textural and mineral chemical evidence suggests that the inclusions as well as the garnets were formed during the M1 phase, which probably lasted until blueschist facies metamorphism. The P-T of the M1 phase was calculated by garnet isopleth thermobarometry of the centre compositions, which yielded c. 450°C and c. 2.1 GPa (Fig. 10). Pyroxene and lawsonite were been observed in the sample, suggesting their complete breakdown during partial melting and retrogression to form secondary phases such as epidote, Na-Ca amphibole and albite. We observed that the garnets of sample AML 9A do not show any kind of compositional gradient. This indicates that the garnets have been homogenized by chemical diffusion. This homogenization might have occurred either during the increasing temperatures (M2 phase) by rapid intracrystalline diffusion (Blackburn, Reference Blackburn1969; Woodsworth, Reference Woodsworth1977) or during slow cooling of the rock (M3 event) (Muncill & Chamberlain, Reference Muncill and Chamberlain1988). However, the second possibility is not likely since, at temperatures of < 600°C, diffusion process in garnet occurs at a very slow rate (Yardley, Reference Yardley1977; Spear, Reference Spear1991; Carlson & Gordon, Reference Carlson and Gordon2004; Caddick et al. Reference Caddick, Konopásek and Thompson2010). The retention of centre-edge differences in AML 7A might be due to the fact that they were enclosed earlier in an albitic melt pool that crystallized before the garnets could undergo complete homogenization. Through phase equilibria modelling and element partitioning, Sorensen & Barton (Reference Sorensen and Barton1987) showed that amphibolites undergo partial melting under hydrous conditions of 0.8–1.1 GPa pressure and 640–750°C temperature.
Melt signatures were observed in all of the amphibolite samples (Figs 3b–f, 4e, f), indicating that all the studied rocks underwent partial melting, denoted as the M2 phase. The occurrence of melt patches and melt films surrounding the garnet grains and bearing small polymineralic inclusions (Figs 3b–f) is evidence that the generation of melts is due to the breakdown of garnet and other inclusion minerals, indicating that the latter are the precursors of partial melting. Phase equilibria modelling of sample AML 7A indicates the appearance of melt at c. 600°C and c. 1.5 GPa (Fig. 13). The former melt pools and melt pockets have crystallized to form plagioclase and show almost pure albitic character (XAbL = 0.94–1.00; Table 5). The supply of Na for this must have come from the breakdown of primary Na-rich minerals. The intersection of XAbL of melt and XMg of amphibole1 (Fig. 13; Tables 4 and 5) proves that amphibole1 formed during the M2 stage along with the albitic melt.
Finally, as the temperatures and pressures decreased, the rock underwent the retrograde phase of metamorphism (M3 event) up to lower amphibolite facies. Plagioclase present in mafic rocks is generally anorthitic. Primarily albitic plagioclase and amphibole2 is present in the matrix (Fig. 3b–f) and their XAb isopleth of plagioclase and XMg isopleth of amphibole2 falling in the retrograde mineral assemblage field (Fig. 13; Tables 4 and 5) highlights their secondary nature. Other secondary minerals such as epidote, sphene and chlorite also occur in this field (Figs 11–13), and are also part of the main foliation, as observed in the photomicrographs (Figs 3b–f, 4b–f). Thus, final re-equilibration of the rock after retrograde conditions occurred at c. 0.8–1.0 GPa and 480–520°C (Figs 11 and 12). Similar P-T conditions were also obtained from the conventional thermobarometry studies using the grt-hbl thermometer of Ravna (Reference Ravna2000), hb-pl thermometer of Holland & Blundy (Reference Holland and Blundy1994) and THERMOCALC calculations for average P-T (Powell & Holland, Reference Powell and Holland1988) (Table 7). This M3 event occurred simultaneously with the D2 deformation, the evidence for which is observed in both garnet-bearing and garnet-absent amphibolites. These include main foliation marked by amphibole2 and chlorite (Se; Figs 3c, 4b, d), segregation of felsic and mafic layers (Fig. 4d), and the right-lateral shearing of plagioclase grains and the presence of chlorite in the strain shadow zone of sheared plagioclase (Fig. 4b, c).
7.c. Tectonic implications
The sub-alkaline tholeiitic nature of the TTSZ amphibolites (Fig. 5b–d) is a characteristic of MOR rocks. Since Zr/Y ratios help to segregate the rocks from MORB and island-arc settings (Pearce & Cann, Reference Pearce and Cann1973; Floyd & Winchester, Reference Floyd and Winchester1975; Pearce & Norry, Reference Pearce and Norry1979), the rocks were plotted in a diagram of Zr versus Zr/Y (Fig. 7c; Pearce & Norry, Reference Pearce and Norry1979) where they fall mostly in the field of MORB.
Oxygen fugacity (fO2) is different for different magma series and controls the tectonic environments (Shervais, Reference Shervais1982), and the Ti/1000 versus V plot (Fig. 7a) serves as an indicator for different tectonic settings since vanadium concentration is directly proportional to fO2. In this plot, the studied samples lie in the field of MORB and back-arc basalts, indicating their formation in a spreading regime. Furthermore, extremely low ratios of Rb/Y (<1), Nb/Y (<0.2), Nb/Zr (<0.1) and Th/Zr (<0.02; Fig. 8a, b) show that the rocks belong to a MORB-like spreading regime with very little to almost no involvement of slab-derived melt (subduction component). In addition to this, the REE patterns of the TTSZ amphibolites compositionally fall between N-MORB and E-MORB (Fig. 6a), and can be correlated with the metamorphic sole amphibolites underlying the Xigaze ophiolite in southern Tibet (Guilmette et al. Reference Guilmette, Hébert, Wang and Villeneuve2009) and MORB rocks of MOC, India (Khogenkumar et al. Reference Khogenkumar, Singh, Singh, Khanna, Singh and Singh2016). The N-MORB normalized multi-element spider plots (Fig. 6b) draw a comparison with the MOR-originated mafic rocks of the MOC, NE India (Khogenkumar et al. Reference Khogenkumar, Singh, Singh, Khanna, Singh and Singh2016) and the mafic rocks of the Neotethyan ophiolites of western Turkey (Aldanmaz et al. Reference Aldanmaz, Yaliniz, Güctekin and Göncüoğlu2008), which also originated in a MOR setting. All this evidence points towards a MORB origin for these rocks.
However, apart from all this evidence pointing towards a MORB origin, a few factors also relate these amphibolites to a subduction setting. The relative variability in the concentrations of large-ion lithophile elements (LILEs; Rb, Ba, U) is suggestive of late-stage alterations that generally occur in subduction zones due to the influence of subduction-derived fluids (Guilmette et al. Reference Guilmette, Hébert, Wang and Villeneuve2009). A multi-element spider plot (Fig. 6b) demonstrates that the rocks show a negative anomaly for Nb and Ti compared with N-MORB, which is characteristic of the involvement of subduction fluids (Pearce & Stern, Reference Pearce and Stern2006). Mostly undetected to low Ta values of the studied samples (not in table) indicate a negative Ta anomaly, suggesting a subduction regime. We therefore propose that the TTSZ amphibolites show both spreading as well as subduction signatures, which makes it difficult to establish their tectonic setting. From the plot of Zr/Yb versus Nb/Yb (Pearce & Peate, Reference Pearce and Peate1995; Fig. 7d), it is observed that the garnet-bearing amphibolites fall near the N-MORB field while the garnet-absent amphibolites fall above the E-MORB field outside the mantle array. This indicates that the subduction zone fluids probably contributed to the generation of the garnet-absent amphibolites. Previous studies of the ultramafic rocks of the TTSZ, mainly serpentinites (Singh & Singh, Reference Singh and Singh2011, Reference Singh and Singh2013), have shown that the ophiolites were formed in a supra-subduction zone (SSZ) setting, and explain their formation in a marginal ocean basin as a result of the high-degree partial melting of a depleted or residual mantle source. Such a setting generally refers to the fore-arc conditions that occur just after the inception of subduction (Bloomer et al. Reference Bloomer, Taylor, Macleod, Stern, Fryer, Hawkins and Johnson1995). However, Ghosh et al. (Reference Ghosh, Mahoney and Ray2007) also suggest a MOR setting for the metabasalts of the TTSZ ophiolites based on whole-rock geochemistry.
Based on the field occurrence of the amphibolites and their relationship with other lithotectonic units, the origin of the overlying ultramafics, and the geochemical signatures and the inferred metamorphic and deformation record observed in both the garnet-absent and garnet-bearing samples, it can be suggested that the protolith of the TTSZ amphibolites was generated in a mid-oceanic ridge setting as mafic rocks. These rocks then became part of the Neo-Tethyan subduction zone, where they were incorporated as part of the subducting slab and underwent prograde (M1) to peak (M2) metamorphism events. During the M2 event, the rocks interacted with subduction-derived fluids that caused a few changes in the geochemistry of the rocks. Later, during obduction, the rocks underwent retrograde metamorphism (M3) and came to lie structurally below the SSZ ophiolites as a metamorphic sole. Detailed isotopic and geochronological studies must be conducted to further constrain a model to explain the complete geodynamic setting of the amphibolites, which is outwith the scope of this paper.
8. Conclusions
Dismembered amphibolites exist tectonically beneath the TTSZ ophiolite section and occur in association with meta-carbonates of the ophiolites and GHS in the Eastern Himalaya, Arunachal Pradesh, India. These amphibolites are classified as one of two types on the basis of the presence or absence of garnet. The studied samples reveal tholeiitic affinities and a sub-alkaline nature, indicating their protolith to be of a mafic source. They appear to have originated from a garnet lherzolite source by 10–20% partial melting in a mid-oceanic ridge setting. The rocks show retrograde assemblages with melt signatures in petrographical studies. P-T modelling reveals that they underwent a three-stage metamorphic history with a prograde M1 (c. 2.1 GPa, c. 450°C) and peak M2 (c. 1.5 GPa, c. 600°C), obtained by identifying the first melt field in the pseudosection, and finally a retrograde M3 (0.8–1.0 GPa, 480–520°C) stage. M1 corresponds to the D1 deformation event, which occurred possibly during the subduction phase of the rocks. D1 was followed by the M2 stage, during which the rocks underwent partial melting and the pressure also decreased significantly. The increase in temperature (c. 150°C) might probably be due to the interactions of the amphibolites with the subducting fluids, which also contributed to the geochemical signature obtained from the rocks. Finally, during the obduction (M3) of the ophiolite complex, the amphibolites underwent the D2 deformation stage, which occurs as the primary foliation in the rocks. All these observations, combined with previous studies and field relationships, suggest that the amphibolites of the TTSZ ophiolite complex are part of a dismembered dynamo-thermal sole that was formed in a spreading zone (MOR) and later came to lie in a subduction setting before being accreted below the SSZ ophiolites of the TTSZ in Eastern Himalaya, India.
Supplementary material
To view supplementary material for this article, please visit https://doi.org/10.1017/S0016756820000825
Acknowledgements
We thank the Director, WIHG, Dehradun, India as well as the OIC of the ICP-MS and XRF facilities at WIHG, Dehradun. We also thank Professor N.V. Chalapathi Rao and Dr Dinesh Pandit, Department of Geology, Banaras Hindu University (BHU), India, for conducting the microprobe analyses in the DST-FIST- and DST-PURSE-sponsored EPMA lab at BHU, Varanasi. The first author thanks the Council for Scientific and Industrial Research (CSIR), New Delhi, for financially supporting this work. We thank Dr Purbajyoti Phukon, Assam Central University, India for his discussions which helped to improve the manuscript. We also thank the two anonymous reviewers and Dr Kathryn Goodenough, Editor, for their constructive suggestions that greatly improved the manuscript. This study covers part of the first author’s doctoral thesis at WIHG, Dehradun and BHU, Varanasi on the northeastern Himalaya.