Introduction
In previous studies (Hendrickson et al., Reference Hendrickson, Troilo, Possin and Springer2006b, Reference Hendrickson, Troilo, Djajadi, Possin and Springer2009), we found that the New World marmoset monkey (Callithrix jacchus) has a retinal developmental sequence that is markedly similar to human and Old World macaque monkey. In all three primate species at birth, the foveal pit is incomplete and the photoreceptor layer has a single layer of cones with rods excluded from the central fovea. In macaques (Packer et al., Reference Packer, Hendrickson and Curcio1990; Springer & Hendrickson, Reference Springer and Hendrickson2005), foveal cone density rises from 86 × 103/mm2 (K) at birth [fetal day (Fd) 170–175] to ∼200 K by 12–15 months of age, a 2.3-fold increase over 15 months. Similarly, in humans (Hendrickson & Yuodelis, Reference Hendrickson and Yuodelis1984; Yuodelis & Hendrickson, Reference Yuodelis and Hendrickson1986), density is ∼36 K at birth (40 fetal weeks) and reaches the lower range of adult 200 K levels of by 4–6 years, a 5.6-fold increase over 6 years. Marmoset retinas, studied in sections at birth (Fd 144) (Hendrickson et al., Reference Hendrickson, Troilo, Possin and Springer2006b), are morphologically similar to humans at birth (Hendrickson & Yuodelis, Reference Hendrickson and Yuodelis1984). Within 3 months, their shallow pit deepens, their cones elongate and pack, and their foveas are remarkably adult like. This morphological sequence suggests that the marmoset fovea develops more rapidly than in other primates. Because quantitative studies have not been done on the rise of marmoset foveal cone density, which is the definitive marker of maturity, it is unknown when the marmoset fovea completes development. In this paper, we quantified foveal cone density during late fetal and early postnatal development. As predicted from the rapid morphological changes found earlier, marmoset foveal cone density reaches the lower end of adult levels within a few months after birth.
Materials and methods
Tissue preparation
A developmental series of eyes were enucleated from deeply anesthetized animals (see Springer & Hendrickson, Reference Springer and Hendrickson2004b for details; Hendrickson et al., Reference Hendrickson, Troilo, Possin and Springer2006b). One or more animals were studied at each age. The ages were Fd 125 and 135; postnatal day (Pd) 1, 2, 4, 6, 10, 30, 33; 3, 5.4, 6, and 8 months and three adults older than 2 years. For retinal wholemounts, eyes were immersion fixed in 2% paraformaldehyde for 2–4 h, then refrigerated in 0.1 m phosphate buffer (PB), pH 7.4. The anterior eye was removed and the retina was dissected free and cleaned of any adhering pigment epithelium (PE). Retinas were cryoprotected in 30% sucrose in PB overnight and frozen/thawed to increase antiserum penetration. Other eyes were immersion fixed in Carnoy’s fixative (methanol:chloroform:glacial acetic acid 6:3:1), infiltrated with absolute alcohol and toluene, and embedded in paraffin. The lens was removed from eyes older than Pd 7. These eyes were serially sectioned at 8 μm and every 10th section mounted for staining in azure II/methylene blue to identify the fovea.
Immunocytochemical labeling
Wholemounts
Retinas were blocked for 12–24 h in 10% Chemiblocker (Millipore Corp., Billerica, MA) in diluent (0.5% Triton X-100 and 0.05% sodium azide in PB). Retinas were then incubated for 4–6 days on a shaker at 4°C in a mixture of rabbit and mouse antisera diluted in 5% Chemiblocker in diluent, washed at least 24 h in PB, and then incubated 6–8 h in a mixture of antirabbit IgG/Alexa 488 and antimouse IgG/Alexa 594 (Molecular Probes, Eugene, OR) each diluted 1/500 in diluent. After washing overnight, retinas were mounted on slides, photoreceptor side up, dried, flattened, and coverslipped with Polymount (Polysciences, Wilmington, PA).
Sections
Frozen, 12–20 μm, sections were dried onto slides and labeled as for wholemounts, except blocking was 1 h, primary antiserum was overnight, and Alexafluor was 1 h.
Imaging
Sections and wholemounts were imaged using a Nikon E1000 wide-field digital fluorescent microscope. Either single images or stacks of images of each fluorophore were taken and deconvolved using Huygens deconvolution software (Scientific Volume Imaging, Hilversum, The Netherlands). All images were then processed in Adobe Photoshop CS3 for color balance, sharpness, and contrast.
Antisera
Rod markers used include rabbit antirod opsin (1/1000; gift of R. Kean); rabbit antirod arrestin (C10C10, 1/5,000; gift of C. Craft); and mouse antirod opsin (4D2, 1/250; gift of R. Molday). Cone markers include rabbit antiguanylate cyclase-activating protein 1(GCAP, 1/1000; gift of K. Palczewski); rabbit antishort wave-selective (S) cone opsin (JH455, 1/10,000; gift of J. Nathans); mouse anti-S-cone opsin (gift of A. Szel); mouse anticone arrestin (7G6, 1/250; gift of P MacLeish); and mouse anticone transducin (A1.1, 1/250; gift of J. Hurley). Mouse antisynaptophysin (1/1000; S5768, Sigma-Aldrich Corporation, St. Louis, MO, USA) labels cone cell bodies heavily and rods lightly. Mouse anticellular retinaldehyde-binding protein (CRALBP, 1:2; gift of J. Saari) was used to label Müller glia cell cytoplasm.
Cone density quantification
Sections
Cell density in paraffin sections was calculated using the formulas below.

A serial series of sections was examined, and one section at each age was chosen that was as close as possible to the foveal center (Fig. 2). Central cones formed a monolayer up to Pd 7. Foveal cell body diameter (mean 5.49 μm, 0.12 s.e.m., n = 7 retinas) was measured at the nuclear level over an average retinal span of 144 μm and cone density was calculated using Formula 1a.

From Pd 10 onward, the cones were no longer in a monolayer, and therefore, the measurements were made on their inner segments (IS), over a shorter length of fovea (average of 8.85 μm) using Formula 1b. The mean IS diameter was 2.0 μm (0.3 s.e.m., n = 7 retinas). Foveal cell body diameter averaged 4.56 μm (0.37 s.e.m.) from Pd onward (n = 6 retinas) and was significantly reduced from that observed from P1 to P7 (above; t = 4.85, df = 11, P = 0.001, two-tailed t-test).
Determining the density of cone cell bodies when they are in a monolayer is a two-dimensional problem and does not require the corrections or methods used for calculating densities in a three-dimensional volume (Abercrombie, Reference Abercrombie1946; Williams & Rakic, Reference Williams and Rakic1988). The above formulas are comparable to determining the density of squares on a checkerboard. All that is required is measuring the length of the side of a square (cell or IS diameter), counting the number of squares (number of cells or IS), and measuring the distance spanned by the counted squares. These three parameters are then used to determine cells or IS/mm2. Corrections for partial cell profiles and section thickness are not applicable to two-dimensional cell density determinations. Similarly, determining IS density is also a two-dimensional problem. While the method used may not be perfectly accurate, a better way to extract two-dimensional cone densities from paraffin sections is not apparent. Measurements were made on captured images with Image-Pro software (Media Cybernetics, Bethesda, MD).
Wholemounts
This material was examined using a fluorescence microscope fitted with Nomarski optics and a digital motorized stage. Using a 40× objective, a tiled montage was created that encompassed the fovea and the retina along the horizontal meridian. In addition, at each tile position, a Z stack of images was collected at 1-μm steps. The Z stacks spanned the outer segments (OS) through IS and allowed selecting the best picture at each eccentricity for quantification. Cell density was measured at various eccentricities along a line approximating the horizontal meridian using a novel counting method described previously (Springer & Hendrickson, Reference Springer and Hendrickson2009). The reduced formula below assumes that IS are generally hexagonally shaped and uses the mean center–center (cc) distances of adjacent IS to calculate the radius and area of a hexagon.

The hexagon area was then used to generate a cone density value at a particular eccentricity. The above formula obviates having to calculate hexagon radii and areas. Measurements were made every 25 μm centrally and every 100 μm outside the fovea.
The mean number of cc lines drawn at the foveal eccentricity was 35 for 15 retinal wholemounts. The mean area that bounded the cc lines at the foveal eccentricity was 527 μm2 for Fd 125—Pd 10 wholemounts (median = 343 μm2) and the area for 33 days—6.2 years wholemounts was 35 μm2. This method was compared to the conventional method of counting the number of IS in a rectangular area (Packer et al., Reference Packer, Hendrickson and Curcio1989; Curcio et al., Reference Curcio, Sloan, Kalina and Hendrickson1990). The hexagonal and a variant of the traditional density determination methods are illustrated in Fig. 1A–1F. The density values obtained with the hexagon method were within ±5% of the counts obtained conventionally. One advantage of the hexagon counting method is that density can be determined in small areas, which is important in scarce primate retinas when the fovea may not be completely flat. Another advantage is that the density values are based on the smallest possible counting field (i.e., a pair of IS) and are not significantly affected by the dimensions of the counting field used (Packer et al., Reference Packer, Hendrickson and Curcio1989; Curcio et al., Reference Curcio, Sloan, Kalina and Hendrickson1990).
IS photographed with Nomarski differential interference contrast optics using a 40× objective. (A–C) have the same pictures. (A) IS at the fovea of a 6.2 years old animal. (B) A group of 20 IS with lines drawn between their centers (small dots are at points of line intersections). The hexagonal method was used to arrive at the density shown at the bottom. (C) A polygonal boundary surrounds the 20 IS shown in (B). The area of the polygon is shown at bottom. Calculated IS density (at bottom), using the conventional method, is 4% lower than that shown in (B). (D–F) have the same pictures. (D) IS at a point 100 μm temporal to the fovea. Dots surround three IS and a single dot is located at the estimated center of the IS. (E) Lines connect the centers of 22 IS and the density calculated using the hexagonal method is below. (F) A polygonal boundary surrounds the 22 IS shown in (E), and IS density, calculated using the conventional method, is 1.8% lower than that shown in (E). Polygon area and density are at the bottom of (C) and (F). Scale for (B–F) as in (A).

Results
Morphological development of marmoset fovea in sections
The fovea is quite immature as seen in vertical sections at Fd 135, 10 days before birth (Fig. 2A). An Fd 125 retina (picture available in Hendrickson et al., Reference Hendrickson, Troilo, Possin and Springer2006b; Fig. 1B) appears similar. The photoreceptor layer or outer nuclear layer (ONL) across the figure is composed entirely of cones that form a monolayer of cell bodies. The very shallow pit (P) deforms only the ganglion cell layer (GCL) and the inner plexiform layer (IPL). At Fd 135, and throughout postnatal development, the fovea is free of rods. This rod-free zone (RFZ) is about 1 mm in diameter around birth, and rods are not present in Fig. 2A–2C. Individual cones across the foveal center have large cell bodies and a short axon that ends in a prominent synaptic pedicle in the outer plexiform layer (OPL). In these azure II-methylene blue-stained sections, before and around birth, the cones centered over the pit are packed less tightly than those more peripherally (Fig. 2A–2C). Immunocytochemical labeling shows that this is due to a larger amount of Müller cell cytoplasm surrounding foveal cones (see below).
Photomicrographs of azure II-methylene blue-stained sections through the marmoset fovea showing cone morphology development. (A) At Fd 135, cones are in a single layer, with their cell bodies forming the ONL. Cones in the foveal center (F) are slightly elongated and packed loosely, while cones near the foveal edge are shorter and packed more tightly. All cones have a thin axon extending vertically to their synaptic pedicle in the OPL. The very shallow foveal pit deforms the GCL. (B) At Pd 1, all cones are elongated, and a pit (P) deforms all the inner retinal layers. Foveal cones are packed less tightly and have long axons, while more peripheral cone cell bodies are packed more tightly and cell bodies are 1–2 deep. (C) At Pd 10, cone IS and OS are apparent. Cone cell bodies are several layers deep across the fovea, but foveal cones are still packed less tightly. The pit now involves much of the INL and IPL and the GCL is one layer thick. (D) By Pd 33, the foveal center consists of cones, 6–8 cell bodies deep, with much thinner IS than peripheral cones. Rods are apparent deep in the ONL on the foveal edge (white arrow). (E) At 6 years, the adult foveal center is formed by a deep layer of cone cell bodies with very thin IS and long OS compared to more peripheral IS and OS. Rod cell bodies are now close to the foveal center (white arrow). Magnification bar in (E) for (A–E).

At Pd 1 (Fig. 2B), the fovea has matured in that the pit is much deeper and has deformed the GCL center into a monolayer, as well as outwardly deforming the IPL and the inner part of the inner nuclear layer (INL). Foveal cones over the pit are elongated and loosely packed, and the OPL dips into the outer INL. There is some evidence of cone cell body stacking on the edges of the pit. Maturation occurs rapidly after birth, so that by Pd 10 (Fig. 2C), cones around the pit are stratified/stacked, while cones over the pit are packed less tightly but elongated and also stratified/stacked. A large amount of Müller cytoplasm is obvious in the foveal center. The indentation of the outer INL by the OPL persists, making the foveal OPL much thicker than in the periphery. The pit now deforms most of the GCL, IPL, and INL. Rod nuclei are present at the bottom of the ONL 500–600 μm from the foveal center (white arrow). By 1 month (Fig. 2D), the pit is almost adult like. All cones have a long IS and OS, but there is a clear increase in IS packing density within the fovea compared to the periphery. Rod nuclei are now present much closer to the fovea (white arrow). The biggest change from birth is that cone nuclei over the pit are 5–6 cones deep, while more peripheral cone nuclei are, at most, 3 deep. The adult fovea (Fig. 2E) lacks any inner retinal cells in the pit center other than cone cell bodies, which are at least 8 deep. Foveal IS and OS are so thin that they are difficult to resolve at this magnification. Rod nuclei (white arrow) lie much closer to the foveal center than at earlier ages.
Development of the RFZ
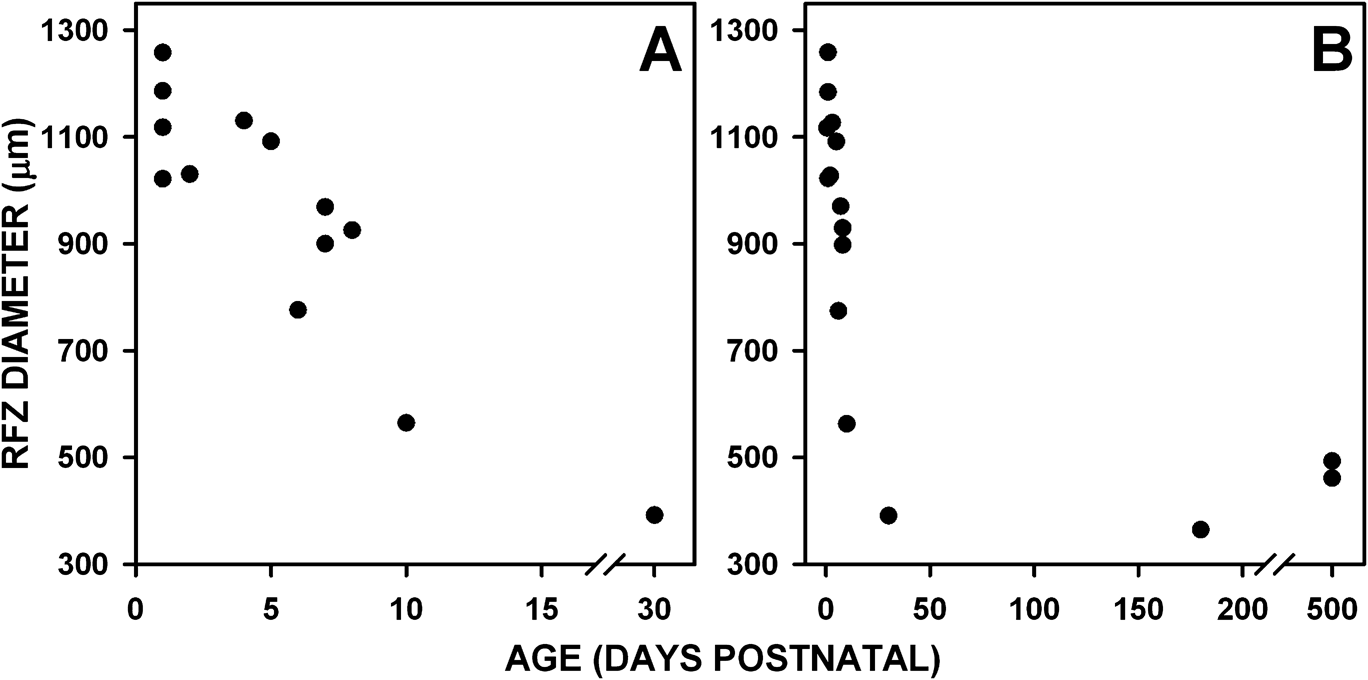
The RFZ is better visualized in wholemounts immunocytochemically labeled for rod markers (Fig. 3A–3D), and measurements taken from these wholemounts are shown in Fig. 4. Around birth, the RFZ is ∼1000 μm in diameter (Fig. 3A arrow, Fig. 4A). At these ages, the RFZ is oval with its widest diameter along the horizontal meridian. Scattered rods appear on the edge of this zone (Fig. 3A’–3B’ middle), and their number increases progressively until 1 mm from the foveal center where rods are packed tightly (Fig. 3A’ bottom). Up to Pd 5, RFZ diameter ranges from 1028 to 1257 μm. Between Pd 6 and 8, RFZ diameter decreases to 774–969 μm (Figs. 3B and 4A) and by Pd 10 is 525 μm wide, about half the diameter at birth (Fig. 4A). Another change is that between Pd 6 and Pd 33 (Fig. 3C’ and 3D’ bottom), the edge of the RFZ sharpens with the diminution of the more central scattered rods seen at earlier ages. By Pd 33, the RFZ has decreased to 391 μm, which is near the adult range of 462–493 μm. A flat RFZ diameter distribution from Pd 1 to 5 is supported by an R = 0.09 value using a linear regression fit. However, over days 1–30, a linear fit resulted in an R = 0.85 value, indicating a progressive reduction in the RFZ diameter over this longer time span.
Photomicrographs showing the developmental change in the RFZ. All tissue is labeled for rod-specific immunomarkers unless otherwise specified. (A–D) Photographs of the marmoset fovea in retinal wholemounts showing the gradual decrease in the size of the RFZ (lines with double arrowheads) from Pd 1 to 6 months. The box in (B) shows the area illustrated in (A’–D’). (A’–D’) Higher magnification views of the change in rod density from the RFZ (top of pictures) into the rod-rich parafovea (bottom of pictures). (E) Section through a Pd 1 fovea with the RFZ edge on the right of the picture. The entire rod cell membrane is labeled for rod opsin at this age. See text for details. (F–G) Drawings of arrestin-labeled rods on the RFZ edge at Pd 2 and 8. (H) Arrestin-labeled rods on the RFZ edge in a 3-month wholemount. Rod cell bodies (CB) and OS are slanted toward the foveal center (to right). The thin rod axons course away from the foveal center and are so long that it is difficult to trace their entire length; two axons are enhanced by a white line. (J) Vertical section through an adult foveal edge (fovea to right) showing short wavelength cones (S) labeled for S-opsin and rods for arrestin. Enlarged color photo of right side of (J) is in Fig. 5M. The thick S-cone axons are indicated by an arrow, while the thin rod axons originating from the deeper rod cell bodies are indicated by arrowheads. Scale bar in (A) for (A–D); in (A’) for (A’–D’); in (F) for (F–G).

The foveal RFZ diameter decrease over postnatal development. (A) Pd 1–33. (B) Birth to adulthood. The RFZ diameter decreases from >1 mm at birth to ∼500 μm at 1 month and reaches an adult diameter of ∼350 μm by 6 months, or less.

Photoreceptor displacements
Two displacements occur during the month before and the first months after birth. The first is the centrifugal or peripheral-ward displacement during pit formation of all inner retinal neurons, including bipolar and horizontal cells, which are postsynaptic to photoreceptors. The second is the centripetal or central-ward displacement of photoreceptors. That of rods is reflected by the diminishing RFZ diameter and that of cones in the concomitant increase in central cone density. As described earlier (Springer & Hendrickson, Reference Springer and Hendrickson2004b), these two opposite directional displacements seem to meet at the OPL such that the inner retina, up to and including the cone pedicles, moves peripherally (centrifugally) and the photoreceptor cell bodies, IS and OS move centrally (centripetally). These displacements result in shearing along the OPL plane. They force the elongation of both rod and especially cone axons, so that photoreceptors can retain their synaptic connections in the OPL as bipolar and horizontal cells are displaced peripherally.
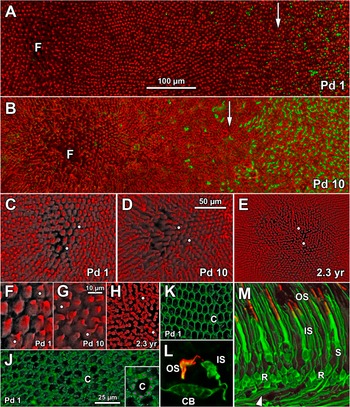
The initiation of this process is shown in a Pd 1 fovea (Fig. 3E) when the entire rod membrane labels for rod opsin. The PE and OPL demarcate the thin photoreceptor layer. The RFZ is just off the right side of the photo. Rod 1 nearest to the RFZ has a short axon (inset 1, arrowhead) extending peripherally from the cell body and ending in a spherule. The very tiny neonatal OS can be seen on the rods in all three insets (inset 1, asterisk). Rod 2 lies about 600 μm peripheral to the RFZ and has a shorter axon directed peripherally (inset 2, arrowhead). Rod 3 is 800 μm peripheral and has an even shorter axon running directly below the cell body (inset 3, arrowhead). Note that for all three rods, the IS lie directly above the cell body. Due to the heavy immunocytochemical labeling of the immature rod cytoplasm for rod arrestin (Fig. 3E–3J) and the relatively sparse concentration of rods near the RFZ edge, we have been able to image the elongation of rod axons in wholemounts. At Pd 2, rods on the RFZ edge (Fig. 3F) have axons 25–30 μm long. The rod cell body and short OS (Fig. 3F, arrow) are aligned vertically, while axons bend almost 90 deg away from the cell body. By Pd 8 (Fig. 3G), rods are more mature with a well-defined IS and much longer OS, with both aligned above the cell body. The rod axon is longer and ends in a tiny synaptic spherule (Fig. 3G, arrow). A rod similar to the left-hand rod is shown in color in Fig. 5L. By 3 months (Fig. 3H), the rod arrestin-labeled axons are so long it is difficult to trace them, but estimated from rods on the RFZ edge, they are at least 200 μm long. Two axons that could be traced uninterruptedly are enhanced in Fig. 3H. The adult orientation of both short wavelength-selective (S) cones and rods on the RFZ edge (fovea to the right) is shown in Fig. 3J with an enlargement in color in Fig. 5M. The OS, IS, and cell bodies are vertically oriented. The axon emerges from the base of the rod (arrowhead) or S-cone (arrow) cell body and makes a sharp turn peripherally as it runs into the OPL, so that it lies at a 90 deg angle to the cell body. Despite the marked change in axon length and overall morphology, this is similar to rods in the newborn.
(A–B) Low power view of the Pd 1 (A) and Pd 10 (B) RFZ with the RFZ edge (white arrow) marked by rods labeled for rod opsin (green). Cone cell bodies are labeled for a mixture of arrestin, transducin, and synaptophysin (red). (C–E) The foveal center at Pd 1 (C), Pd 10 (D), and 2.3 years (E). Foveal cones become thinner as they pack and the space around cones disappears. (F–H) Higher magnification of the cones in the foveal center. The same cones are marked by white dots in (C–F), (D–G), and (E–H). (J–K) Müller cell cytoplasm is labeled with CRALBP and outlines the unlabeled cones (c) at the outer limiting membrane of the Pd 1 fovea (J) and near the edge of the RFZ (K). On many foveal cones, six to eight individual Müller cell processes surround the cone IS (J inset; magenta dots highlight some of the processes). (L) Color photograph of a Pd 8 rod adjacent to those in Fig. 3G. The OS is labeled for rod opsin (red) and the cell membrane for rod arrestin (green). (M) Color photograph of Fig. 3J at higher magnification. The S-cone OS are labeled for S-cone opsin (red) and for both S-cone and rod IS. Cell bodies and axons are labeled for rod arrestin (green). The IS on some rods (R on right) can be traced to the OS, while the thin axon from another rod (R on left) originates from the cell body base. The S cone at the right (S) corresponds to the S cone at the right edge of Fig. 3J. Scale bar in (A) for (A–B); in (D) for (C–E); in (G) for (F–H); in (J) for (J–K).

This sequence of linear to oblique axonal orientation affirms that displacement forces act at the OPL between the rod axon and its synapse with the rod bipolar cell, and that these forces are reflected by axon growth and orientation. Given the orientation of the rod axon at birth, it also suggests that these displacement/shearing forces begin acting around birth.
The change over time in foveal cone diameter and packing within the RFZ is shown in Fig. 5. Rods are labeled for rod opsin (green) and cones by a mixture of arrestin, transducin, GCAP, and synaptophysin (red). At Pd 1 (Fig. 5A), the RFZ edge (white arrow) is marked by scattered rods. There is little difference in cone diameter between cones in the fovea (Fig. 5A and 5F) and at the RFZ edge (Fig. 5A, arrow), but cone density within the fovea is much lower with considerable space between cones. Foveal cone size and packing at Pd 1 is shown at higher power in Fig. 5C and 5F. The issue of “space” between foveal cones was studied by immunocytochemical labeling for the Müller cytoplasmic marker CRALBP. In the Pd 1 fovea (Fig. 5J), there is much more Müller cytoplasm surrounding each cone (Fig. 5J, C-cone) at the outer limiting membrane than near the edge of the RFZ (Fig. 5K). These figures also illustrate the similarity in cone diameter within and outside the fovea. On many foveal cones, six to eight individual Müller cell processes surround the cone IS (Fig. 5J inset; each process is marked with a magenta dot).
At Pd 10 (Fig. 5B), cones within the fovea are still packed loosely and have wider diameters than cones on the RFZ edge (white arrow). The RFZ edge is much closer to the foveal center, and more rods lie just outside the RFZ edge. The Pd 10 foveal cones are shown at higher magnification in Fig. 5D and 5G. Compared to Pd 1 foveal cones (Fig. 5F), Pd 10 foveal cones (Fig. 5G) are smaller and packed more tightly but still have space around them. An adult 2.3 years fovea is shown in Fig. 5E and 5H. The cones now are very narrow and packed very tightly.
Cone density increase
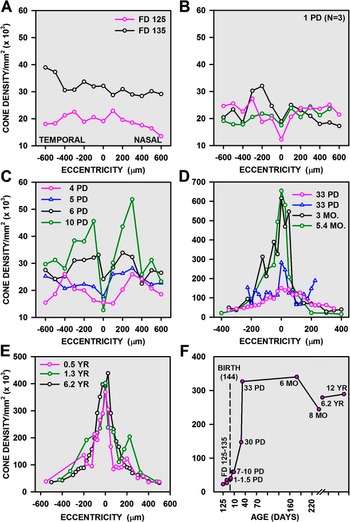
Counts of cone density were done along the horizontal meridian of wholemounts immunocytochemical labeled for rod markers, so that the center of the RFZ could be determined with certainty, especially in young retinas before significant packing occurred. A cone density gradient within ±300 μm of the nascent foveal center was not apparent before birth (Fig. 6A). Density in this area was around 20 K at Fd 125. This is before the foveal avascular zone (FAZ) has completed its formation and before pit formation has begun (Hendrickson et al., Reference Hendrickson, Troilo, Possin and Springer2006b). By Fd 135 (Fig. 6A), when formation of the FAZ is finalized and pit formation has begun, foveal cone density has risen to ∼30 K but with no obvious peak at the fovea. A change in the cone density pattern across the fovea was found at Pd 1–10 (Fig. 6B–6C). In three different Pd 1 retinas, there was a temporal peak up to 30 K perifoveally with a dip in density at the foveal center, suggesting delayed packing there. This general pattern continued up to Pd 10 (Fig. 6C) but with a somewhat higher baseline of central cone density and perifoveal peaks up to 50 K. A final change in density pattern appeared in one Pd 33 retina (Fig. 6D), which had a dome-shaped curve with the highest density of 150 K over the fovea. Another Pd 33 monkey had an adult-like sharp foveal peak of 283 K with steep drop in density into the periphery on both nasal and temporal sides. At 3 and 5.4 months, there was a sharp narrow peak with a foveal density of 616 and 654 K, respectively. At 6 months (Fig. 6E), in two animals (one curve shown), the cone density patterns were similar with peak densities of 350–381 K. These densities are slightly below adult levels of 402–438 K (Fig. 6E).
(A–E) Change in cone density along the horizontal meridian with age in retinal wholemounts. Counts were done using the hexagon method. Temporal is to the left and nasal is to the right with the foveal center at 0. (A) Cone density, within ±200 μm of the fovea, is flat before birth and, at birth, begins to increase on the foveal edges relative to the foveal center (B). (C) Density increases further, parafoveally, between Pd 4 and 10. (D) By Pd 33, cone density begins to rise within the foveal center and becomes very high by 3–5.4 months. (E) Densities across the horizontal meridian are similar at 6 months, 1.3 years, and 6.2 years. (F) Peak cone density in sections. Age is indicated by the labels next to the data points and also on the abscissa. Note that the densities are similar to those in (A–E), but densities in older animals are lower than those obtained in wholemounts. Birth at 144 days postconception is indicated by the dashed line.

We compared wholemount counts with those done on vertical sections similar to those in Fig. 2 (Fig. 6F). For fetal and early postnatal foveas, the counts showed a similar rapid rise to 327 K by Pd 33, supporting the wholemount data. A drop in foveal density after 6 months is also seen in section counts. However, although the section counts are in good agreement with the developmental sequence seen in the wholemount counts, all counts after Pd 33 are lower in sections than in wholemounts.
Cone density based on only soma size was calculated using Formula 1a above. These calculations determined the maximum cone density when cone nuclei/cell bodies are smallest and also assume that the cones are in a monolayer. As described above, cone soma diameter prior to Pd 10 is 5.5 μm (calculated from paraffin sections), and from Pd 10 onward, mean cone soma diameter is 4.6 μm. Cones having a 5.5 μm diameter can achieve a maximum density of 39 K and those with 4.6 μm diameter can achieve a peak density of 56 K. Thus, cones that remain in a monolayer are limited to only a 45% increase in packing density. Clearly, simple crowding of cones cannot achieve an eightfold increase of density from about 25 to 200 K.
Several points emerge from these counts in marmoset retina. First, near adult cone density can be reached as early as 3 months and clearly by 6 months. Second, cone density does not rise first in the foveal center, instead, cone packing increases at Pd 10, around, but not in the fovea. This is consistent with the loosely packed appearance of the neonatal foveal center in wholemounts. It is not until about Pd 30 that a clear foveal peak appears, in which cone density is higher than in the parafovea. Finally, there is a drop in the peak density between 5.4 months and adulthood.
Discussion
Modeling
Marmoset cone density develops rapidly after birth
Cone density counts during development of Old World Macaca monkeys (Packer et al., Reference Packer, Hendrickson and Curcio1990) and humans (Yuodelis & Hendrickson, Reference Yuodelis and Hendrickson1986; Diaz-Araya & Provis, Reference Diaz-Araya and Provis1992) found an approximate 10-fold density increase from midgestation to adulthood. A small density increase occurs before birth, with a much larger increase after birth. In macaques, adult densities are achieved by P 12–15 months, in humans at 4–6 years, and in marmosets at P 6 months. How can we compare these results? If we assume an average life span of 75 years for humans, 20 years for Macaca, and 13 years for marmosets (Hearn, Reference Hearn and Poole1987), a rough comparison can be made by using the percentage of postnatal life span devoted to achieving adult cone density. In Macaca, this is 6%, in humans 8%, and in marmosets 3.5%, suggesting a faster completion of foveal cone packing in marmosets relative to life span. This difference in the rate of postnatal foveal cone development between macaque/human versus marmosets stands out insofar as so many other retinal developmental events like pit formation, initial cone appearance, synaptogenesis, opsin expression, changes in cone morphology, and overall retinal development occur in the same developmental sequence and appear to involve the same mechanisms in the three primates (Hendrickson & Kupfer, Reference Hendrickson and Kupfer1976; Yuodelis & Hendrickson, Reference Yuodelis and Hendrickson1986; Hendrickson, Reference Hendrickson1992; Provis et al., Reference Provis, Diaz and Dreher1998; Springer & Hendrickson, Reference Springer and Hendrickson2004b, Reference Springer and Hendrickson2005; Hendrickson et al., Reference Hendrickson, Troilo, Possin and Springer2006b, Reference Hendrickson, Troilo, Djajadi, Possin and Springer2009).
Although all three species are altricial, marmosets are arboreal and must develop good vision and eye–limb coordination at an early age in order to survive independently. Marmosets give birth twice a year and infants are weaned in 40–80 days (Hearn, Reference Hearn and Poole1987), which requires the infant to be able to cope independently in the arboreal environment by 4–6 months. The terrestrial environment of macaques and humans and the relatively long period between births does not put a similar accelerated developmental demand on these primate babies.
Cone density in sections versus wholemounts
Peak adult foveal cone density in marmoset wholemounts is reported to range from 200 (Troilo et al., Reference Troilo, Howland and Judge1993) to 238 K (Wilder et al., Reference Wilder, Grünert, Lee and Martin1996). These values are consistent with those obtained in the present study for counts using paraffin sections. However, our 400 K wholemount cone density values for animals aged Pd 33 to adulthood are appreciably higher than those obtained using sections and are also considerably higher than those obtained in the above studies using adult wholemounts. Importantly, the high-density values seen within an individual density curve (Fig. 6D–6E) were not due to a single aberrant point on the curve. Because the curves were steep, closely spaced points along the slopes were quantified. Although the sampled areas were small, the use of a small sampling window did not result in curves that were, internally, very variable. More likely, the small sampling windows and small steps between sampling windows allowed us to discern higher densities. One possible explanation that may account for the disparity in densities in the present study is that the analyzed sections, although through the fovea, did not pass directly through the center of the fovea. In contrast, our wholemount counts were done at the precise foveal center as determined by immunocytochemical marking of the RFZ.
An explanation of the disparity between adult marmoset peak cone densities when using sections versus wholemounts may be related to the size of the counting window that was used (Curcio et al., Reference Curcio, Sloan, Kalina and Hendrickson1990). In that study, reducing the area of the counting window from 1305 to 254 μm2 led to a 17% increase in cone density from 182 to 212 K. They concluded that a smaller counting window is less likely to miss higher density values when the steepness of the density gradient is changing markedly, as in the fovea. In the present study, the foveal counting window averaged 35 μm2 in the Pd 33—adult wholemounts and 527 μm2 for the younger wholemounts. The small, 254 μm2, sampling window used by Curcio et al. (Reference Curcio, Sloan, Kalina and Hendrickson1990) was seven times larger than the 35 μm2 sampling window used here. For the highest density curve in Fig. 6D, we applied a moving average of 7 to the data and found that the peak density was reduced by 56%. This suggests that increasing the sampling window area can have potentially large effects on peak density values, as was indicated (Curcio et al., Reference Curcio, Sloan, Kalina and Hendrickson1990). Therefore, the small window size used for the adult foveas may have made it easier to detect higher density values.
Mechanisms of cone packing
The complexity of the primate fovea strongly suggests that it develops by a variety of intrinsic molecular and extrinsic mechanical mechanisms. Several possible molecular factors have been identified. A correlation between fibroblastic growth factor receptor 4 expression and cone packing/remodeling has been reported (Cornish et al., Reference Cornish, Natoli, Hendrickson and Provis2004) and may play a role in cytoskeleton remodeling to allow tight packing. In addition, Eph-A6 may be involved in both axon routing around the future fovea and the formation of the FAZ (Kozulin et al., Reference Kozulin, Natoli, O’Brien, Madigan and Provis2009). A similar role for the antiangiogenic factor pigment epithelium-derived factor (PEDF) in FAZ formation has also been suggested by an in situ hybridization study that found increased message in the GCL at the developing macaque retina (Kozulin et al., Reference Kozulin, Natoli, Bumsted O’Brien, Madigan and Provis2010).
In human neonatal anencephalic retinas, which lack a GCL and have distorted central blood vessels, cones show the onset of morphological changes correlated with increased packing (Hendrickson et al., Reference Hendrickson, Djajadi, Erickson and Possin2006a). We have identified two possible mechanical factors: eye growth-induced retinal stretch and intraocular pressure transmitted via the FAZ (Springer, Reference Springer1999; Springer & Hendrickson, Reference Springer and Hendrickson2004a,Reference Springer and Hendricksonb, Reference Springer and Hendrickson2005). These papers emphasize the importance of factors within the photoreceptor layer and/or forces that act mainly on the photoreceptors, regardless whether the GCL is present or not.
Marmoset cone density is increased significantly by experimentally induced myopia (Troilo, Reference Troilo1998). In that study, visually depriving the eye of 0.4–1.3 months old animals resulted in axial elongation and myopia. Foveal cone density in the myopic eyes was, on average, 25% higher than control eyes (252 vs. 202 K). This finding suggests that the amount of foveal cone packing is plastic, can be affected by external forces, and can be altered during the period when packing/stacking occurs. These data support the model we presented that emphasized the role of intraocular pressure, eye growth, pit formation and retinal stretch on fovea formation, and cone packing (Springer & Hendrickson, Reference Springer and Hendrickson2004a,Reference Springer and Hendricksonb, Reference Springer and Hendrickson2005).
Adaptive optics (AO) combined with optical coherence tomography (OCT) and scanning laser ophthalmoscopy has been used to study human cone-packing density in various genetic and color vision defects. Female carriers of blue cone monochromatism have poor day vision because both red- and green-sensitive cones lack a functional locus control region, which drives opsin formation (Carroll et al., Reference Carroll, Rossi, Porter, Neitz, Roorda, Williams and Neitz2010). These cones presumably never make opsin and degenerate starting at fetal week 20 (Xiao & Hendrickson, Reference Xiao and Hendrickson2000), resulting in the loss of approximately half their red/green cones before the onset of cone packing. The AO data of these carriers as young adults indicate that the remaining cones do pack but at a lower density (96 K) and with a more irregular mosaic. Similarly, early cone loss associated with the C203R mutation (Carroll et al., Reference Carroll, Baraas, Wagner-Schuman, Rha, Siebe, Sloan, Tait, Thompson, Morgan, Neitz, Williams, Foster and Neitz2009) also results in reduced density and disruption of the cone mosaic regularity. Thus, early cone loss does not disrupt packing per se, but normal density is not achieved, because new cones cannot be generated and probably because cones can be recruited from only a limited amount of central retina. On the other hand, Xq28 opsin mutations do not affect cone density or mosaic regularity because OS formation occurs in spite of the defective and nonfunctional opsin, allowing affected cones to survive (Wagner-Schuman et al., Reference Wagner-Schuman, Neitz, Rha, Williams, Neitz and Carroll2010). In contrast, the LIAVA polymorphism causes a late degeneration of cones after packing occurs (Wagner-Schuman et al., Reference Wagner-Schuman, Neitz, Rha, Williams, Neitz and Carroll2010). Late cone loss results in gaps in the mosaic, suggesting that the surrounding cones cannot compensate and maintain the integrity of the foveal mosaic after it is mature. Our developmental data and the induced myopia results of Troilo (Reference Troilo1998) are consistent with these studies and show that the foveal cone mosaic is plastic during development.
Albinism has long been known to produce foveal anomalies including an absent or shallow pit and decreased cone density leading to decreased visual acuity. In a recent AO–OCT study of six young albino subjects (McAllister et al., Reference McAllister, Dubis, Tait, Ostler, Rha, Stepien, Summers and Carroll2010), pit depth varied from shallow to nonexistent and inner retinal thickness over the fovea varied from thickened to flat. However, the foveal morphology did not correlate well with the 20/20 to 20/70 visual acuity of the subjects. Subjects without a visible pit had minimal OS lengthening, while those with a shallow pit had OS in the normal length range. Furthermore, not a single subject (n = 6; their Fig. 3E) had a cone density of more than 60 K. Such low-density values may even suggest that the cones remained in a monolayer. In this study, a density of 60 K is only 2–3 times greater than the lowest densities observed early in development. The conclusion that significant packing can occur in the absence of a foveal pit in albinos (McAllister et al., Reference McAllister, Dubis, Tait, Ostler, Rha, Stepien, Summers and Carroll2010) should be tempered by the reported densities of less than 60 K. Thus, the presence of localized thickening in OCT scans and elongated OS should not be taken as evidence of stacked cone nuclei and high foveal cone densities of 200 K.
Our morphological results in marmosets (Hendrickson et al., Reference Hendrickson, Troilo, Possin and Springer2006b; Fig. 2) also show that cone packing is present well before significant OS elongation. Yuodelis and Hendrickson (Reference Yuodelis and Hendrickson1986) show that OS growth on human foveal cones is similarly delayed, but not OS growth on perifoveal cones, probably because they are subject to relatively little displacement. It may be that having a very long OS impairs cone displacement through the enveloping pigment epithelial processes and interphotoreceptor matrix, so foveal cones initiate OS elongation as they near their final position. Dorn et al. (Reference Dorn, Hendrickson and Hendrickson1995) also found that macaca parafoveal rods, but not more peripheral rods, show a similar lag in OS growth. We show here that marmoset parafoveal rods are displaced a significant distance toward the foveal center after birth, as indicated by the growth of their axon and the decrease in diameter of the RFZ, so a similar constraint may operate on rod OS growth. These data agree that OS lengthening on foveal cones and parafoveal rods is subsequent to, and separate from, cone packing. Importantly, the AO–OCT data on albino fovea indicate that, in the absence of a normal foveal pit, significant cone packing can occur in some eyes (but see below).
An AO–OCT study of five individuals aged 14–26 years who had suffered from mild retinopathy of prematurity (ROP; Hammer et al., Reference Hammer, Iftimia, Ferguson, Bigelow, Ustun, Barnaby and Fulton2008) and five normals also shows that foveal cone mechanisms are separable. Their foveal and avascular zone morphology at birth was unknown. All these children were myopes with good optical correction with spectacles, so visual acuity was not significantly compromised by the ROP. In 9 of 10 ROP eyes, the foveal pit was shallower than normal and lacked an FAZ. These data support the role of intraocular pressure acting via the FAZ in normal pit formation (Springer & Hendrickson, Reference Springer and Hendrickson2004b). However, all ROP eyes had OS lengths within normal range, although packing densities were not determined. Similar AO–OCT findings were present in four individuals with clinically hypoplastic fovea (Marmor et al., Reference Marmor, Choi, Zawadzki and Werner2008). Visual acuity ranged from 20/20 to 20/50. OCT images found a flat to shallow pit and absence of the FAZ, again stressing the importance of blood vessels in pit formation. Foveal cone OS showed less than normal elongation with “some evidence of cone packing,” although cone densities were not determined. These findings further emphasize that cone OS elongation is not tightly correlated with pit formation. However, it is not surprising that some cone packing is found even in the absence of a deep pit. As shown by Springer and Hendrickson (Reference Springer and Hendrickson2004b, Reference Springer and Hendrickson2006), eye growth induces retinal stretch, which can act as a cone-packing factor by itself. Eye growth would certainly occur in albino, ROP, and hypoplasic eyes, and this factor alone can lead to a variable amount of cone packing.
Interpreting the presence of variable degrees of cone packing associated with a shallow or flat pit in an adult is complicated by the absence of any information regarding foveal morphology from birth to 6 months of age. Developmentally, the primate pit starts out shallow, deepens appreciably as the inner retina is displaced centrifugally, and then becomes shallower as the retina is stretched and cones pack (Springer & Hendrickson, Reference Springer and Hendrickson2004b, Reference Springer and Hendrickson2005). A normal pit may have been present initially and may have led to normal cone packing, and then the pit may have become very shallow if the central retina was subjected to prolonged stretching. Preliminary finite element analysis (FEA) modeling indicates that the pit becomes shallower as stretching increases. Similarly, interpreting ectopic vessels over the fovea is problematic in the absence of longitudinal developmental information because an FAZ may have been present prenatally and later became filled with ectopic vessels because the inner retina failed to separate. Alternatively, the FAZ may have been continuously filled with vessels throughout development. Thus, it may be erroneous to draw conclusions about developmental events just based on adult foveal morphology.
These recent AO–OCT data coupled with our quantitative studies in marmoset begin to separate some of the steps in foveal development. Although we still do not understand all the underlying mechanisms, it is likely that both intrinsic molecular and extrinsic mechanisms such as retinal stretch/eye growth and pit development/FAZ formation operate to drive cone packing and OS elongation.