Introduction
The Quaternary Period of eastern Africa is a critical time and place with the emergence and evolution of technologies during the Early through Later Stone Age (Tryon and Faith, Reference Tryon and Faith2013; Brooks et al., Reference Brooks, Yellen, Potts, Behrensmeyer, Deino, Leslie and Ambrose2018; Tryon, Reference Tryon2019; McBrearty and Brooks, Reference McBrearty and Brooks2000) and the rise and dispersal of archaic and modern Homo sapiens (Groucutt et al., Reference Groucutt, Petraglia, Bailey, Scerri, Parton, Clark‐Balzan, Jennings, Lewis, Blinkhorn and Drake2015; Richter et al., Reference Richter, Grün, Joannes-Boyau, Steele, Amani, Rué, Fernandes, Raynal, Geraads and Ben-Ncer2017; Bergström et al., Reference Bergström, Stringer, Hajdinjak, Scerri and Skoglund2021; Vidal et al., Reference Vidal, Lane, Asrat, Barfod, Tomlinson, Tadesse, Yirgu, Deino, Hutchison and Mounier2022). These seminal events in human evolution occurred against the backdrop of regional and global climate change (Lamb et al., Reference Lamb, Bates, Bryant, Davies, Huws, Marshall and Roberts2018; Potts et al., Reference Potts, Dommain, Moerman, Behrensmeyer, Deino, Riedl and Beverly2020; Foerster et al., Reference Foerster, Asrat, Bronk Ramsey, Brown, Chapot, Deino, Duesing, Grove, Hahn and Junginger2022). As a result, the environmental and climatic context of our ancestors is a subject of ongoing interest, discovery, and debate (Tierney et al., Reference Tierney, deMenocal and Zander2017; Potts et al., Reference Potts, Dommain, Moerman, Behrensmeyer, Deino, Riedl and Beverly2020; Schaebitz et al., Reference Schaebitz, Asrat, Lamb, Cohen, Foerster, Duesing, Kaboth-Bahr, Opitz, Viehberg and Vogelsang2021; Foerster et al., Reference Foerster, Asrat, Bronk Ramsey, Brown, Chapot, Deino, Duesing, Grove, Hahn and Junginger2022) that demands further investigation (Faith et al., Reference Faith, Du, Behrensmeyer, Davies, Patterson, Rowan and Wood2021). In eastern Africa, evidence of these past environments and climates are found in fossilized soils (paleosols) and sedimentary deposits, which reflect ancient near-surface environments where air, water, biota, rock, and soil interact, that is, paleo-Critical Zones (Nordt et al., Reference Nordt, Hallmark, Driese, Dworkin and Atchley2012; Nordt and Driese, Reference Nordt and Driese2013; Lukens et al., Reference Lukens, Lehmann, Peppe, Fox, Driese and McNulty2017; Beverly et al., Reference Beverly, Lukens, Stinchcomb, Croft, Su and Simpson2018; Ferraro et al., Reference Ferraro, Hoggarth, Zori, Binetti and Stinchcomb2018; Ashley, Reference Ashley2020). Advances have been made in the reconstruction of the Pleistocene environments in the Lake Victoria basin (Tryon et al., Reference Tryon, Peppe, Tyler Faith, Van Plantinga, Nightingale, Ogondo and Fox2012, Reference Tryon, Faith, Peppe, Beverly, Blegen, Blumenthal, Chritz, Driese, Patterson and Sharp2016; Faith et al., Reference Faith, Tryon, Peppe, Beverly and Blegen2014, Reference Faith, Tryon, Peppe, Beverly, Blegen, Blumenthal, Chritz, Driese and Patterson2015, Reference Faith, Rowan, O’Brien, Blegen and Peppe2020; Beverly et al., Reference Beverly, Driese, Peppe, Johnson, Michel, Faith, Tryon and Sharp2015, Reference Beverly, Peppe, Driese, Blegen, Faith, Tryon and Stinchcomb2017; Garrett et al., Reference Garrett, Fox, McNulty, Faith, Peppe, Van Plantinga and Tryon2015), Turkana basin (Wynn, Reference Wynn2003; Cerling et al., Reference Cerling, Wynn, Andanje, Bird, Korir, Levin, Mace, Macharia, Quade and Remien2011; Levin et al., Reference Levin, Brown, Behrensmeyer, Bobe and Cerling2011; Du et al., Reference Du, Robinson, Rowan, Lazagabaster and Behrensmeyer2019; Nutz et al., Reference Nutz, Schuster, Barboni, Gassier, Van Bocxlaer, Robin, Ragon, Ghienne and Rubino2020), and elsewhere within the eastern Africa Rift (Beverly et al., Reference Beverly, Ashley and Driese2014; Driese and Ashley, Reference Driese and Ashley2016; Leslie et al., Reference Leslie, McBrearty and Hartman2016; Behrensmeyer et al., Reference Behrensmeyer, Potts and Deino2018; Potts et al., Reference Potts, Dommain, Moerman, Behrensmeyer, Deino, Riedl and Beverly2020). However, relatively fewer studies have reconstructed the Quaternary environments east of the Turkana basin.
The Chalbi Desert, which lies east of the Turkana basin, holds potential for reconstructing Quaternary environments and addressing questions related to human evolution. The Chalbi Desert lies within a thermally controlled depression, part of the larger Chalbi basin that formed from Cretaceous–Paleogene Anza rifting and subsequent flexural displacement of the lithosphere during Pliocene and Pleistocene Mt. Kulal, Asi, Huri Hills, and Marsabit volcano formation (Morley et al., Reference Morley, Bosworth, Day, Lauck, Bosher, Stone, Wigger, Wescott, Haun, Bassett and Morley1999; Bruhn et al., Reference Bruhn, Brown, Gathogo and Haileab2011; Fig. 1). The basin hosts volcanic and sedimentary rocks and sediments deposited from the lower Cretaceous to Quaternary (Key et al., Reference Key, Rop and Rundle1987) with evidence of Lake Chalbi formation between 13 and 10.2 cal ka BP (Nyamweru, Reference Nyamweru1986a; Nyamweru and Bowman, Reference Nyamweru and Bowman1989). This late Bølling-Allerød through Early Holocene wetter paleoenvironment stands in stark contrast to the modern arid Chalbi Desert, the world’s lowest-latitude desert with a mean annual temperature of 27°C and median annual rainfall of 150–200 mm (de Souza and Jaetzold, Reference de Souza and Jaetzold1988; Munday et al., Reference Munday, Engelstaedter, Ouma, Ogutu, Olago, Ong’ech, Lees, Wanguba, Nkatha and Ogalo2022). This eastern Africa aridity is a subject of increasing interest, as it may have played a role in shaping eastern Africa faunal and floral evolution (deMenocal, Reference deMenocal1995; Bobe, Reference Bobe2006; Munday et al., Reference Munday, Savage, Jones and Washington2023; Faith et al., Reference Faith, Rowan and Du2024).
Location and surface geology of Farre and surrounding environment. (a) Map of Africa showing location of shaded-relief map of eastern Africa (b) that includes the location of the Chalbi Desert study area (yellow rectangle), located east of Lake Turkana and the eastern African Rift margin. (c) The Chalbi Desert surface geology and key to geologic map units (modified from Key et al., Reference Key, Rop and Rundle1987). Red and yellow dots denote soil and stratigraphy localities from this study. (d) Cross-valley elevation transect from south to north, showing physiographic features: desert, basalt shield and plateaus. The black line is the 30-point running mean of the elevation data (gray dots) obtained from 30-m-resolution digital elevation model. (e) Close-up of (c) showing the Farre archaeological site (GfJ02) and the West Karole (WK) and South Maikona (SM) alluvial fans. The SM is an alluvial fan draining an eroding sandstone plateau predominantly underlain by the Maikona Formation. Basalt comprises only a small portion of the SM headwaters. The WK is an alluvial fan draining a mixture of Maikona sandstone sourced largely from the Koroli Desert and basalt plateaus. The Farre site, profile (FAR1), and geologic trench (FAR2) are on deflated sand dunes situated in a proximal alluvial fan position. Also shown in (e) is the location of the Menengai Tuff (MT), 35.62 ± 0.26 ka, from Blegen et al. (Reference Blegen, Brown, Jicha, Binetti, Faith, Ferraro, Gathogo, Richardson and Tryon2016). Locations of photos in Figure 2 are also noted (Figure 2a–g).

In light of these Quaternary fluctuations in climate and environment, the Chalbi basin Paleoanthropological Project discovered the Farre site (GfJo2) (Ferraro et al., Reference Ferraro, Binetti, Stinchcomb and Manthi2013). This team recovered faunal and archaeological materials from the site that suggested it was once an edaphic grassland setting near a large river or lake, with evidence of diverse ecosystems and multiple episodes of hominin activity, providing key insights into prehistoric environments and behaviors. We revisited this desert to present new, more detailed stratigraphic, geochronological, and paleoenvironmental data, enhancing our understanding of the Quaternary environments linked to the Farre site and the Chalbi basin.
Materials and methods
Stratigraphy and sedimentology
We studied and sampled 16 sections across a range of landforms in the southeastern portion of the Chalbi Desert (Fig. 1). The landforms consist of deflated sand dunes (Qzs), alluvial fans (Qal), playa floor (Qzl), and sandbars marginal to the playa (Qzls) (Key et al., Reference Key, Rop and Rundle1987). Stratigraphic sections are oriented along an east-west transect across the South Maikona (SM) fan and dunes and a north-south transect across the West Karole (WK) dune field and playa floor. The dimensions and properties of these fans were assessed using aerial photography and field visits. The Farre archaeological site (Ferraro et al., Reference Ferraro, Binetti, Stinchcomb and Manthi2013) is located in the WK deflated dune field setting (Fig. 1d and e).
Archaeological investigations at Farre sample a slight promontory overlooking an expansive alkaline interdune pan. The promontory spans roughly 50 m × 50 m and is carpeted in a dense scatter of archaeological and paleontological materials (Ferraro et al., Reference Ferraro, Binetti, Stinchcomb and Manthi2013). Notable surface finds include lithic technology evincing Levallois techniques, as well as faunal remains (e.g., Eurygnathohippus, Metridiochoerus) consistent with a Middle Pleistocene age (Potts and Faith, Reference Potts, Faith, Reynolds and Bobe2022; Faith et al., Reference Faith, Rowan and Du2024; Fig. 2). While Later Stone Age technology is known from the general area, it is absent from Farre. A controlled 2 m × 2 m excavation (GfJo2) recovered 2680 archaeological lithic pieces and 446 vertebrate fossil specimens. The former represent a range of locally available lithologies, with small, informal quartz and chalcedony flakes dominating the assemblage. Excavated faunal remains are primarily small, weathered bone fragments derived from equids, bovids, and hippos. Several of these fragments bear hominin bone surface modifications, indicating some measure of hominin involvement with recovered faunal remains.
Aeolian landforms in the Chalbi Desert. (a) Linear dune (Qrt) in the middle of the playa (Qzl). People are walking along the apex of the dune, facing east. Note white salt crust along surface of playa floor and adjacent to the dune. Inset photo shows nature of linear dune stratigraphy with cross-laminated and cross-bedded sands. (b) Ephemeral channel filling in with windblown sand. Channel is located on deflated sand dunes (Qzs) flanked by recent aeolian sands (Qrt). Inset photo shows profile of massive sand along channel bank. (c) Inverted topography along Qzs. Positive-relief features are a calcareous paleosol with many pedogenic carbonate nodules (d). (e) Calcrete (Qzc’) cropping out along the southern extent of the Chalbi basin study area. Note calcium carbonate is engulfing basalt gravels. (f) Windblown sand dunes along the edge of the playa floor. Note student is standing on deflated sand dune (Qzs) surface near playa floor with recent aeolian sand in the background (Qrt). (g) Photo of the Farre site area, facing south, cropping out along an interdune/pan of a deflated sand dune surface (Qzs). The archaeology is found in this interdune setting, where ephemeral rill erosion and dune blowouts expose lithic and fossilized bone fragments. (h) Soil profile from the FAR1 section. (i) Fossilized pig (Metridiochoerus sp.) and Hipparion (Eurygnathohippus) teeth, and Levallois flake from Farre. See Figure 1 for photo locations.

We assessed the stratigraphy and sedimentology of a Qzs landform of particular interest along the WK fan, using stratigraphic sections from the Farre E2016.1 archaeological excavation (FAR1), geologic trench (FAR2). Stratigraphic units are determined based on bounding discontinuities, for example, erosional disconformities or laterally extensive buried soils. Units were physically correlated between sections using those erosional disconformities or buried soils as marker boundaries. Unit correlation was inferred between sections when these features could not be physically traced to the next section. Lithofacies associations were identified using established techniques and previous research in the Chalbi basin (Nyamweru, Reference Nyamweru1986b; Miall, Reference Miall1996; Table 1).
Facies observed in stratigraphic sections and in the modern Chalbi Desert, northern Kenya..

a Interpretations from Nyamweru (Reference Nyamweru1986a, Reference Nyamweru1986b).
Geochronology
Chronological constraints were obtained using a combination of U-series and combined U-series/electron spin resonance (ESR) dating of fossil teeth, optically stimulated luminescence (OSL) and thermally transferred (TT) OSL dating of quartz grains (Supplementary Tables 1 and 2), and radiocarbon dating of pedogenic and phreatic carbonates.
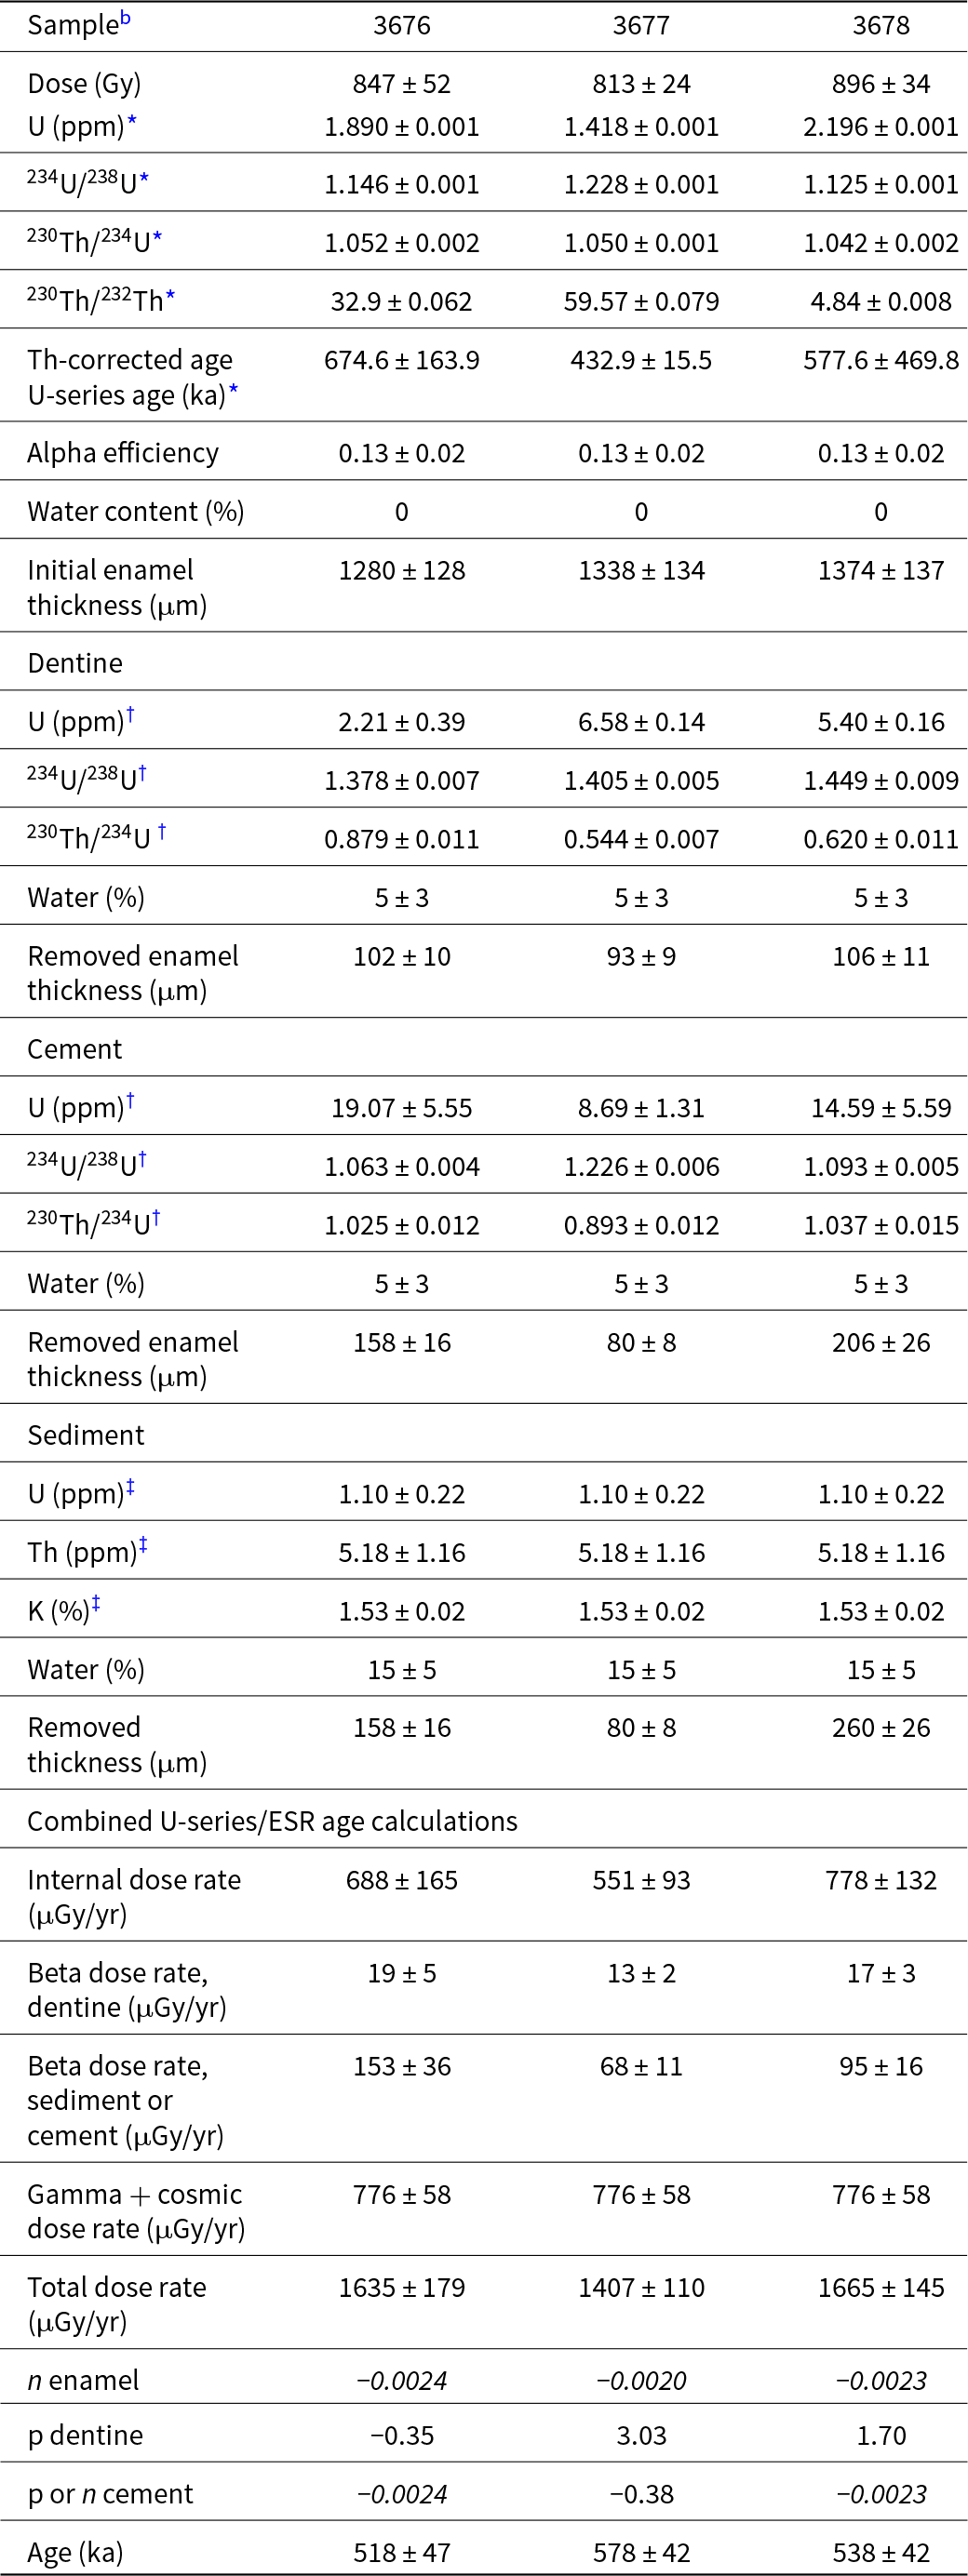
We collected three fossil teeth from the Farre E2016.1 archaeological excavation for U-series and ESR dating (Table 2). Laser ablation (LA) U-series analyses were first carried out on tooth cross sections at the Research School of Earth Sciences of the Australian National University to evaluate the suitability of the samples for subsequent ESR dating. A custom-built laser sampling system was used interfaced between an ArF Excimer laser and a Multi-Collector Inductively Coupled Plasma Mass Spectrometer (MC-ICP-MS) Finnigan Neptune (for details, see Eggins et al., Reference Eggins, Grün, Pike, Shelley and Taylor2003, Reference Eggins, Grün, McCulloch, Pike, Chappell, Kinsley, Mortimer, Shelley, Murray-Wallace and Spötl2005), following the principles and procedures described in Grün et al. (Reference Grün, Eggins, Kinsley, Moseley and Sambridge2014). The ESR dose evaluation was carried out at the Centro Nacional de Investigación sobre la Evolución Humana (CENIEH), Spain. Dose evaluation utilized the multiple aliquot additive dose method following Duval et al. (Reference Duval, Fang, Suraprasit, Jaeger, Benammi, Yaowalak, Iglesias Cibanal and Grün2019). ESR measurements of the enamel powder aliquots were carried out at room temperature with an EMXmicro 6/1 Bruker ESR spectrometer coupled to a standard rectangular ER 4102ST cavity. Solution U-series analyses of the powdered enamel samples were carried out using a Nu Plasma HR MC-ICP-MS in the Radiogenic Isotope Facility (RIF) at the School of Earth and Environmental Sciences, the University of Queensland (Australia), following chemical treatment procedures and MC-ICP-MS analytical protocols described elsewhere (e.g., Clark et al., Reference Clark, Zhao, Roff, Feng, Done, Nothdurft and Pandolfi2014; Zhao et al., Reference Zhao, Hu, Collerson and Xu2001). Combined U-series/ESR age calculations were performed with USESR (Shao et al., Reference Shao, Bahain, Dolo and Falguères2014), a Matlab-based program using the U-series (US), and Acceleration Uptake (AU) models defined by Grün et al. (Reference Grün, Schwarcz and Chadam1988) and Shao et al. (Reference Shao, Bahain, Falguères, Dolo and Garcia2012), respectively (Table 3).
The Farre archaeological site 2016 excavation fossil samples from FAR1 (Unit II in Qzs landform) submitted for U-series and electron spin resonance (ESR) analysis..

Data input and output for the combined U-series/electron spin resonance (ESR) age calculation.a.

a All errors are given at a 1σ confidence level, apart from the apparent U-series ages in the enamel (2σ). Post-Rn equilibrium was considered in teeth and sediment. Apparent U-series ages are corrected for detrital Th. The p and n values are uptake parameters, which are obtained from the use of the U-series (US) and Acceleration Uptake (AU) models, respectively. They both describe the evolution of the uranium concentration with time in a given dental tissue. See further details in Grün et al. (Reference Grün, Schwarcz and Chadam1988) and Shao et al. (Reference Shao, Bahain, Falguères, Dolo and Garcia2012).
b Key: *obtained from solution U-series analyses; †obtained from laser ablation (LA) U-series analyses, by combining results from the various LA transects carried out on a given tooth; ‡Mean values from the four sediment samples FAR16-G1 0.40, FAR16-G1 0.52, FAR16-G1 0.69 and FAR 16-G1 0.30.
Twelve luminescence samples were recovered from stratigraphic units in FAR1 and additional Chalbi Desert profiles using PVC tubes. Analyses of these samples were carried out at the Geoluminescence Dating Research Lab at Baylor University (TX, USA). Single-aliquot regeneration (SAR) OSL protocols (Murray and Wintle, Reference Murray and Wintle2003; Wintle and Murray, Reference Wintle and Murray2006) were used in this study to estimate the apparent equivalent dose of the 150–100, 250–150, or 355–250 μm quartz fraction for 71 to 30 separate aliquots (Table 4). The final luminescence age was determined using the Luminescence Dose and Age Calculation (LDAC) platform (Liang and Forman, Reference Liang and Forman2019). Among these 12 samples, one (BG4313) was also dated by TT-OSL using the SAR procedure developed by Stevens et al. (Reference Stevens, Buylaert and Murray2009).
Optically stimulated luminescence (OSL) ages on quartz grains from the Chalbi Desert, Kenya.a.

a Errors are 1σ.
b Aliquots measured, used to define equivalent dose (De) population by Central or Minimum Age Model (Galbraith and Roberts, Reference Galbraith and Roberts2012).
c De calculated on a pure quartz fraction with ultra-small aliquots with 20–80 grains/aliquot and analyzed under blue-light excitation (470 ± 20 nm) by single-aliquot regeneration (SAR) protocols (Murray and Wintle, Reference Murray and Wintle2003; Wintle and Murray, Reference Wintle and Murray2006). De was calculated by Central or Minimum Age Model (Galbraith and Roberts, Reference Galbraith and Roberts2012).
d Overdispersion values reflects precision beyond instrumental errors; values of ≤20% (at 1σ limit) indicate low dispersion in De values and define a unimodal distribution. Values >20% are associated with mixed De signature reflecting multiple grain populations or partial solar resetting.
e U, Th, Rb, and K content analyzed by ICP-MS by ALS Laboratories, Reno, NV, USA; and includes dose contribution from Rb.
f Includes a cosmic dose rate calculated from parameters in Prescott and Hutton (Reference Prescott and Hutton1994) and soft components (Liang and Forman, Reference Liang and Forman2019).
g Systematic and random errors calculated in a quadrature at 1 SD by the Luminescence Dating and Age Calculator (LDAC) at https://www.baylor.edu/geosciences/index.php?id=962356 (Liang and Forman, Reference Liang and Forman2019). Datum year is 2010 CE.
Radiocarbon dating of soil carbonate from FAR1 and other Chalbi Desert profiles was utilized to assess the apparent age for the Farre and other localities. Carbonate nodules were micro-drilled, and powdered samples were collected from the center of pedogenic carbonate nodules. The center of each carbonate nodule was sampled, assuming that this material may reflect the initial stage of formation. Carbonate samples for 14C dating were submitted to the DirectAMS lab, USA, where they were acid leached, then digested, and the resulting CO2 reduced to graphite. The 14C of the graphite sample was measured using an NEC 1.5 SDH compact Pelletron accelerator mass spectrometer (Table 5).
Radiocarbon and stable isotope data on calcium carbonate nodules from the Chalbi Desert, Kenya.

a Lab # no., - Ddirect AMS (D-AMS) lab code.
b pMC, percent modern carbon.
2c RC –, conventional radiocarbon age (radiocarbon years before present).
3dc Ages calibrated using IntCal20 curve in CALIB 8.2 (Reimer et al., Reference Reimer, Austin, Bard, Bayliss, Blackwell, Ramsey, Butzin, Cheng, Edwards and Friedrich2020). The 2σ two-sigma range and median age (in cal. ka BP) age are reported. The median calibrated calendar age before present (BP) of the 95.4% C.I. range of the weighted probability distribution, where present = 1950 CE. Ages are reported here to the nearest 10 years.
4ed Stable isotope data for each record include samples from multiple, unique nodules measured at Baylor University, TX, USA (B) and Stony Brook University, NY, USA (SB). Results reported in per mille notation normalized by the Vienna Pee Dee Belemnite standard (‰VPDB).
5fe Results reported in per mille notation normalized by the Vienna Standard Mean Ocean Water standard (‰VSMOW).
6gf Δ47 results reported in per mille on the Carbon Dioxide Equilibrium Scale (‰CDES).
7hg Carbonate clumped isotope temperatures (T(Δ47)) calculated using the equation in Petersen et al. (Reference Petersen, Defliese, Saenger, Daëron, Huntington, John and Kelson2019) adjusted for differences in acid fractionation they report and used in this study.
Detailed analytical procedures used for luminescence, ESR, U-series, and 14C dating are given in Supplementary Material 1.
Soils and paleopedology
Soil and paleosol horizons from each section (Supplementary Table 3) were assessed in the field using standard techniques (Schoeneberger et al., Reference Schoeneberger, Wysocki, Benham and Staff2012). Paleosol samples were collected by horizon for physical, chemical and mineralogical characterization following the framework detailed in Beverly et al. (Reference Beverly, Lukens, Stinchcomb, Croft, Su and Simpson2018). The bulk density (ρ), micromorphology, particle size, pH, EC, and geochemistry of whole soil were measured. The mineralogy of whole soil and clay (<2 µm) fraction were also measured. The details of the paleopedology methods are given in Supplementary Material 1.
Stable isotope geochemistry
We measured the stable carbon and oxygen isotopic composition of carbonate (δ13C and δ18O) on a subset of samples. Pedogenic carbonates were sampled for stable isotope analysis in a similar manner to 14C samples (described earlier). Carbonate nodules were examined for the occurrence of fine-grained (micritic) carbonate using a hand lens. Carbonate powders were analyzed at Baylor University (TX, USA), using a Thermo Finnegan Gas Bench II linked to a Thermo-Electron Delta V Advantage gas-source stable isotope ratio mass spectrometer that was run in continuous-flow mode. Carbon and oxygen isotope compositions were normalized to the PBD scale using the standards NBS-19 and LSVEC and are reported in delta notation, for example,

Repeated analyses of three additional standards (NBS-18, IAEA-CO-1, and a Merck carbonate) yielded standard errors of ±0.07‰ (δ13C) and ±0.09‰ (δ18O).
Additional carbonate samples were analyzed for carbonate clumped isotopes in the Department of Geosciences at Stony Brook University (NY, USA). Carbonates were powdered and reacted with phosphoric acid at 90°C on a custom, automated cryogenic gas-purification system according to methods in Gao et al. (Reference Gao, Henkes, Cochran and Landman2021). The CO2 produced from acidification was purified using cryogenic separation and gas chromatography and then analyzed by dual inlet on a Thermo Scientific MAT 253 Plus mass spectrometer. Aliquots of sample gas were measured along with dry CO2 heated to 1000°C, CO2 and H2O equilibrated at 30°C, and ETH carbonate standards (Bernasconi et al., Reference Bernasconi, Daëron, Bergmann, Bonifacie, Meckler, Affek, Anderson, Bajnai, Barkan and Beverly2021). The isotopologues of CO2 were measured at masses 44 through 49 and were used to calculate Δ47, normalized to an analytical reference gas according to the delta notation:
 \begin{equation*}{\Delta _{47}} = \,\left[ {\left( {\frac{{{R^{47}}}}{{{R^{47*}}}}} \right) - \left( {\frac{{{R^{46}}}}{{{R^{46*}}}}} \right) - \left( {\frac{{{R^{45}}}}{{{R^{45*}}}}} \right) + 1} \right] \times 1000\end{equation*}
where Ri is mass i/mass 44 and the asterisk superscript indicates ratios with stochastic abundances. Reported Δ47 values were calculated using the updated International Union of Pure and Applied Chemistry 17O/16O ratio of the standard value for VSMOW (Vienna Standard Mean Ocean Water; Brand et al., Reference Brand, Assonov and Coplen2010). Sample data are reported on the Carbon Dioxide Equilibrium Scale (CDES) using the concurrently measured CO2 and carbonate standards. All samples were run at least three times, and reported values are calculated means of those replicate measurements.
Results
Evidence of arid landforms and processes in the Chalbi Desert
The Chalbi Desert has features consistent with aeolian and alluvial fan landforms and processes. One conspicuous landform in the Chalbi is a 7.4-km-long linear dune trending NW-SE that is visible in satellite imagery (also mapped on Fig. 1c). The dune is not vegetated and is at least 5 m in height, rising from the surrounding playa floor, and consists of cross-laminated to bedded sand with salt inclusions (Pye and Tsoar, Reference Pye and Tsoar2009; Fig. 2). Paleo-current datasets on the cross-strata support interpreting the feature as an aeolian dune. The orientation of the dune is consistent with the low-level Turkana Jet wind vectors, with strong gusts from the southeast, in the region of the Marsabit highlands (Munday et al., Reference Munday, Engelstaedter, Ouma, Ogutu, Olago, Ong’ech, Lees, Wanguba, Nkatha and Ogalo2022).
Crescentic and complex linear dunes were also observed, many of which have scrub vegetation (Fig. 2). These dunes are mapped as sandbars (Qzls) along the southern margin of the playa floor (Qzl) (Fig. 1c). Further to the south deflated dunes (Qzs) have inverted topography that consists of a calcareous paleosol with many pedogenic carbonate nodules showing stage I–II formation (Gile et al., Reference Gile, Peterson and Grossman1966). Within these deflated dunes, we also observed dryland channels incised into dunes and calcareous paleosols. Windblown sand was noted filling many of the channels. Further to the southwest is a mapped calcrete unit (Qzc’) with carbonate-coated basalt gravels. Although calcretes are common in arid zones, we do not have enough information to ascertain whether this calcrete formed pedogenically, by ground water, or by some combination of the two processes.
Alluvial fans are present flanking the playa floor (Fig. 2). The SM fan is located south of the town, Maikona, along the northeastern edge of the Chalbi Desert. The surface area of the SM fan is ∼14 km2 from its apex, defined as the first distributary channel, to the toe of the fan along the playa floor margin. A large portion of the SM fan catchment area lacks basalt and has outcrops of conglomeratic sandstone of the Maikona Formation (Key et al., Reference Key, Rop and Rundle1987). The WK fan is located west of the Karole watering hole and north of the Kargi village. It has a surface area of ∼28 km2 (2,800 ha) and drains low-order ephemeral channels that are sourced from basaltic tablelands and pediments to the east, and the mixed sediments exposed along the Koroli Desert plateau to the west (Fig. 1c). The very distal end of the fan is fine-grained and has a low-sloping and long runout of fine-grained sediment onto a dry saline mudflat (Supplementary Fig. 1). Both landforms have experienced fan-head trenching and distal aggradation.
Stratigraphy and sedimentology
We identified five stratigraphic units (I–V) that range in age from (possibly) ca. 550 ka to the present (see “Chronology” for details). Older ages in this range are documented in the FAR1 and FAR2 profiles that occur on the higher-elevation surface of the deflated sand dunes (Fig. 1, Qzs). These sections expose 5.4 m of stratigraphy along the proximal WK fan (Fig. 1, Qzs), the location of the Farre (GfJ02) archaeological site (Ferraro et al., Reference Ferraro, Binetti, Stinchcomb and Manthi2013). The sections reveal three units (I, II, and V) of bedded silt and sand with evidence of weathering, while the other units, III and IV, were not observed at FAR1 and FAR2, and they are only visible through other sections in the medial and distal fan setting (Fig. 3; see Supplementary Material 2 for section GPS locations). Unit I at the base is 3.6 m thick and consists of alternating centimeter- to decimeter-scale beds of light yellowish-brown, gravelly coarse sand (Sb) with pea-size gravel lenses and light olive gray, sandy to clayey silts (Fm). These light olive gray sediments have angular blocky structure and cylindrical burrows (possible spider burrows; e.g., Foelix et al., Reference Foelix, Rechenberg, Erb, Albín and Aisenberg2017) in the lower half of the unit, consistent with minimal soil development. The upper portion of Unit I is a moderately sorted olive gray to yellowish-brown sand, and the top is marked by an erosional disconformity. Unit II is ∼0.6 to 1.0 m thick and consists of light gray, poorly sorted, gravelly medium sand with faint and discontinuous bedding, obscured by bioturbation (Fig. 3). These Unit II sands crosscut Unit I in FAR2, consistent with the presence of an erosional disconformity along the base of the unit.
Stratigraphic and geochronological results from the Chalbi Desert. (a) Stratigraphy and chronology of the West Karole (WK) alluvial fan. (b) Details of chronology and pedology of a deflated sand dune (Qzs, FAR1) at the Farre site. RF = rock fragments (>2 mm) and pertains to the particle-size analysis conducted on soil samples. (c) Stratigraphy and chronology of the South Maikona (SM) alluvial fan. Approximate distance between sections is noted at base of figure in meters. Note that Farre profiles (FAR1, FAR2, and unnamed dune profile) are on a proximal fan terrace ∼10 m higher than the WK medial fan sections. See Figure 1c for section locations. Section colors approximate Munsell color notations recorded in the field. Ages are reported here to the nearest 0.1 ka. See the geochronology tables for age details (Tables 4 and 5). MT age from Menengai Tuff (Blegen et al., Reference Blegen, Brown, Jicha, Binetti, Faith, Ferraro, Gathogo, Richardson and Tryon2016).

The medial and distal WK fan profiles coarsen upward and range in thickness from 0.5 to ∼4 m (Fig. 3). These profiles document Units III, IV, and V. The lowermost Unit III is a bedded calcareous gray silt with occasional diatomaceous beds (Lb), indicating deposition in a nearshore setting. The presence of physically traceable paleosol development and an abrupt erosional boundary with overlying gravels suggests that a prominent erosional disconformity defines the Unit III/IV boundary at WK1–3. Along the playa floor (WK6 and WK7), Units III and IV are differentiated based on color, olive gray (III) and reddish brown (IV). The olive gray clays of Unit III include coarse, ∼3-cm-diameter carbonate nodules. Vesicular A horizons and salt crusts are present toward the surface in the Unit IV reddish-brown silt. Aerial imagery shows that the reddish-brown silts are an element of distal fan “runout” along the toe of the larger WK fan complex.
Unit IV is present at both the WK and SM fans and is subdivided into IVa and IVb, respectively (Fig. 3). The base of Unit IVa is a reddish-brown, cross-bedded and matrix-supported gravel (Gc) and sand (Sc). Similar matrix-supported gravels have been documented in Pleistocene Ethiopian rift sediments (e.g., Quade et al., Reference Quade, Levin, Simpson, Butler, McIntosh, Semaw, Kleinsasser, Dupont-Nivet, Renne and Dunbar2008; Stinchcomb et al., Reference Stinchcomb, Quade, Levin, Iverson, Dunbar, McIntosh, Arnold, Demuro, Duval and Grün2023) deposited in distributive alluvial fan channels. The IVa matrix-supported gravels were likely deposited in a similar environment. The top of Unit IVa varies from bedded matrix-supported gravels (WK1 and WK2), massive sand (WK4) to weathered bedded sands with prominent and abundant calcareous nodules and channel pores (WK3). Fish fossils were observed in some Unit IVa gravel deposits.
Unit IVb along the proximal SM fan (SM1) shows a poorly sorted sand to very gravelly silt loam, where these gravels consist of weathered sandstone fragments (Fig. 3c). The stratigraphic and lithologic nature of this section is consistent with the nearby geologic map unit Qzt of Key et al. (Reference Key, Rop and Rundle1987), deflated sand dunes overlying the Maikona Formation (Fig. 1c). Moving down-fan, a lithologic discontinuity (LD), that is, a distinct change in soil parent material type, is present along all medial and distal SM sections and at a depth between 30 and 65 cm below the surface. This LD, which is potentially analogous to a change in facies or an erosional disconformity, separates the underlying Unit IVb from the overlying Unit V.
Unit V is the uppermost chronostratigraphic unit observed in the Chalbi Desert, consisting of massive to bedded sand (Sc) with weak pedogenesis (Sp). This unit immediately underlies modern dune and some alluvial fan surfaces. The geometry of Unit V shows a general thickening from proximal to distal fan, where more localized variability is dictated by dune–interdune landforms and erosional blowouts (Fig. 3). At the proximal WK fan locality, Unit V overlies Unit II at the Farre site. Unit V is a well-sorted, quartz-rich sand with abundant cross-bedding. The base of Unit V is so prominent throughout the study area that it serves as a useful datum for hanging the stratigraphic sections (Fig. 3). These Unit V sands are also found underlying modern aeolian dune surfaces at the medial and distal WK fan (WK5) localities.
Unit V in the medial (SM2 and SM5) and distal fan (SM4) consist of alluvial fan and playa floor facies. The SM medial and distal fan have more variable but finer texture than the proximal locality, ranging from fine sand to clay loam. Grain size often varies with changes in bedding or laminations, consistent with recent deposition within or adjacent to a distributary channel. The distal fan along a distributary bar (SM3) consists of sandy loam and sand-rich A and C soil horizons that overlie Unit IVb greenish-gray calcareous loam, where these latter facies reflect deposition in a playa floor setting.
Chronology
Nineteen ages using multiple dating methods constrain the age of Chalbi sediments to between ca. 550 ka to present. Of the five stratigraphic units studied, Unit I was not directly dated. However, age results for Unit II range from the early Middle to Late Pleistocene, providing minimum age constraints that suggest Unit I is >550 ka.
Unit II was extensively dated at the Farre locality given the proximity to archaeological and fossil fauna materials. Prescreening using LA ICP-MS U-series analyses performed across teeth from Unit II (Fig. 4, Table 2) show the overall suitability of the three teeth for the subsequent application of the combined U-series/ESR method. ESR analyses of the enamel samples return robust and reliable fitting results. A detailed discussion of U-series and ESR results may be found in Supplementary Material 3. Combined U-series/ESR age calculations were performed using the AU model for the dental tissues showing uranium leaching and the US model for the others (Fig. 4, Table 3). Although enamel tissues return finite apparent U-series ages (>400 ka) from solution U-series analyses, they are nevertheless beyond the limits of the US model (Grün et al., Reference Grün, Schwarcz and Chadam1988; Shao et al., Reference Shao, Bahain, Dolo and Falguères2014), precluding its use. Interestingly, dentine tissues return significantly younger apparent LA U-series age results of between ca. 190 and 80 ka (Supplementary Material 3), possibly documenting a more recent uranium uptake overprint. Age calculations returned highly consistent US/AU-ESR estimates of 518 ± 47 ka, 578 ± 42 ka, and 538 ± 42 ka for samples 3676, 3677, and 3678, resulting in a mean age of 545 ± 31 ka (±1σ uncertainty) (Table 3). While the AU model has been employed for various dental tissues, the modeled uranium uptake shows a very limited amount of uranium leaching, which does not exceed 10%. Calculations show that the total dose rate is almost equally dominated by both the enamel (43% on average from the three teeth) and the gamma and cosmic dose rate components (50% on average). Based on our experience, it is unusual that the enamel carries such a massive weight. This simply results from the relatively high uranium concentrations in the enamel (1.4–2.2 ppm) and the unusually low values in the dentine (<7 ppm) for such old samples in an open-air environment, while the cement contained only between 8 and 19 ppm. Consequently, we cannot exclude that internal dose rates might possibly be overestimated, as is commonly observed for samples with >2 ppm in the enamel, resulting in a combined U-series/ESR age underestimation (e.g., Duval et al., Reference Duval, Falguères and Bahain2012; Stewart et al., Reference Stewart, Clark-Wilson, Breeze, Janulis, Candy, Armitage, Ryves, Louys, Duval and Price2020; Stimpson et al., Reference Stimpson, Lister, Parton, Clark-Balzan, Breeze, Drake, Groucutt, Jennings, Scerri and White2016).
Fossil teeth samples from Unit II and associated electron spin resonance (ESR) dose–response curves. (Left) Cross sections of the fossil teeth analyzed by laser ablation inductively coupled plasma-mass spectrometry (ICP-MS). The thickness of the metal ring is about 1 mm. The red arrow indicates the direction of the analytical transect. Numerical results are given in Supplementary Tables 4–9. (Right) Dose–response curves, where ESR intensities are mean values and associated 1 SD derived from the two repeated measurements. The corresponding numerical results are given in Supplementary Table 10.

Sensitivity tests were performed to evaluate the impact of various sources of uncertainty on the calculated combined U-series/ESR ages for sample 3678 (Supplementary Fig. 2). Simulations were first performed with long-term water content varying between 5% (i.e., equivalent to the value used for the luminescence samples; Table 4) and 25%. They returned age results that are all consistent within 1σ, ranging from 513 ± 40 to 564 ± 45 ka. The results differ by between −4% and +5% compared with the initial calculations based on a water content of 15%. Similarly, simulations performed with long-term depth values ranging from 1 to 20 m returned highly consistent ages (between −2% and +8% compared with the initial calculations) of between 529 ± 42 and 581 ± 48 ka. In summary, the assumptions made around the long-term water content and depth have a very limited impact on the calculated ages, which systematically remain between 500 and 600 ka. Assuming that the U-series/ESR ages accurately reflect the age of the dated fossils (but see “Discussion”), Farre was occupied at a minimum by alcelaphine bovids and Equus sp. during Marine Isotope Stage (MIS) 14 (Lisiecki and Raymo, Reference Lisiecki and Raymo2005).
The four luminescence samples collected from Unit II in the Qzs landform at FAR1 (BG4311 to BG4314) return ages ranging from 124.3 ±19.8 to 30.7 ±1.4 ka (1σ) (for precise ages, see Fig. 5, Table 4). In particular, the stratigraphically uppermost sample provides a finite age of 30.7 ± 1.4 ka, while three samples provide instead minimum OSL ages of 34 to 55 ka. Consequently, quartz separates for the deepest sample BG4313 within Unit II that yielded De values >80 Gy, at dose saturation, and with 105 to 106 photon counts for natural grains, were selected for subsequent TT-OSL analysis (Fig. 6). These quartz grains with elevated luminescence emissions were suitable because the thermal transfer luminescence yielded 1% to 2% of the corresponding lower temperature SAR-OSL–based emissions (e.g., Wang et al., Reference Wang, Wintle and Lu2006; Pagonis et al., Reference Pagonis, Wintle, Chen and Wang2008; Porat et al., Reference Porat, Duller, Roberts and Wintle2009; Stevens et al., Reference Stevens, Buylaert and Murray2009; Brown and Forman, Reference Brown and Forman2012; Neudorf et al., Reference Neudorf, Lian, McIntosh, Gingerich and Augustinus2019; Supplementary Material 1). The TT-OSL analysis on these BG4313 quartz separates yields a finite age of 124.3 ±19.8 ka (1σ). In summary, the luminescence results indicate that Unit II sediment was most likely deposited between ca. 124 ka at the bottom to 30.7 ka toward the top. This time interval should probably be regarded as a minimum estimate, because it does not consider any potential additional time elapsed between the position of the samples and the lower and upper unit boundaries. Regardless, there is a significant discrepancy between these luminescence results and the much older ESR results, while all samples come from the same lithostratigraphic unit (II). We explore this in the “Discussion.”
Radial plots for equivalent dose (De) determinations for quartz, ultra-small aliquots from the Chalbi Desert. Shown is the 2σ De range for the four-component Minimal Age Model (MAM-4) or Central Age Model (CAM; after Galbraith and Roberts, Reference Galbraith and Roberts2012).

The thermally transferred optically stimulated luminescence (TT-OSL) results from Unit II along the Qzs landform. (a) Representative regenerative dose growth curves for TT-OSL emissions of quartz grains for sample TTBG4312-300, with inset representative natural TT-OSL shine down curve and (b) radial plot of equivalent dose (De) values. CAM, Central Age Mo SAR, single-aliquot regeneration.

Soil carbonate 14C from the FAR1 Sp facies in Unit II yielded two calibrated calendar ages of 31.5 and 32.5 cal ka BP (present = 1950 CE). These ages are in close agreement with the youngest luminescence age (BG-4314, 30.7 ± 1.4 ka) indicating in situ carbonate formation after the latest episode of sediment deposition (see Table 5 for the calibrated 2σ range for all radiocarbon ages).
Compared with Units I and II, Units III, IV, and V crop out at lower elevations more proximal to the Chalbi playa floor. Although Unit III is not directly dated, the Menengai Tuff previously dated by 40Ar/39Ar to 35.62 ± 0.26 ka occurs at the base of Unit IV (2σ; Blegen et al., Reference Blegen, Brown, Jicha, Binetti, Faith, Ferraro, Gathogo, Richardson and Tryon2016) and provided a minimum age constraint for the III/IV erosional disconformity (>35.62 ka). A soil carbonate nodule from Unit IVa at WK3 yielded a 14C age of ca. 23.4 cal ka BP.
Two carbonate nodules from the WK distal fan and playa floor yielded 14C ages of 39.6 ± 0.2 cal ka BP from Unit III and 26.3 ± 0.1 cal ka BP from Unit IVa (Fig. 3, Table 5). The δ13C and δ18O from those same carbonates had values ranging from −0.28‰ to −4.30‰ and 4.22‰ to −2.46‰, respectively (Table 5). The large size of the nodules (4–5 cm in diameter), the occurrence of sand-sized euhedral calcite crystals in thin section, and the δ13C and δ18O were all consistent with calcite precipitation from either ground water or evaporative stress on a lacustrine–playa floor system. Thus, these WK6 and WK7 14C ages may reflect the timing of carbonate precipitation due to the capillary rise of ground water feeding the playa floor from the surrounding higher-elevation fan (e.g., Ashley et al., Reference Ashley, De Wet, Houser and Delaney2020).
Two OSL ages of 18.3 ± 0.8 and 6.6 ± 0.6 ka from the proximal fan locality (SM1) constrain the timing of deposition of Unit IVb (Fig. 3, Table 4). At the distal fan locality (SM3) in the playa floor, another OSL age of 4.4 ± 0.3 ka provided a close but maximum constraining age on the LD. OSL ages from Unit V in the WK5 profile yielded conspicuously young results, 0.04 ± 0.01 and 0.05 ± 0.01 ka (Table 5), likely reflecting recent slump and reworking of sands along a distributary channel bank eroding a dune. This is further supported by the large overdispersion (OD) values of 90% and 59% calculated for these samples (Table 4). OSL ages in Unit V from the SM fan range from 3.0 ± 0.2 to 0.1 ± 0.01 ka (Table 5). In the distal fan aeolian dune (SM4), Unit V has an optical age of 0.9 ± 0.1 ka.
Paleopedology of the Qzs landform
Considering the possible Middle Pleistocene antiquity of the Qzs map unit, we evaluated the pedology of this landform at the Farre site. Pedogenic modification of Unit II in the deflated dunes is evident and suggested by the presence of soil structure, rubification near the top of the unit, and abundant pedogenic carbonate nodules. At the Farre site, calcareous root casts or rhizocretions and nodules from Unit II overprinted the I–II boundary and are observed to a depth of ∼3 m in the FAR2 profile. Pedogenic structure consists of prominent coarse columnar peds and vertical fractures.
The FAR1 soil weathering the Qzs landform is a sandy loam to sand calcareous and salt-affected soil with an Akz-Bkz-BCkz1-BCkz2-C profile. In places, dune sand covers the profile and shows varying degrees of oxidation (e.g., Fig. 3, FAR2). Micromorphology shows that sand grains in FAR1 consisted mostly of quartz and feldspar with minor amounts of amphibole, olivine, and volcaniclastic grains (Fig. 7). The bulk powder X-ray diffraction and microscopy of FAR1 samples showed quartz and calcite as the primary minerals with minor amounts of feldspar and clay (Supplementary Material 4, Supplementary Fig. 3). Minor peaks at 5.61 Å, 3.43 Å, and 2.92 Å in the Farre soil are consistent with analcime, which is also a major mineral component in the playa floor (Qzl).
Soil micromorphology of FAR1 soil on deflated sand dune (Qzs). (a) Plane-polarized light (PPL) image of pedogenic calcite (PC) filling voids. (b) Close-up PPL image of pedogenic calcite with microspar texture. (c) Split view of PPL (left) and cross-polarized light (XPL) (right) image of FAR1 grains showing granostriated (GS) birefringence fabric and clay bridges between some grains. (d) XPL image of fractured feldspar grain with reddish-brown moderate birefringent infilling (clay).

Prominent micromorphological features in the FAR1 soil include close-packed sand with iron and aluminosilicate clay and silt coatings along grain boundaries, that is, granostriated and chitonic birefringence fabrics (Stoops, Reference Stoops2003). Infill features, for example, krotovina, root traces, or vertical fractures, originate from the surface and crosscut the older soil matrix. The infill soil also showed chitonic fabric but to a lesser extent than the surrounding matrix (Fig. 7).
The Farre soil has physical and chemical features consistent with soil rich in exchangeable Na like a sodic soil. The Akz horizon had a prominent, very coarse columnar ped structure, common in sodic soils in semiarid to arid environments. Although exchangeable Na was not measured, the extremely alkaline pH and moderate to low EC at Farre (Supplementary Table 11), combined with the columnar ped structure, were consistent with sodic soils documented elsewhere (Soil Survey Staff, 2014).
Soil carbonates were present at the Farre site, primarily as 0.5- to 2-cm-diameter nodules, stage I–II carbonate formation (Gile et al., Reference Gile, Peterson and Grossman1966). Soil carbonates present in the field and thin section were consistent with CaCO3 measurements on the matrix from the Akz-Bkz-BCkz1-BCkz2 horizons, where values ranged from 2.0 to 6.6 wt%. Thin sections show carbonates with microspar nodules having equigranular subhedral crystallites and crystal diameters ranging from 10 to 25 μm (Fig. 7a and b). Finer-grained nodules tended to cast a gray appearance due to some micrite present. In some cases, nodules engulfed the surrounding matrix; whereas deeper nodules contained crosscutting channel pores with Fe-Mn recessed into the nodule matrix adjacent to pore walls (hypocoatings).
Stable Isotope Geochemistry
Carbonate δ13C values range from −4.3‰ to −0.3‰, and δ18O‰ values range from −2.5 to 4.2‰. The same soil carbonate nodules that yield ages between ∼31 and 33 ka have δ13C ranging from −4.3‰ to −3.1‰; whereas the δ18O values are higher (i.e., 18O-enriched) toward the surface, from −2.5‰ to −0.3‰. These values are notably more enriched than δ18O values from terminal Pleistocene–Early Holocene Melanoides tuberculata shells (−4.5‰ to −3‰) from paleo-Lake Chalbi (Abell and Nyamweru, Reference Abell and Nyamweru1988). A weak linear relationship between δ13C and δ18O is evident (r2 = 0.36, P = 0.09, n = 7; Fig. 8), driven primarily by lower δ18O values at the Farre site in a proximal fan setting.
Stable isotope, environmental and age data from Farre and the Chalbi Desert. (a) δ13C and δ18O of pedogenic and groundwater carbonates. Partially transparent symbols correspond to samples analyzed at Baylor University (TX, USA), and bold symbols correspond to those analyzed at Stony Brook University (NY, USA). (b) The clumped isotope temperatures (T(Δ47)) plotted against radiocarbon age of carbonate nodule and (c) clay content. The plot in c shows data clustering as a function of alluvial fan and aeolian dune sands (brown oval), and playa muds (green circle). There are fewer data in b than in c, because not all measured samples have corresponding ages. All plots show linear regressions (black line) with 95% confidence intervals (gray shade).

We used δ13C values of pedogenic carbonates to calculate the fraction of woody cover (f wc) at the Farre site and other localities using the methods of Cerling et al. (Reference Cerling, Wynn, Andanje, Bird, Korir, Levin, Mace, Macharia, Quade and Remien2011). First, the δ13C of carbonates is converted to theoretical organic matter source composition (δ13Com) using a +14‰ enrichment factor. Woody cover is then calculated using the transfer function:
 \begin{equation}{f_{{\text{wc}}}} = {\left\{ {\sin \left[ { - 1.06688 - 0.8538\left( {{{\delta }^{13}}{{\text{C}}_{{\text{om}}}}} \right)} \right]} \right\}^2}\end{equation}
All but two localities fall within a range of 14–20% woody cover, which is consistent with wooded grassland (10–40% woody cover) in the UNESCO biome classification. These values are much higher than current bare-earth conditions in this arid locality, but some modern-day woody vegetation is present (Fig. 2b, f, and g). The SM4 and WK7 localities have calculated f wc values of 5% and 2%, respectively. These values are consistent with modern grasslands (<10% woody cover), although the WK7 site has little to no grass cover and the carbonate sample shows evidence of phreatic influence, and therefore these results may be complicated by dissolved inorganic carbon sources that are not a function of the overlying vegetation type or relative abundances.
Carbonate clumped isotope values (Δ47) from these samples vary from 0.566‰ to 0.636‰ (Table 5). Clumped isotope temperatures (T(Δ47)) are calculated using the temperature calibration of Petersen et al. (Reference Petersen, Defliese, Saenger, Daëron, Huntington, John and Kelson2019). If we exclude samples that were collected from depths <50 cm below the surface (i.e., samples that formed in conditions of mixed soil and atmospheric CO2; see Quade and Levin Reference Quade, Levin, Sponheimer, Lee-Thorp, Reed and Ungar2013), the values range from 0.566‰ to 0.580‰, suggesting that pedogenic carbonate formation temperatures ranged from 31°C to 36°C. Plotting all T(Δ47) data, regardless of depth, shows no obvious correlation with age, but does show a significant (P < 0.05, R2 = 0.78) inverse correlation with clay content (Fig. 8b and c), with warmer temperatures associated with samples that have lower clay content.
Discussion
This study expands the age of Quaternary sediments of the Chalbi Desert, providing crucial insights into Middle Pleistocene to Holocene environmental conditions in northern Kenya. Sixteen stratigraphic sections and 19 ages obtained from U-series/ESR, luminescence, and radiocarbon methods were used to build a Quaternary chronostratigraphy of the Chalbi Desert. The facies comprising the chronostratigraphy presented here were largely documented through previous work (Nyamweru, Reference Nyamweru1986a; Key et al., Reference Key, Rop and Rundle1987). Prior work showed that the Quaternary sediments of the Chalbi extended as far back as the late Bølling-Allerød to Early Holocene (Nyamweru, Reference Nyamweru1986b; Nyamweru and Bowman, Reference Nyamweru and Bowman1989). Our revised chronostratigraphy presented here, Units I–V, spans the past half million years, having broader implications for Quaternary landform development in eastern Africa and archaeological site formation from the Middle to Later Stone Age.
Chronostratigraphy of the deflated sand dunes (Qzs)
Units I and II crop out in the deflated sand dune surfaces (Qzs) along the southern margin of the Chalbi playa. Combined U-series/ESR dating on the fossil teeth from Unit II at Farre yields a mean age of 545 ±31 ka, coeval with MIS 14 (Lisiecki and Raymo, Reference Lisiecki and Raymo2005) and “environmental episode 1” from the Chew Bahir basin (Foerster et al., Reference Foerster, Asrat, Bronk Ramsey, Brown, Chapot, Deino, Duesing, Grove, Hahn and Junginger2022; Fig. 9). From a methodological point of view, this is likely to be a minimum age constraint, given the relatively high internal dose rate values modeled. However, despite the apparent consistency between Farre biostratigraphy (e.g., Eurygnathohippus, Metridiochoerus; Ferraro et al. Reference Ferraro, Binetti, Stinchcomb and Manthi2013) and the early Middle Pleistocene U-series/ESR chronology obtained here, there is at least a 350,000 year discrepancy between those numerical ages and the late Middle to Late Pleistocene luminescence and 14C age results from quartz sand and soil carbonate, respectively. Furthermore, these geochronological data were collected from a single excavation area of limited extension and spanning only 70 cm depth, and so they are closely associated. Consequently, the uncertainty on the stratigraphic correlation and association of the various samples is therefore minimal. In other words, because we do not have evidence suggesting that the TT-OSL and U-series/ESR ages may be either strongly underestimated or overestimated, the dating results obtained for Unit II may simply indicate that the fossil assemblage, or at least part of it, and the host sediment are not coeval—that is, fossils were reworked from older deposits, or the host sediment may have been more recently exposed to sunlight. In this context, the combined U-series/ESR age results should be considered with caution, as they are based on the assumption that the current sedimentary environment has prevailed throughout the tooth burial history.
Chalbi Desert chronology, environments, and pedogenic pathways compared with eastern Africa episodes of environmental change. (a) Chalbi Desert chronology from this study. Ages are offset by type on the y-axis to better illustrate individual age distribution. (b) Chronostratigraphy of the Chalbi Desert. (c) Depositional environments (gray bars) inferred from the Qzs stratigraphy at the Farre locality using ages, faunal assemblage, stratigraphy, and sedimentology. The depositional environment is unknown from ∼475 to 150 ka due to site burial and subsequent erosion and landscape deflation. Inferred pedogenic pathways of Qzs soil using characterization data and micromorphology from Farre site. (d) Carbonate clumped isotope temperature (T(Δ47)) reconstructions for the Chalbi Desert, plotted along the x-axis using radiocarbon ages (Figure 8b). (e) Chew Bahir basin core (CHB14-2) K/Zr record used as proxy for aridity (Foerster et al., Reference Foerster, Asrat, Bronk Ramsey, Brown, Chapot, Deino, Duesing, Grove, Hahn and Junginger2022) annotated with environmental episodes from the CHB14-2 K/Zr record. Data adapted from Foerster et al. (Reference Foerster, Asrat, Bronk Ramsey, Brown, Chapot, Deino, Duesing, Grove, Hahn and Junginger2022). Blue horizontal rectangles signify episodes that were relatively wet, whereas tan rectangles signify episodes that were relatively dry. Vertical blue and tan lines through entire figure are from Foerster et al. (Reference Foerster, Asrat, Bronk Ramsey, Brown, Chapot, Deino, Duesing, Grove, Hahn and Junginger2022), also signifying wet (blue) and dry (tan) intervals. (f) Generalized phases of modern human origins, from Foerster et al. (Reference Foerster, Asrat, Bronk Ramsey, Brown, Chapot, Deino, Duesing, Grove, Hahn and Junginger2022), adapted from Bergström et al. (Reference Bergström, Stringer, Hajdinjak, Scerri and Skoglund2021). ESR, electron spin resonance; TT-OSL, thermally transferred optically stimulated luminescence.

Despite the uncertainty on the exact age of the fossil assemblage, there are nevertheless various independent lines of evidence supporting the greater antiquity of the fossil teeth compared with the associated sediment (i.e., >124 ka). First, the enamel tissues have consistent apparent U-series ages close to secular equilibrium (>400 ka; Table 4), which provides a minimum age constraint to the teeth. Second, the magnitude of the De values (between 800 and 900 Gy; Table 4) are within the range of values commonly obtained for Middle Pleistocene samples (e.g., Falguères et al., Reference Falguères, Bahain, Yokoyama, Arsuaga, Bemudez de Castro, Carbonell, Bischoff and Dolo1999; Wagner et al., Reference Wagner, Krbetschek, Degering, Bahain, Shao, Falguères, Voinchet, Dolo, Garcia and Rightmire2010) found in a standard radioactive environment (i.e. 1000–1500 µGy/yr). Consequently, an Early to mid-Middle Pleistocene age may not be reasonably discarded for the fossil assemblage, which is consistent with biostratigraphic evidence.
The TT-OSL age of 124.3 ± 19.8 ka (1σ) of a sample collected slightly below the teeth (69 cm vs. 55–65 cm; Tables 2 and 4) indicates that the sediment was deposited between 164 and 84 ka considering the 2σ error range. The low OD value obtained for this sample (19%) shows the overall good homogeneity of the quartz grains and indicates the absence of partial bleaching that could result from partial resetting of the luminescence signal, a mixture of younger grains with an older grain population, or a postdepositional mixing or inclusion of younger windblown sand. Interestingly, petrographic evidence of sand-sized quartz infilling burrows or cracks (Fig. 7a and b) would instead be consistent with the hypothesis that quartz grains of a younger OSL age were mixed with older grains. Thus, the TT-OSL age reveals the timing of the most recent episode of aeolian deflation and backfilling, which has led to a complete signal reset of all grains, including those resulting from older deposits in the FAR1 soil, and is consistent with the mapped surface geology indicating deflated sand dunes (Key et al., Reference Key, Rop and Rundle1987). The TT-OSL age is also in much closer agreement to the apparent U-series ages on the dentine (ca. 190–80 ka; Supplementary Material 3), which may reflect a uranium uptake overprint resulting from a more recent modification of the geochemical environment of the teeth, consistent with the successive erosion of the sediment originally surrounding the teeth and new sediment deposition constrained by the TT-OSL age.
The finite OSL age obtained from the upper part of Unit II shows that sediment deposition lasted at least until 30.7 ka. Around that time, a Late Pleistocene episode of calcareous soil formation within Unit II has been documented by the finite 14C ages (∼32.5–31.5 ka; Table 5) on soil carbonate. These finite pedogenic carbonate ages assume that the carbonate formed (1) without geogenic carbonate mixing and (2) in a closed geochemical system (Zamanian et al., Reference Zamanian, Pustovoytov and Kuzyakov2016 and references therein). This latter assumption means that the soil carbonate did not dissolve or re-precipitate after formation, which would yield a younger apparent age. To minimize uncertainty in these assumptions, we examined soil carbonates using optical microscopy to look for evidence of (1) geogenic carbonates and (2) dissolution and re-precipitation (Durand et al., Reference Durand, Monger, Canti, Stoops, Marcelino and Mees2010). Although petrography shows no signs of septarian cracking in carbonate nodules, which may indicate dissolution and re-precipitation, we did find equigranular subhedral crystallites with crystal diameters ranging from 10 to 25 μm (Fig. 7a and b). These carbonate crystals are reminiscent of calcite replacing root tissues in semiarid soils (Durand et al., Reference Durand, Monger, Canti, Stoops, Marcelino and Mees2010), suggesting that more than likely the dissolved inorganic carbon forming carbonate originated from pedogenic processes.
To sum up, the existing discrepancy between the combined U-series/ESR ages obtained directly from the fossil remains and the TT-OSL age of the host sediment indicates that the fossil assemblage, or at least part of it, is significantly older than the burial of Unit II sediment. Such a scenario, which is not uncommon in either karst or open-air context (e.g., Grün et al., Reference Grün, Eggins, Aubert, Spooner, Pike and Müller2010; Duval et al., Reference Duval, Arnold, Bahain, Parés, Demuro, Falguères, Shao, Voinchet, Arnaud and Berto2024; Martínez-Pillado et al., Reference Martínez-Pillado, Demuro, Ortiz, Shao, Arnold, Duval, Cheng, Torres, Santos and Falguères2024), is compatible with the geologic evidence suggesting a depositional environment resulting from dune deflation. The fossiliferous layer may have been successively exposed to sunlight as a result of erosion in the area and last buried in situ about 124 ka ago. In that regard, the future taphonomic study of the fossil material should provide valuable additional insights by (1) assessing the extent to which the teeth may show weathering features typical of surface exposure compatible with an erosion event and the previously documented deflation (Qzs; Key et al., Reference Key, Rop and Rundle1987) and (2) helping to shed light on whether the teeth may have experienced transport.
This depositional scenario described earlier induces a major uncertainty in the environmental dose rate evaluation for the U-series/ESR age calculation. Although it cannot be discarded that the original (i.e., pre-reworking or pre–last surface exposure) surrounding sediment had a radioactivity like that of the current environment, which is quite possible given the limited variability of the total dose rate measured vertically along the stratigraphy (see Table 4), this cannot be confirmed with certainty. Consequently, until this open question can be properly addressed, the combined U-series/ESR age of ∼545 ka should probably be treated with caution and regarded as mostly indicative at best. Nonetheless, both ESR and U-series data also indicate the great antiquity of the fossil teeth dated, and a Middle Pleistocene age range may thus be reasonably assumed for the fossil assemblage of Farre.
Paleoenvironments of the deflated sand dunes (Qzs)
Given that landforms in the Chalbi basin archive Middle Pleistocene fossils and archaeology, we discuss the paleoenvironments documented in the Qzs landform. The putative early Middle Pleistocene record from the Qzs landform at Farre may coincide with environmental episode 1 documented in the Chew Bahir core, 225 km to the NNW (Foerster et al., Reference Foerster, Asrat, Bronk Ramsey, Brown, Chapot, Deino, Duesing, Grove, Hahn and Junginger2022; Fig. 9). This episode lasted from 617 to 515 ka, and based on a K/Zr geochemical aridity proxy, the basin was characterized by wet, relatively stable conditions with no significant climate variability. It is possible that the Middle Pleistocene Unit II and older Unit I experienced a similar wet climate. The presence of clayey sand with gravel lenses in the underlying Unit I at FAR2 are similar with respect to hyperconcentrated flow deposits documented at zones where ephemeral rivers meet aeolian systems (Svendsen et al., Reference Svendsen, Stollhofen, Krapf and Stanistreet2003). Similar deposits have been documented in Middle Stone Age layers at Olduvai Gorge (Smedley et al., Reference Smedley, Fenn, Stanistreet, Stollhofen, Njau, Schick and Toth2024). The advanced grain alteration with Fe-oxide-rich clay and faunal assemblage from Unit II may be relict features of a wet and stable climate in a grassland or bushland setting.
The Middle Pleistocene fauna from Unit II that lived near available water in a grassland setting stands in stark contrast to the more variable late-Middle to Late Pleistocene and Holocene paleoenvironmental conditions also documented. The presence of columnar soil ped structure, very strongly alkaline pH, and nonsaline conditions of the Farre soil suggest this is a sodic epipedon. Sodic soils are those where the level of neutral soluble salts is low (ECe < 4 dS/m); yet the level of exchangeable Na is so high that only salt-tolerant plants can stand such conditions. Sodic soils are common in areas where abundant Na+ combined with evapotranspiration exceeding precipitation results in little to no water infiltration to leach cations. The Na+ is likely from dust inputs sourced from the nearby playa floor, where abundant Na-rich minerals (e.g., halite, analcime, nahcolite) exist at the barren surface susceptible to wind erosion and transport. This conclusion is consistent with the modern Chalbi Desert climate, where the very strong low-level Turkana Jet plays a central role in maintaining this aridity (Munday et al., Reference Munday, Engelstaedter, Ouma, Ogutu, Olago, Ong’ech, Lees, Wanguba, Nkatha and Ogalo2022). Desert and xeric shrubland vegetation, as well as the presence of linear and barchanoid dunes, are all consistent with the possibility of dust transport of analcime-rich playa muds to Unit II.
Sodic soil conditions are consistent with the modern-day arid Chalbi Desert; however, the presence of clay illuviation and stage I–II calcium carbonate precipitation (Gile et al., Reference Gile, Peterson and Grossman1966) suggest that there may have been more effective moisture in the past, similar to polygenetic soils in the Mojave Desert (McFadden et al., Reference McFadden, Wells and Dohrenwend1986; Reheis et al., Reference Reheis, Goodmacher, Harden, McFadden, Rockwell, Shroba, Sowers and Taylor1995). The Late Pleistocene arid soil-forming conditions with fluctuations in moisture overprinting Unit II are consistent with the Chew Bahir record that documents aridification and extreme fluctuations in moisture during environmental episodes 9–12 (Foerster et al., Reference Foerster, Asrat, Bronk Ramsey, Brown, Chapot, Deino, Duesing, Grove, Hahn and Junginger2022; Fig. 9). Evidence of more effective soil moisture documented in Unit II is consistent with nearby lake-level records or hydroclimate proxies showing wetter intervals during the last interglacial, MIS 3 (30, 40, and 44 ka) (Butzer et al., Reference Butzer, Brown and Thruber1969; Nyamweru and Bowman, Reference Nyamweru and Bowman1989; Brown and Fuller, Reference Brown and Fuller2008; Foerster et al., Reference Foerster, Junginger, Langkamp, Gebru, Asrat, Umer and Lamb2012, Reference Foerster, Vogelsang, Junginger, Asrat, Lamb, Schaebitz and Trauth2015; Forman et al., Reference Forman, Wright and Bloszies2014) and abrupt shift to humid conditions in southeast Africa following Heinrich event 4 (H4; 38–37 ka) (Tierney et al., Reference Tierney, Russell, Huang, Damsté, Hopmans and Cohen2008).
Age and paleoenvironments of medial and distal fans (Qal, Qzs, and Qzl)
The evidence of Late Pleistocene climate variability overprinting Unit II is evident in the stratigraphy (Units III–IV) underlying the lower-elevation medial and distal fan surfaces and playa floor. Unit III at the WK medial fan localities is lower in elevation than at the Farre site and shows signs of an expanded Chalbi playa with gray silts and diatomaceous beds and littoral zone deposits. The reduced colors of Unit III are consistent with sub- to anoxic conditions common to playa deposits. This time of inferred lake expansion signals an increase in water that may correlate to wetter climate conditions >35.62 ka. The presence of an erosional disconformity underlying Unit IVa, dated to >35.62 ka, and the occurrence of oxidized and cross-bedded gravels overlying the unconformity marks a phase of lake regression and alluvial fan progradation, signaling a decrease in water supply and possible drier climate. If we assume that this regression phase occurred not long before 36 ka, it coincides with the dry environmental episode 10 of the Chew Bahir basin, part of a larger aridification trend (Foerster et al., Reference Foerster, Asrat, Bronk Ramsey, Brown, Chapot, Deino, Duesing, Grove, Hahn and Junginger2022; Fig. 9).
Although alluvial fan progradation associated with Unit IVa coincides with a regional aridification trend, there are additional lines of evidence that suggest conditions may have been wetter than modern. The occurrence of fish fossils in Unit IVa oxidized channel gravels suggest an increase in stream power when compared with modern-day ephemeral distributary channels in the study area, the latter of which are either fine-grained or filled with windblown sand. This inferred increase in stream power, which led to the erosional disconformable surface of Unit III and the aggradation of Unit IVa sediments, is consistent with an increase in sedimentation in the Chew Bahir basin between 45 and 35 ka (Foerster et al., Reference Foerster, Junginger, Langkamp, Gebru, Asrat, Umer and Lamb2012) and an abrupt shift to humid conditions as previously noted (Tierney et al., Reference Tierney, Russell, Huang, Damsté, Hopmans and Cohen2008). These data suggest that even though a long-term aridification trend may be evident in the stratigraphic record, the stream power of Chalbi alluvial fans is sensitive to regional changes in hydroclimate.
Alternatively, the volcano-tectonic history may drive some of the changes documented in the Quaternary stratigraphy of the Chalbi Desert. The Menengai Tuff dated to ∼36 ka marks the III–IVa transition. This tuff, an indication of volcano-tectonic activity, is consistent with Late Pleistocene activity in the region (Ebinger et al., Reference Ebinger, Yemane, Harding, Tesfaye, Kelley and Rex2000; Michon et al., Reference Michon, Famin and Quidelleur2022). Thus, we cannot exclude the possibility that the change in III–IVa facies may be related to volcano-tectonically driven changes in faulting/accommodation. This change may have influenced the progradation of alluvial fan in response to basin axis subsidence or basin margin uplift.
Evolution of the SM fan to the north of the Farre site and WK shows minor sedimentation during the Holocene, mostly postdating to the African humid period (AHP; 15–4.5 ka). Specifically, the SM fan does show evidence of sedimentation at 3.0 ± 0.2 and 0.1 ± 0.01 ka along the medial and distal portions of the fan, respectively. Although these events postdate the AHP and coincide with predominantly arid conditions with humid excursions around 3 ka and 2 to 1.5 ka from Chew Bahir (Foerster et al., Reference Foerster, Junginger, Langkamp, Gebru, Asrat, Umer and Lamb2012), the SM sediment layers are thin and possibly reworked by aeolian sedimentation. The 3.0 ± 0.2 ka event is along a medial fan position that may reflect more minor, regional precipitation events.
The basal optical age on quartz from Unit V in the SM4 dune profile suggests that aeolian activity occurred in this region at 0.9 ± 0.07 ka. This dune activation age is consistent with abrupt termination of humid conditions following 1.3 ka as evidence in the Chew Bahir K record (Foerster et al., Reference Foerster, Junginger, Langkamp, Gebru, Asrat, Umer and Lamb2012) and widespread evidence of drier conditions during the Medieval Climate Anomaly (Nash et al., Reference Nash, De Cort, Chase, Verschuren, Nicholson, Shanahan, Asrat, Lézine and Grab2016). An optical age from Unit IVb in the playa floor facies at the SM3 site suggests fine-grained deposition in the playa no younger than 4.4 ± 0.3 ka. The termination of playa deposition in the Chalbi ∼4.4 ka is nearly identical to the timing of the final Lake Turkana regression to <20 m above modern lake level at 4.6 ka (Bloszies et al., Reference Bloszies, Forman and Wright2015) and the onset of dry conditions in the Suguta valley (Garcin et al., Reference Garcin, Junginger, Melnick, Olago, Strecker and Trauth2009) and Chew Bahir basin (Foerster et al., Reference Foerster, Junginger, Langkamp, Gebru, Asrat, Umer and Lamb2012). The similarity in timing of hydrologic deficit between Chalbi and these regional basins is consistent with increasing aridity during the Late Holocene. Similar timing of lake-level regression between these basins suggests some common factor driving aridity at both locations. Modern meteorological research shows that the presence of a strengthened low-level jet (the modern Turkana Jet) can enhance aridity in eastern Africa valleys, including the Chalbi and Turkana basins (Munday et al., Reference Munday, Washington and Hart2021, Reference Munday, Engelstaedter, Ouma, Ogutu, Olago, Ong’ech, Lees, Wanguba, Nkatha and Ogalo2022). It is likely that a strengthened Turkana Jet existed during the Late Holocene.
Late Pleistocene paleoenvironments inferred from isotope geochemistry
A direct correlation between δ13C and δ18O values in soil carbonates indicates a deviation from the theoretical meteoric calcite line (Ufnar et al., Reference Ufnar, Gröcke and Beddows2008). This is likely driven by a combination of kinetic effects—δ18O increases with enhanced evaporation—and decreased soil productivity—δ13C increases with lower respiration rates and a larger fraction of atmospheric CO2 in soil pores (Quade et al., Reference Quade, Cerling and Bowman1989; Cerling, Reference Cerling1984, Reference Cerling1991; Ufnar et al., Reference Ufnar, Gröcke and Beddows2008). These direct correlations between δ13C and δ18O are also observed in some arid closed lacustrine basins (Li and Ku, Reference Li and Ku1997; Horton et al., Reference Horton, Defliese, Tripati and Oze2016).
When all carbonates from this study are grouped together, there is no significant correlation between δ13C and δ18O values (Fig. 8). However, the carbonate from WK7 is interpreted to be a possible precipitate from phreatic waters, as evidenced by an anomalous 14C age and large 5-cm-diameter nodules. When this sample is excluded, the correlation between samples is significant (r2 = 0.73, P = 0.02), although the sample size is relatively small and therefore may not fully characterize the variability in carbonate compositions at the locality. Samples from FAR1, a proximal fan site, have lower δ13C values than those from medial and distal fan localities. This finding indicates that the direct relationship between δ13C and δ18O at FAR1 is likely driven by soil productivity and kinetic effects from different evaporative stresses compared with the localities farther out on the alluvial fans. This is consistent with previous work that showed varying evaporative stress as a driver of changes in the δ18O from Melanoides tuberculata shells from the Chalbi (Abell and Nyamweru, Reference Abell and Nyamweru1988). We note that the f wc proxy may not be applicable in arid environments like the Chalbi, as work shows decoupling between δ13C of soil carbonate and δ13C of organic matter related to the dynamics of atmospheric and respired soil CO2 in low-productivity arid environments (Da et al., Reference Da, Zhang, Li and Ji2020). Moreover, sparsely vegetated landscapes with bare earth (such as the Chalbi) with few C3 shrubs and no grass might yield a very high f wc estimate.
A striking observation from the carbonate clumped isotope data is a strong correlation between clay content and measured T(Δ47) values (Fig. 8c). In arid tropical climates, especially in eastern Africa, it is well known that soil temperature attenuates with depth, with surface temperatures that can far exceed mean annual air temperature (MAAT) but that approach MAAT below soil depths of ∼0.5 m (Passey et al., Reference Passey, Levin, Cerling, Brown and Eiler2010). Solar heating is responsible for elevated soil-surface temperatures, particularly during midday, and thus the upper few centimeters of soils are subject to higher-frequency (i.e., diurnal or seasonal) swings in temperature than soils at greater depths (Quade et al., Reference Quade, Eiler, Daeron and Achyuthan2013). Secondary controls on soil temperature are the albedo of the soil surface, its water content, and shading from overlying vegetation (Geiger et al., Reference Geiger, Aron and Todhunter2009). We do not have an explanation for the single T(Δ47) value of 14°C, which is more than 10°C cooler than Chalbi MAAT (Section 1), but we also cannot rule out the incorporation of geogenic carbonate or non-equilibrium clumped isotope fractionation expressed in this sample. Either including or excluding this low value, the average measured T(Δ47) is virtually identical to Chalbi MAAT and does not appear to change with time or across paleoclimate changes in the Chalbi–Chew Bahir region (Fig. 9d and e). There are, however, physical reasons to expect minor lithologic controls on T(Δ47) as indicated by our dataset. First, the albedo of sand is typically substantially higher than that of muds or mudstones, thus reflecting more incident solar radiation (Geiger et al., Reference Geiger, Aron and Todhunter2009); second, water-saturated surfaces have a lower albedo than dry ones. Neither of these would yield a negative relationship between clay content, as proxy for water content, and soil temperature. However, the complex effects of thermal conductivity and latent heat of vaporization in wet soils under arid climates may serve to dampen the temperature during soil water evaporation and the concentration of dissolved ions (e.g., Ca2+ and CO3−) necessary for pedogenic carbonate formation (Vargas Zeppetello et al., Reference Vargas Zeppetello, Battisti and Baker2019).
Perhaps more importantly, the timing of carbonate formation can impose seasonal temperature biases on measured T(Δ47) (Kelson et al., Reference Kelson, Huntington, Breecker, Burgener, Gallagher, Hoke and Petersen2020). Eastern Africa is renowned for its biannual distribution of rains, driven by the seasonal, latitudinal migration of the Intertropical Convergence Zone, which is modulated by local and remote climate forcings (e.g., ENSO; Kotikot et al., Reference Kotikot, Smithwick and Greatrex2024). Despite the seasonal nature of rainfall delivery to northern Kenya, seasonal temperature variability is low, and its average annual temperature is among the highest on Earth (Passey et al., Reference Passey, Levin, Cerling, Brown and Eiler2010). The consequence is that clumped isotope values from carbonate nodules in modern East African soils (formed below ∼50 cm depth), even if they form preferentially during times of soil wetting and evaporation, appear to record MAAT (Passey et al., Reference Passey, Levin, Cerling, Brown and Eiler2010; Beverly et al., Reference Beverly, Levin, Passey, Aron, Yarian, Page and Pelletier2021). Concordance between the average measured T(Δ47) values from late Quaternary carbonate nodules and the modern MAAT suggests that these samples from the Chalbi Desert are no exception to this general rule. In the future, studies of active, carbonate-producing soils in tropical, low-altitude, arid, and warm climates will be necessary to better quantify the effects of soil characteristics, such as lithology, on measured pedogenic carbonate clumped isotope values.
Conclusions
This study advances our understanding of the chronostratigraphy and paleoenvironments of the Chalbi Desert in eastern Africa. We identified five chronostratigraphic units, I–V, possibly spanning >545 ka to recent. U-series and combined U-series/ESR ages suggest an early Middle Pleistocene age for at least some of the deflated dune surfaces mapped throughout the desert, although a more precise age constraint is complicated by the apparent asynchronous fossil and sediment deposition. Such a scenario is not uncommon when age constraints can directly be obtained on the fossil assemblage and associated sedimentary matrix (e.g., Grün et al., Reference Grün, Eggins, Aubert, Spooner, Pike and Müller2010; Duval et al., Reference Duval, Arnold, Bahain, Parés, Demuro, Falguères, Shao, Voinchet, Arnaud and Berto2024; Martínez-Pillado et al., Reference Martínez-Pillado, Demuro, Ortiz, Shao, Arnold, Duval, Cheng, Torres, Santos and Falguères2024). Facies analysis and paleopedology further refine this context and suggest a wetter than modern climate. As indicated by luminescence, radiocarbon ages, and pedological features, however, the matrix enveloping archaeological and paleontological materials along this deflated dune surface (Ferraro et al., Reference Ferraro, Binetti, Stinchcomb and Manthi2013) appears to be of late-Middle to Late Pleistocene age. These features suggest that the landform experienced a complex history that likely involved burial, exhumation, and weathering during the Middle and Late Pleistocene, all of which is consistent with the site occurring on a deflated sand dune. From a dating perspective, these results show on the one hand, the interest of employing a multi-technique dating approach and the importance of dating a large diversity of materials (here, fossils, associated sediment, and carbonates) in order to evaluate their contemporaneity and unravel complex site-formation processes (see also Grün et al., Reference Grün, Eggins, Aubert, Spooner, Pike and Müller2010; Duval et al., Reference Duval, Arnold, Bahain, Parés, Demuro, Falguères, Shao, Voinchet, Arnaud and Berto2024; Martínez-Pillado et al., Reference Martínez-Pillado, Demuro, Ortiz, Shao, Arnold, Duval, Cheng, Torres, Santos and Falguères2024). On the other hand, we also acknowledge the need for additional age constraints on Unit I and the base of Unit II, given the existing uncertainty on the combined U-series/ESR chronology and the absence of numerical ages for the lowermost deposits, to complete the existing chronostratigraphic framework of the Chalbi Desert sequence.
The modern deflated sand dune surface is a complex relict paleosol (polygenetic soil) that documents environmental and climatic change during the past ca.124 ka, possibly longer. The soil has extremely alkaline pH and evidence of sodicity, which is a testament to current arid conditions and possible dust influx sourced from the saline clay pan of the Chalbi playa floor. However, paleosol proxies at Farre show evidence of wetter climate conditions during the Middle and Late Pleistocene, where the latter episode is consistent with lake-level and geochemical indicators of past climate in the Lake Turkana and Chew Bahir region (Foerster et al., Reference Foerster, Junginger, Langkamp, Gebru, Asrat, Umer and Lamb2012, Reference Foerster, Asrat, Bronk Ramsey, Brown, Chapot, Deino, Duesing, Grove, Hahn and Junginger2022; Bloszies et al., Reference Bloszies, Forman and Wright2015). The last significant pluvial episode occurred approximately 4.4 ± 0.3 cal ka BP and preceded the final regression of Lake Turkana.
Pedogenic carbonates indicate woody grassland vegetation in the Chalbi Desert during MIS 4 and MIS 3 pluvials, consistent with nearby alluvial fan progradation dating older than 35 ka. Further, δ13C values from pedogenic carbonates are consistent with a more productive biome in the past, possibly with upward of ∼20% woody cover. With hydrologic variability over the past 124 ka, the region experienced increased stream power, incision, and fan progradation, which led to the Farre site’s current proximal fan setting, farther away from the now hyperarid Chalbi playa. This study also expands the application of clumped isotope thermometry in late Cenozoic sediments in East Africa, with trends that largely agree with observations from Turkana (Passey et al., Reference Passey, Levin, Cerling, Brown and Eiler2010) and the Serengeti (Beverly et al., Reference Beverly, Levin, Passey, Aron, Yarian, Page and Pelletier2021).
Supplementary material
The supplementary material for this article can be found at https://doi.org/10.1017/qua.2025.10045.
Acknowledgments
We thank the Office of the President, Republic of Kenya; M. Kibunjia, Director General of the National Museums of Kenya; F.K. Manthi, Emmanuel Ndiema, and Mathew Macharwas, Earth Sciences Department, National Museums of Kenya. We would like to acknowledge Mallory Gerzan, C. Lance Stewart, Ben Ferguson, Skye Leeper, Marie White, Bonface Kimeu, and Erin Stinchcomb for their field and lab assistance.
Funding statement
This work was conducted under research license NACOSTI/P/16/44101/1126 and supported by the National Science Foundation (BCS-1524036, BCS-1524041, EAR-2021579), a Murray State committee of institutional studies and research grant, and Watershed Studies Institute student research grant. Additional funding for fieldwork was provided by the Leakey Foundation and a Baylor University College of Arts and Sciences Summer Research Award. The U-series and ESR dating studies have been funded by the Australian Research Council Future Fellowship Grant FT150100215 and the Spanish Ramón y Cajal Fellowship RYC2018-025221-I, which is funded by MCIN/AEI/ 10.13039/501100011033 and by “ESF Investing in Your Future.” This work is associated to grant PID2021-123092NB-C22 funded by MCIN/AEI/ 10.13039/501100011033/, “ERDF A Way of Making Europe.” We are also grateful to Les Kinsley, Australian National University, Yue-xing Feng, and Ai Duc Nguyen, University of Queensland (UQ), and María Jesús Alonso Escarza, CENIEH, for their support throughout the U-series and ESR analytical procedure. The solution U-series dating analyses were carried out at UQ within the framework of the existing Brisbane Geochronology Alliance between Griffith University, UQ, and Queensland University of Technology. We dedicate this paper in memory of Francis H. Brown (1943–2017), Kenyenze, Musa, and Chilal Simion.