INTRODUCTION
Fascioliasis is a disease caused by two liver fluke species, Fasciola hepatica and F. gigantica, the first being more widely distributed (Mas-Coma et al. 2000, 2003, 2005). Fascioliasis has traditionally been considered an important veterinary problem (Mas-Coma and Bargues, 1997). However, recent research studies carried out have shown that human fascioliasis must be included among the important human parasitic diseases. Human hypoendemic, mesoendemic and hyperendemic situations have been established using coprological diagnostic data from several regions (Mas-Coma, 2004a,b, 2005; Mas-Coma et al. 1999a,b, 2005). Among human fascioliasis hyperendemic areas, Andean countries such as Bolivia and Peru present, in very high altitude zones, the highest prevalences and intensities known (Hillyer et al. 1992; Bjorland et al. 1995; Mas-Coma et al. 1995, 1999c; Esteban et al. 1997a,b, 1999; O'Neill et al. 1998). Very high egg output detected in humans suggests that liver fluke burdens may also be very heavy (Esteban et al. 1997a,b, 1999).
Fascioliasis is a highly pathogenic disease. In humans, pathogenesis depends on the number of infecting flukes, and appears to be similar to that reported in animals (Chen and Mott, 1990; Mas-Coma and Bargues, 1997; Mas-Coma et al. 1999a, 2000). Results demonstrate that in hyperendemic zones adult subjects maintain the parasites acquired when young (Esteban et al. 1999). It must be considered that the life-span of the adult fluke in humans is between 9 and 13·5 years (Chatterjee, 1975; Dan et al. 1981). Such a picture suggests that in those areas, individual infection intensities reach very high levels and the majority of infected subjects should be in the advanced chronic phase (Mas-Coma et al. 1999c).
Crowding is an interesting phenomenon in helminths, because of its causality (Roberts, 2000) and effects. Obviously, all vertebrate host organs (microhabitats) offer a limited space and consequently only a finite number of worm individuals can physically fit into each organ depending on parasite size (Shostak and Scott, 1993; Bush and Lotz, 2000). In livestock, F. hepatica worm development (body growth), pre-patent period (time period between ingestion of metacercariae and beginning of egg shedding in faeces) and per capita egg production (eggs per g of faeces per fluke individual=epg/worm) depend on the number of adult flukes in the liver (Montgomerie, 1928; Ross, 1965; Boray, 1967, 1969; Sykes et al. 1980). In general, the greater the infective metacercariae oral dose, the longer the pre-patent period, adult development is reduced and epg/worm decreases (Thorpe, 1965; Rajasekariah and Howell, 1977; Boray, 1969; Reddington et al. 1984).
Wistar rats are frequently used as a laboratory model for chemotherapeutic and immunological studies on the liver fluke are especially useful for pathological research in the advanced chronic period (Valero et al. 2000, 2003). In experimental fascioliasis studies, an effect of crowding was detected in laboratory rats (Valero et al. 2001b). Although crowding is known in livestock fascioliasis, it has not been studied in the laboratory rat model in the advanced chronic phase until now. In the rat model, fascioliasis is considered an advanced chronic disease from 100 days post-infection onwards (Valero et al. 2003).
The present paper deals with a comparative experimental study of fluke development of a F. hepatica isolate from the northern Bolivian Altiplano human hyperendemic area in the Wistar rat under standardized infective dose conditions involving various individual intensities of infection per rat with a very long follow-up of up to 300 days including the advanced chronic stage. The aim of this study was to determine whether different infection intensity levels (=varying number of adults located in the biliar canal) have any significant influence on pre-patent period as well as on fluke growth and egg production in advanced chronic fascioliasis.
MATERIALS AND METHODS
Liver flukes and snails
Only isolates of F. hepatica and Galba truncatula from the northern Bolivian Altiplano were used. Snails shedding the cercariae which gave rise to the metacercariae were from a laboratory-reared strain (in Heraeus-Vötsch HPS 1500, HPS 500) climatic chambers; experimental conditions: temperature 20 °C, photo-period 12 h/12 h light/darkness, relative humidity 90%). These snails were in turn monomiracidially infected. The metacercariae (on average 4 weeks old) were stored in fresh water at 4 °C in darkness until required.
Experimental definitive hosts
The study was approved by the institutional committee on animal care of the University of Valencia (Spain). A total of 96 male laboratory albino rats of the Wistar strain (Iffa Credo, Barcelona, Spain), 4–5 weeks old and weighing 80–100 g were used throughout: 70 were used to study fluke growth (Experiment 1), while 26 were used to study the pre-patent period and egg output (Experiment 2). The animals were housed in Micro-Isolator boxes (Iffa Credo, Barcelona, Spain) and maintained in a pathogen-free room, electrically heated with a 12 h/12 h light/darkness cycle (conditions in accordance with the European Agreement of Strasbourg, 18 March 1986). Food and water were provided ad libitum.
Experimental procedures
Wistar rats were infected with doses of 20 F. hepatica metacercariae per rat. Metacercariae were inoculated orally by means of a stomach tube. The number of worms that successfully developed in each rat was established by dissection. At different days post-infection (p.i.), the rats were sacrificed using an excess of Fluothane® (Zéneca Farma, S.A., Pontevedra, Spain), and worms were collected under a dissecting microscope. Initially the bile duct was examined for the presence of worms, though the remaining organs were also evaluated, especially the liver parenchyma. Finally, the thoracic and abdominal viscera and cavities were examined and thoroughly rinsed with water to assure the recovery of all the worms. The infection intensity was characterized by the number of adults located in the liver and was rated as follows: group I: 1–3 fluke adults/rat; group II: 4–6 fluke adults/rat; group III: 7–9 fluke adults/rat.
Experiment 1. Obtaining F. hepatica adults
At different times between 22 and 300 days p.i., the rats were sacrificed (see Table 1). Liver fluke adult specimens were fixed with Bouin's solution between slide and cover-slip (but without cover-slip pressure), stained with Grenacher's borax carmine and mounted in Canada balsam (Panreac, Barcelona, Spain).
Table 1. Evolution of biometric measures of Fasciola hepatica in experimentally infected Wistar rats according to age (in days) at different infection levels (All values shown as mean±standard error, and range in parentheses; N=sample size; BA=body area; P=perimeter; BL=body length; BW=body width; Group I=1–3 worms/rat; Group II=4–6 worms/rat; Group III=7–9 worms/rat.)

Measurement techniques and data analyses
Adult measurements were done according to the method proposed for fasciolids by Valero et al. (1996, 2005). The measuring was carried out by Computer Image Analysis System (CIAS), including a computer work station-connected to a stereo-microscope equipped with a digital colour video camera (DX 20, Kappa) and using image analysis software (Image-Pro®Plus, 4.5 USA) (Valero et al. 2005). The fluke body measures and proportions analysed comprised: (a) linear magnitudes (mm): perimeter (P), body length (BL) and body width (BW) and (b) surfaces (mm2): body area (BA).
Analytical methods
In the present study, an ontogenetic trajectory describes the change of any magnitude associated with a morphological structure as a function of its age. The majority of the parameters of growth laws are related to different aspects of developmental timing (mainly the growth rate), and alterations in these can lead to modifications in developmental timing (heterochronies) (Alberch et al. 1979). A preliminary analysis of the results indicated that a logistic model gave the best representation of the data.
Ontogenetic trajectories
Graphic plots of morphometric measurements against age (t) provide empirical ontogenetic trajectories for F. hepatica adults (Valero et al. 1991, 1998). The logistic model for ontogenetic trajectories was verified for each measurement, the growth rule being: y′=ky (1−y/ym), (y′=dy/dt). Solutions are expressed by y=ym/[1+z0 exp(−kt)], where: ym=the maximum value attainable by the biometric variable y; and z0 and k=parameters of the trajectories. The parameter k is related to the growth rate.
Growth rate r
The theoretical growth rate r is defined as (1/y) y′ (De Renzi, 1995). For the logistic model, the growth rate r is a negative linear function of y: r=k(ym−y)/ym. The growth rate diminishes monotonically when y increases. These growth rates are instantaneous ones since derivatives are used for their calculation.
Inflection point
The logistic model has two phases. The first has an almost exponential character (because r is almost constant as y<ym). The second phase shows a continuous decrease for r (an almost saturated character). This transition takes place at the inflection point of the curve. For this point, the second derivative is null and this occurs when ti=ln(z0)/k; for this value yi=ym/2.
Statistical analyses
Adjusted non-linear curves were tested using the squared correlation coefficient R2 and sse. In order to estimate the parameters of the curve, successive values of ym(ym, ym+h, ym+2 h …) with a small h value (e.g. 0·01), were used and the value that fits the smallest least-squares residual (sse) was chosen (De Renzi, 1988; Valero et al. 1996, 1998). Data processing was carried out with the MacCurve v. 1.0 fit program (Quasi-Newton fit) for Macintosh.
Differences in growth curves were sought by analysis of covariance (ANCOVA) (one-way analysis of variance design with one covariate) using days p.i. as a covariate. For the ANCOVA comparison of logistic curves, log e transformations were necessary: tBA=ln[(BA max−BA)/BA], tBP=ln[(P max−P)/P], tBL=ln[(BL max−BL)/BL], and tBW=ln[(BW max−BW)/BW]. The growth curves of the different groups were compared using the same ym (the highest) (Valero et al. 1999, 2001a,b, 2005). The effect-size measures were controlled by Power and the eta-squared statistic (ETA) (Norusis, 1994) using only liver fluke samples from 22 to 175 days p.i. in the 3 groups. Data processing was carried out with SPSS v. 12 software (Windows).
Experiment 2. Study of the pre-patent period
In 26 rats, faecal pellets were collected fresh at 9:00 a.m. once a day starting on day 30 post-infection from each animal and stored in closed Petri dishes to avoid drying before examination. Faecal egg detection was carried out by analysing 1 Kato-Katz slide per daily sample until the first egg was detected (helm-Test®, AK test, AK Industria e Comèrcio Ltda, Belo Horizonte, Brazil).
Follow-up study of eggs
In the above-mentioned 26 rats and with the same procedure, faecal egg counts (epg) were carried out by analysing one Kato-Katz slide per daily sample. As individual faecal egg counts show strong day-to-day fluctuations in rats, repeated examinations are required to obtain reliable quantitative data (Valero et al. 2002). Analyses were carried out between day 182 p.i. (26 weeks) and day 252 p.i. (36 weeks). At day 252 p.i. the rats were sacrificed to obtain the number of adult flukes. In this experiment it was assumed that deparasitization had not taken place and the number of adult flukes did not vary throughout the experiment. This premise is supported by the fact that the number of eggs detected in faeces had not decreased abruptly in any rat analysed. Bearing in mind this assumption, the adults found when the rats were sacrificed on day 252 p.i. was the same as 10 weeks earlier. The average egg output per fluke and day was calculated.
Statistical analyses
The analysis of the relation between pre-patent period and number of flukes/rat was carried out using one-way ANOVA. The analysis of the relation between average epg/worm/rat and number of flukes/rat was carried out using repeated measures ANOVA, in which the weekly average of epg/worm/rat was used. Data processing was carried out with SPSS software (Windows).
RESULTS
Experiment 1
The liver parenchyma of infected rats presented migratory worms within 30 days p.i. Liver flukes were neither found in thoracic and abdominal viscera nor in cavities. Infection was confined to the common bile duct from approximately day 40 p.i. In the chronic infection, the rat common bile duct showed a patent hyperplasia, ranging in size between 17–34 mm in length and 4–17 mm in width. The results of the morphometric measurements for each age group in the 3 groups studied are shown in Table 1. A great variation in the size of the flukes of the same age was detected (see Table 1). The average of measures in each age group was used to calculate the ontogenetic trajectories.
Ontogenetic trajectories
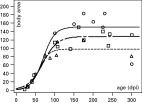
Table 2 shows the fit of logistic models for each measure in each group in the 22–300 days p.i. range (Fig. 1). The R2 values were statistically significant in relation to all the measures analysed. Significant differences (ANCOVA) (P<0·05) in the 4 pairs of transformed variables with respect to the age (TBA vs age, TP vs age, TBL vs age, TBW vs age) of liver fluke populations from Groups I, II and III were detected (Table 3). Group I showed a higher ym in BA, P, BL and BW than Groups II and III. Group II showed a higher ym in BA, P, BL and BW than Group III, i.e. when the number of worms increases in the common bile duct, the ym values of BA, P, BL and BW decrease.

Fig. 1. Ontogenetic trajectory of body area (BA) (in mm2) as a function of time (days) with the logistic model y1=ym/[1+zαexp(−kt)] in Fasciola hepatica adults obtained in experimentally infected Wistar rats. Each point represents average; (○)=averages of Group I; (□)=averages of Group II; ([utri ])=averages of Group III. ———=function of Group I; — - — -=function of Group II; -------=function of Group III.
Table 2. Comparison between different infection levels in the logistic model (y1=ym/[1+zαexp(−kt)]) and in egg shedding data in Wistar rats experimentally infected with Fasciola hepatica (zo, and k=constants that appear in the model; S.E.=standard error; R2=correlation coefficient; ym=maximum value of biometric characters; sse=least squares residual; ti=time at the inflection point in days; N=number of rats analysed; Group I=1–3 worms/rat; Group II=4–6 worms/rat; Group III=7–9 worms/rat; BA=body area in mm2; P=perimeter in mm; BL=body length in mm; BW=body width in mm; pp=pre-patent period in days; epg/worm=eggs per gram of faeces/worm/day.)

Table 3. Significant differences detected when comparing Fasciola hepatica adult allometric curves in pairs of infection levels by ANCOVA test (P<0·05) (Group I=1–3 worms/rat; Group II=4–6 worms/rat; Group III=7–9 worms/rat; tBA=ln[(BA max−BA)/BA], tP=ln[(P max−P)/P], tBL=ln[(BL max−BL)/BL], and tBW=ln[(BW max−BW)/BW]; TBA-age: TBA vs age; TP-age: TP vs age; TBL-age: TBL vs age; TBW-age: TBW vs age; D.F.=degrees of freedom; P=associated probability; ETA: eta-squared statistic.)

Growth rate r
The evolution of the theoretical growth rate versus y in the 3 analysed groups is shown in Fig. 2. Linear functions with negative slopes were obtained. The crowding effect did not affect all fluke populations included in the common bile duct, but only a certain number of individuals which is reflected in the wide range of values detected in every morphometric measurement analysed (at a particular point of time). The phenomenon of crowding is reflected in the average measurement of each group. For this reason, r±S.E. does not represent the phenomenon as clearly as r. Therefore only the evolution of r versus y was analysed. For BA (Fig. 2A), the following results were obtained: r was always lower in Group II than in Group I; r was higher in Group III than in Groups I and II only in the first stage of development. Concerning P (Fig. 2B) and BW (Fig. 2D), it can be observed that r was lower in Group III than in Group I; r was higher in Group II than in Groups I and III only in the first stage of development. Finally, for BL (Fig. 2C), r was lower in Group I than in Groups II and III only in the first stage of development. In conclusion, in Groups II and III versus Group I, a smaller r was found when the biometrical measurement was near the maximum value ym. This kind of heterochrony is classified as neoteny (Alberch et al. 1979).

Fig. 2. Effect of infection level (Group I=1–3 worms/rat; Group II=4–6 worms/rat; Group III=6–9 worms/rat) on theoretical growth rates in Fasciola hepatica adults obtained in experimentally infected Wistar rats, (A) rBA of body area versus body area, (B) rP of perimeter versus perimeter, (C) rBL of body length versus body length and (D) rBW of body width versus body width. Functions are calculated according to the parameters given in Table 2. ———=r of adults in Group I; — - — -=r of adults in Group II; -------=r of adults in Group III.
Inflection points
For all magnitudes analysed, the value of ti in the logistic functions ranged from 41·3 to 69·9 days (Table 2). These theoretical values are similar to the empirical pre-patent period data of 39 to 59 days (Table 2).
Experiment 2. Pre-patent period and egg shedding
Table 2 summarizes the results of the experimental infections with respect to both the pre-patent period and epg/worm detected between 182 and 252 days according to the infection level (average, maximum and minimum values).
Significant differences (ANOVA test: F2,23=3·651, P=0·042) were detected in the pre-patent period versus number of flukes/rat. Thus, the pre-patent period appears to be dependent on the infection level, the pre-patent period decreasing when the burden increases. Significant differences (repeated measures ANOVA test: F2,22=4·123, P=0·030) were also detected in epg/worm versus number of flukes/rat. Thus, epg/worm appears to be dependent on the infection level, epg/worm decreasing when the burden increases.
DISCUSSION
The crowding effect on trematode adults has been described in different species of several groups of Digenea, such as Schistosoma mansoni (Coelho et al. 1976), Zygocotyle lunata (Fried and Nelson, 1978), Philophthalmus megalurus and P. gralli (Nollen, 1989), Echinostoma revolutum (Franco et al. 1988), and E. caproni (Yao et al. 1991). In general, a greater number of flukes is reflected in decreased adult development, a longer time required for the juvenile flukes to mature as well as to initiate egg shedding, and a decrease in egg production per individual worm.
Several mammalian species may serve as hosts for F. hepatica, but there is considerable variation in the susceptibility and pathology in the potential host. Boray (1969) divided the most common hosts for F. hepatica into 3 groups in terms of resistance (low, medium and high). The pig belongs to the high resistance group. F. hepatica adults in bovine or human hosts induce considerable tissue reaction with calcification in the bile ducts (medium resistance species). In other host species such as sheep, mice or rabbits chronic fascioliasis in the bile duct involves no calcification (low resistance group). In this context, Rattus norvegicus has been classified as a medium resistance host for F. hepatica. In this sense, the rat is a suitable model in human fascioliasis for its resistance level which is similar to that of humans. Moreover, in human and rat fascioliasis the parasite is frequently located in the common bile duct, which is dilated (Gulsen et al. 2006; Valero et al. 1998). The diameter of the common bile duct has been recorded between 7–30 mm in human fascioliasis (Kabaalio et al. 2000; Chen and Mott, 1990) and 4–17 mm in rat fascioliasis. The overlap of size of the microhabitat allows us to consider that the rat model is suitable for studying the crowding effect and extrapolating results to human infections.
In fasciolids infecting the rat, the crowding effect should a priori be evident, as the available space for fluke growth is severely constrained in the common bile duct which is the usual microhabitat for the parasite. The rat common bile duct undergoes a patent hyperplasia in the chronic phase (Foster, 1981), which severely limits the development of a worm of large size such as F. hepatica (Valero et al. 2001b). In F. hepatica-infected laboratory albino rats, the crowding effect has been studied (Thorpe, 1965; Rajasekariah and Howell, 1977; Reddington et al. 1984). However, the experimental techniques used in these studies were not standardized with respect to the way in which effective doses were administered, the age of adult worms analysed, or the rat strain used. It has been demonstrated that F. hepatica adult development in the rat differs depending on host strain and sex (Hughes et al. 1976). Unfortunately, the ‘infection level’ was quantified by the number of metacercariae or newly excysted juveniles (NEJ) injected, and not by the flukes recovered in the liver as in the present study which makes it difficult to compare their results with those of the present paper. The number of adult flukes in the hepatic canals never equals the number of metacercariae orally administered nor the intraperitoneally injected NEJ because its infectivity is always below 100% (Valero and Mas-Coma, 2000; Reddington et al. 1984). In the studies carried out by Reddington et al. (1984), male and female Sprague-Dawley rats were infected by intraperitoneal injection of 5, 10, 20, 30, or 50 NEJ. These authors showed that when the infective dose was increased from 5 to 50 NEJ, the percentage of worms recovered from the livers of the infected rats decreased at day 90 p.i. With 5 and 10 NEJ infective doses, the worms recovered were large mature flukes found in the common bile duct. In the rats receiving infections of 30 and 50 NEJ, two distinct fluke populations were detected, namely large mature flukes recovered from the common bile duct and small worms in the parenchyma.
The F. hepatica adult undergoes a marked developmental process in the definitive host (Valero et al. 1996, 1998). Body growth models for F. hepatica adults have only been investigated by a small number of authors. Valero et al. (1996, 1998) investigated changes in different biometrical parameters of F. hepatica at different times (30, 40, 50, 75, 100 and 150 days) in R. norvegicus and R. rattus. The corresponding growth curves were all logistic under conditions of a fluke burden of 1–4 adults in the liver, which implies that the morphometric development of the F. hepatica adult is not unlimited but ‘damped’ and cannot exceed certain characteristic maximums of ym. The results of the present study demonstrate that the ontogenetic trajectories of BA, P, BL and BW follow a logistic model independent from the infection level. This study shows for the first time that the crowding effect is reflected in a reduction of ym of the ontogenetic trajectories of BA, P, BL and BW due to a reduction in the growth rate.
When analysing the variation of r of each biometrical measure (rBA, rP, rBL, rBW) versus its corresponding biometrical measures (BA, P, BL, BW), a reduction in r in Groups II and III versus Group I was observed. This decrease is shown in the final stage of the development, the crowding effect becoming always manifest when the adult measures approximate ym, i.e. when the advanced chronic stage is reached. It must be emphasized that this crowding effect appears evident in the present study with doses of only 20 metacercariae, which is one of the standard infection doses used in rats.
The effect of infection intensity on the pre-patent period has been analysed in relation to different metacercarial oral doses but has never been studied before with respect to a varying number of adults located in the biliar canal. In previous studies, groups of male Wistar rats were infected with 1, 5, 10 or 20 metacercariae by stomach tube. Neither a crowding effect nor competitive inhibition occurred in the pre-patent period and in the size of adult worms aged 57 to 60 days (Rajasekariah and Howell, 1977). However, the range of worms recovered in each group of rats overlaps which is probably correlated with the above-mentioned undetected differences.
When the number of flukes invading the liver is very high (=high doses of metacercariae), the greater the liver damage and consequently the longer the maturation time of juvenile flukes in the bile duct and the more delayed the initiation of egg laying, i.e. the pre-patent period is prolonged. Thus, in sheep infected with 200 metacercariae, the pre-patent period was 63 days, whereas in those with heavy infections (i.e. infected with 2000 metacercariae) eggs appeared 13–15 weeks after ingestion (Boray, 1969). Similar results were obtained using male Wistar rats and oral infective doses of 5, 20, 40, 80 and 160 metacercariae per rat, analysed at 2, 4, 6 and 19 weeks (Thorpe, 1965). Crowding effect and competitive inhibition, shown by a delay in their migration from the liver parenchyma into the common bile duct, were apparent at high levels of infection (Thorpe, 1965). In the experiment of the present study, the pre-patent period became shorter when the number of liver flukes in the common bile duct increased. This model describes the variation in adult fluke dimensions with time, from parasite migration to the adult location in the bile duct. Entry into the bile duct induces maturation and egg production. The logistic model which represents body growth and development is characterized by two phases (Valero et al. 1998, 2005): the ‘exponential’ part of logistic growth corresponds to body development during migration in the abdominal cavity and liver parenchyma as well as to development and sexual maturation in the biliary duct system up to the onset of egg production. From this moment, development follows the ‘saturated’ part of logistic growth. In detail, the pattern of fluke development comprises two periods: (a) gonadal differentiation, appearance of uterine eggs and the onset of ovoposition occur in the ‘exponential’ period; and considerable persistence of growth after sexual maturity, followed by gradually stationary growth thereafter, in the ‘saturated’ period. The ovoposition is the inflection point of the logistic growth marking the end of the ‘exponential’ period and the beginning of the ‘saturated’ period, i.e. the beginning of egg shedding to the external environment constitutes the biological factor that marks the inflection point (Valero et al. 2005). The spatial dimensions of the microhabitat severely limit parasite development. When the number of flukes increases in the common bile duct, the ‘exponential’ period is shorter, sexual maturity is reached with a smaller body size and consequently earlier, i.e. the pre-patent period is shorter. The comparison of the results of both adult development and pre-patent period shows that, for all biometrical measures analysed, the values of the inflection point in the logistic functions are similar to the empirical data on the pre-patent period.
A relationship between fasciolid burden and egg production was demonstrated in sheep. Egg production by mature flukes in sheep showed a range from an average of 25000/day in low infections to 8800/day in very heavy infections (Boray, 1969; Wilson et al. 1982). Unfortunately, information on this relationship in the advanced chronicity stage in sheep is lacking, as these data only refer to results at 13–19 weeks post-infection, i.e. the beginning of the chronic phase, as the pre-patent period in sheep is between 9 and 15 weeks. The present study is the first to analyse the relationship between fasciolid burden and egg production in the rat in the advanced chronicity stage. Our results show that egg production (epg/worm/day) of F. hepatica in Wistar rats appears to be constrained by the fluke burden in the common bile duct. Moreover, these results were obtained between 182 days p.i. (26 weeks) and 252 days p.i. (36 weeks), that is, long after the advanced chronic phase in the rat had been reached.
If the rat model is considered suitable for studying the crowding effect and extrapolating its results to human infections, the present study suggests that fluke burdens may be very heavy in human hyperendemic areas, not only in human subjects shedding high numbers of epg (intensities of more than 5000 epg have been described in children – Esteban et al. 1999) but also in infected subjects shedding fewer eggs and being in the advanced chronic stage of the disease. This implies a pathogenicity problem in these areas greater than initially predicted, at human individual as well as community levels, owing to the severe and long-term effects of fascioliasis (Mas-Coma et al. 2000; Valero et al. 2003). Consequently, the crowding effect should be taken into account when the impact of fascioliasis on the human development in those areas is analysed.
This work was supported by funding from the STD Programme of the Commission of the European Community (DG XII: Science, Research and Development) (Contract No. TS3-CT94-0294), Brussels, EU; the Programme of Scientific Cooperation with Latin America, Instituto de Cooperación Iberoamericana, Agencia Española de Cooperación Internacional (I.C.I.-A.E.C.I.), Madrid, Spain; Project PDP B2/181/125 of the WHO of Geneva, Switzerland; DGICYT Projects No. UE96-0001, PM97-0099 and BOS2002-01978 of the Spanish Ministry of Education and Culture, and No. BOS2002-01978 of the Spanish Ministry of Science and Technology, Madrid, Spain; the Red de Investigación de Centros de Enfermedades Tropicales – RICET (Project No. C03/04 of the Programme of Redes Temáticas de Investigación Cooperativa) of the Fondo de Investigación Sanitaria (FIS), Spanish Ministry of Health, Madrid, Spain; and Project No. 03/113 and Project No. GV04B-125 of Conselleria de Empresa, Universidad y Ciencia, Valencia, Spain. We would like to thank Dr M. D. Bargues, Dr M. Khoubbane and Dr I. R. Funatsu (Valencia, Spain) for collecting and rearing Bolivian lymnaeid snails, for liver fluke infection experiments with snails and for obtaining, storing and providing the metacercariae used. The technical assistance in the Bolivian slaughterhouses of Dr J. G. Esteban, Dr M. D. Bargues and the late Dr J. A. Oviedo (Valencia, Spain), and Dr René Angles (La Paz, Bolivia) is gratefully acknowledged. Dr M. D. Marcos, and Dr N. A. Darce (Valencia) participated in mountings of liver flukes in permanent microscopic slides. The authors also acknowledge the facilities provided by the Instituto Nacional de Laboratorios de Salud (INLASA) of La Paz, Bolivia and the grammatical collaboration of Ralph Wilk (Valencia, Spain).