


1. Introduction
Mid-B to mid-A supergiants are luminous (7-15 M
 $\odot$
) optical emitters, among the brightest galactic stars, observable up to tens of Mpc and usable as standard candles when
 $T_{\rm eff}$
and L are well determined. Previous studies (Verdugo et al. Reference Verdugo, Talavera and Gómez de Castro1999a; Verdugo et al. Reference Verdugo, Talavera and Gómez de Castro1999b; Firnstein & Przybilla Reference Firnstein and Przybilla2012; Weß mayer et al. 2022) analyzed only in small groups of 20-40 objects, though hundreds within a few kpc are accessible with even small telescopes. We have obtained several spectra for
 $\sim$
200 B5–A5 supergiants down to
 $V\sim10$
mag (Sec. 2). Although some projects focus on high-resolution data (e.g., de Burgos et al. 2023), medium-resolution spectroscopy combined with SED analysis provides independent validation of model-derived parameters and enables purely observational selection criteria.
2. Observations
Spectroscopic observations of the BA supergiant sample have been obtained with échelle spectrographs and are summarized in Table 1. Initial results of this project were reported in Miroshnichenko et al. (Reference Miroshnichenko2013). Higher-resolution (
 $R = 40{,}000$
–65,000) spectra of other
 $\sim$
30 stars from the Southern Hemisphere were retrieved from the ESO and CFHT archives.
Spectroscopic Observations of the Supergiant Sample.

Table 1 Long description
A table summarizing spectroscopic observations of supergiant stars. The table has six columns and two rows. Column headers are Observatory, Dates, Telescope/Spectrograph, R, Range (Å), stars, and sp. Row 1: Observatory, TCO; Dates, 2011-2025; Telescope/Spectrograph, 0.81 m, eShel; R, 12000; Range (Å), 3800-7800; stars, 135; sp, 1075. Row 2: Observatory, OAN SPM; Dates, 2013-2019; Telescope/Spectrograph, 2 m, REOSC; R, 18000; Range (Å), 3700-7800; stars, 46; sp, 50.
Notes: R – resolving power; sp – total spectra
SPM – Observatorio Astronómico Nacional San Pedro Mártir, Baja California, Mexico; TCO – Three College Observatory, North Carolina, USA. References: Miroshnichenko et al. (Reference Miroshnichenko2023) for TCO data reduction and eShel information; Contarini & Gratton (Reference Contarini and Gratton1992) for the REOSC information.
3. Results
Calibration relationships between
 $T_{\rm eff}$
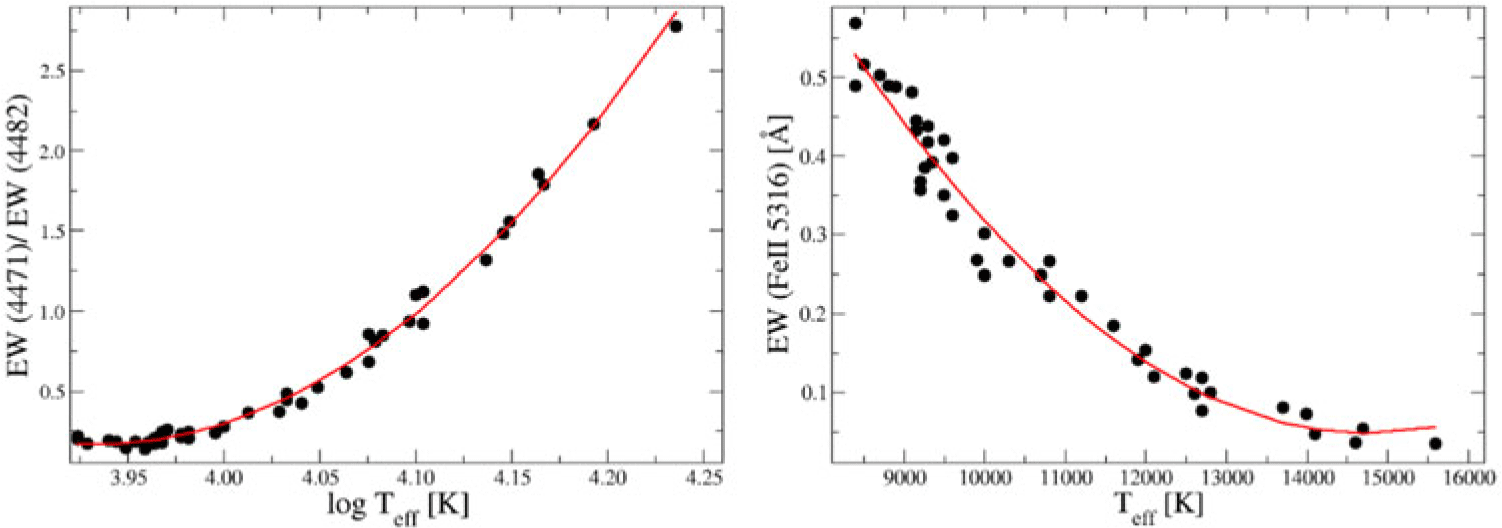
and equivalent widths (EW) of the Fe ii 5316, C ii 6578, Si ii 6347 Å lines, O i 7772–7775 Å triplet, and the EW ratio of the He i 4471 to Mg ii 4482 Å lines were established using data of
 $\sim$
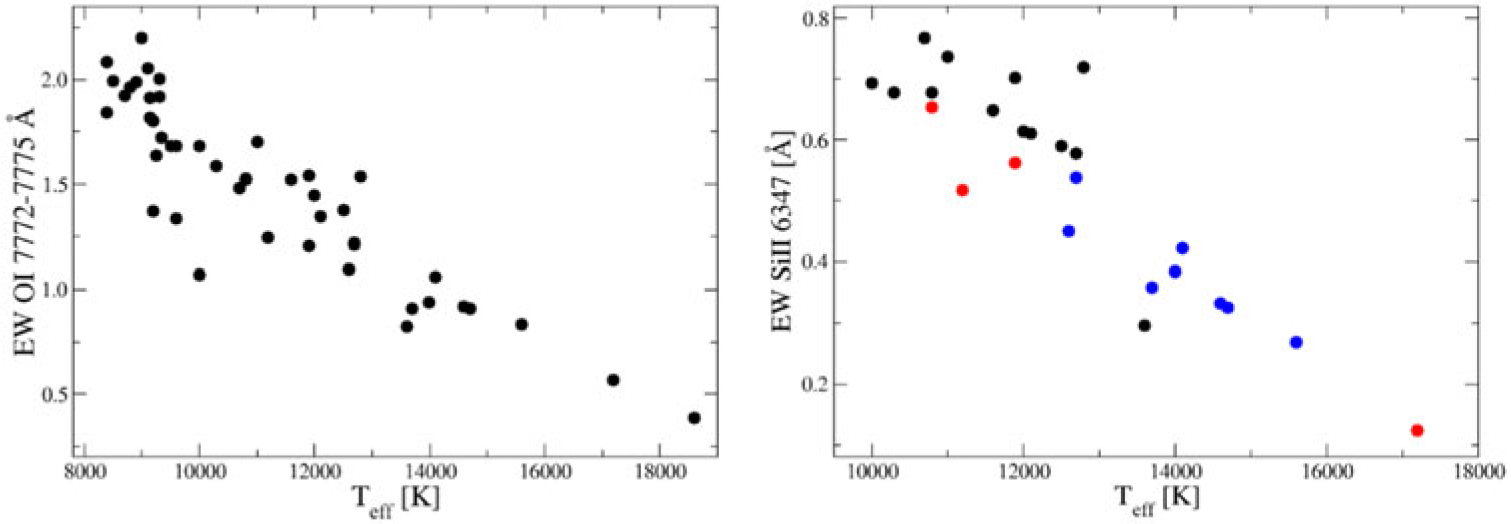
50 stars mainly from Firnstein & Przybilla (Reference Firnstein and Przybilla2012) and Weß mayer et al. (2022) and are shown in Figures 1–2. The points scatter in these plots is suggestive of an additional luminosity dependence. We found that combined EWs of the O i 7772–7775 Å triplet correlates well with T
 $_{\rm eff}$
from 8,000 K to 19,000 K (Fig. 1), while previous studies of cooler supergiants (T
 $_{\rm eff} \le 8,000$
K) showed that it correlates well with absolute visual magnitudes (e.g., Arellano Ferro et al. Reference Arellano Ferro, Giridhar and Rojo Arellano2003).
Correlations of line EW with T
 $_{\rm eff}$
. Left: O i 7772–7775 Å. Right: Si ii 6347 Å. Symbols indicate stars of different luminosity classes: Black – ia, red – iab, blue – ib.

Correlations between EW and T
 $_{\rm eff}$
. Left: EW(He i 4471/4482) vs
 $\log T_{\rm eff}$
; Right: EW(Fe ii 5316) vs T
 $_{\rm eff}$
. Red lines show the best quadratic fits.

SED modeling showes good agreement with T
 $_{\rm eff}$
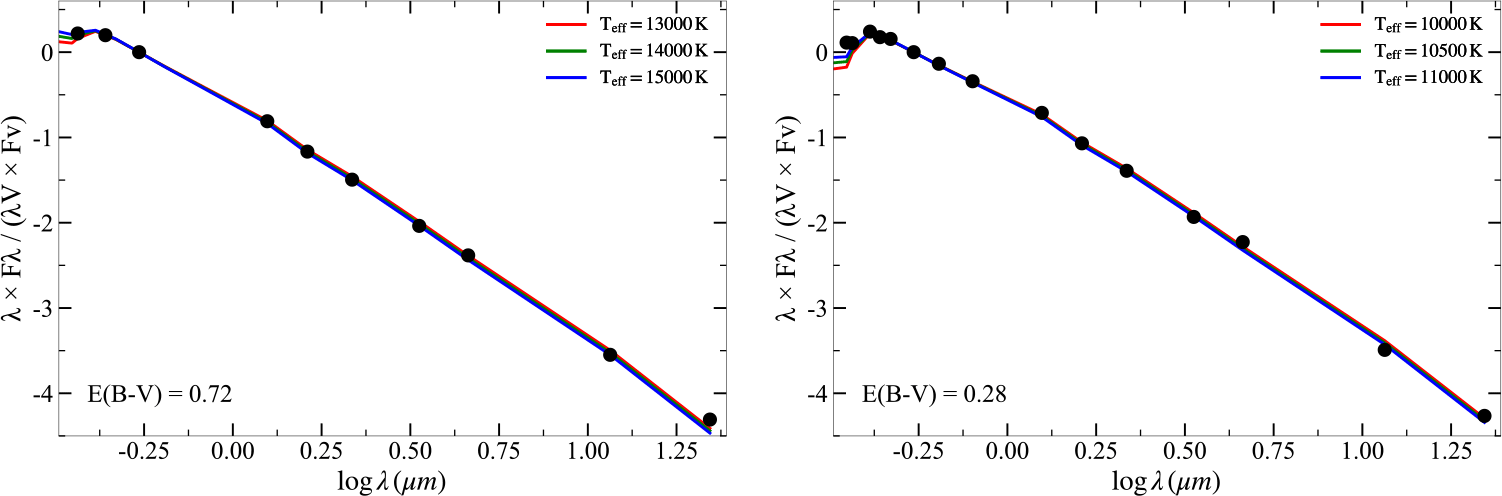
determined from the calibration relationships for most of the sample stars (Fig. 3), although it is weakly sensitive to the surface gravity. Some stars with H
 $\alpha$
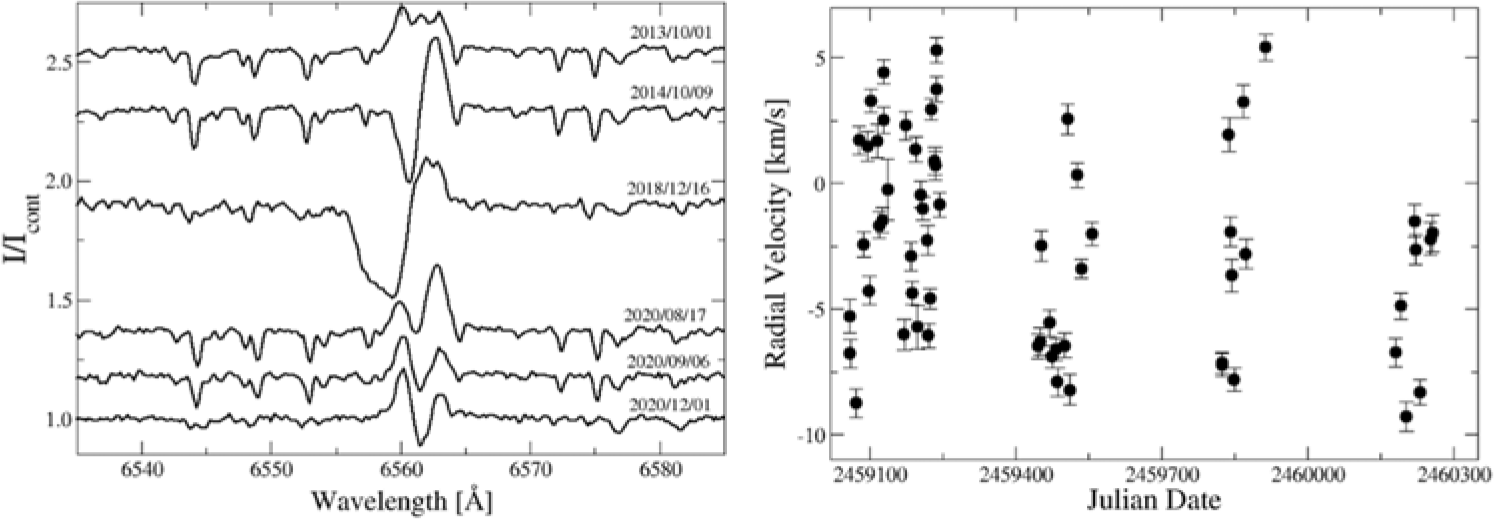
in emission show strong line profile variations from a P Cyg-type to a double-peaked with a variable violet-to-red peak intensity (Fig. 4).
SEDs of HD 25914 (B6 ia, left) and HD 35600 (B9 ib, right). Black dots represent photometric data corrected for the interstellar extinction, while solid lines show model atmospheres with different T
 $_{\rm eff}$
normalized to the V–band flux that provide a good fit to the observational data.

Variability of the H
 $\alpha$
line profile (telluric lines not removed) and radial velocity of absorption lines derived by cross-correlation in the TCO spectra (
 $R \sim$
12,000) of the emission-line supergiant HD 223960 (A0 ia+).

4. Discussion and Conclusions
Analysis of
 $\sim$
200 Galactic B5–A5 supergiants shows that medium-resolution spectroscopy along with photometric and SED data provides reliable stellar parameters. Empirical relations between the EWs of key lines versus
 $T_{\rm eff}$
and/or L allow determination of the stars fundamental parameters as an alternative method to modeling of high-resolution spectra. SED fits agree with spectroscopy, while variable H
 $\alpha$
emission indicates circumstellar and wind variability. The growing sample and improved calibrations will yield a uniform catalog of Galactic B/A supergiants for stellar evolution and distance-scale studies.
Acknowledgements
This research was funded by the Science Committee of the Ministry of Science and Higher Education of the Republic of Kazakhstan (Grant No. AP23484898).



 eff
 eff
 logTeff
 eff
 eff
 α
 R∼


