Introduction
The ionotropic purinergic receptors P2X7 (P2X7Rs) are involved in a variety of signaling mechanisms, such as synaptic transmission, neuron–glia and glia–glia interactions, and regulation of immune responses. They mediate both fast responses and long-term processes like inflammation, proliferation, and apoptosis. P2X7Rs are thought to contribute to the pathogenesis of a large number of neuroinflammatory and neurodegenerative diseases (Reviews: Sperlágh et al., Reference Sperlágh, Vizi, Wirkner and Illes2006; Abbracchio et al., Reference Abbracchio, Burnstock, Verkhratsky and Zimmermann2009; Skaper et al., Reference Skaper, Debetto and Giusti2010; Volonté et al., Reference Volonté, Apolloni, Skaper and Burnstock2012; Bartlett et al., Reference Bartlett, Stokes and Sluyter2014; Sperlágh & Illes, Reference Sperlágh and Illes2014; Reichenbach & Bringmann, Reference Reichenbach and Bringmann2016). The P2X7Rs are distinct from the other members of the P2X receptor family (P2X1 to P2X6) in that they are less sensitive to their endogenous agonist ATP (Coddou et al., Reference Coddou, Yan, Obsil, Pablo Huidobro-Toro and Stojilkovic2001). Another unique feature of P2X7Rs is that their brief activation by a low agonist concentration produces transient desensitizing nonselective cationic currents, while a repeated or continuous stimulation of the receptors with a high agonist concentration results in a considerable increase in membrane permeability to large molecules of up to 900 Da because of the formation of large pores (Surprenant et al., Reference Surprenant, Rassendren, Kawashima, North and Buell1996; Khadra et al., Reference Khadra, Tomić, Yan, Zemkova, Sherman and Stojilkovic2013; Alves et al., Reference Alves, De Melo Reis, De Souza, De Freitas, Teixeira, Neto Moreira Ferreira and Xavier2014). Overstimulation of P2X7Rs may trigger apoptosis or cell proliferation (Bringmann et al., Reference Bringmann, Pannicke, Moll, Milenkovic, Faude, Enzmann, Wolf and Reichenbach2001; Puthussery & Fletcher, Reference Puthussery and Fletcher2009; Yang et al., Reference Yang, Elner, Clark, Hugbes, Petty and Elner2011).
In the retina, P2X7Rs are expressed in many types of neurons (photoreceptors, horizontal cells, amacrine cells, ganglion cells), all types of glia, and the pigment epithelium. A similar distribution has been found in higher vertebrates (Brändle et al., Reference Brändle, Kohler and Wheeler-Schilling1998; Pannicke et al., Reference Pannicke, Fischer, Biedermann, Schädlich, Grosche, Faude, Wiedemann, Allgaier, Illes, Burnstock and Reichenbach2000; Wheeler-Schilling et al., Reference Wheeler-Schilling, Marquordt, Kohler, Guenther and Jabs2001; Ishii et al., Reference Ishii, Kaneda, Li, Rockland and Hashikawa2003; Kaneda et al., Reference Kaneda, Ishii, Morishima, Akagi, Yamazaki, Nakanishi and Hashikawa2004; Puthussery & Fletcher, Reference Puthussery and Fletcher2004; Puthussery et al., Reference Puthussery, Yee, Vingrys and Fletcher2006) and lower vertebrates (Vitanova & Kupenova, Reference Vitanova and Kupenova2014). Data exist implying that ATP may be coreleased with glutamate from photoreceptors or with GABA from horizontal cells (Puthussery & Fletcher, Reference Puthussery and Fletcher2004; Puthussery et al., Reference Puthussery, Yee, Vingrys and Fletcher2006; Vessey & Fletcher, Reference Vessey and Fletcher2012). A subset of amacrine cells are also supposed to release ATP (Neal & Cunningham, Reference Neal and Cunningham1994; Santos et al., Reference Santos, Caramelo, Carvalho and Duarte1999; Puthussery & Fletcher, Reference Puthussery and Fletcher2004). An additional source of extracellular ATP are the nonneuronal (glial and pigment epithelial) cells, which participate in purinergic signaling by modulating synaptic transmission (Mitchell, Reference Mitchell2001; Newman, Reference Newman2004a ,Reference Newman b ; Mitchell & Reigada, Reference Mitchell and Reigada2008; Wurm et al., Reference Wurm, Pannicke, Iandiev, Francke, Hollborn, Wiedemann, Reichenbach, Osborne and Bringmann2011). The wide distribution of P2X7Rs in the retina implies a significant role of these receptors in retinal processing. However, while the involvement of P2X7Rs in the pathogenesis of retinal diseases such as diabetic retinopathy, age-related macular degeneration, and retinitis pigmentosa is well established (Bringmann et al., Reference Bringmann, Pannicke, Moll, Milenkovic, Faude, Enzmann, Wolf and Reichenbach2001; Puthussery & Fletcher, Reference Puthussery and Fletcher2009; Sugiyama, Reference Sugiyama2014; Yang & Chen, Reference Yang and Chen2014), the contribution of these receptors to retinal light responses has not been fully clarified.
The contribution of the P2X7Rs to the flash ERG responses has been evaluated by investigating the effects of the selective P2X7R agonist Bz-ATP (rat and marmoset: Puthussery et al., Reference Puthussery, Yee, Vingrys and Fletcher2006; mouse: Chavda et al., Reference Chavda, Luthert and Salt2016). In these studies, the agonist treatment produced a potentiation of the ERG photoreceptor components (a-wave, modeled P III component) but an amplitude reduction of the postreceptoral components (b-wave, rod and cone P II components). The amplitude of the oscillatory potentials (OP) was decreased and the implicit times of the ERG waves were prolonged. Some of these results are in concert with the data obtained in the P2X7R knock-out mice (Vessey & Fletcher, Reference Vessey and Fletcher2012). In the P2X7-KO mice, the ERG photoreceptor component was not significantly altered. However, in the mutant mice, the amplitude of both the ERG b-wave (P II component) and the OP was greater and the ERG responses were faster as compared to the wild-type mice. In only one investigation (Chavda et al., Reference Chavda, Luthert and Salt2016) were the effects of a selective P2X7R antagonist tested. The authors demonstrated that the selective P2X7R antagonist A438079, applied in a concentration of 10 µM, had no effect on the a- and b-waves of the flash ERG, although it did reduce the effects of co-applied Bz-ATP.
The aim of our study was to characterize the P2X7R-mediated effects of the endogenously released ATP on the ERG responses—namely, the dependence of these effects on stimulus intensity, photoreceptor input, and state of adaptation (dark vs. light adaptation). We also tried to clarify if ON and OFF responses are influenced in a similar manner. For this purpose, we studied the effects of the selective P2X7R antagonist A438079 on the frog ERG responses obtained under a wide variety of stimulation conditions. The effects of the antagonist were also compared to the effects of the selective P2X7R agonist Bz-ATP.
In order to give some more insight into the mechanism of the P2X7R-mediated effects on the photoreceptors, we followed the effects of a P2X7R blockade with A438079 on the mass photoreceptor potential (distal P III component), isolated pharmacologically by the application of 20 mM Na aspartate.
Materials and methods
Subjects
The experiments were carried out on frog eyecup preparations. The animals (Rana ridibunda) were treated in accordance with the International Guiding Principles for Biomedical Research Involving Animals, 2012, and AVMA Guidelines for the Euthanasia of Animals: 2013 Edition. The frogs were dark-adapted overnight. They were anesthetized with Tricaine (Sigma), which was dissolved in the bathing water to a concentration of 500 mg/L, and were then decapitated and pithed. After eye excision, flattened eyecup preparations were made under dim red light. The eyecup preparations were perfused continuously with a Ringer solution (in mM: NaCl 110, KCl 2.6, NaHCO3 10, CaCl2 1.6, MgCl2 0.8, glucose 2.0, HCl 0.5 to adjust pH to 7.7) at a rate of 1.9 mL/min. In a subset of experiments, the eyecup preparations were not perfused with a Ringer solution, but instead placed in a small chamber containing a specified amount of Ringer solution. In both cases, the preparations were supplied with moistened oxygen.
Light stimulation
Diffuse white light from a 150 W tungsten halogen lamp was used in most of the experiments. Stimulus intensity (I) was varied using neutral density filters over a wide (11 log units) intensity range, with a maximum intensity of 8.78 log quanta × s−1 × μm−2 at the plain of the retina. Cone-isolating chromatic stimuli were also applied, obtained using a dark red filter (Schott-Jena RG5 filter; cut-off at 670 nm) whose spectrum did not overlap with the absorption spectrum of the rod visual pigments (for the frog visual pigment spectral curves, see Donner & Reuter, Reference Donner, Reuter, Llinas and Precht1976; Govardovskii et al., Reference Govardovskii, Fyhrquist, Reuter, Kuzmin and Donner2000). The maximum intensity of the chromatic stimuli was 6.63 log quanta × s−1 × μm−2. For both types of stimuli, the intensities used in the experiments were represented as maximum intensity attenuation, expressed in log units.
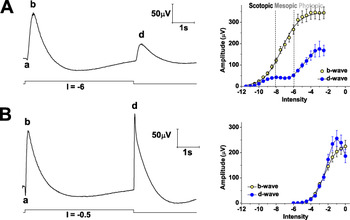
Test stimuli with a 5 s duration were used, which allowed for good separation of the ERG ON and OFF responses (b- and d-waves; Fig. 1). The test stimuli were presented at 30 s intervals in the dark or under a rod-saturating background. Thirty minute dark adaptation or 15 min light adaptation preceded the start of the test stimulation. In some groups of experiments, a single stimulus intensity was used. In other groups of experiments, in which the intensity-response (V–log I) relationship was studied, test stimuli with increasing I were presented at 0.5 log unit steps. In these experiments, two consecutive series of test stimuli were presented (before and during the drug application), and the eyes were dark- or light-adapted in the same manner before each of the stimulus series. In the latter experiments, test stimuli with high intensity were used, which produced some changes in retinal sensitivity. In order to distinguish between the drug effects and the nonspecific sensitivity changes, we carried out control experiments with no drug application in which the nonspecific effects were evaluated. The relative changes in the test and control experiments were compared at corresponding times.
ERG responses to long-lasting (5 s) stimuli. (A) ERG responses obtained with white stimuli in the dark. Left: an original record from an individual experiment; I = −6. Light stimulation is represented below the ERG curve. The a-, b-, and d-waves are designated with the corresponding letters. Right: intensity–response (V–log I) functions of the b- and d-waves (ON and OFF responses, respectively), obtained in control conditions (mean values ± s.e.m., N = 12). The scotopic, mesopic, and photopic ranges are separated by dashed vertical lines. It can be noticed that in the dark-adapted retinae, the absolute and relative sensitivities (evaluated by the threshold intensity and the semi-saturation point, respectively; see the text) as well as the amplitude span (V max) of the b-wave, are greater than those of the d-wave. On the ascending limb of the d-wave V–log I function, the rod- and cone-dominated responses are partially separated. (B) ERG responses obtained under a rod-saturating background. Left: an original record from an individual experiment; I = −0.5. Light stimulation is represented below the curve. The a-, b-, and d-waves are designated with the corresponding letters. Right: intensity–response (V–log I) functions of the b- and d-waves, obtained in control conditions (mean values ± s.e.m., N = 12). Under a rod-saturating background, the absolute sensitivity and amplitude span of the d-wave are greater than those of the b-wave. In both dark- and light-adapted eyes, an amplitude decline instead of saturation is observed in the OFF responses at the highest intensities.

In the dark-adapted eyes, both white and cone-isolating chromatic stimuli were applied. Using a wide range of white stimuli, we could vary the relative contribution of rod- and cone-mediated responses. Pure rod-mediated (scotopic) responses were obtained in the intensity range below the cone threshold. With increasing I, mixed rod and cone (mesopic) and cone-dominated (photopic) responses were obtained (Fig. 1A: right). The dominating photoreceptor input was proved by the spectral sensitivity curves obtained within different ranges of stimulus intensities (Popova & Kupenova, Reference Popova and Kupenova2011). For the evaluation of the pure cone-mediated responses (without any rod contribution), the cone-isolating chromatic (dark red) stimuli were applied.
In the light-adapted eyes, white test stimuli were presented under a white background. Cone-mediated responses were obtained because the background used (6.38 log quanta × s−1 × μm−2) was rod-saturating (Fain, Reference Fain1976).
Electroretinogram recording and data analysis
The electroretinograms were recorded by means of Ag/AgCl electrodes at a bandpass of 0.1–1000 Hz and digitized at 2 kHz (Biopac system MP 150, Biopac Systems, Inc., 42 Aero Camino, Goleta, California 93117, USA AcqKnowledge 4.3.1 software). For each stimulus presentation, the data collection started 100 ms prior to stimulus onset and lasted 8 s (see the illustrations in Fig. 1A and 1B). In the experiments in which a single stimulus intensity was used, 10 responses were averaged during the pretreatment period, the period of drug application, and the recovery period. The amplitudes of the ERG waves were measured as follows: a-wave—from the baseline to the a-wave trough; b-wave—from the trough of the a-wave to the peak of the b-wave; d-wave—from the baseline to the peak of the d-wave. The OPs were isolated offline using digital filters (30–300 Hz bandpass). The amplitude of each of the OPs was measured from the preceding trough to its peak. The amplitudes of the responses, obtained using stimuli with different I, were used for evaluation of the intensity–response (V–log I) functions of the ERG b- and d-waves. The b-wave V–log I function was fitted by the least square method to a generalized form of the Naka–Rushton function: V/V max = I n /(I n + σ n ), where V is b-wave amplitude; V max is b-wave maximal amplitude; I is stimulus intensity; σ is stimulus intensity required to produce 0.5V max amplitude (semi-saturation point); and n is an exponent related to the steepness of the V–log I function and hence to response dynamic range. In our experiments, the response dynamic range was defined as the intensity span of the responses with 0.05–0.95V max amplitude. The d-wave V–log I function was smoothed using a method for smooth approximation of data (Talmi & Gilat, Reference Talmi and Gilat1977; Kupenova, Reference Kupenova2011). The V–log I functions were used for the evaluation of the ERG response absolute and relative sensitivity. The absolute sensitivity was assessed by the ERG response threshold—the stimulus intensity (I threshold) necessary for obtaining a criterion amplitude of 5 µV. The response relative sensitivity was assessed by the σ value. It was obtained from the approximating Naka–Rushton equation (b-wave) or from the smooth approximating function (d-wave). By substitution of V in the Naka–Rushton equation with 0.05V max and 0.95V max, it was also possible to estimate the b-wave dynamic range. Because of the complex character of the d-wave V–log I function, the dynamic range of this response was not evaluated. Typical V–log I functions of the b- and d-waves (means ± s.e.m.), obtained in dark- and light-adapted eyes, are shown in Fig. 1 (A, right; B, right).
For the assessment of the temporal characteristics of the ERG responses, the peak latencies of the b- and d-waves were measured. The b-wave peak latency was measured from the stimulus onset to the peak of the b-wave; the d-wave peak latency was measured from the stimulus offset to the peak of the d-wave.
Drug application
The selective P2X7R antagonist A438079 (Tocris Bioscience, Bristol, UK) was used for the P2X7R blockade. After studying the dose–effect relationship, a saturating concentration of 200 µM was chosen for the experiments with an isolated P2X7R blockade. In the perfused eyecup preparations, the antagonist was applied by switching the control Ringer solution to a Ringer solution containing 200 µM A438079. The P2X7R antagonist concentration was doubled in some experiments with a combined agonist and antagonist application.
For P2X7R stimulation, the selective P2X7R agonist 2′(3′)-O-(4-benzoylbenzoyl) adenosine 5′-triphosphate triethylammonium salt (Bz-ATP; Sigma-Aldrich St. Louis, MO 63103, USA) was used in 100 µM, 300 µM, and 1 mM concentrations. The agonist was applied in nonperfused eyecup preparations by replacing specified amounts of the fluid (Ringer solution) in the chamber, containing the preparation with the same amounts of Ringer solution, and containing different concentrations of Bz-ATP. The final agonist concentration was calculated by taking into account the degree of dilution.
In a group of experiments, the mass photoreceptor response (the ERG distal P III component) was isolated pharmacologically by the application of 20 mM Na aspartate (Sigma-Aldrich St Louis, MO 6303, USA). This concentration was sufficient to block all postreceptoral ERG components (Sillman et al., Reference Sillman, Ito and Tomita1969a ). In these experiments, the perfusion with a normal Ringer solution was switched to a Ringer solution containing 20 mM Na aspartate (replacing the same amount of NaCl). After isolating the mass receptor potential, the effect of A438079 was tested by switching the perfusion with a Ringer solution containing 20 mM Na aspartate to a Ringer solution containing both 20 mM Na aspartate and 200 µM A438079.
In another group of experiments, the effects of 20 mM K+ (replacing the same amount of Na+ in the Ringer solution) were tested; the effects were then compared to the effects of a prolonged (>20 min) treatment with 1 mM Bz-ATP.
Control experiments were also carried out with a Ringer solution perfusion throughout the experiments.
Statistical analysis
Two types of comparisons were made: (1) In both test and control experiments, the values obtained during the period of pharmacological treatment (or at the corresponding time in the controls) were compared to the values obtained in the pretreatment (initial) period using one-way or two-way ANOVA RM (alpha = 0.05) with the Tukey–Kramer post hoc test. The paired t test was also used in some cases. (2) The amplitudes of the ERG waves were expressed as a percentage of the initial (pretreatment) values, and the relative amplitude changes obtained in the test experiments during the drug treatment were compared to those obtained in the control experiments at the corresponding times. Two-way ANOVA (alpha = 0.05) with the Tukey–Kramer post hoc test was used in this case. Comparing the relative changes in the test and control experiments, we could differentiate between the specific effects of the drugs and the sensitivity changes due to other factors (such as adaptation caused by the test stimulation). This comparison was not made for some responses with very low amplitude in order to avoid overestimation or underestimation of relative changes.
The data are presented as mean ± standard error of the mean (s.e.m.).
Results
Effects of P2X7R blockade with A438079
Initial testing of A438079 effects, dose–effect relationship, time course, and reversibility of the effects
In these experiments, light stimuli with a 5 s duration were presented at 30-s intervals in dark-adapted retinae. A single stimulus intensity (I = −6) was used throughout the experiments. At this intensity, mixed (rod- and cone-driven) responses were obtained.
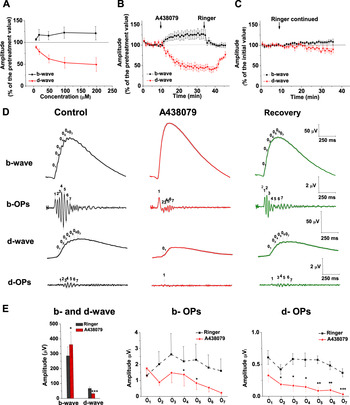
Several concentrations of the antagonist were first tested in order to evaluate the dose–effect relationship. Each of the concentrations was tested in five experiments. Typically, in a single experiment, two of the concentrations were applied. An increase of the b-wave amplitude and a decrease of the d-wave amplitude were found, both effects being dose-dependent (Fig. 2A). The a-wave amplitude was not significantly changed in these conditions.
Basic effects of 200 µM A438079 on the ERG b- and d-waves, obtained with I = −6. (A) Dose-effect relationship (mean values ± s.e.m.; N = 5 for each concentration). (B) Time course and reversibility of the effects. The amplitudes of the b- and d-waves are expressed as a percentage of the pretreatment values (mean values ± s.e.m.; N = 9); (C) Time course of the amplitude changes (percentage of the initial values) in the control experiments with Ringer solution perfusion throughout the experiments (mean values ± s.e.m.; N = 8). (D) Original curves from a test experiment obtained during the control (pretreatment) period (left), the period of A438079 treatment (in the middle), and the recovery period (right). Each curve is an average of 10 responses. Mean values (colored lines) ± s.e.m. (light gray bands) are represented. The b- and d-waves, as well as the OPs, extracted by offline filtering (30–300 Hz band-pass), are shown. (E) Effects of A438079 on the amplitudes of the b-wave, d-wave, and the individual OPs superimposed on these waves (mean values ± s.e.m.; N = 9). The pretreatment values (Ringer, black color) are compared with the values obtained during A438079 treatment (A438079, red color). The changes, which are statistically significant, are denoted by asterisks: paired t test; *P < 0.05; **P < 0.01; ***P < 0.001. For more details, see the text.

The time course and reversibility of the effects of a saturating concentration (200 µM) of A438079 were studied in nine experiments (Fig. 2B). Eight controls with a Ringer solution perfusion throughout the experiments were also carried out (Fig. 2C). In the test experiments, the effects of the P2X7R blockade were followed for 25 min, after which the perfusion was switched again to a Ringer solution in order to test the reversibility of the effects. A stable plateau effect on both the b- and d-wave amplitudes was observed between the 10th and 20th minute of the A438079 treatment (one-way ANOVA RM with the Tukey–Kramer post hoc test, P > 0.05 for the amplitude differences, obtained at different times during this period). The stability of the A438079 effects allowed for the averaging of responses. Ten responses were averaged offline for each period of the experimental procedure: during the pretreatment period, the period of drug application, and the recovery period. An averaged ERG response (mean ± s.e.m.) is shown in Fig. 2D. The averaged values were used for statistical evaluation of the drug effect. The b-wave amplitude was significantly increased, while the d-wave amplitude was significantly decreased (Fig. 2E). The effects on both the b- and d-wave amplitudes were reversible (Fig. 2B and 2D). The relative amplitude changes obtained in the A438079-treated retinae (Fig. 2B) differed significantly from those obtained in the control experiments at the corresponding times (Fig. 2C); (two-way ANOVA, P < 0.0001 for both ERG waves). The opposite effects of A438079 on the b- and d-wave amplitudes resulted in a significant increase of the b-/d-wave amplitude ratio: from 3.99 ± 1.015 in the pretreatment period to 12.59 ± 4.431 at the 20th minute of the treatment (paired t test, P < 0.05), which means that the ON response was favored after the blockade.
Averaging of the ERG responses allowed for the measurement of some minor ERG components: the b- and d-wave OPs. Seven OPs (O1 to O7) were detected on the ascending limbs of both the b- and d-waves, which were time-locked to the stimulus onset or offset, respectively (Fig. 2D). The amplitude of all the OPs was reduced (Fig. 2E), with the exception of the b-wave O1. The amplitude diminution was statistically significant (paired t test) for the b-wave O4 and O5 and for the d-wave O2 to O7. In many of the experiments, the late d-wave OPs became indistinguishable from the noise, and a zero value was assigned to the nondetectable values. The effect on the OPs was partially reversible (Fig. 2D).
The peak latencies of the b- and d-waves were shortened: for the b-wave—from 353.3 ± 13.71 ms during the pretreatment period to 313.4 ± 14.59 ms at the 20th minute of the treatment (paired t test, P < 0.001; see also Fig. 2D); and for the d-wave—from 396.8 ± 19.90 to 344.2 ± 17.82 ms for the same periods (P < 0.05). The peak latencies were not changed in the control experiments at the corresponding times.
The stability of the A438079 effects allowed us to also test the intensity dependence of the effects of the P2X7R blockade, which is described below.
Effects of A438079 in dark-adapted eyes: Dependence on stimulus intensity and photoreceptor input
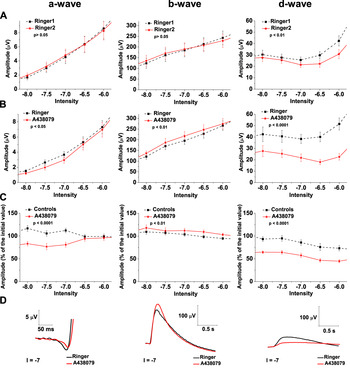
In the dark-adapted retinae, the dependence of P2X7R-mediated effects on stimulus intensity and photoreceptor input was evaluated by varying the intensity of white and chromatic (dark-red, cone-isolating) stimuli in a wide range. The results of this testing are presented in Figs. 3–6. Because of the difference between the rod and cone thresholds (Normann & Werblin, Reference Normann and Werblin1974), the responses to the weakest white stimuli, covering 2–2.5 log units above the ERG threshold (I = −11 to I = −8.5), were rod-driven (scotopic). At higher intensities (I = −8 to I = −6), mixed rod- and cone-driven (mesopic) responses were obtained. At still higher intensities, the responses were cone dominated (photopic), but the dynamic cone-driven responses were always mixed with a nondynamic, saturated rod response. Pure cone-driven responses, without any rod contribution, were obtained in a separate group of experiments, in which cone-isolating chromatic (dark-red) stimuli were applied in dark-adapted retinae.
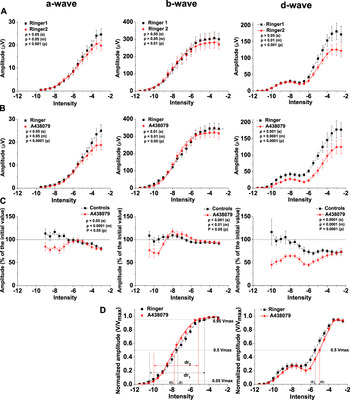
Effects of 200 µM A438079 on the ERG a-wave (left), b-wave (in the middle), and d-wave (right) amplitudes obtained in dark-adapted eyes using white stimuli with different intensities. All data are represented as mean values ± s.e.m.; N = 14 and N = 12 for the test and control experiments, respectively. In all graphs, in which V–log I functions are demonstrated, the experimental data points as well as the approximating curves (see Materials and methods) are shown. (A) Intensity–response functions, obtained in the control experiments (with Ringer solution perfusion throughout the experiments) during the initial period (Ringer 1; squares, dashed line) and the period corresponding to that of the plateau effect in the test experiments (Ringer 2; stars, solid line). Two-way ANOVA RM was used for statistical evaluation. The differences between the amplitudes obtained during the two periods were separately evaluated for the responses to scotopic stimuli (denoted by s; I = −11 to I = −8.5), mesopic stimuli (denoted by m; I = −8 to I = −6) and photopic stimuli (denoted by p; I ≥ −5.5). The P values obtained are shown in the graph legends. (B) Intensity–response functions, obtained in the test experiments with A438079 application during the pretreatment period (Ringer; squares; dashed line) and the period of the plateau effect of the blocker (A438079; stars; solid line). Statistical evaluation—as in (A). (C) Comparison of the relative changes in the ERG wave amplitudes (expressed as a percentage of the initial values) obtained at different intensities in the control experiments (Controls; squares, dashed line) and test experiments (A438079; stars, solid line). Two-way ANOVA was used for evaluation of the differences between the relative amplitude changes in the test and control experiments. The P values obtained are shown in the graph legends. Separate statistical evaluation was made for responses to scotopic (s), mesopic (m), and photopic (p) stimuli. (D) Effects of P2X7R blockade with 200 µM A438079 on the parameters of the intensity–response functions of the b- and d-waves [left and right graphs, respectively; the symbols used are the same as in (B)]. The amplitudes of the responses are normalized to the response maximum amplitudes (V/V max). During the P2X7R blockade, the σ point of the b-wave V–log I function was shifted to the left along the intensity axis (compare σ 1, obtained before the drug treatment, to σ 2, obtained during the drug treatment), indicating an increase in the relative sensitivity of the ON response. Conversely, the σ point of the d-wave V–log I function was shifted to the right, indicating a decrease in the relative sensitivity of the OFF response. The b-wave dynamic range (dr) was narrowed during the P2X7R blockade (compare dr1 to dr2, obtained during the pretreatment period and during the A438079 application, respectively). For statistical evaluation of the changes in the V–log I function parameters, see Table 1.

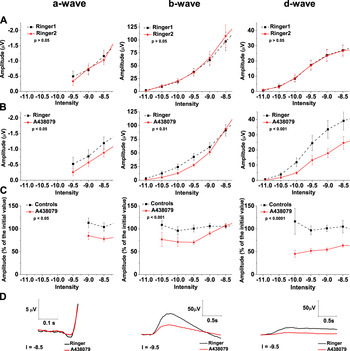
Effects of 200 µM A438079 on the amplitude of the pure rod-driven ERG responses. In A to C, the scotopic responses from Fig. 3 are shown at a higher magnification. Mean values ± s.e.m. are represented; N = 14 and N = 12 for the test and control experiments, respectively. Left: a-wave; in the middle: b-wave; right: d-wave. (A) Amplitudes, obtained in the control experiments (with Ringer solution perfusion throughout the experiments) during the initial period (Ringer 1; squares; dashed line) and the period corresponding to that of the plateau effect in the test experiments (Ringer 2; stars; solid line). The differences between the amplitudes obtained during the two periods are evaluated with two-way ANOVA RM. The P values obtained are shown in the graph legends. (B) Amplitudes, obtained in the test experiments with A438079 application during the pretreatment period (Ringer; squares; dashed line) and the period of the plateau effect of the blocker (A438079; stars; solid line). Statistical evaluation—as in (A). (C) Comparison of the relative changes in the ERG wave amplitudes (expressed as a percentage of the initial values) obtained at different intensities in the control experiments (Controls; squares; dashed line) and test experiments with A438079 application (A438079; stars; solid line). The differences between the relative amplitude changes in the test and control experiments were evaluated with two-way ANOVA. The P values obtained are shown in the graph legends. (D) Original ERG records, demonstrating the effects of A438079 on the pure rod-driven responses. The curves obtained during the pretreatment period (Ringer; black line) and the period of the A438079 treatment (A438079; red line) are superimposed. The beginning of the records coincides with the stimulus onset (a- and b-waves) or offset (d-wave). Stimulus intensity (I) is indicated for each record.

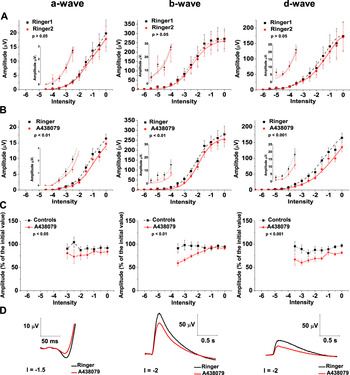
Effects of 200 µM A438079 on the amplitude of the mixed rod- and cone-driven responses. In A to C, the mesopic responses from Fig. 3 are shown at a higher magnification. Mean values ± s.e.m. are represented, N = 14 and N = 12 for the test and control experiments, respectively. Left: a-wave; in the middle: b-wave; right: d-wave. (A) Amplitudes, obtained in the control experiments (with Ringer solution perfusion throughout the experiments) during the initial period (Ringer 1; squares; dashed line) and the period corresponding to that of the plateau effect in the test experiments (Ringer 2; stars; solid line). The differences between the amplitudes obtained during the two periods are evaluated with two-way ANOVA RM. The P values obtained are shown in the graph legends. (B) Amplitudes, obtained in the test experiments with A438079 application during the pretreatment period (Ringer; squares; dashed line) and that of the plateau effect of the blocker (A438079; stars; solid line). Statistical evaluation—as in (A). (C) Comparison of the relative changes in the ERG wave amplitudes (expressed as a percentage of the initial values) obtained at different intensities in the control experiments (Controls; squares; dashed line) and test experiments with A438079 application (A438079; stars; solid line). The differences between the relative amplitude changes in the test and control experiments were evaluated with two-way ANOVA. The P values obtained are shown in the graph legends. (D) Original ERG records, demonstrating the effects of A438079 on the mixed rod- and cone-driven responses. The curves obtained during the pretreatment period (Ringer, black line) and the period of the A438079 treatment (A438079; red line) are superimposed. The beginning of the records coincides with the stimulus onset (a- and b-waves) or offset (d-wave). Stimulus intensity (I) is indicated for each record.

Effects of 200 µM A438079 on the amplitude of the pure cone-driven ERG responses obtained in dark adapted eyes using cone-isolating chromatic stimuli with different intensity. In A to C, mean values ± s.e.m. are represented, N = 7 and N = 6 for the test and control experiments, respectively. (A) Amplitudes, obtained in the control experiments (with Ringer solution perfusion throughout the experiments) during the initial period (Ringer 1; squares; dashed line) and the period, corresponding to that of the plateau effect in the test experiments (Ringer 2; stars; solid line). A magnified view of the low-amplitude responses is presented in the insets using different amplitude scales. A common intensity scale was used for the main graphs and the insets. The differences between the amplitudes obtained during the two periods are evaluated with two-way ANOVA RM. The P values obtained are shown in the graph legends. (B) Amplitudes, obtained in the test experiments with A438079 application during the pretreatment period (Ringer; squares; dashed line) and the period of the plateau effect of the blocker (A438079; stars; solid line). Statistical evaluation—as in (A). (C) Comparison of the relative changes in the ERG wave amplitudes (expressed as a percentage of the initial values), obtained at different intensities in the control experiments (Controls; squares; dashed line) and test experiments with A438079 application (A438079; stars; solid line). The differences between the relative amplitude changes in the test and control experiments were evaluated with two-way ANOVA. The P values obtained are shown in the graph legends. (D) Original ERG records, demonstrating the effects of A438079 on the pure cone-driven responses. The curves obtained during the pretreatment period (Ringer, black line) and the period of the A438079 treatment (A438079, red line) are superimposed. The beginning of the records coincides with the stimulus onset (a- and b-waves) or offset (d-wave). Stimulus intensity (I) is indicated for each record.

The V–log I functions, obtained with white stimuli over the whole dynamic range (14 test and 12 control experiments), are presented in Fig. 3. Two V–log I curves were obtained for each of the ERG waves in both test and control experiments: the first curve was obtained in the initial (pretreatment) period, while the second one was obtained during the treatment with 200 µM A438079 (or at the corresponding time in the controls).
For all the ERG waves obtained in the control experiments (a-, b-, and d-wave; Fig. 3A), the second V–log I curve differed from the first one. The changes in the amplitudes of the responses to scotopic (s), mesopic (m), and photopic (p) stimuli were separately evaluated (two-way ANOVA RM; see the P values in the graph legends). While no significant differences were obtained in the responses to scotopic (for a-, b-, and d-waves) and mesopic (for a- and b-waves) stimuli, an amplitude decline was demonstrated in the responses to the higher I stimuli. The amplitude decline, observed in the control experiments, reflected the nonspecific (nonrelated to the drug treatment) changes in retinal sensitivity, produced mostly by the adaptational effect of the test stimulation itself.
To distinguish between these nonspecific effects and the effects of the drug treatment in the test experiments, we made two comparisons (see also Materials and methods): (1) In the test experiments, the response amplitudes obtained at different intensities during the period of A438079 treatment were compared to those obtained at the same intensities in the pretreatment period (Fig. 3B). Two way ANOVA RM was used for this comparison. The effects of the P2X7R blockade were significant in all intensity ranges (see the P values in the graph legends). The amplitude of the a- and d-waves was always decreased whereas that of the b-wave was either decreased (in scotopic and photopic responses) or increased (in mesopic responses). (2) The relative changes in the ERG wave amplitudes obtained during the drug treatment in the test experiments (percentage of the pretreatment value) were compared to the relative changes obtained at the corresponding time in the control experiments (Fig. 3C). Two-way ANOVA was used for this comparison (the P values obtained for the scotopic, mesopic, and photopic responses are presented in the graph legends). This comparison not only demonstrated A438079 effects but also accounted for the nonspecific sensitivity changes observed in the control experiments. It showed that the well-expressed diminution of the ERG wave amplitudes, observed in the responses to higher I stimuli in the test experiments, was partially (for the a- and d-waves) or entirely (for the b-wave) due to the nonspecific retinal sensitivity changes but not due to the action of the P2X7 receptor blocker. For the a- and d-waves, the relative amplitude diminution in the photopic range was greater in the test compared to control experiments. Therefore, the real effect of the A438079 treatment on these waves was a significant but relatively small amplitude diminution. For the b-wave, the amplitude decrease was stronger in the control than in the tests experiments which indicates a small relative potentiation in the A438079 treated eyes.
The results shown in Fig. 3C clearly demonstrate that the relative amplitude changes produced by the P2X7R blockade were intensity dependent. With increasing I, the difference between the relative changes in the test and control experiments diminished. Another interesting observation was that depending on the stimulus intensity used, the b-wave amplitude was decreased (at the lowest I) or increased (at some higher I, including the intensity used for the initial testing), while the d-wave amplitude was always diminished. In order to explain these results, we tried to evaluate (1) if the rod-driven and cone-driven responses were affected by the A438079 treatment in a different manner or to a different degree, and (2) if some of the observations mentioned above may result from the modulation of the rod–cone signal interaction. For these reasons, we analyzed in more detail and compared the effects of A438079 on pure rod-driven, pure cone-driven, and mixed rod- and cone-driven responses.
The pure rod-driven responses from Fig. 3 are shown at a higher magnification in Fig. 4. As mentioned above, they were affected significantly by the P2X7R blockade. The amplitudes of both the receptor component (a-wave, obtained only at the higher intensities of this range because of its higher threshold) and postreceptoral ON and OFF components (b- and d-waves) were diminished (Fig. 4B–4D). The relative decrease of the b- and d-wave amplitude was intensity-dependent—with increasing I, it diminished (one-way ANOVA RM with the Tukey–Kramer post hoc test, P < 0.001 for the b-wave, P < 0.05 for the d-wave). The relative amplitude change was greater for the OFF response than for the ON response (two-way ANOVA, P < 0.0001). Therefore, the ON response was relatively favored during the P2X7R blockade.
The mixed rod- and cone-driven responses from Fig. 3 are shown at a higher magnification in Fig. 5. In these responses, the A438079 treatment produced a diminution of the a-wave amplitude similar to that found in the pure rod-driven responses. However, such a similarity was not observed in the effects of the antagonist on the postreceptoral ERG responses, because the amplitude of the b-wave was increased while that of the d-wave was decreased. Strong ON/OFF asymmetry was thus manifested favoring the ON response. To clarify the different effects of the P2X7R blockade on the postreceptoral responses to scotopic and mesopic stimuli, we tested the effect of A438079 on pure cone-driven responses isolated by chromatic light stimulation.
Pure cone-driven ERG responses were obtained with dark-red stimuli in seven test and six control experiments (Fig. 6). The effects of the P2X7R blockade with A438079 on the amplitudes of the dark-adapted cone-driven ERG responses were similar to those obtained in the rod-driven responses. The amplitudes of all the ERG waves were significantly decreased. The b- and d-wave amplitude diminution was intensity-dependent—with increasing intensity, it decreased (one-way ANOVA RM with the Tukey–Kramer post hoc test, P < 0.001 for the b-wave, P < 0.05 for the d-wave). The similarity of the effects of the P2X7R blockade on the rod-mediated and cone-mediated responses indicates that the specific effect of the blockade on the mixed, rod- and cone-driven responses may result from modulation of rod-cone signal interaction.
We also tested whether the rod-driven and cone-driven responses were affected to the same extent by the P2X7R blockade. For this purpose, we compared the relative changes in the b- and d-wave amplitudes of the rod-driven responses with those obtained in the cone-driven ERG responses. The rod- and cone-driven responses were compared at four intensity points. For each of the responses, the stimulus intensities used fell within the intensity range covering two log units above the threshold. No significant difference was found for the b-wave relative amplitude change. However, the relative change in the d-wave amplitude was more pronounced in the rod-driven than in the cone-driven responses (compare Fig. 4C with Fig. 6C; two-way ANOVA, P < 0.05).
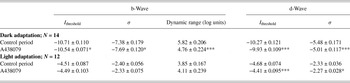
The intensity-dependent changes of the b- and d-wave amplitudes produced by the P2X7R blockade resulted in specific changes in the parameters of the b- and d-wave V–log I functions (see the normalized curves in Fig. 3D and the data shown in Table 1). Whereas the σ value of the b-wave V–log I function was decreased, indicating a b-wave relative sensitivity increase, the σ value of the d-wave V–log I function was increased (indicating a d-wave relative sensitivity decrease). This result shows that the ON response was favored during the P2X7R blockade. Although the relative sensitivity of the ON and OFF response was changed in an opposite manner, the absolute sensitivity of both ERG responses was decreased (the I threshold of the two waves was increased), because of the amplitude diminution of the two responses observed in the lower I range. The dynamic range of the b-wave was significantly narrowed (by more than one log unit), indicating that the widening of the ON response dynamic range might be an important effect of P2X7R activation by the endogenous ATP.
Effects of 200 µM A438079 on the b- and d-wave absolute and relative sensitivity (evaluated by the I threshold and the semisaturation point σ, respectively), as well as on the b-wave dynamic range obtained in dark and light-adapted retinae. Mean values ± s.e.m. are represented. Statistics: paired t test; *P < 0.05; **P < 0.01; ***P < 0.001. The number of experiments (N) is indicated in the table

Effects of A438079 in light-adapted eyes
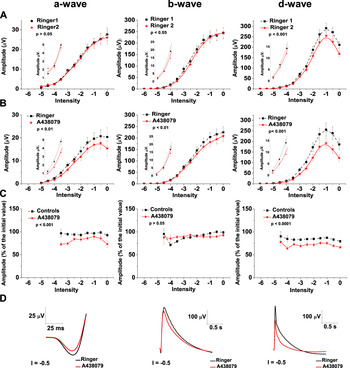
In 12 experiments, we tested the effects of the P2X7R blockade with A438079 on the ERG responses to a wide range of white test stimuli under a rod-saturating white background (Fig. 7). We could thus compare the contribution of the P2X7Rs to light responses in different conditions of light adaptation. Twelve control experiments were also carried out in these conditions. A diminution of the amplitudes of all the ERG waves was found (Fig. 7B–7D). The effect did not show significant intensity dependence. As a whole, smaller differences were obtained between the changes in the test and control experiments in the light-adapted eyes as compared to the dark-adapted eyes (compare Figs. 7 to 4–6). The relative decrease of the a- and d-wave amplitudes in the test experiments was greater when compared to that in the control experiments (Fig. 7C). However, no significant difference was obtained for the b-wave when the control and test experiments were compared over the whole intensity range. Yet, in the A438079-treated eyes, a small relative b-wave potentiation was seen at the lower intensities (P < 0.05 for the I range from −4 to −2.5) and some amplitude reduction was seen at the higher intensities (P < 0.01 for the I range from −1.5 to 0).
Effects of 200 µM A438079 on the amplitude of the ERG responses obtained in light adapted eyes using white stimuli with different intensity under a rod-saturating background. In A to C, mean values ± s.e.m. are represented, N = 12 for both test and control experiments. In all graphs, in which V–log I functions are demonstrated, the experimental data points as well as the approximating curves (see Materials and methods) are shown. (A) Amplitudes, obtained in the control experiments (with Ringer solution perfusion throughout the experiments) during the initial period (Ringer 1; squares; dashed line) and the period corresponding to that of the plateau effect in the test experiments (Ringer 2; stars; solid line). A magnified view of the low-amplitude responses is presented in the insets using different amplitude scales. A common intensity scale was used for the main graphs and the insets. The differences between the amplitudes obtained during the two periods are evaluated with two-way ANOVA RM. The P values obtained are shown in the graph legends. (B) Amplitudes, obtained in the test experiments with A438079 application during the pretreatment period (Ringer; squares; dashed line) and the period of the plateau effect of the blocker (A438079; stars; solid line). Statistical evaluation—as in (A). (C) Comparison of the relative changes in the ERG wave amplitudes (expressed as a percentage of the initial values) obtained at different intensities in the control experiments (Controls; squares; dashed line) and test experiments with A438079 application (A438079; stars; solid line). The differences between the relative amplitude changes in the test and control experiments were evaluated with two-way ANOVA. The P values obtained are shown in the graph legends. (D) Original ERG records, demonstrating the effects of A438079 on the ERG responses in light-adapted eyes. The curves obtained during the pretreatment period (Ringer, black line) and the period of the A438079 treatment (A438079, red line) are superimposed. The beginning of the records coincides with the stimulus onset (a- and b-waves) or offset (d-wave). Stimulus intensity (I) is indicated for each record.

The overall effect of the P2X7R blockade on the absolute and relative sensitivity of the b- and d-waves in the light-adapted eyes was smaller compared to that obtained in the dark-adapted eyes (Table 1). Unlike the results obtained in the dark-adapted eyes, no significant change in the b-wave absolute and relative sensitivity was obtained, nor was the b-wave dynamic range narrowed. The absolute and relative sensitivity of the d-wave, however, was decreased, and hence the ON response was relatively favored. So, in both dark- and light-adapted eyes, the ON/OFF asymmetry of the effects of the P2X7R blockade favored ON responses, indicating that a potentiation of OFF responses may be an important effect of the P2X7R-mediated influence of the endogenous ATP.
Effects of A438079 on the mass receptor potential
As mentioned in the Introduction, data have been obtained by some researchers that indicate a possible corelease of glutamate and ATP from photoreceptors. These data, along with the finding that P2X7Rs are expressed in the photoreceptors themselves, imply that P2X7Rs might be involved in an autocrine action of the released ATP on the photoreceptors. In order to test this hypothesis, we studied the effect of 200 µM A438079 on the mass receptor potential, isolated pharmacologically by the application of a Ringer solution containing 20 mM Na aspartate.
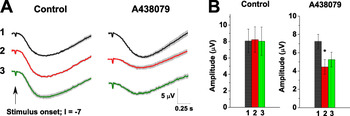
Four test experiments and the same number of control experiments were carried out. White stimuli with intensity I = −7 were used throughout the experiments. This intensity was chosen because it fell within the intensity range where the effect of the antagonist on the ERG a-wave, obtained in the previous experiments, was well expressed. In the test experiments, mass photoreceptor potential was first isolated by perfusion of the eyecup preparations with a Ringer solution containing 20 mM Na aspartate. The treatment with 200 µM A438079 (added to the perfusate) started when a stable, isolated photoreceptor response was recorded. A short recovery period followed the period of drug treatment. In the control experiments, the eyecups were treated with 20 mM Na aspartate throughout the experiment. In the test experiments, the effect of A438079 developed in 5–7 min and remained stable during the next 15 min (one-way ANOVA RM with the Tukey–Kramer post hoc test, P > 0.05 for the amplitude differences obtained at different times during the plateau phase of the effect). This allowed for the averaging of responses (Fig. 8A). Eleven responses were averaged during each phase of the pharmacological treatment. The values obtained during the plateau phase of the effect of the antagonist were compared to the pretreatment values (obtained with Na aspartate only). A significant decrease of the mass photoreceptor potential amplitude was found in the test experiments (Fig. 8B). The reversibility of the A438079 effect was tested by reperfusion with a Ringer solution containing 20 mM Na aspartate only. The effect was followed for only a short time (5 min) because the reversibility of the A438079 effects had already been tested in a separate group of experiments (see Fig. 2B and 2D). Only partial recovery was observed during the early recovery period (Fig. 8A and 8B). No significant changes in the mass receptor potential amplitude were found in the control experiments throughout the experiments (Fig. 8A and 8B).
Effects of 200 µM A438079 on the mass receptor potential isolated pharmacologically by application of 20 mM Na aspartate. (A) Original records from a control (left) and test (right) experiment; I = −7. Each curve is an average of 11 individual responses (mean ± s.e.m.) obtained during the following periods (denoted by numbers): 1, the pretreatment period (20 mM Na aspartate in both test and control experiments); 2, the period of A438079 treatment (200 µM A438079 plus 20 mM Na aspartate in the test experiments; 20 mM Na aspartate in the control experiments); 3, the recovery period (20 mM Na aspartate in both test and control experiments). The curves were obtained during the early recovery period (the first 5 min following the blocker removal). (B) Amplitude of the mass receptor potential, obtained in the control (left) and test (right) experimental groups during the three periods of pharmacological treatment, mentioned above: the control period (1), the period of A438079 treatment in the test experiments or the corresponding time period in the controls (2), and the early recovery period (3). Mean values ± s.e.m. are represented; N = 4 for both the test and control groups. The asterisk indicates the statistical significance of the A438079 effect in the test experiments (t-test; P < 0.05). No significant change was obtained in the control experiments.

Effects of P2X7R stimulation with Bz-ATP
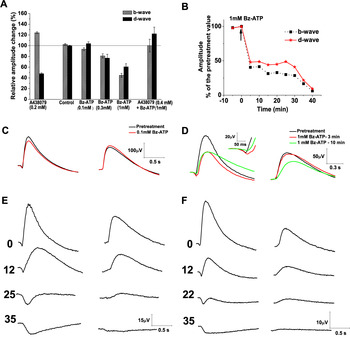
Light stimulation with a single stimulus intensity (I = −6) was applied in the dark similar to the corresponding experiments with the antagonist, first described in this text. Three concentrations of the P2X7R agonist were tested: 100 µM (N = 6), 300 µM (N = 6), and 1 mM (N = 8). A single concentration was applied in each of the test experiments. Six control experiments with a Ringer solution were also carried out. In an additional group of five experiments, the effect of 1 mM Bz-ATP was tested after pretreatment with 400 µM A438079. Two-way ANOVA was performed to evaluate the differences in the relative amplitude changes obtained in the test and control experiments. The effects on the b- and d-wave amplitudes (percentage of the initial value) obtained in the different groups at the 10th minute of the drug treatment are represented in Fig. 9A. Taking into account the effects of the P2X7R blockade, we expected the Bz-ATP treatment to produce a b-wave decrease and a d-wave increase. As expected, the b-wave amplitude was significantly decreased in a dose-dependent manner by the agonist treatment (P < 0.01 or less for the different groups), and the effect was abolished by a pretreatment with A438079 (Fig. 9A–9D). However, in only two cases did we obtain a d-wave increase: a small, insignificant increase was obtained with the lowest (100 µM) concentration of Bz-ATP (Fig. 9A and 9C). A greater (significant) increase was only obtained in the group of experiments in which the effect of 1 mM Bz-ATP was tested after pretreatment with 400 µM of the competitive antagonist A438079 (Fig. 9A). In the other cases, a significant decrease of the d-wave amplitude was found. The lowest concentration (100 µM) of Bz-ATP produced no effect on the a-wave amplitude. However, a short (3–4 min) increase of the a-wave amplitude was seen during treatment with 1 mM Bz-ATP (125 ± 16% of the pretreatment value at the third minute), which was followed by a gradual decrease (61.6 ± 14.59% of the pretreatment value at the 10th minute; Fig. 9D). Interestingly, in half of the experiments with the 1 mM Bz-ATP application, a dramatic decrease of the b- and d-wave amplitudes was observed after 20–25 min of agonist treatment, and eventually these waves were abolished (Fig. 9B and 9E). Such dramatic amplitude decrease might be produced by a strong depolarization of bipolar cells because of either a direct P2X7R-mediated effect on bipolar cells or a significant change in the extracellular environment, such as K+ or glutamate accumulation. A similar dramatic decrease of the b-wave amplitude was found by Hanitzsch (Reference Hanitzsch1981) in rabbit retinae after the application of a high dose (20 mM) of K+. We hypothesized that elevated extracellular K+ concentrations caused by impaired K+ clearance by Muller cells may underlie the effect of the high dose of the agonist. We carried out four experiments in which we tested the effect of 20 mM of K+ (substituting the same amount of Na+ in the Ringer solution) on the ERG waves and compared the effect of this testing to the effect of the continuous treatment with 1 mM Bz-ATP. The effect of the high concentration of K+ on the b- and d-wave amplitudes was very similar to the effect of 1 mM of Bz-ATP (Fig. 9: compare E to F).
Effects of different concentrations of Bz-ATP and 20 mM K+ on the ERG responses. For all responses, I = −6. (A) Relative changes in the b- and d-wave amplitudes (percent of the pretreatment values) during treatment with 100 µM (N = 6), 300 µM (N = 6) and 1 mM Bz-ATP (N = 8) as well as with 1 mM Bz-ATP after pretreatment with 400 µM A438079 (N = 5). The effect of isolated P2X7R blockade with 200 µM A438079 (N = 9) is also presented for comparison. The amplitudes were obtained at the 10th minute of the Bz-ATP treatment. The values obtained in the control experiments (Ringer solution throughout the experiments, N = 6) at the corresponding time are also shown. Mean values ± s.e.m. are represented. (B) Time course of the effect of 1 mM Bz-ATP on the b- and d-wave amplitude—an individual experiment. The moment of the Bz-ATP application is denoted by an arrow. (C) Effects of 100 µM Bz-ATP on the ERG waves—an original record. Left: a- and b-waves; right: d-wave. (D) Effects of 1 mM Bz-ATP on the ERG waves—an original record. Left: a- and b-waves; in the inset: a magnified view of the a-wave; right: d-wave. (E) Effects of 1 mM Bz-ATP on the ERG waves—an original record from an experiment with b- and d-wave abolishment. Left: a- and b-waves; right: d-wave. For each of the records, the minute of the treatment is denoted by a number. (F) Effects of 20 mM K+—an original record from a single experiment. Left: a- and b-waves; right: d-wave. Numbers—as in (E).

Discussion
To the best of our knowledge, our results, obtained by the selective blockade of P2X7Rs with 200 µM A438079, are the first to demonstrate the contribution of endogenous ATP through its P2X7 receptors to retinal light responses in lower vertebrates. The significant changes in the amplitudes of the ERG responses, observed during the P2X7R blockade, indicate that P2X7Rs are strongly involved in the modulatory effects of the endogenous ATP on these responses. This finding is at odds with the results of Chavda et al. (Reference Chavda, Luthert and Salt2016), who found that in mice, a selective blockade of P2X7Rs with the same antagonist, but in a concentration of 10 µM, had no effect on the ERG in normal conditions. Only in a pharmacologically modified medium could they obtain the antagonist’s effects, which were like those obtained with an agonist. The cause of this discrepancy might be the different concentration of the antagonist used by these authors or a species difference.
The decrease of the amplitude of photoreceptor components—the ERG a-wave and the pharmacologically isolated mass receptor potential obtained by us during the P2X7R blockade—indicates that endogenous ATP, through its P2X7Rs, exerts a stimulating influence on the photoreceptor response. Our results are consistent with those of Puthussery et al. (Reference Puthussery, Yee, Vingrys and Fletcher2006) and Chavda et al. (Reference Chavda, Luthert and Salt2016), showing a potentiation of the ERG photoreceptor response under the influence of the selective P2X7R agonist Bz-ATP.
The potentiating effect of the P2X7R-mediated influences on the photoreceptor response might be explained if we consider the sources of extracellular ATP, as well as the distribution of the P2X7Rs in the retina. The extracellular ATP, released by different cell types, can affect photoreceptor responses either directly, through P2X7Rs expressed in the photoreceptors themselves (Puthussery & Fletcher, Reference Puthussery and Fletcher2004; Puthussery et al., Reference Puthussery, Yee, Vingrys and Fletcher2006; Vessey & Fletcher, Reference Vessey and Fletcher2012; Vitanova & Kupenova, Reference Vitanova and Kupenova2014), or indirectly, through P2X7R-mediated influences on other cell types. There are several sources of extracellular ATP, which can exert direct P2X7R-mediated actions on photoreceptors. As already mentioned, data indicate that ATP may be coreleased with glutamate from photoreceptor cells or with GABA from horizontal cells (Puthussery & Fletcher, Reference Puthussery and Fletcher2004; Puthussery et al., Reference Puthussery, Yee, Vingrys and Fletcher2006; Vessey & Fletcher, Reference Vessey and Fletcher2012). Therefore, the P2X7Rs on the photoreceptor membrane may mediate feedback signals like autocrine or from the horizontal cells. They can also bind ATP released from non-neuronal sources such as the pigment epithelium and the glial (Müller) cells of the retina. Studying the effects of the selective P2X7R blocker A438079 on the mass receptor potential, isolated pharmacologically by the application of 20 mM Na aspartate, we tested the hypothesis of the P2X7R-mediated autocrine action of ATP on the photoreceptors. We argue that the results of these experiments do not prove but strongly support this hypothesis, based on the following: (1) It has been shown that, during Na aspartate treatment, the mass receptor potential (distal P III component) is isolated with no contributions from proximal retinal cell activity (Sillman et al., Reference Sillman, Ito and Tomita1969a ). If ATP is coreleased with glutamate, it would exert a P2X7R-mediated positive feedback enhancing the photoreceptor response. Conversely, a blockade of P2X7Rs would produce a photoreceptor response diminution. (2) During Na aspartate treatment, second-order neurons, including horizontal cells, are depolarized and do not produce light responses (Murakami et al., Reference Murakami, Ohtsu and Ohtsuka1972). Therefore, they do not release ATP in a light-dependent manner. However, they might be a source of continuous ATP release, sufficient to produce the long-term depolarization of photoreceptors. As far as the continuous photoreceptor depolarization has been shown to decrease the amplitude of the mass receptor potential (Sillman et al., Reference Sillman, Ito and Tomita1969b ), the effect of a blockade of P2X7R with A438079 is expected to enhance the mass receptor potential amplitude. (3) The pigment epithelial cells are also a source of ATP. It is released in the dark, which is expected to potentiate the photoreceptor response. However, the ATP concentration in the subretinal space was measured to be only 100–300 nM (Mitchell, Reference Mitchell2001), and this concentration is too low to stimulate P2X7Rs. Accordingly, the purinergic interaction between the pigment epithelial and photoreceptor cells may be mediated through other purinergic receptors (P2Y2, P2X2, or adenosine receptors after the ATP hydrolysis by ecto-ATPases) (Mitchell, Reference Mitchell2001; Mitchell & Reigada, Reference Mitchell and Reigada2008). Similarly, other types of purinergic receptors (P2Y and P1) in the apical membrane of Müller cells have been shown to trigger Ca2+ waves in these cells (Li et al., Reference Li, Holtzclaw and Russell2001). The selective P2X7R blockade is not expected to affect this signaling. (4) Müller cells are shown to release ATP in the inner retina when the retina is stimulated by light (Newman, Reference Newman2004a ). It is, however, rapidly converted to adenosine by the ecto-ATPases, and it is the adenosine that effects ATP release. Taking into consideration the above-mentioned putative effects of the endogenous ATP from different sources during the treatment of the retina with Na aspartate, we can clearly state that the decrease of the mass receptor potential amplitude under the influence of A438079, obtained in our experiments, supports the hypothesis of P2X7R-mediated autocrine action of ATP on photoreceptors.
It is now widely accepted that the ERG main postreceptoral components, the b- and d-waves, represent the activity of ON and OFF bipolar cells (BCs), respectively (Yanagida et al., Reference Yanagida, Koshimizu, Kawasaki and Yonemura1986; Stockton & Slaughter, Reference Stockton and Slaughter1989; Gurevich & Slaughter, Reference Gurevich and Slaughter1993; Xu & Karwoski, Reference Xu and Karwoski1994, Reference Xu and Karwoski1995; Karwoski et al., Reference Karwoski, Xu and Yu1996), with some small contribution of proximal retinal neurons (Dong & Hare, Reference Dong and Hare2000; Awatramani et al., Reference Awatramani, Wang and Slaughter2001; Bui & Fortune, Reference Bui and Fortune2004; Ueno et al., Reference Ueno, Kondo, Ueno, Miyata, Terasaki and Miyake2006; Popova & Kupenova, Reference Popova and Kupenova2009). Wheeler-Schilling et al. (Reference Wheeler-Schilling, Marquordt, Kohler, Jabs and Guenther2000) demonstrated that, in rats, BCs do not express P2X7Rs. The results of immunocytochemical investigations showed that, even in the cases when the colocalization of the immunostaining for P2X7R subunits and bipolar cell terminals was found (rat: Puthussery & Fletcher, Reference Puthussery and Fletcher2004; mouse: Vessey & Fletcher, Reference Vessey and Fletcher2012), the exact site of the receptors was not at the bipolar cell membrane, but the membranes of cells that are postsynaptic and in close association with bipolar cell ribbon synapses or at conventional synapses of amacrine cells. These may provide synaptic input to BCs (some of these being GABAergic). That is why the changes in bipolar cell responses may be explained with increased photoreceptor input or changed activity of interneurons rather than with direct P2X7R-mediated effects on BCs.
In our experiments, for most conditions studied, a parallel was found between the effects of the P2X7R blockade on the ERG photoreceptor (a-wave) and postreceptoral ON and OFF components (b- and d-waves). The amplitudes of all these waves were decreased in the pure rod-driven and pure cone-driven responses indicating that the P2X7R-mediated influences are mostly stimulatory for both receptoral and postreceptoral responses. However, in the mixed rod- and cone-driven responses, the P2X7R blockade produced an increase instead of decrease of the b-wave amplitude, indicating an inhibitory P2X7R-mediated influence on the ERG ON response. This result might be explained by asymmetric influences from interneurons involved with controlling the transmission in either retinal channel (ON and OFF). Another possible explanation is that this effect may result from a modulation of rod-cone signal interaction at a postreceptoral level because no such effect was seen in the photoreceptor response. The first postreceptoral site, where rod and cone signals converge in the amphibian retina, consists of bipolar and horizontal cells, which have both rod and cone input (Dowling & Werblin, Reference Dowling and Werblin1969; Lasansky, Reference Lasansky1973; Fain, Reference Fain1975). At this level, ON and OFF channels are formed, because of the different glutamate receptors, expressed by ON and OFF BCs. Light stimulation produces a membrane conductance increase in ON BCs and a conductance decrease in OFF BCs and horizontal cells. Because of the shunting effect of ion channel opening, mutual inhibition is seen between rod and cone signals in ON BCs during illumination. The opposite is true for the OFF BCs (Falk, Reference Falk1988). This mechanism for the direct interaction of rod and cone signals at the bipolar cell level may well account for the opposite effects of ATP, mediated by P2X7Rs, on the ERG b- and d-waves, demonstrated in our experiments regarding responses to mesopic stimuli. The increased glutamate release by photoreceptors may increase the shunting effect in ON bipolar cells or its removal in OFF bipolar cells. In this intensity range, rod signals may affect cone signals to a greater degree, because the strong rod stimulation is combined with weak or moderate cone stimulation. Other mechanisms of rod-cone interaction may also be involved that are targeted by the P2X7R-mediated modulation. It has been demonstrated that the suppression of cone signals by rod signals may involve chemical transmission (Dong et al., Reference Dong, Qian, McReynolds, Yang and Liu1988) and that, in amphibia, rods may inhibit cones through horizontal cell-mediated feedback (Attwell et al., Reference Attwell, Werblin, Wilson and Wu1983).
The inner retinal interneurons, the amacrine cells, not only contribute to the b- and d-wave amplitudes (Dong & Hare, Reference Dong and Hare2002; Hanitzsch et al., Reference Hanitzsch, Küppers and Flade2004), but they are also thought to be responsible for the generation of b- and d-wave OPs (review: Wachtmeister, Reference Wachtmeister, Kolb and Wu2001). In our experiments, the oscillatory potential amplitude was strongly diminished during the P2X7R blockade, independent of the way the b-wave amplitude was changed-increased or decreased. This result is not consistent with the results of other authors, showing that the amplitude of the OPs was decreased after treatment with the P2X7R agonist Bz-ATP (Puthussery et al., Reference Puthussery, Yee, Vingrys and Fletcher2006; Chavda et al., Reference Chavda, Luthert and Salt2016) and increased (for some of the OPs) in P2X7-KO mice (Vessey & Fletcher, Reference Vessey and Fletcher2012). Whatever the reason for this discrepancy, it is evident that the P2X7R-mediated influences have significant contribution to b- and d-wave OPs.
An important observation in our study is that P2X7R-mediated effects show significant ON/OFF asymmetry. The blockade of these effects always produced a significant diminution of the amplitude of the OFF response, while the amplitude of the ON response was either less diminished (in the rod-driven and the light-adapted cone-driven responses) or increased (in the mixed, rod-, and cone-driven responses). The b-/d-wave amplitude ratio was increased. These results indicate that the potentiation of the OFF response is an important function of the P2X7R-mediated effects of the endogenous ATP.
Our results concerning ERG postreceptoral responses are not easily compared to other authors’ (Puthussery et al., Reference Puthussery, Yee, Vingrys and Fletcher2006; Vessey & Fletcher, Reference Vessey and Fletcher2012; Chavda et al., Reference Chavda, Luthert and Salt2016) because flash ERG was recorded in their experiments with no separation of ON and OFF components. We used long-duration light stimuli to separate ON and OFF signals. As shown above, in some stimulation conditions, opposite effects were found on the two types of responses. Moreover, while we used a selective P2X7R antagonist to reveal the effects of the endogenous ATP, most other authors’ results were obtained using the P2X7R agonist Bz-ATP. The latter is, however, also effective in stimulating P2X1 and P2X3 receptors (Bianchi et al., Reference Bianchi, Lynch, Touma, Niforatos, Burgard, Alexander, Park, Yu, Metzger, Kowaluk, Jarvis and Van Biesen1999). Moreover, if used for a long time or repeatedly in a high concentration, it can produce a pathologic response because of P2X7R-induced pore formation. Puthussery et al. (Reference Puthussery, Yee, Vingrys and Fletcher2006) and Chavda et al. (Reference Chavda, Luthert and Salt2016) found opposite effects of the P2X7R agonist Bz-ATP on the a- and b-wave amplitude: the a-wave amplitude was increased, and the b-wave amplitude, decreased. A b-wave amplitude increase with no change in the a-wave was found in P2X7R–KO mice by Vessey and Fletcher (Reference Vessey and Fletcher2012). Our results, obtained with the selective antagonist A438079, are consistent with the results of these authors only in the dark-adapted responses to mesopic stimuli. In most stimulation conditions, however, we found a parallel between the a- and b-wave amplitude changes during a P2X7R blockade.
Our results obtained with the P2X7R agonist Bz-ATP were concentration-dependent. When applied in a concentration of 100 µM, the agonist produced small effects, opposite those of the antagonist. Namely, it decreased the b-wave amplitude and slightly (nonsignificantly) increased the d-wave amplitude. However, when applied in a higher concentration, it produced a decrease in both the b- and d-wave amplitude. Only a short potentiation of the a-wave was observable using 1 mM Bz-ATP. An interesting finding was that a prolonged treatment with the highest concentration (1 mM) of Bz-ATP produced a strong inhibition of ERG responses, and in half of the experiments with prolonged treatment, the postreceptoral components (the b- and d-wave) were completely abolished. Undoubtedly, the latter effect is a sign of acute retinal pathology. Similar changes were documented by Vessey et al. (Reference Vessey, Greferath, Aplin, Jobling, Phipps, Ho, De Iongh and Fletcher2014) in rat ERG 1 day after treatment with 50 mM ATP as well as by Aplin et al. (Reference Aplin, Luu, Vessey, Guymer, Shepherd and Fletcher2014) in cat ERG 3 weeks after treatment with 55 mM ATP, the latter treatments being used as a model of retinal degeneration. If consider that P2X7Rs are 10 to 30 times more sensitive to Bz-ATP compared to ATP (Donnelly-Roberts et al., Reference Donnelly-Roberts, Namovic, Han and Jarvis2009; Yan et al., Reference Yan, Khadra, Li, Tomić, Sherman and Stojilkovic2010), 1 mM of Bz-ATP is expected to have an effect like that obtained with 50 mM ATP. In our experiments, acute pathologic effects were demonstrated within an hour, which cannot be due to structural changes but can be produced by a strong depolarization of BCs. As far as the P2X7Rs are nonselective cationic channels, their activation can produce strong depolarization. However, P2X7Rs are not found in BCs. That is why we supposed the early pathologic changes may be due to an impairment of extracellular fluid homeostasis resulting from acute Müller glial cell dysfunction. As shown in our previous study (Vitanova & Kupenova, Reference Vitanova and Kupenova2014), P2X7Rs are abundant in frog Müller cells. The strong stimulation of Müller cell P2X7Rs by a high dose of agonist was found to result in membrane depolarization and increased Ca2+ i (Pannicke et al., Reference Pannicke, Fischer, Biedermann, Schädlich, Grosche, Faude, Wiedemann, Allgaier, Illes, Burnstock and Reichenbach2000). Pore formation was not found by these authors, but it was demonstrated by Wakx et al. (Reference Wakx, Dutot, Massicot, Mascarelli, Limb and Rat2016). The strong depolarization of Müller cells is supposed to affect their ability to regulate extracellular fluid homeostasis, including K+ and neurotransmitter concentration. In our experiments, a striking similarity was found between the effects of 1 mM Bz-ATP and 20 mM K+, which does not prove but supports the idea that impaired K+ homeostasis is among the first pathophysiological mechanisms underlying the action of abnormal ATP.
Conclusion
The results of our study show that, in the frog retina, the endogenous ATP, through its P2X7 receptors, contributes significantly to the ERG responses. The relative amplitude changes in the ERG waves depend on stimulus intensity, the state of adaptation, and photoreceptor input. The dark-adapted responses to low-intensity stimuli are affected to the greatest extent. Photoreceptor responses are always potentiated. Indirectly, our results support the hypothesis that this potentiation might be partially due to a P2X7R-mediated autocrine action of ATP on the photoreceptors. The P2X7R-mediated effects on the postreceptoral ON and OFF responses (the b- and d-waves) show ON/OFF asymmetry that favors the OFF responses. The two postreceptoral responses are changed in a similar manner (potentiated) when a single photoreceptor type is stimulated. However, in the mixed, rod-, and cone-driven responses to mesopic stimuli, the ON response amplitude is diminished, while the OFF-response amplitude is increased. The P2X7R-mediated modulation of proximal retinal activity contributes to the generation of the b- and d-wave OPs. The overstimulation of P2X7 receptors with a high concentration of agonist strongly diminishes and can even abolish the ERG postreceptoral responses. This effect is similar to the effect of a high concentration of extracellular K+, which supports the hypothesis that the acute pathological response produced by the P2X7R overstimulation may be due to the impaired function of the Müller glial cells and their K+ buffering capacity.
Acknowledgments
This work was supported by Grant No. 8/2014 from the Council for Medical Science, Medical University of Sofia. The contribution of the individual authors is as follows: P. Kupenova participated in planning of the project, performing the experiments, data analysis, discussion and preparation of the manuscript; E. Popova participated in performing the experiments, discussion of the experimental data and the manuscript; L. Vitanova participated in planning of the study, discussion of the experimental results and the manuscript.