Introduction
A recent study (NégaWatt, 2016) showed that global energy consumption should be halved for European countries to meet 2050 ambitious objective of 75%–90% reduction of greenhouse gas emissions. Energy saving is thus a major component of the effort that should be carried on for our future, along with the development of renewable energies.
Considering more precisely the residential sector, space heating (SH) and domestic hot water (DHW) production represent a significant part of the total energy consumption, depending on the country and the geographical location. For example, heating, air conditioning, and hot water production represent up to 65% and 77% of the total residential energy consumption in the US (source: EIAFootnote 1) and in France (source: CERENFootnote 2), respectively, with 17.7% and 10% devoted to water heating.
To tackle this challenge, the two promising approaches currently in use are the promotion of energy sobriety and the energy efficiency enhancement through multiple ways as a device performance enhancement and demand side management. Based on previously published forecast algorithm (see Lomet et al., Reference Lomet, Suard and Chèze2015), the present study investigates the benefits that can be drawn from machine learning methods applied to energy consumption forecast to enhance the DHW production efficiency. In particular, it analyses the adequacy between systems and provided the forecast, with a specific focus on determining which context forecasting can yield more energy savings and how much.
Forecasting domestic energy consumption using machine learning techniques has been extensively studied and summarized in some reviews comparing the different data approaches (Swanet al., Reference Swan, Ugursal and Beausoleil-Morrison2011; Suganthi and Samuel, Reference Suganthi and Samuel2012; Deb et al., Reference Deb, Zhang, Yang, Lee and Shah2017). Considering the DHW forecast based on real data, Aydinalp et al. (Reference Aydinalp, Ismet Ugursal and Fung2004), Eynard et al. (Reference Eynard, Grieu and Polit2012), and Gelažanskas and Gamage (Reference Gelažanskas and Gamage2015) have proposed to use neural networks. Grey-box modeling approaches have been also investigated by Bacher et al. (Reference Bacher, Madsen, Nielsen and Perers2013) and Nielsen and Madsen (Reference Nielsen and Madsen2006), whereas non-homogenous Markov chains have been proposed by Sandels et al. (Reference Sandels, Widén and Nordström2014). Yet these approaches are time consuming and might not be appropriate for embedding into individual water heating systems.
Other methods based on lighter algorithms such as moving average have been proposed by Prud homme and Gillet (Reference Prud homme and Gillet2001). However, this approach has been shown to be less responsive to demand variation compared to our algorithm (Lomet et al., Reference Lomet, Suard and Chèze2015). A time series model such as ARMA has been proposed by Popescu and Serban (Reference Popescu and Serban2008) but they focus on a bloc of 60 flats, which is more appropriate for district heating systems. This paper presents a method that uses ARIMA approach but focuses on individual dwellings which are more fluctuating than groups of residences. Moreover no assumption is done about the type of dwelling or characteristics and the number of dwellers that are considered.
Applications of the DHW forecast to optimize the production have been presented in multiple studies (Eynard et al., Reference Eynard, Grieu and Polit2012; Halvgaard et al., Reference Halvgaard, Bacher, Perers, Andersen, Furbo, Jørgensen, Poulsen and Madsen2012; Sossan et al., Reference Sossan, Kosek, Martinenas, Marinelli and Bindner2013). Although their results are encouraging, their models either assume the same deterministic profile for consumption and forecast (i.e. forecast are assumed perfect) or they focus on Economic Model Predictive Control (EMPC) (using the time-dependent real price of electricity to save money, rather than focusing on saving energy) or also focus on district level rather than individual level.
Our approach consists in designing a lightweight algorithm that could be implemented in individual water heating devices to reduce the energy consumption. Forecasting DHW consumption allows heating only the required amount of water at the right time (just before water tapping), avoiding significant energy waste due to thermal losses that can be observed in a domestic boiler. It also enables a better dimensioning, reducing the device's cost. The advantage of using such algorithm is that it is cheap to implement once developed compared with high efficiency materials, tank and heat production systems in which production cost tends to increase along with the efficiency gain they provide.
Details and performance of the forecast algorithm have been previously published (Lomet et al., Reference Lomet, Suard and Chèze2015). The aim of this current paper is rather focused on application and performance evaluation in realistic conditions. Two objectives are covered:
• Defining a methodology to compare traditional (reactive) heating systems with consumption forecast controlled ones (anticipative systems),
• Evaluate the benefits that can be drawn using consumption forecast and to which extent depending on heating system characteristics.
Forecasting DHW consumption is only a part of our solution to the challenge of reducing energy consumption. In this paper, we analyze to which extent the use of consumption forecast can enable saving energy. In particular, the influence of the type of DHW production system used is evaluated as well as some main parameters such as the insulation of the water tank. To achieve this, we use the TRNSYSFootnote 3 simulation software to model the different systems in combination with our forecast algorithm. Simulations and forecast computations are based on real measurements coming from several dwellings. Then the difference in heating systems performance is evaluated by comparing simulation results. Three different system configurations are tested, with a wide range of complexity and efficiency to evaluate precisely the benefits of this approach depending on the technology used.
This report starts with the description of the methodology. The heating systems are first explained. Then a brief description of the measurements used as input to our model and to the simulator is provided. The next part details the TRNSYS simulation setups. A description of the building stages of the forecast algorithm is then explained. Results from the forecast algorithm and simulations are provided in section “Results and discussions”, along with a detailed analysis, explanations, and interpretations. A synthesis of the most relevant conclusions is provided at the end of the paper.
Experimental procedure
To evaluate the benefits that can be drawn from using energy needs forecast in water heating systems, TRNSYS simulations are run considering different systems over 1 year based on real consumption measurements from different dwellings. Each experimental case is simulated with and without the forecast. This approach allows to determine the benefits of forecasting depending on the type of system considered while ensuring that the result does not depend on the load profile used as simulation input.
The same kind of experimental procedure has already been reported in literature using TRNSYS for comparing the performance of different systems producing DHW (Jordan and Vajen, Reference Jordan and Vajen2001; Spur et al., Reference Spur, Fiala, Nevrala and Probert2006; Biaou and Bernier, Reference Biaou and Bernier2008; Eslami-nejad and Bernier, Reference Eslami-nejad and Bernier2009; Xi et al., Reference Xi, Lin and Hongxing2011; Sterling and Collins, Reference Sterling and Collins2012). In their study, Spur et al. (Reference Spur, Fiala, Nevrala and Probert2006) emphasized that realistic load profiles should be used in order to properly evaluate overall DHW production system performance.
Considered systems
Three different systems are considered for this study spawning a large range of complexity:
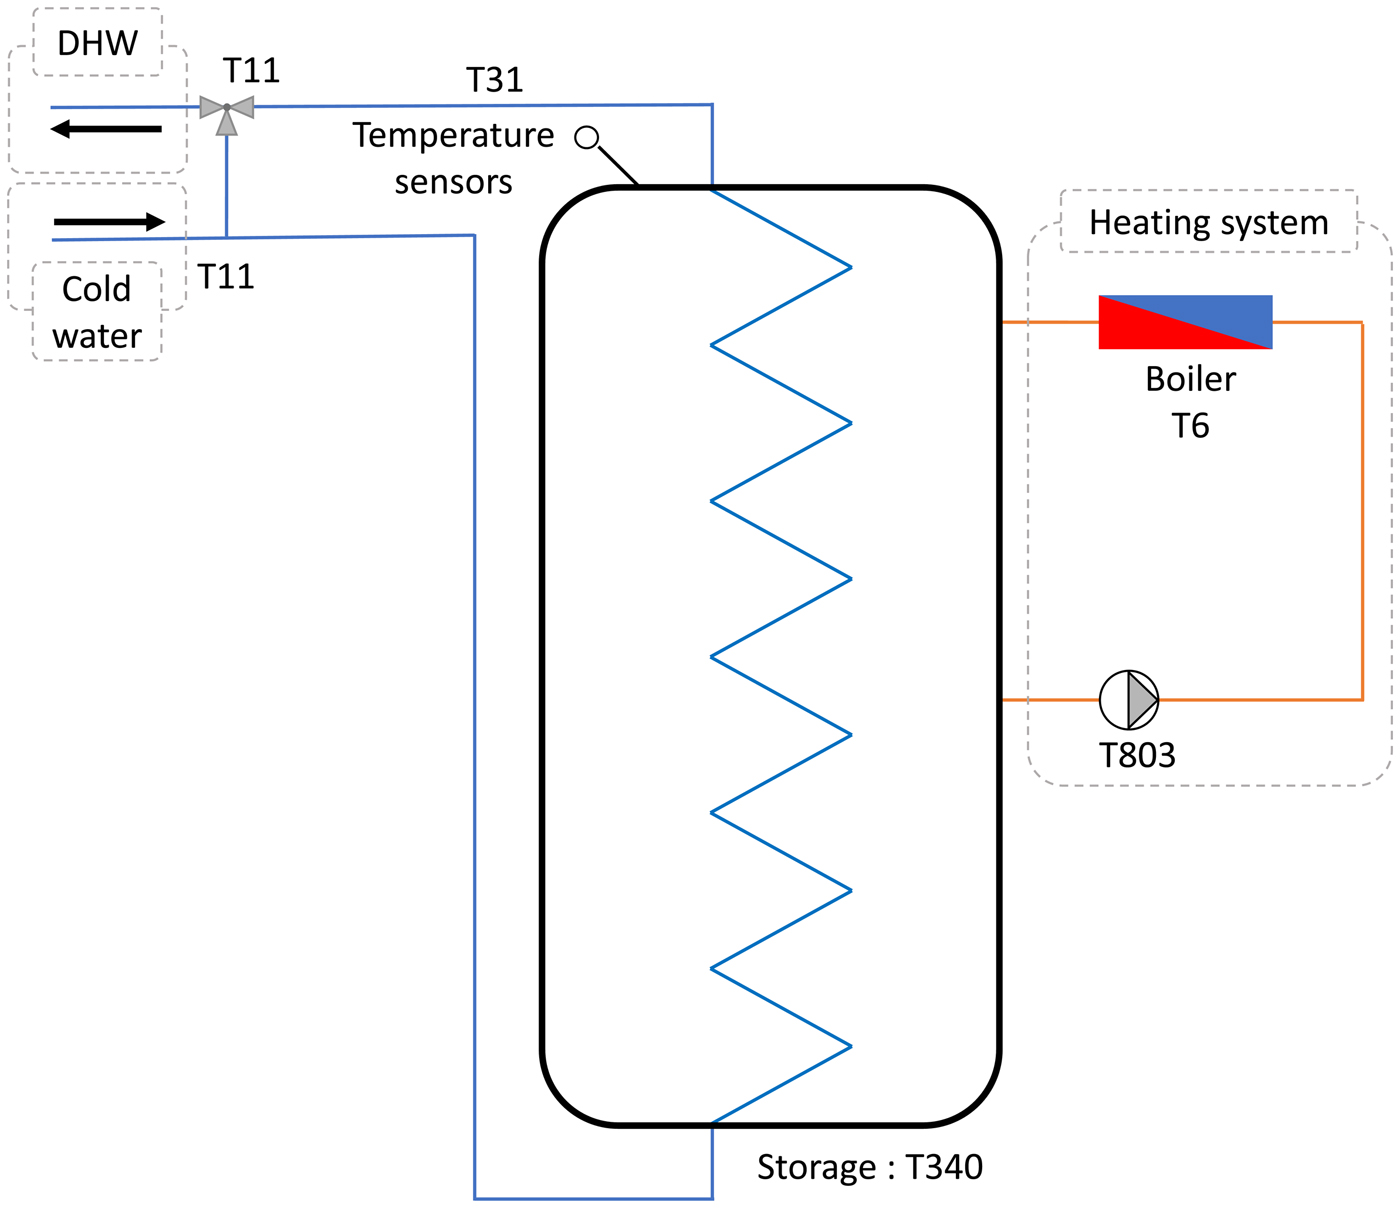
• Configuration 1 consists of a 763 L stratified water tank connected to an electric (resistive) heating system (see Fig. 2).
• Configuration 2 uses the same water tank powered by a heat pump (HP)
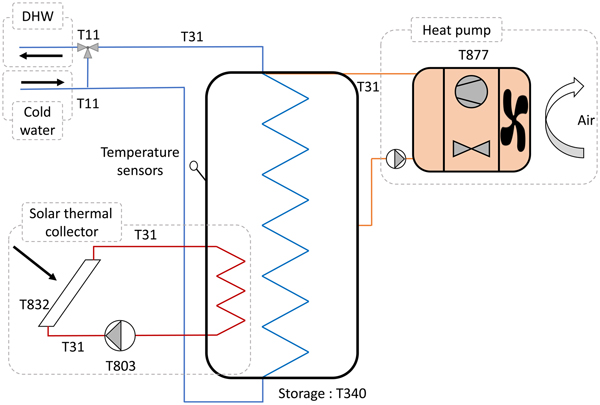
• Configuration 3 is identical to configuration 2 with an additional solar thermal collector (STC) as an auxiliary power source (see Fig. 1).
Note that in Figures 1 and 2, Ti refers to the component of type i used in TRNSYS software.
Heat production system with solar thermal collector and heat pump.

Heat production system with electrical resistance.

Description of real consumption measurement data sets
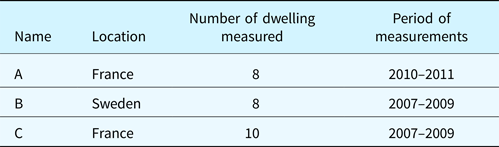
A total of 26 data sets are used to perform forecast and simulation. These real data are issued from three different locations in France and Sweden and have been gathered during the CombiSol EuropeanFootnote 4 and French SCHEFFFootnote 5 projects. The use of measurement coming from distant location ensures that the model accuracy does not depend much on the location of the dweller (and thus on their habit). These data sets will be denoted as A, B, and C, respectively, and are presented in Table 1. Each data set measures the hot water needs in liters for a real domestic dwelling. DHW consumption measurements have been performed every 6 min. Missing values generally concern <5% of the data. Linear interpolation has been performed if the time window of missing data is shorter than 3 h to complete the time series. Otherwise, the time window is not considered for the analysis.
List of measured dwelling grouped by project

Description of the simulation setup
All the three TRNSYS setups are derived from the core simulation setup developed for MacSheep European project provided by Chèze et al. (Reference Chèze, Bales, Betak, Broum, Heier, Heinz and Poppi2015). This setup is the most complete and energetically efficient one. The heating system comprises an HP connected to a vertical borehole heat exchanger as well as an STC. These devices are connected to a stratified water tank through double ports or heat exchangers from which hot water is drawn for domestic use.
Since STC can provide a large part of the required DHW in summer almost for free (only a pump to flow water through the collector is required), limited energy savings are expected in this configuration. However, this kind of system is not extensively used today. Thus, a second system has been designed without STC. Except the STC, this setup is perfectly equivalent to the first one. Since these two systems are not representative of what can be found as DHW heating systems, a third system has been simulated consisting of the same water tank connected to an electric boiler. The electric heater is simulated thanks to type 6 unit of TRNSYS with a maximum heating rate of 8000 kJ/h and a perfect efficiency. Although this efficiency is not relevant, it does not call into question conclusions since they will be based on relative savings considering the same system parameters with and without the forecast.
There are two different control strategies according to whether or not forecast is taken into account, that is, reactive and anticipative. Without forecasting, the control strategy is a traditional one, in other words the water is heated at the set point temperature (50°C in this case, as recommended by the European and US institutions) all the time. This is achieved using a thermostat with a hysteresis of ±2°C.
In the case where we account for the forecast, the available energy in the tank at time t is compared with the forecast quantity of energy that will be consumed during the next coming hour. If sufficient energy is stored, the heating system remains off or is switched on otherwise. A hysteresis controller is also added in this case with a dead band of at least the equivalent of 10 L of hot water or 10% of the required energy for the next hour.
Description of the forecast algorithm
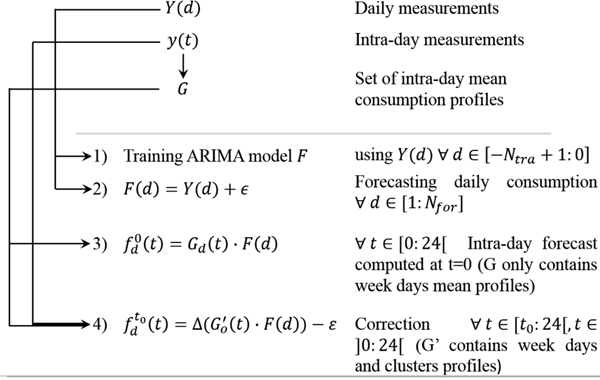
The detail of the algorithm can be found in Lomet et al. (Reference Lomet, Suard and Chèze2015). However, we briefly describe it here for convenience. The procedure is broken down into four steps that are illustrated in Figure 3 where Y(d) and F(d) are the measured and forecast daily consumption, respectively, y(t) and f(t) are the measured and forecast intra-day consumption profiles, respectively. d is the day index and t is the time index within a day (in hours), G is the pool of mean intra-day consumption profiles, N tra and N for are the number of days used for training and forecasting time series, respectively.
Algorithm scheme.

ARIMA modeling of daily consumption
To forecast DHW consumption, the algorithm only needs the record of the 3 last months of consumption ( $Y_{\rm d}{\rm \;} \forall \; d\in {\rm \;} \lsqb {-N_{{\rm tra}} + 1:0} \rsqb $ in Fig. 3). The input for the self-learning process is thus a discrete time series of consumption in liters. The total consumption per day is modeled using an ARIMA function (Box et al., Reference Box, Jenkins and Reinsel2013). A training window of N tra = 84 days is used to estimate the values of coefficients during the learning stage. This is the step 1 in Figure 3. Forecast is performed over a period of 1 year that follows the training window. The formula is shown in Eqs (1) and (2).
 $$X_{\rm t} = \mathop \sum \limits_i {\rm \varphi} _i{\rm X}_{{\rm t}-i} + \mathop \sum \limits_i \theta _i\varepsilon _{{\rm t}-i} + \varepsilon _{\rm t}\comma \,$$
 $$\forall \; t\in {\rm \;\ {\opf Z} }\comma \,{\rm \;} {\rm X}_{\rm t} = \nabla ^{\rm d}Y_{\rm t}\comma \,$$
where Y t is the forecast, the parameters φi and θ i are the linear coefficients, ε t is the white noise, i ∈ {1, 2, 7}, and d is the degree of differencing. This auto regressive part is formed by a linear combination of the consumption of the two preceding days and the same day of the previous week (denoted by i ∈ {1, 2, 7}). The moving average part is also based on the error made on these days. This form of the model is fixed for all dwellings. This allows faster computation for model training, which is a great asset for embedding into the water tank. This form has been chosen so that it fits best the 26 dwellings. However, the differentiation degree is calculated independently for each dwelling in order to build the model on a stationary time series. This is the second step in Figure 3.
Intra-day consumption modeling
After forecasting the daily consumption, intra-day cumulative consumption is forecast. The method consists in building a set of normalized and representative daily load curves. Then the cumulative consumption within each day is assumed to conform to the most appropriate load curve picked from the curve set. For each day, the final forecast is obtained by scaling the normalized curve with the ARIMA forecast.
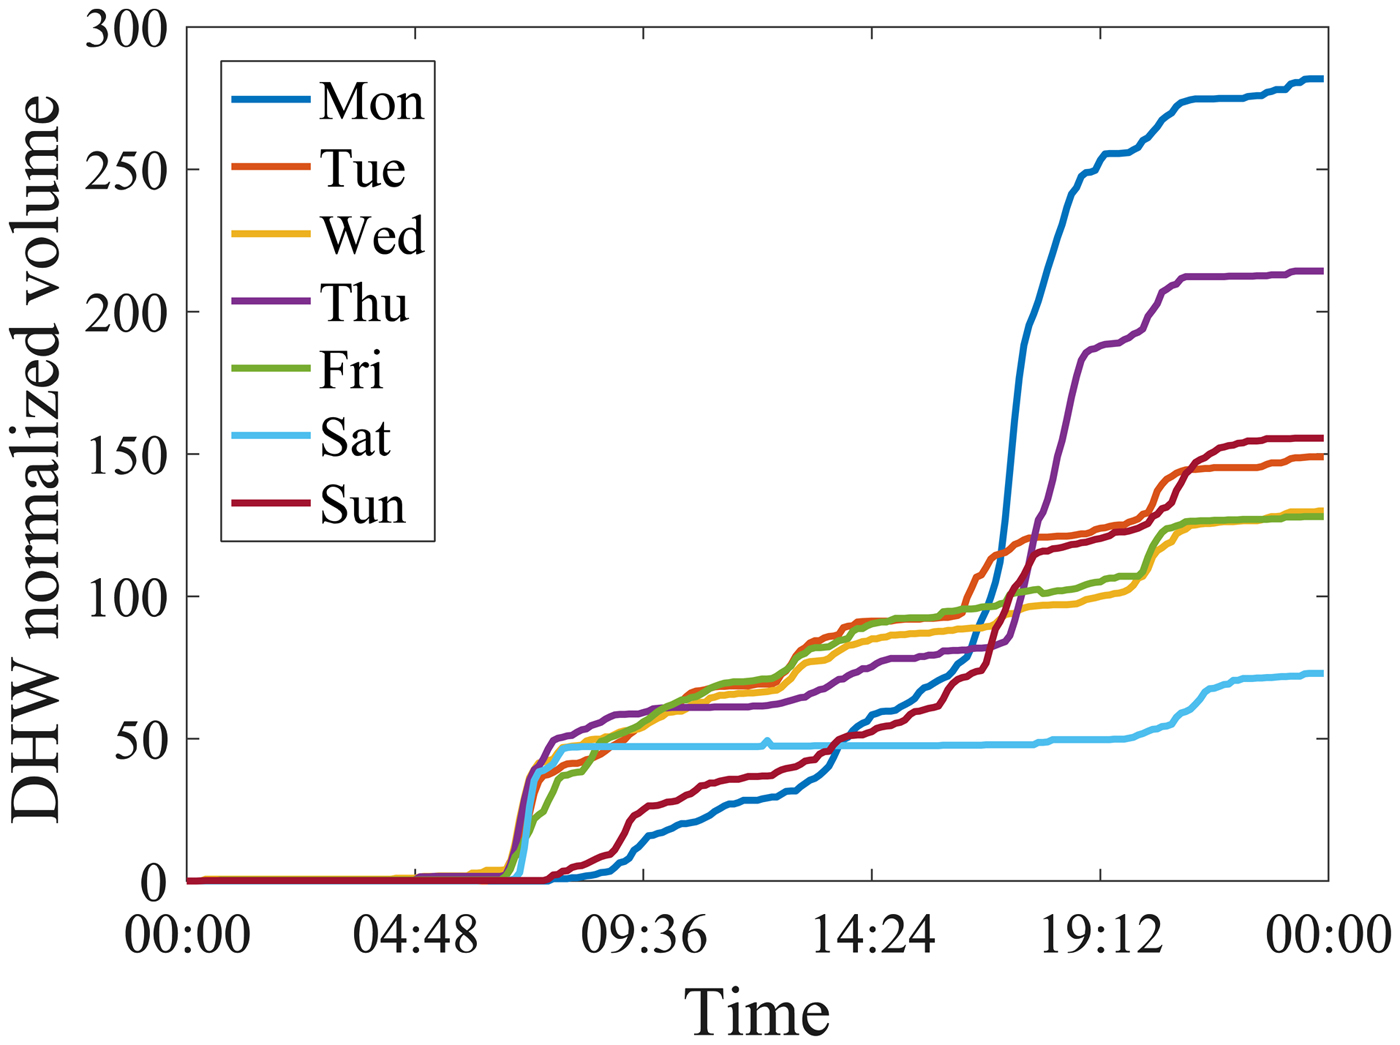
A first set of curves is built based on the day of the week. That is, each and every load curve of the same day of the week measured during the training test is gathered. The representative curve is then obtained by computing the average of the curves. This is the third step in Figure 3. As an example, intra-day profiles for dwelling A1 are plotted in Figure 4.
Intra-day DHW consumption profile of dwelling A1 for each day of the week.

Each average curve is then modeled using a sum of sigmoid functions. It enables having smoother profiles and requires less memory for embedding. Combining ARIMA forecast with the corresponding week day average cumulative consumption yields a first continuous forecast for the entire year. This is the fourth step in Figure 3.
On line correction of the forecast every hour
In order to have a better forecast accuracy, the profile is corrected every hour, at time t, based on the observed real consumption of the day. The correction consists first in checking if a better load profile can be found considering the load curve measured since the beginning of the day.
The most adequate load profile is found among an extended set of curves, built using the previous set of curves (average week day load profiles) and a set of average curves of load profile clusters. Clusters of profiles are estimated using the Silhouette approach (Rousseeuw, Reference Rousseeuw1987) that groups together the curves which are the most similar to each other. This method is applied to all the intra-day cumulative consumptions. A flat curve is added to the extended set of curves corresponding to the days with no DHW consumption. This is a particular case that should be accounted for since it is not unlikely (e.g. during the holiday) nor frequent but accounting for it properly can enable large savings.
At each correction step, the best load profile is found as the highest scalar product between the measured load curve and each curve of the set. A scalar product has been preferred to other metrics since it yields better results when building profile clusters. To get the forecast cumulative consumption for the rest of the day, this curve is scaled to match the current consumption (at time t) and the cumulative consumption forecast by ARIMA at the end of the day. As time passes, ARIMA weights less on the scaling of the curve. Indeed, when the time reaches closer to the end of the day, the actual consumption becomes more relevant as the daily consumption forecast than the ARIMA forecast. This time-dependent weight is implemented by linearly weighting ARIMA forecast. The weight equals 1 and 0 at the beginning and the end of the day, respectively. This is the fourth step in Figure 3.
Performance comparison protocol
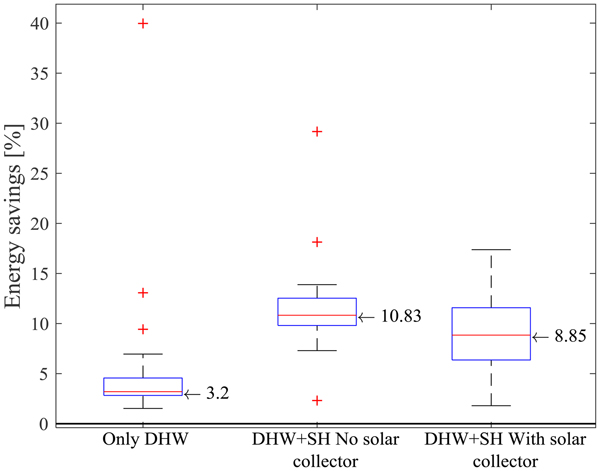
To compare the performance yield by each experiment, the energy savings after 1 year of consumption are calculated. Energy savings are the difference of the electrical energy consumed by the system that accounts for the forecast (anticipative system) and the one that does not (reactive system, which is considered as the baseline). Further results (Figs. 5, 6, 10 and 11) are shown in relative scale. These relative energy savings are computed using the formula shown in Eq. (3), where E s is the energy saved, E r and E a are the energy consumed by reactive and anticipative systems, respectively.
 $$E_{\rm s} = \displaystyle{{E_{\rm r}-E_{\rm a}} \over {E_{\rm r}}}100.$$
Relative energy savings using the perfect forecast on the 26 dwellings depending on the considered system.

In order to have a relevant comparison between experiments, the discomfort due to missing hot water should be taken into account. To do so, energetic penalties are added to the total electrical energy consumption of the system whenever hot water is missing, according to the standard penalty function calculation given by the IEA (Haller et al., Reference Haller, Dott, Ruschenburg, Ochs and Bony2013). The penalty is calculated as the missing energy multiplied by a yield factor of 1.5. The equation is recalled here for convenience:
 $$E_{{\rm pen}} = 1.5 \times E_{{\rm miss}}\comma \,$$
where E pen is the penalty energy and E miss is the total energy that had not been delivered due to missing hot water in the tank. This penalty function can be considered as the extra energy that would be consumed by a hypothetical auxiliary system to compensate for the missing heat.
Sterling and Collins (Reference Sterling and Collins2012) emphasized the need for a relevant basis to enable proper comparison between systems. The use of the penalty function to ensure that point has been reported by Chèze et al. (Reference Chèze, Bales, Betak, Broum, Heier, Heinz and Poppi2015) and Chèze et al. (Reference Chèze, Bales, Betak, Broum, Heier, Heinz and Poppi2015).
Results and discussions
Energy savings
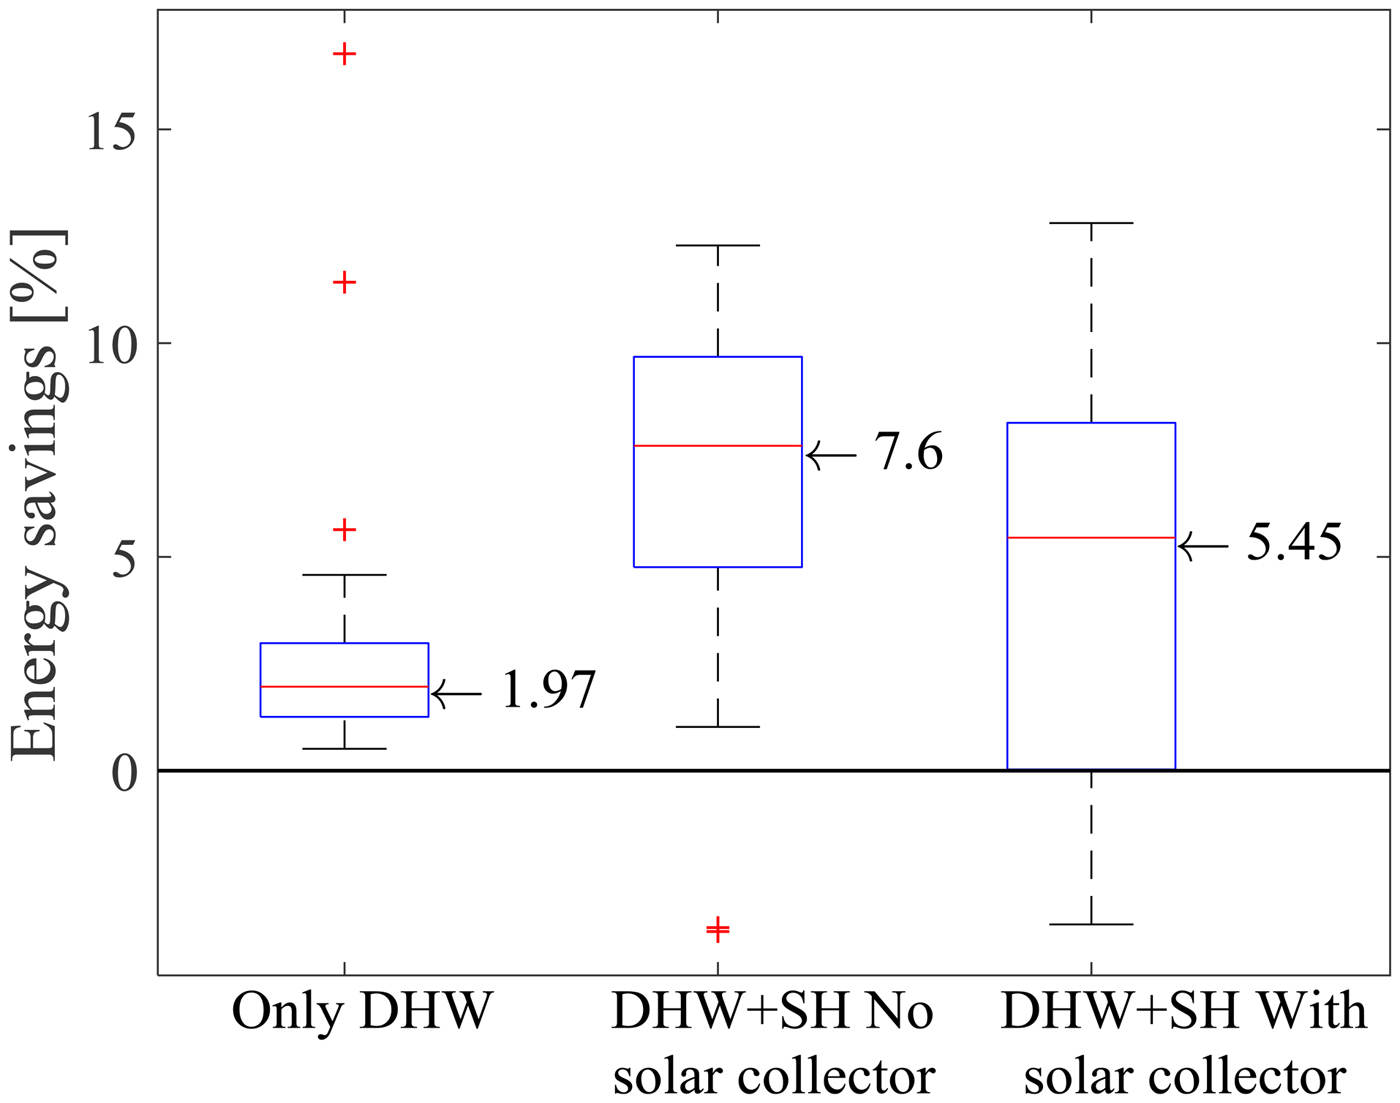
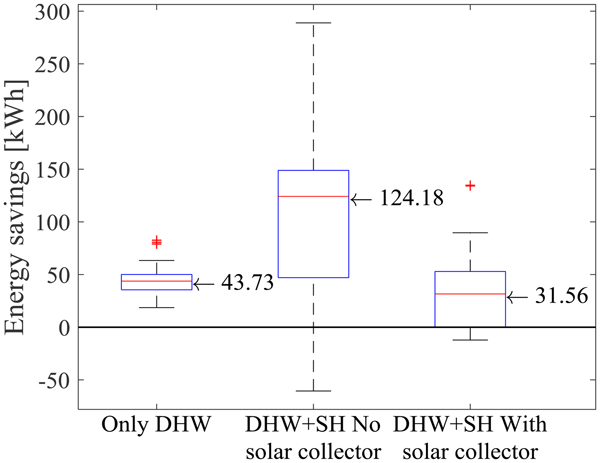
Energy savings made using forecasts are shown in Figures 5–7 using the perfect forecast and the ARIMA forecast obtained with our algorithm, respectively. Perfect forecasts are used here to show the upper limit in terms of energy savings, no matter how precise the forecast is. It is not an absolute upper limit since it does not address the issue of forecast and system control interfacing. For each system configuration, all the 26 profiles have been used to simulate savings. Overall savings are comprised between −3.6% and 17.4% of the total energy consumed. These figures show that the overall saving amount depends on the system but also on the dwelling (and thus the dwellers’ habits) since boxes spread is not negligible.
Relative energy savings using ARIMA forecast on the 26 dwellings depending on the considered system.

Absolute energy savings using ARIMA forecast on the 26 dwellings depending on the considered system.

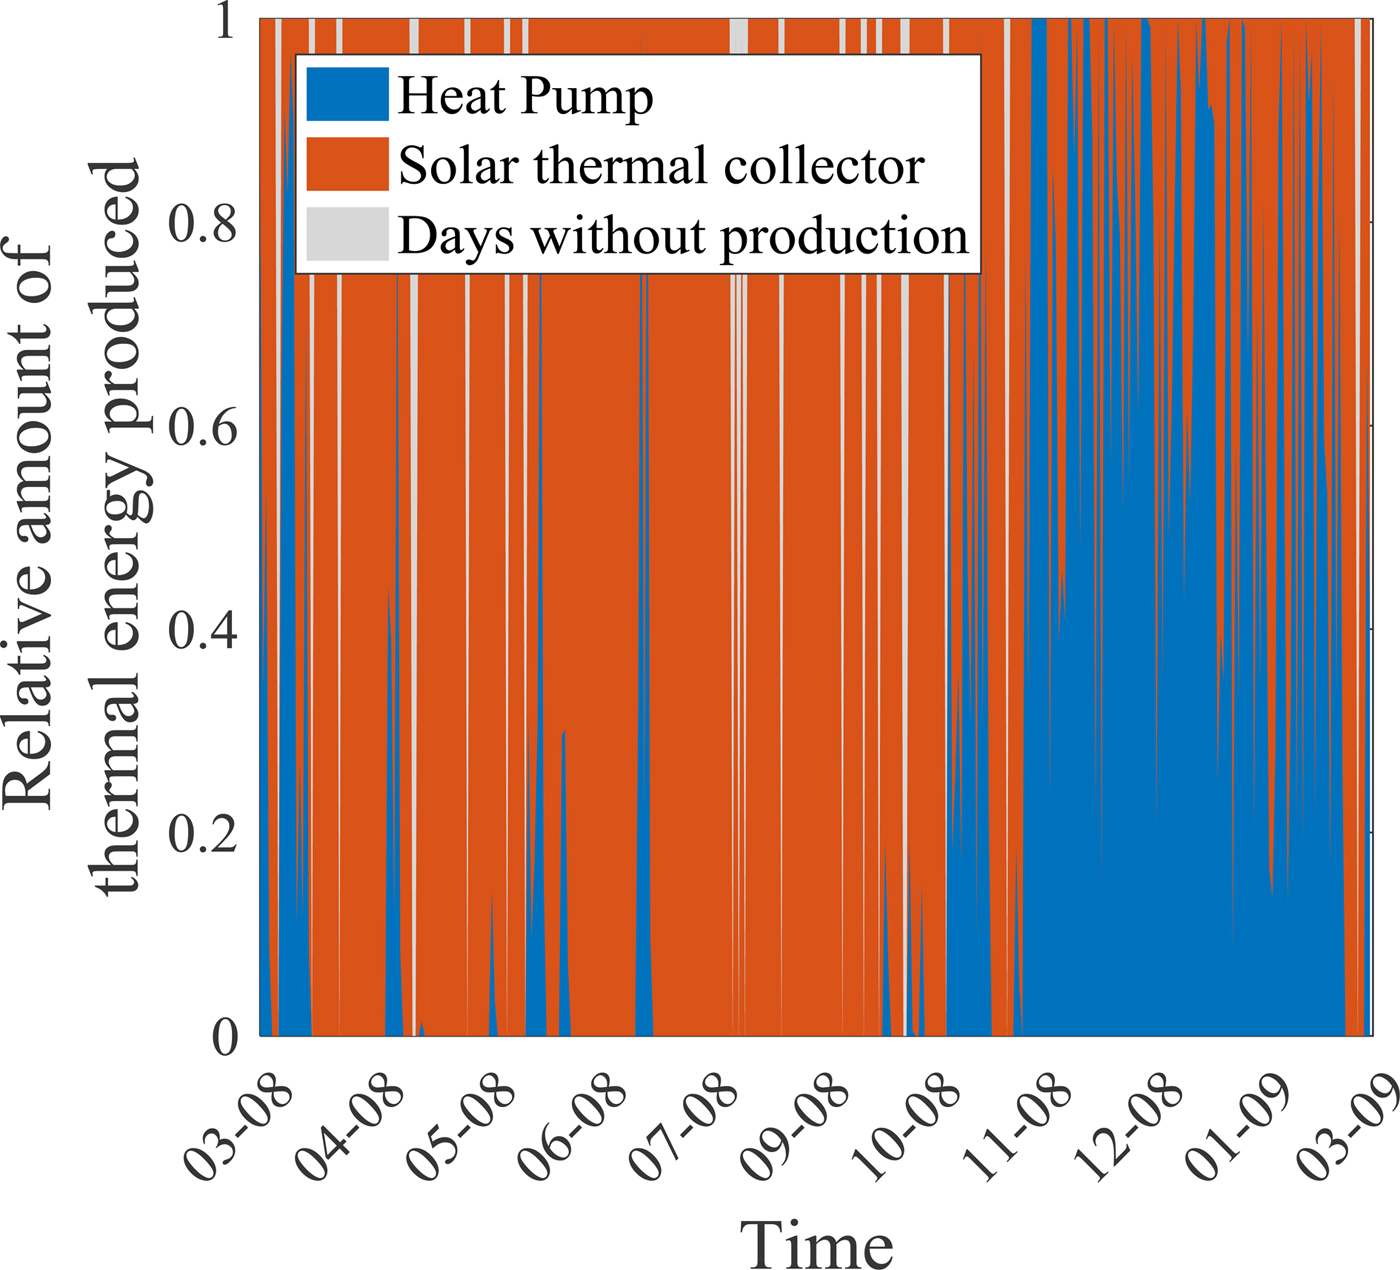
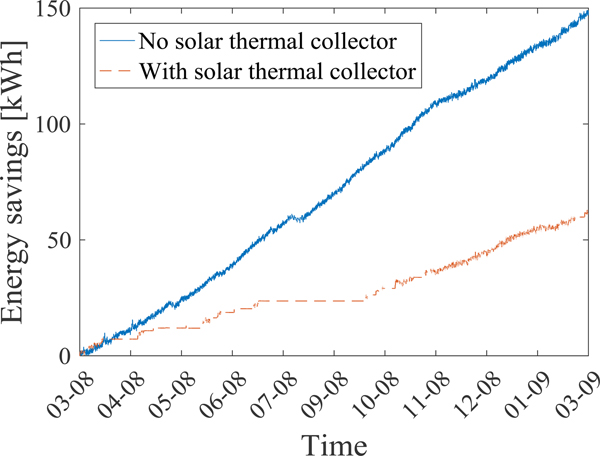
The results also suggest that a solar collector reduces the effectiveness of the technique. Indeed, in summer, a significant part of the energy is provided by the solar collector almost for free (neglecting the energy for a pump). Considering systems without solar collector, heat is provided thanks to HP or resistive devices that are less efficient. Figures 8 and 9 illustrate that point on a particular dwelling. Figure 8 shows that in summer, almost no energy comes from HP when STC is in operation. The consequence on energy saving is shown in Figure 9. No extra savings are achieved during the summer if STC is working while savings steadily increase in the other case.
Relative contribution of each source to the thermal energy.

Cumulated savings using the HP system with and without STC (configurations 2 and 3).

Even though the efficiency of the resistive system is lower than the others, the energy gains observed using forecast are less important than the case of HP systems. We could expect the gain to be greater (at least) since the production system consumes more energy. Figures 5–7 show that this intuition is neither verified in relative scale nor in absolute. The explanation is that, since the production behavior is very different, the thermal inertia is different; thus, the way the system accounts for forecasts might be less appropriate and yields less savings.
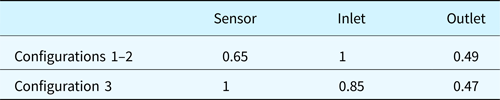
More precisely, in this case, the pipes inlet and outlet positions of the heat production loop and the temperature sensor position are responsible for the thermal inertia discrepancy between systems. These positions are summarized in Table 2 and can be observed in Figures 1 and 2.
Relative position of sensor and pipe/tank connections (1 and 0 are the top and the bottom of the tank, respectively)

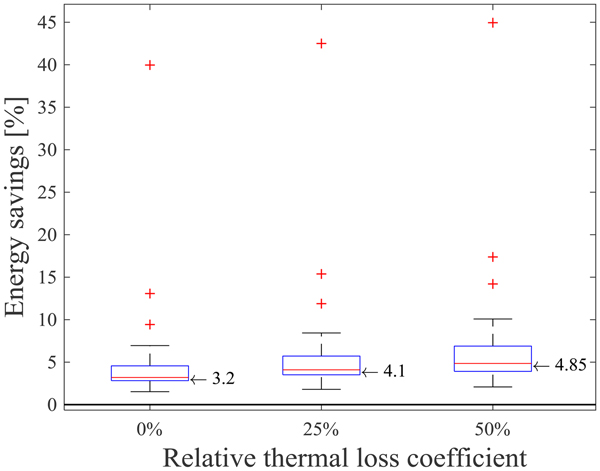
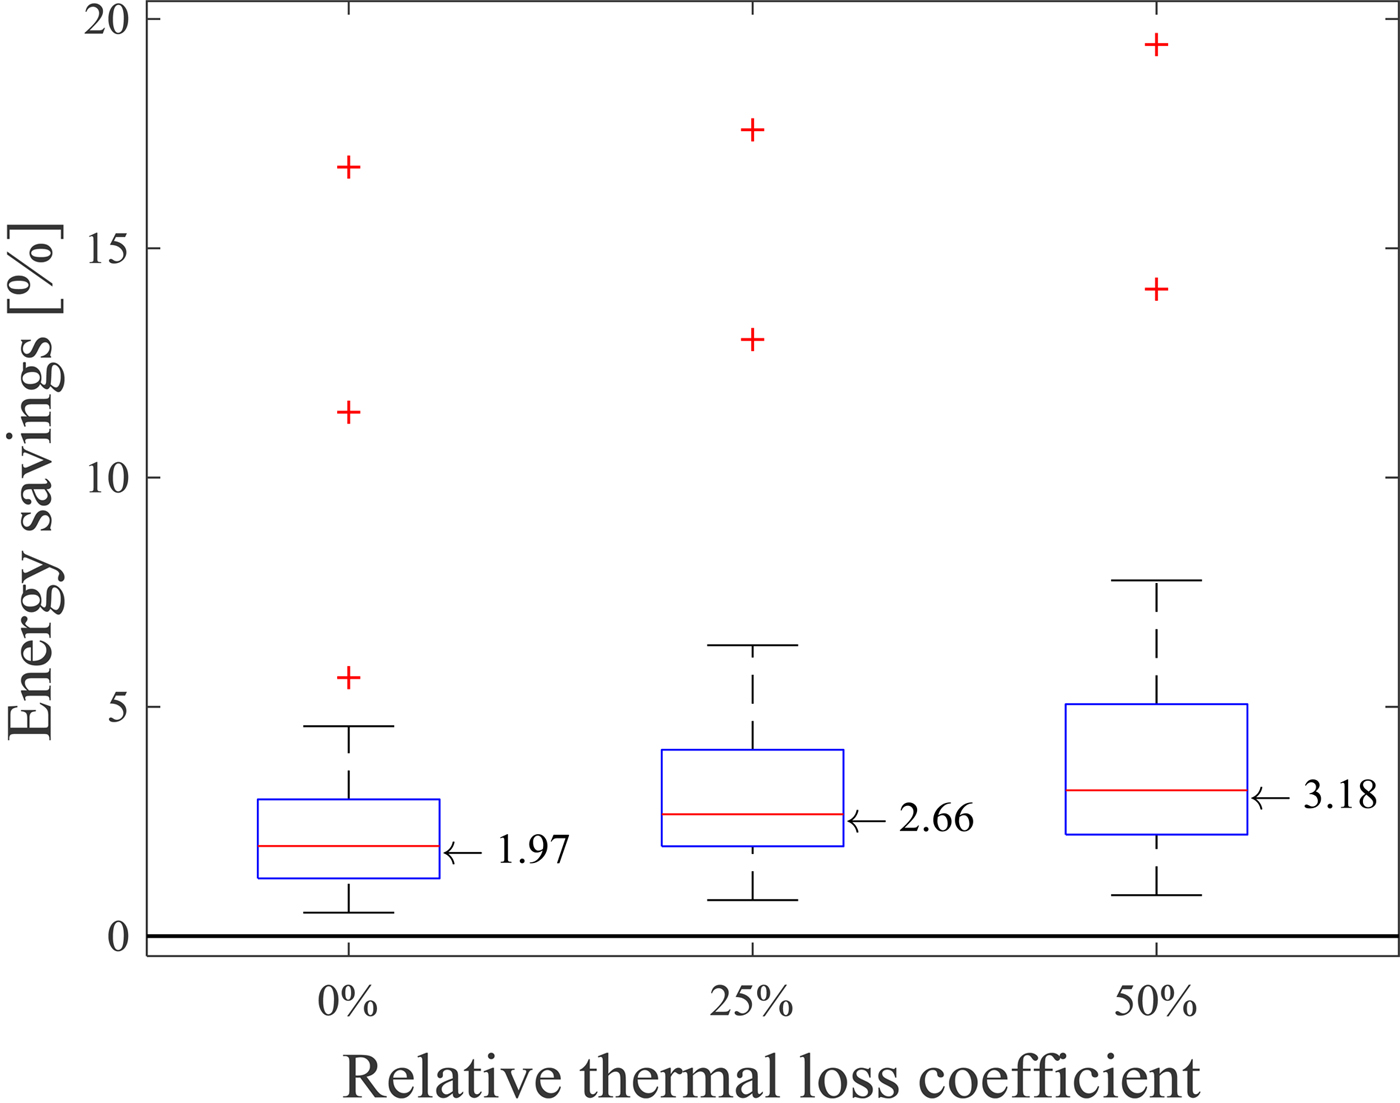
The consequence is that the configuration 1 has short operating cycles that heat a smaller volume of water than configurations 2–3 (the sensor being placed higher). Thus, if DHW is regularly tapped, the average energy of the tank is lower and so is the thermal dissipation compared with configurations 2–3. This is why energy savings are lower in configuration 1. However, this does not hold anymore if there are long periods of absence (>10 days). In this case, which occurs sparsely in our data, without forecast, configuration 1 ends up by heating the whole tank (since DHW is not tapped) and energy losses become as high as in configuration 2. The energy yield is lower in configuration 1, where the anticipative system allows larger savings since it enables shutting down the boiler when no DHW is tapped during the day. The main result to point out is that the characteristics of the boiler can have an impact on how much savings the anticipative system can yield. The algorithm can be tuned to be more efficiently adapted to the boiler. For example, the forecast horizon can be extended or shrunk to adapt to the effective inertia of the boiler and the amplitude of consumption peaks. The effect of thermal insulation of the tank has been studied as well. The reference system has a thermal loss coefficient of 1.08, 10.12, and 2.41 kJ/(h.K) at the top, side, and bottom of the tank, respectively. More information can be found in Bales et al. (Reference Bales, Betak, Broum, Chèze, Cuvillier, Haberl, Hafner, Haller, Hamp, Heinz, Hengel, Kruck, Matuska, Mojic, Petrak, Poppi, Sedlar, Sourek, Thissen and Weidingern.d.). Figures 10 and 11 show the results obtained with the 26 dwellings simulated with different thermal insulations. As a result, poorer insulation allows more savings using the forecast. Indeed, if the tank is well insulated, hot water can be stored longer without suffering from extra dissipation. Thus forecasting the consumption becomes less relevant in terms of energy gain.
Relative energy savings using perfect forecast depending on insulation, considering system with resistive heating device. Insulation varies from nominal value (0%) down to 50% less efficiency.

Relative energy savings using ARIMA forecast depending on insulation, considering system with resistive heating device. Insulation varies from nominal value (0%) down to 50% less efficiency.

Figures 10 and 11 show that relative savings using consumption forecast are increased by 52% of the baseline value when the insulation is halved. In other words, the relative energy savings increase by 1.65. The effects of the insulation coefficient are slightly exacerbated using ARIMA (up to 61% increase of the baseline value of relative energy saving when the insulation is halved) but the difference might not be significant (relative energy savings increases up to 1.21). So an anticipative strategy is much more adapted with higher energy loss.
Performance of the algorithm and energetic efficiency
Relation between model accuracy and energy savings
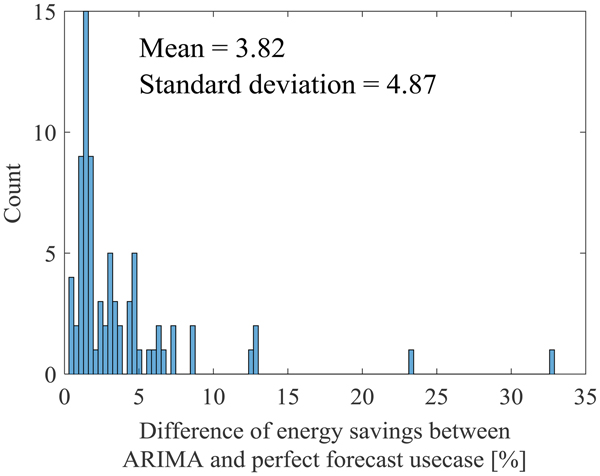
All previous results showed that energy savings depend strongly on the system. It does also depend on the prediction accuracy since using exact forecast yields better results than using ARIMA in Figures 10 and 11. To gain a better insight into the relations between forecast error and energy savings, the energy saving discrepancies observed using ARIMA and perfect forecast are plotted in Figure 12. Energy gain using a perfect forecast is significantly better than using ARIMA forecast. Thus a better accuracy of the model can still improve the energy savings up to 3.8% on average.
Distribution of energy savings discrepancies observed using perfect forecast and ARIMA, calculated over the 26 dwellings with the different configurations.

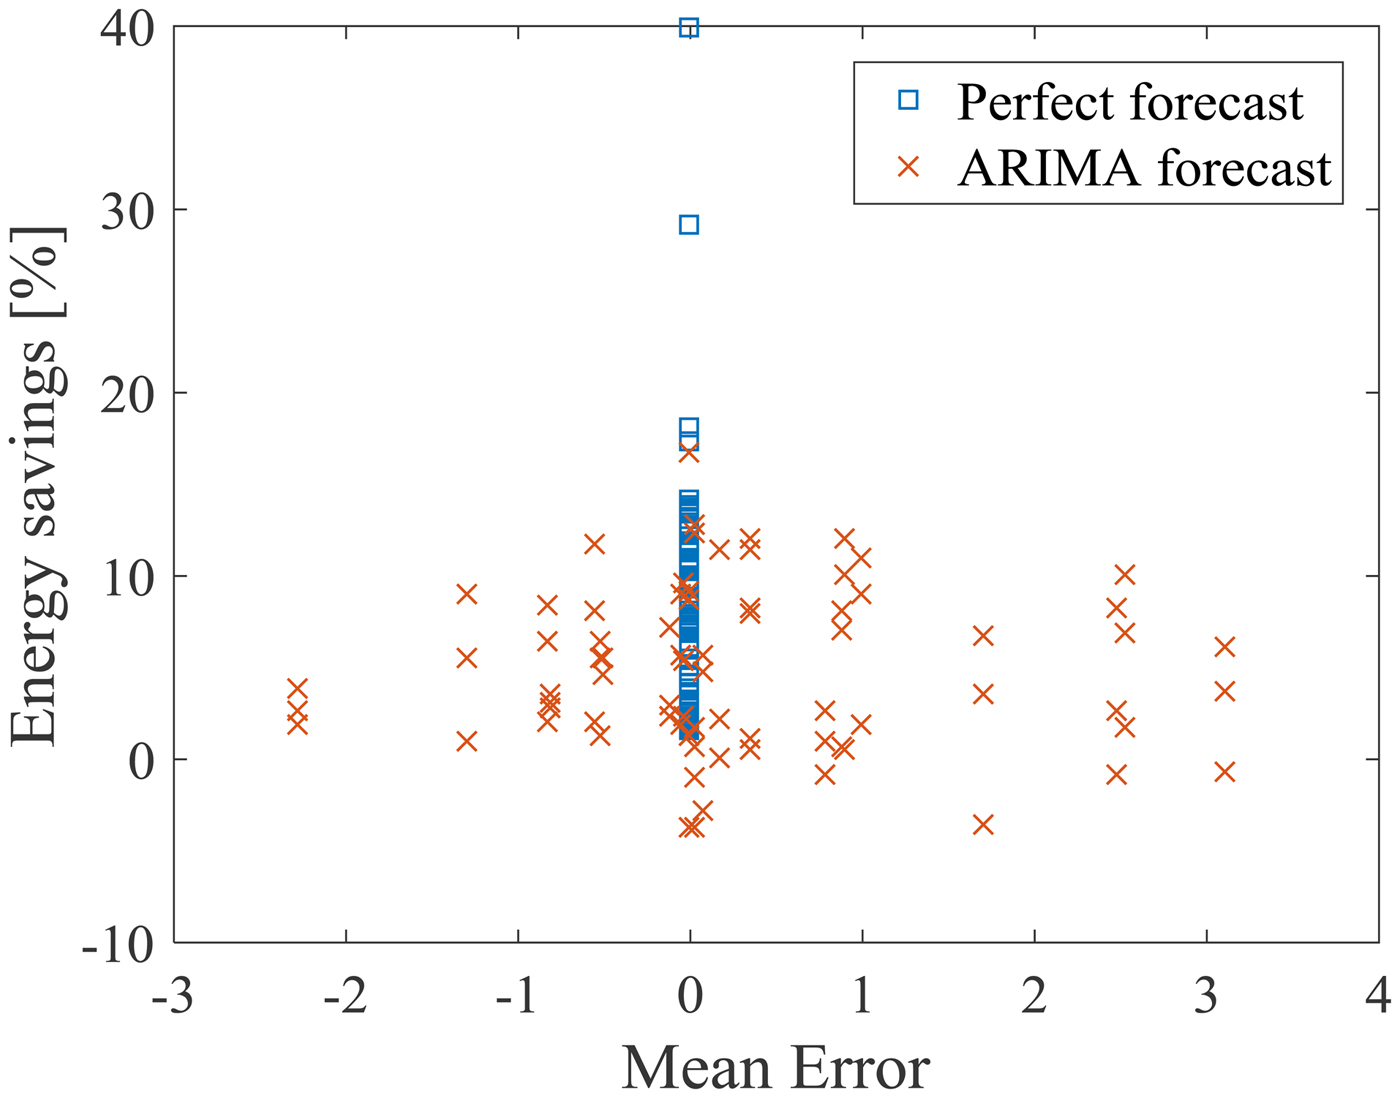
The model mean error (ME) is computed over each simulated year and plotted against energy savings in Figure 13, for each simulated configuration of system and dwelling, using ARIMA and perfect forecast. Errors are computed on the cumulative consumption forecast for the next hour using formula 5,
 $${\rm ME} = \displaystyle{1 \over N}\mathop \sum \limits_{t = 1}^N F_t-Y_t$$
where Y t and F t denote the observations and forecasts, respectively, with t covering the simulated year. Figure 13 shows that the ME is homogeneously spread around 0 and that a high ME value does not imply lower savings. However, we have seen that the difference between savings using perfect forecast and ARIMA is significantly positive. The conclusion is thus threefold:
Lower forecast accuracy reduces energy savings
Fig. 13.Energy savings against model mean error.

The system type affects the yield as much as the forecast accuracy
ME indicator cannot be used as a quantitative estimator of the energy savings.

Considering the interface between forecasts and the control system, the implemented strategy consists in evaluating at each time step the available energy stored in the tank and comparing it with the cumulative consumption forecast over an H hour horizon. The stored energy is adjusted whenever some is missing by turning the production system on. Available energy is computed using four sensors spread along the top half section of the tank. If the stored water is below T min, then its energy is not taken into account, since this water would not be hot enough if drawn. In our case, H = 1 h and T min = 48°C. However, depending on the thermal inertia of the system, these parameters could be modified consequently improving or degrading the energy gain obtained using forecast.
Effect of model drift on model accuracy and energy savings
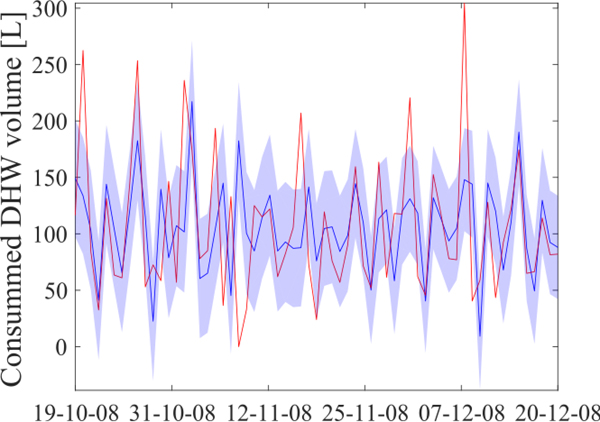
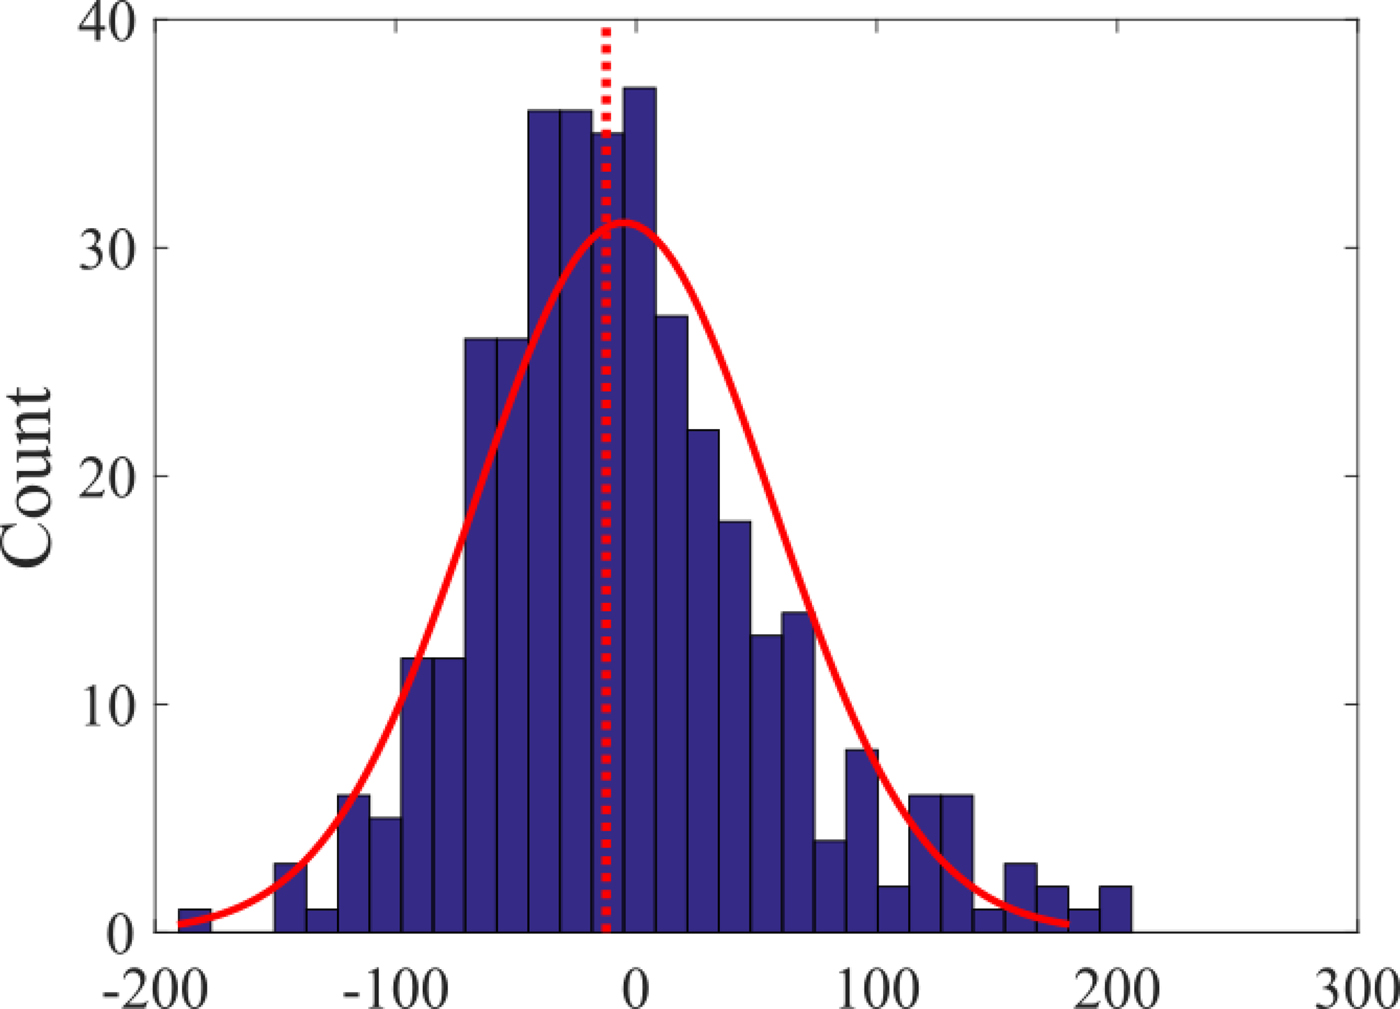
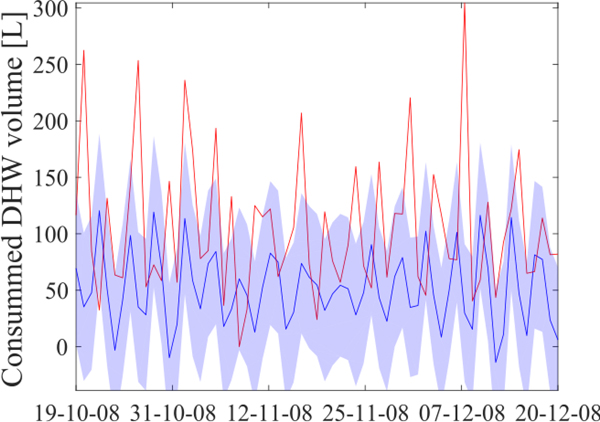
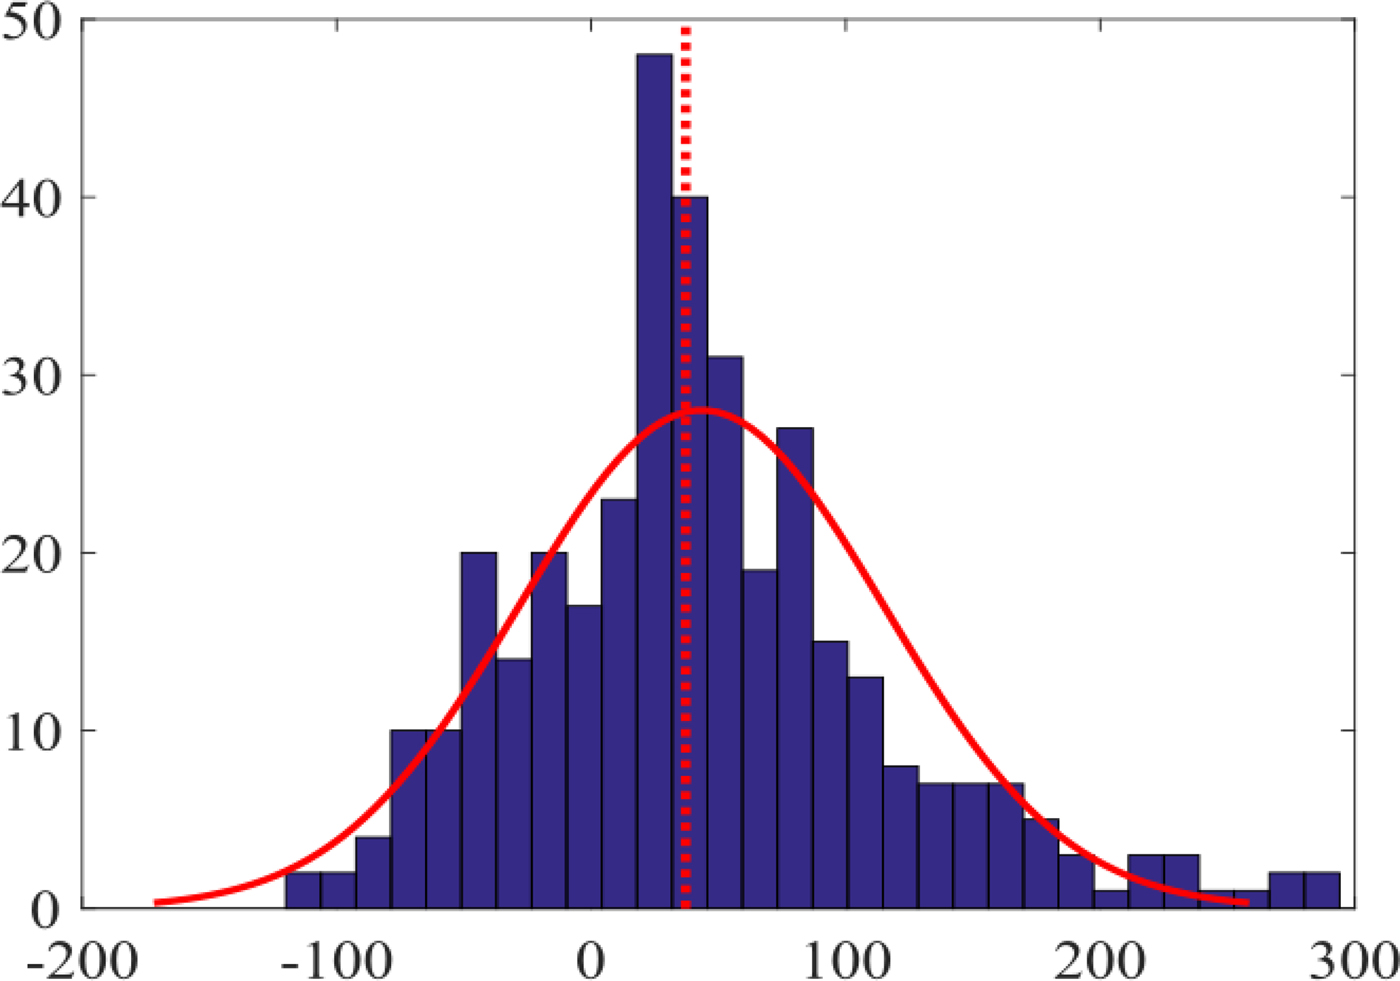
A statistical model trained on a particular data set is suited to forecast consumption of the dwelling from which the training set has been measured. However, nothing ensures that this model would be fitted for another dwelling since it is occupied by other inhabitants with different habits. Moreover within the same dwelling, dwellers can change with time, compromising the fitness of the model. This problem is referred as concept drift. To investigate the amplitude of the error caused by concept drift, models trained on specific dwellings have been used to forecast other dwelling consumptions. Figures 14–17 show the forecasts obtained for dwelling D6 using the models calibrated using DHW consumption of dwelling D6 and D9. The model trained with dwelling D6 is representative of the different models trained with the 26 dwellings (ARIMA coefficients are the closest to coefficient means). The error observed using the model calibrated on D6 to forecast the dwelling D9 consumptions is representative of the errors observed using the same model to forecast all the other dwellings. The figure shows that the concept drift can add a serious bias in the forecast. In this case, the forecast is systematically underestimated. Even though we have seen that large ME is not the most affecting factor on energy gain, the problem of concept drift should be kept in mind and dealt with.
Dwelling D6 DHW consumption measured (red lines) and forecast (blue lines) using model calibrated on D6.

Histogram of model error Y(d)-F(d) with model calibrated on D6.

Dwelling D6 DHW consumption measured (red lines) and forecast (blue lines) using model calibrated on D9.

Histogram of model error Y(d)-F(d) with model calibrated on F(d) with model calibrated on D9.

Discussions and guidelines
Improving the energy efficiency of an individual DHW production system using forecast is a challenging task for many reasons. The first challenge not in the scope of this study is to use efficiently a statistical model for DHW forecast through the control. For example, we consider a single dwelling rather than a full district or a town (i.e. for the case of urban heating network) which is easier to forecast thanks to the aggregation of consumptions. Moreover DHW consumption fluctuates over time and is hard to predict since it does not necessarily depend on external factors such as external temperature (Lomet et al., Reference Lomet, Suard and Chèze2015) compared with SH production. This has been studied and published in previous papers (Lomet et al., Reference Lomet, Suard and Chèze2015; Lomet et al., Reference Lomet, Denis, Suard and Chèzen.d.).
However, we focus here on considerations about model embedding into production systems. The study sheds some light about the difficulties of saving energy within anticipative systems (i.e. that uses forecast). First of all, anticipative systems yield greater savings using the tank with poorer insulation than our study case. Second, there is no direct relationship between the initial efficiency of the system and the energy gain that one can expect using forecast. In particular, using STC brings energy to the tank during summer almost for free, thus restricting the gain made using forecast compared with systems without STC. However, the energy gains are even more restricted considering a simple resistive system to produce DHW, whose efficiency is lower than HP systems with and without STC. This has been attributed to the compatibility between forecasts and the system, through the control strategy and the system's characteristics itself. For example, the position of the pipes inlet and outlet and the thermal sensor has been pointed out as being responsible for shorter heating cycles in the system configuration 1 leading to lower energy stored and thus less dissipation for most of the dwellings. Thus the production system characteristics have a large impact on energy savings. Finally the energy gain also strongly depends on the dwelling considered and dwellers habits. Thus no pledge about the saving amount can be held without knowing the DHW production system and the dwellers habits, with the strategy we used to interface forecasts and the control system.
The strength of this forecast model, compared with the state of the art presented earlier, is that it is lightweight and thus embeddable in the production system. Moreover, it does not depend on external parameters and only needs the history of DHW consumption to be able to run, making it flexible and easily embeddable. Another model, more sophisticated, provides greater accuracy but in this work we have shown that the accuracy of our model is not the main lever to save more energy with anticipative systems. However, attention must be paid to production system characteristics and how the forecast is integrated within the DHW production management system. Moreover the period of learning data set should be representative of global usage.
Conclusion and perspectives
This paper aims at investigating whether forecasting DHW consumption can lead to significant energy savings in an individual scale DHW production system. Consumptions have been forecast using a time series-based model with a correction procedure. Then the forecasts have been used to adapt the control strategy of the production system. In the presence of forecasts, the boiler is turned on whenever the required quantity of DHW for the next hour is larger than the available quantity in the tank. The paper focuses on evaluating the compatibility between the consumption forecast model and the DHW production system. To achieve this, a large set of simulations has been carried on 26 real and different dwellings, considering three different systems for each, one whose tank insulation parameter ranges over three levels. Energy savings have been evaluated between −3.6% and 12.8% depending on the experimental case. This has been shown using a time series-based algorithm to forecast consumption and TRNSYS tool to simulate the system and the DHW demand. Real consumptions have been used as input to the simulator and to train the forecasting model, in order to have a statistical estimation of the energy savings. The main conclusions of this study are the following:
• The energy saving depends on:
◦ the dwellers and their habits:
Different types of consumption profiles can be observed in our data and partly explain the dispersion of the results. For example, few dwellings seem to be seldom occupied (rental, secondary house, etc.). These kinds of load profiles display extreme savings in our simulation, but are considered as outliers. Profiles corresponding to single people are sometimes harder to predict with our model because their behavior can have more abrupt changes. This lowers the savings. Family on the contrary is more regular in their behavior and the larger number of people ensures a smoother consumption profile. Outliers in consumptions, such as an extreme peak in consumptions, have been spotted. Those unexplained but still feasible profiles have been kept and cause large penalties, especially when forecasting, thus lower savings.
◦ the characteristics of the DHW production system (such as yield and tank insulation),
◦ the forecast accuracy.
• ME indicator cannot be used as a quantitative estimator of the energy efficiency gain of the anticipative system compared with the reactive one.
• Concept drift can induce a large bias in the forecast and should be properly addressed.
As a perspective, an adaptive forecast model that deals with concept drift and optimizes the interface with the control strategy will be considered to challenge the context changing.
Acknowledgments
Some data and algorithmic resources used in this work come from output materials of the European Union's Seventh Framework Program FP7/2007-2011 under grant agreement n° 282825 – Acronym MacSheep.
Yvan Denis recieved a Master degree in material engineering in 2012. He worked then 3 years at STMicroelectronics with IMEP-LAHC laboratory about the optimization of the 14 and 28nm FDSOI MOSFET process as a part of is PhD degree. He was graduated as PhD researcher in 2016. Then he joined the CEA Tech laboratory names LIANES which is a common laboratorie between LITEN (Grenoble) and LIST (Saclays) where he applied his knowledge of data science to forecast DHW consumption in household to optimize the production scheduling. He is currently working at Automatique et Industrie as engineer researcher, developping artificial intelligence applied to renewable energy production and related facilities management.