


Introduction
The Antarctic Peninsula (AP) is the only region of Antarctica where a pronounced atmospheric warming of 2.5˚C has been detected since 1945 (Reference KingKing, 1994). Coincident with this climatic amelioration, the extent of ice cover on the AP has experienced dramatic changes in recent years. The regional climatic warming has induced the disintegration of ice shelves around the AP (Reference Rott, Skvarca and NaglerRott and others, 1996; Reference Vaughan and M. DoakeVaughan and Doake, 1996; Reference Skvarca, Rack, Rott and Ibarzábal y|DonángeloSkvarca and others, 1999; Reference Scambos, Hulbe, Fahnestock and BohlanderScambos and others, 2000). In addition, an increased general glacier retreat has been documented since 1975 on the northeastern AP (Reference Skvarca, Rott and NaglerSkvarca and others, 1995; Reference De Angelis and SkvarcaDe Angelis and Skvarca, 2003). Reference Skvarca, Rack, Rott and DonangeloSkvarca and others (1998) have described clear evidence of climatic warming on the northeastern AP, as well as its impact on ice masses within this region (Reference Skvarca, De Angelis, Domack, Leventer, Conley, Kirby and BindschadlerSkvarca and De Angelis, 2003).
Due to the high sensitivity of polar regions to climate change, monitoring the mass balance of polar and subpolar ice masses, among other environmental variables, is important (Reference WellerWeller, 1998). Long-term studies on Arctic glaciers, excluding the Greenland ice sheet, have shown a predominantly negative mass-balance trend during the last 60 years (Reference DowdeswellDowdeswell and others, 1997). Mass-balance data on the AP are limited due to difficult access and expensive logistics. Earlier work was confined mainly to the northern and southwestern regions of the AP. Mass-balance conditions were analyzed between 1968 and 1974 at three different localities on the South Shetland Islands (Reference Orheim and GovorukhaOrheim and Govorukha, 1982). However, the most comprehensive and detailed studies, including energy balance, were carried out from 1969 to 1974 as a contribution to the International Hydrological Decade 1965–74, on Spartan Glacier (SG), Alexander Island, southwestern AP (71.05˚ S, 68.33˚ W) (Reference Jamieson and WagerJamieson and Wager, 1983; Reference Wager and JamiesonWager and Jamieson, 1983).
The lack of mass-balance data, increased regional atmospheric warming and detection of significant changes prompted a mass-balance program on Vega Island, north-eastern AP, in the austral summer of 1998/99. This is one of the few sites in the AP where glaciers terminate on land, so the mass balance of these glaciers is directly related to climate. The objective of the mass-balance program on Vega Island is to establish a benchmark in the region of drastic changes induced by atmospheric warming. The selected glacier, which we informally call ‘Glaciar Bahía del Diablo’ (GBD; 63˚49' S; 57˚26'W; Fig. 1), has an area of 14.3 km2 (measured in early 2000) and an accumulation–area ratio (AAR) of 0.39 (averaged over the period 1999–2003); this outlet glacier drains an ice cap from 630 to 75 ma.s.l. The accumulation area is oriented northeastwards and the ablation area eastwards (Fig. 2). GBD is polythermal, with its snout overriding an ice-cored thrust moraine on a periglacial plain of continuous permafrost (Reference Ermolin, De Angelis and SkvarcaErmolin and others, 2002). An automatic weather station was installed during the 1998/99 field campaign about 700m from the glacier front (VIAWS in Fig. 2), and has been running continuously since 17 February 1999. The mean annual air temperature (MAAT), averaged over the 3 year period 2000–02, is –5.5˚C. The present work deals with mass-balance measurements carried out on GBD from 1999 to 2003. Due to changes in data processing, the values for annual balance reported here differ slightly from, and replace, those presented in Reference Skvarca, De Angelis, Domack, Leventer, Conley, Kirby and BindschadlerSkvarca and De Angelis (2003). Glacier thinning rates covering the period 1982–2003 are also analyzed.
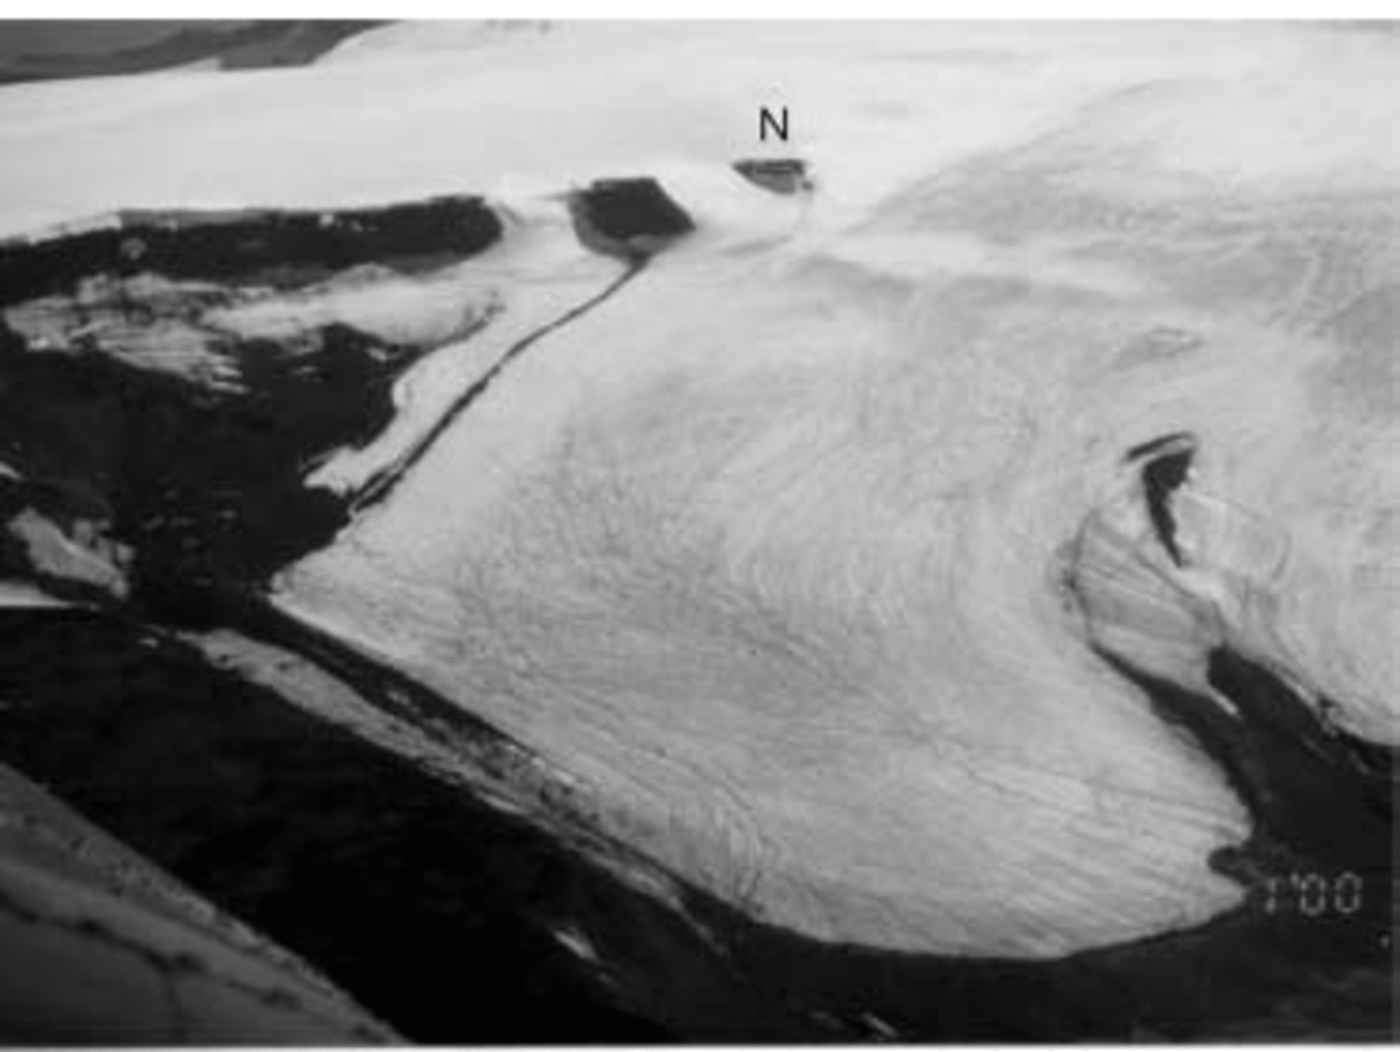
Oblique aerial photograph of GBD, 27 January 2000. Note the abundance of supraglacial meltwater streams resulting from the unusually warm summer 1999/2000, as well as the complex pattern of accumulation on the upper part of GBD (top of photograph), visible also on the Landsat image of Figure 2. N: nunatak.
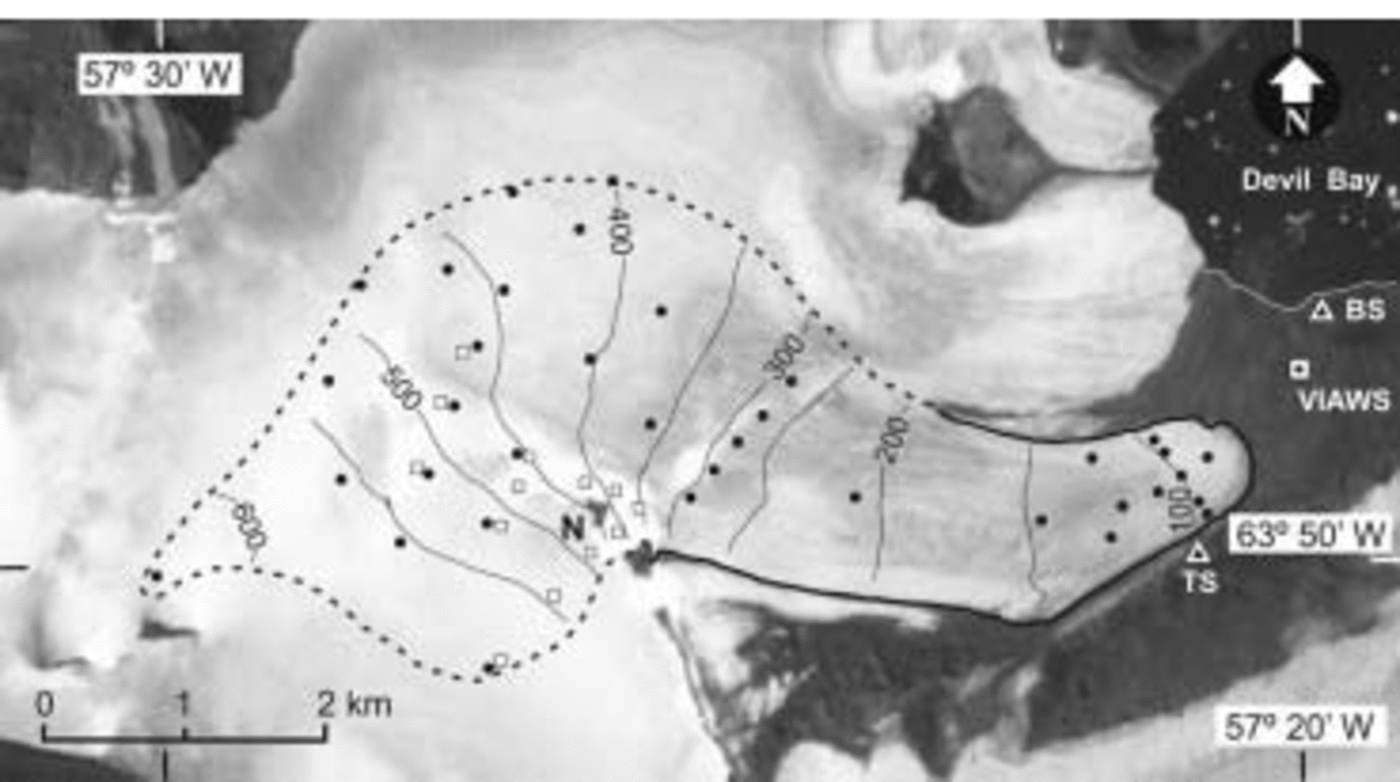
Topographic map of GBD, superimposed over a section of Landsat 7 ETM+ image of 21 February 2000. Contour lines are in meters. Circles indicate positions of stakes, and squares the locations of snow pits. The glacier drainage area is delineated by a dashed line. N: nunatak; TS: triangulation station; VIAWS: Vega Island automatic weather station; BS: location of GPS base station.
Previous Work
Basic glaciological studies on GBD began during the austral summer of 1981/82. The early work established a local triangulation network, and measured ice-flow velocity, ablation rates and glacier surface elevation change. However, research in the early 1980s was confined to the lower part of the GBD ablation area and the surrounding periglacial plain. Measurements indicated almost no change in glacier surface height from 1982 to 1985, suggesting that the glacier was close to equilibrium. However, the 1998/99 summer survey revealed that glacier surface height fell on average 12.6m from 1985 to 1998 (13 years), yielding an average annual thinning rate of 1.0ma–1 (Reference Skvarca, De Angelis, Domack, Leventer, Conley, Kirby and BindschadlerSkvarca and De Angelis, 2003). This surface lowering resulted from averaging 23 surveyed points distributed over the 2.2 km long lower part of the glacier ablation area. From 1998 to 1999 the thinning rate increased to 1.4 ma–1. Regional warming is believed to be a main cause for this enhanced thinning. The summer of 1998/99 was among the warmest recorded in the region, as revealed by the mean summer air-temperature (MSAT; December–February) records of Esperanza and Marambio stations (Reference Skvarca, De Angelis, Domack, Leventer, Conley, Kirby and BindschadlerSkvarca and De Angelis, 2003), located about 50 km to the north and south, respectively. Both records show a strong correlation in MSAT over the last three decades (R = 0.93). The last four summers of temperature data suggest a much stronger correlation (R = 0.99) for Esperanza–VIAWS and Marambio–VIAWS stations.
Mass-Balance Methods
Field method and work
For GBD we have applied a simplified version of the combined stratigraphic–annual-mass-balance method described in Reference Mayo, Meier and TangbornMayo and others (1972). An annual (fixed-date) system, which considers each glaciological (balance) year from 1 March to 28/29 February of the following calendar year, has been adopted and used. These dates are climatically significant because they roughly coincide with the end of the summer season on the northeastern AP. The application of this method allowed us to determine the annual net balance b n, regardless of the maximum and minimum seasonal balances. This method is convenient since fieldwork was restricted to one visit per year, due to logistic constraints.
Direct surface-based methods have been used to measure the mass balance of GBD (Reference Østrem and BrugmanØstrem and Brugman, 1991). A network of 36–38 stakes (depending on the year) were distributed over the glacier (Fig. 2), representing a fairly high density of around 2.5 stakes km–2. The stake positions were determined each year by means of differential global positioning system (DGPS). We used a Trimble® Pro XL, 8-channel, single-frequency receiver as rover station, and a Trimble® 4600LS, 12-channel, single-frequency receiver as base station. Raw positions with coarse acquisition (C-A) code, L1 frequency and phase information were corrected using Trimble® Pathfinder Office software with Centimeter Processor® enhancing capability. This combination provides horizontal and vertical precisions in the order of 0.10 m, for baselines shorter than 8 km. Routine mass-balance work consisted of measuring stake heights, snow stratigraphy, as well as the extent and thickness of superimposed ice. The superimposed ice was identified by its whitish color, saturation of trapped air and the fine-grained structure of ice layers parallel to the glacier surface. Snow–firn thickness and densities were measured in several snow pits distributed over the glacier accumulation area as shown in Figure 2. Each year the measurements were made at approximately the same locations. Snow-density profiles were measured in each snow pit to reduce the uncertainties arising from extrapolation of the snow-density values to areas without measurements. Glacier-ice and superimposed-ice densities were assumed as 900 and 870 kg m–3, respectively. In addition, snow probing was performed at regular intervals along several profiles between the stakes, to account for variations in snow accumulation. We used a standard snow probe which has a centimeter scale, and probing positions were taken from DGPS readings. Because of a lack of natural markers such as dust layers, the previous summer surfaces in the accumulation area of GBD were usually detected by the presence of distinct ice horizons and/or by the use of artificial powder-dye markers. Powder dye was spread over snow areas of about 2–3m2 at selected places over the glacier at the end of the ablation season, and their positions were relocated with DGPS. During the following season the accumulated snow could be easily assessed by measuring the snow depth to the dyed layer.
The topographic map of GBD (shown in Figure 2 with 50 m contour lines) was produced with the aid of kinematic DGPS, using the receivers indicated earlier. The antenna of the rover instrument was mounted on a snowmobile following a grid spacing of <100 m. Positions were recorded at 1 s time intervals at both rover and base GPS receivers, with horizontal accuracy better than 0.20m using carrier-phase processing. All GPS surveys were referred to a single reference base station (BS) located near the Devil Bay coastline (see Fig. 2), tied to a first-order geodetic station on Seymour (Marambio) Island. In the past, ocean tide measurements were carried out at BS (Instituto Antártico Argentino, unpublished data), allowing us to know the local geoid–ellipsoid height difference.
The height coordinate was controlled at each pole, where an accurate altitude above the World Geodetic System 1984 (WGS84) ellipsoid was calculated, referred to mean sea-level by means of static DGPS measurements. The overall uncertainty in post-processed height determinations is <0.10 m. All data acquired by means of DGPS surveys were integrated on a digital elevation model (DEM) with a grid size of 50 m. The use of a grid size smaller than the survey spacing is justified by the fact that it improves the areal determinations without degrading the quality of the map (Reference JanssonJansson, 1999). The contours were automatically drawn by applying a minimum curvature algorithm. Finally, the ice divide and the drainage area of GBD was delineated using the surface contours in combination with a section of Landsat Enhanced Thematic Mapper Plus (ETM+) image acquired on 21 February 2000. The resulting drainage area derived for GBD in early 2000 is 14.3 km2.
The method for detecting changes in glacier surface elevation is based on repeated topographic measurements of the same points at different time intervals. Surveys over GBD were made from a triangulation station fixed on rock (TS in Fig. 2), relocating each time around the end of the summer season the same 23 points over the glacier by means of a theodolite and electronic distance meter. The reflector was positioned at each point within about 20cm in horizontal coordinates, by fixing the corresponding azimuth angle and distance. The precision of height coordinates is estimated as ±2.5 cm, depending on the distance and instruments used.
Data analysis
The information acquired in the field was compiled in a spreadsheet. In certain cases, minor corrections were applied to account for late snowfalls or extra ablation, when measurements were carried out before or after the end of the balance year. In such cases, the corrections were based on the temperature records available from VIAWS. To calculate of the net balance along the glacier, we applied a simplified version of the procedure described in Reference JanssonJansson (1999), using a Geographical Information System (GIS). We determined b n at each measurement point, resulting in text tables including positions and annual balances, which usually contained more than 70 mass-balance points for each balance year. Using these data as input and applying minimum curvature interpolation, we resampled the field data on a regular 50m×50m grid, obtaining the net balance maps for each balance year (Fig. 3). The use of a grid size smaller than the real field sampling distance does not improve the data quality but increases the accuracy of the automated area calculation, because integration is performed with smaller elements (Reference JanssonJansson, 1999). The grid elements falling outside the glacier boundaries were eliminated by using an appropriate outline mask. The net mass balance for each year was obtained by calculating the total volume of the grid divided by the total glacier surface. To determine the average variation of b n vs altitude (Fig. 4), we used a topographic map constructed with a similar grid size, and extracted the gridded balances and altitudes.
Net annual balance maps for balance years 1999/2000, 2000/01, 2001/02 and 2002/03. Isolines indicate net balance, in mw.e.; zero is the equilibrium line. The ablation area is shown in dots.

Graph showing net balance b n vs altitude, 1999–2003.

Estimation of errors in mass-balance measurements and calculations is not a simple task (Reference Østrem and BrugmanØstrem and Brugman, 1991; Reference CogleyCogley, 1999; Reference JanssonJansson, 1999). Though great care was taken in field measurements, these are inevitably affected by large errors. Reference Cogley, Adams, Ecclestone, Jung-Rothenhausler and OmmanneyCogley and others (1996) concluded that errors in fieldwork are of the same order as errors in individual stake readings, and can eventually reach 0.25 mw.e.
However, the errors in both stake readings and snow probing are usually within 0.05 and 0.01 m, and the propagation of these errors to final results is negligible (personal communication from P. Jansson, 2004). The errors in computation procedures can be identified by applying objective data processing. In order to estimate the computation errors of our mass-balance maps, we determined the residuals, i.e. the difference between measured and interpolated values for every year. We found in our maps an average residual of 0.02 mw.e., with a mean standard deviation of 0.08mw.e. This estimate agrees well with the estimated error of about 0.1 m given by Reference JanssonJansson (1999), considering both observational and computation problems.
Results
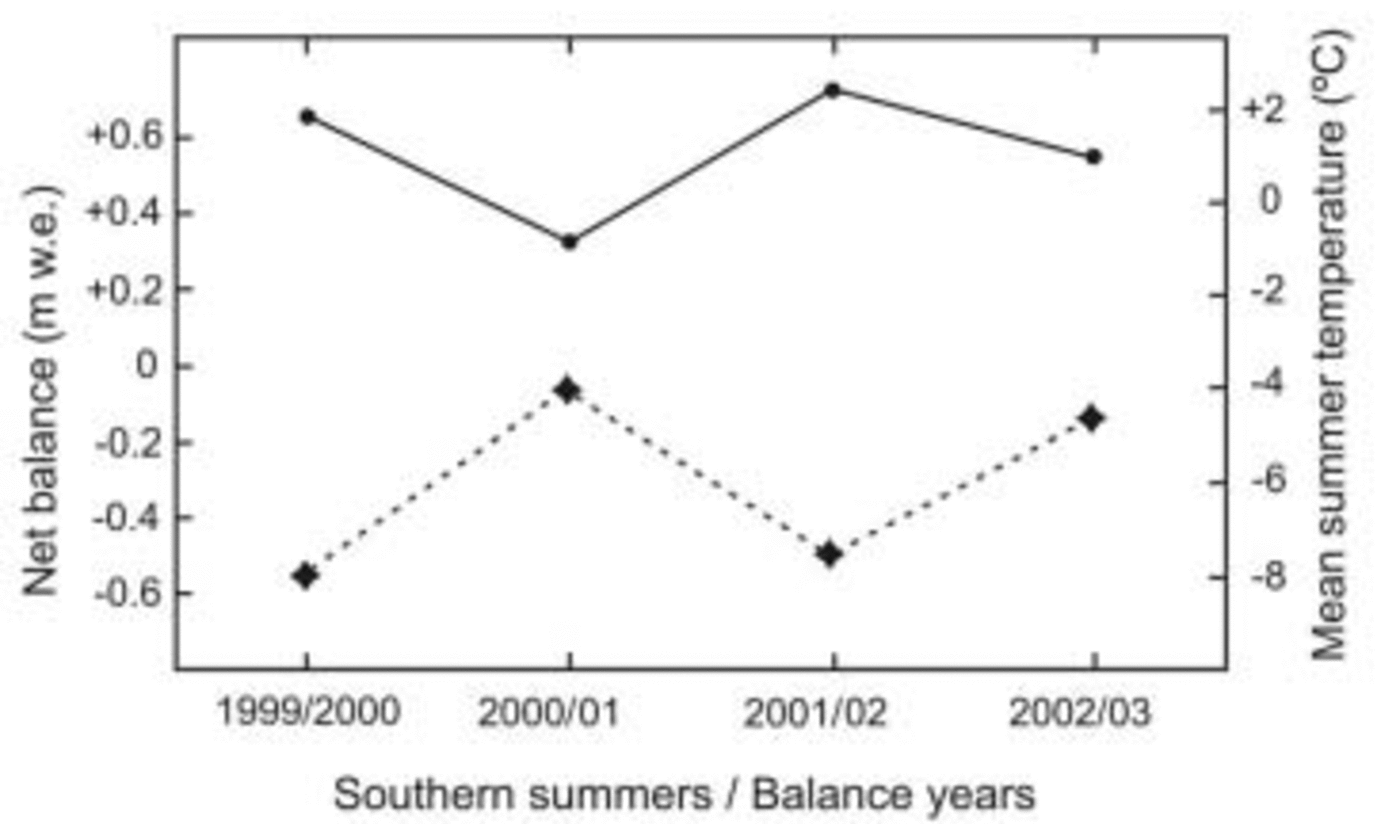
The net mass-balance maps are shown in Figure 3. The calculations yielded a net mass balance (b n) of –0.56 mw.e. for 1999/2000, –0.06 mw.e. for 2000/01, –0.51 mw.e. for 2001/02 and –0.15 mw.e. for 2002/03. The mass balance of GBD in the past 4 years is negative, with a mean of –0.32 m w.e. The mean error of our results, as estimated from the interpolated residuals, is 0.08 mw.e. The mass loss was largest in 1999/2000 and 2001/02, corresponding to the two warmest summers during the 4 year period. In addition to mass-balance measurements, the topographic surveys of surface elevation over the lower parts of the GBD tongue (100–250ma.s.l.) yielded thinning rates of 1.6 ma–1 for 1999/2000, 0.4 ma–1 for 2000/01 and an average of 1.4 ma–1 for the period 2001–03.
The results of balance years 1999/2000 and 2000/01 obtained in the present study (–0.56. and –0.06 mw.e., respectively) differ slightly, with –0.53 and –0.05 mw.e. reported by Reference Skvarca, De Angelis, Domack, Leventer, Conley, Kirby and BindschadlerSkvarca and De Angelis (2003), because different computation procedures were used in each case. Formerly, these two balance years were calculated by using the classical manual mapping procedure rather than the automated method applied in this work. Although previous results are within error estimates, we consider the new values more coherent since a rational and more consistent procedure was applied throughout the years of mass-budget coverage.
The altitudinal variation of mass balance (Fig. 4) shows a zero net balance at about 400 m a.s.l. in both warmest years (1999/2000, 2001/02) of the observational period, which is at least 20m higher than in the other two balance years, indicating that GBD mass balance is very sensitive to summer ablation. The correlation between the annual net mass balance (b n) and mean summer air temperature measured at VIAWS is shown in Figure 5.
Mean summer air temperature at VIAWS and annual net balance (b n) during the period of mass-balance analysis.
Discussion
Four years of net mass-balance data from GBD reveal a strong response to the regional variability in summer air temperature. The balance years of GBD which include the two very warm summers of 1999/2000 (MSAT: +1.8˚C) and 2001/02 (MSAT: +2.4˚C) show a particularly complex accumulation pattern of high spatial variability over the upper parts of the glacier (Fig. 3). The highest net accumulation was measured on the lee side of the cliffs and steep slopes at about 350ma.s.l., in the vicinity of nunatak N (Fig. 1 and 2). Large ablation areas extended to the highest parts of GBD around 600 ma.s.l. during the 1999/2000 and 2001/02 summers, which were among the five warmest in the last three decades according to records of the north-eastern AP (Reference Skvarca, De Angelis, Domack, Leventer, Conley, Kirby and BindschadlerSkvarca and De Angelis, 2003). At the end of these two summer seasons the accumulation area exhibited zones of snow accumulation and ablation, separated by widespread zones of superimposed ice, as can be seen in Figures 1 and 2, and reflected on mass-balance maps (Fig. 3), indicating the difficulty of defining the equilibrium line in most balance years. Similar conditions were reported for SG, which exhibited a number of accumulation areas instead of a well-defined equilibrium line. SG provides the only other detailed record of mass balance on the AP, although from a maritime climatic regime. This small valley-type glacier of 6.3 km2 had a negative mean mass balance of –0.27mw.e. a–1 over the period 1970–74 (Reference Wager and JamiesonWager and Jamieson, 1983). This value is very similar to the –0.32mw.e. a–1 for GBD, resulting from our averaged mass-balance measurements between 1999 and 2003. However, the range of interannual variability in mass balance is much larger at GBD (–0.06 to –0.56mw.e. a–1) than at SG (–0.22 to –0.35mw.e. a–1).
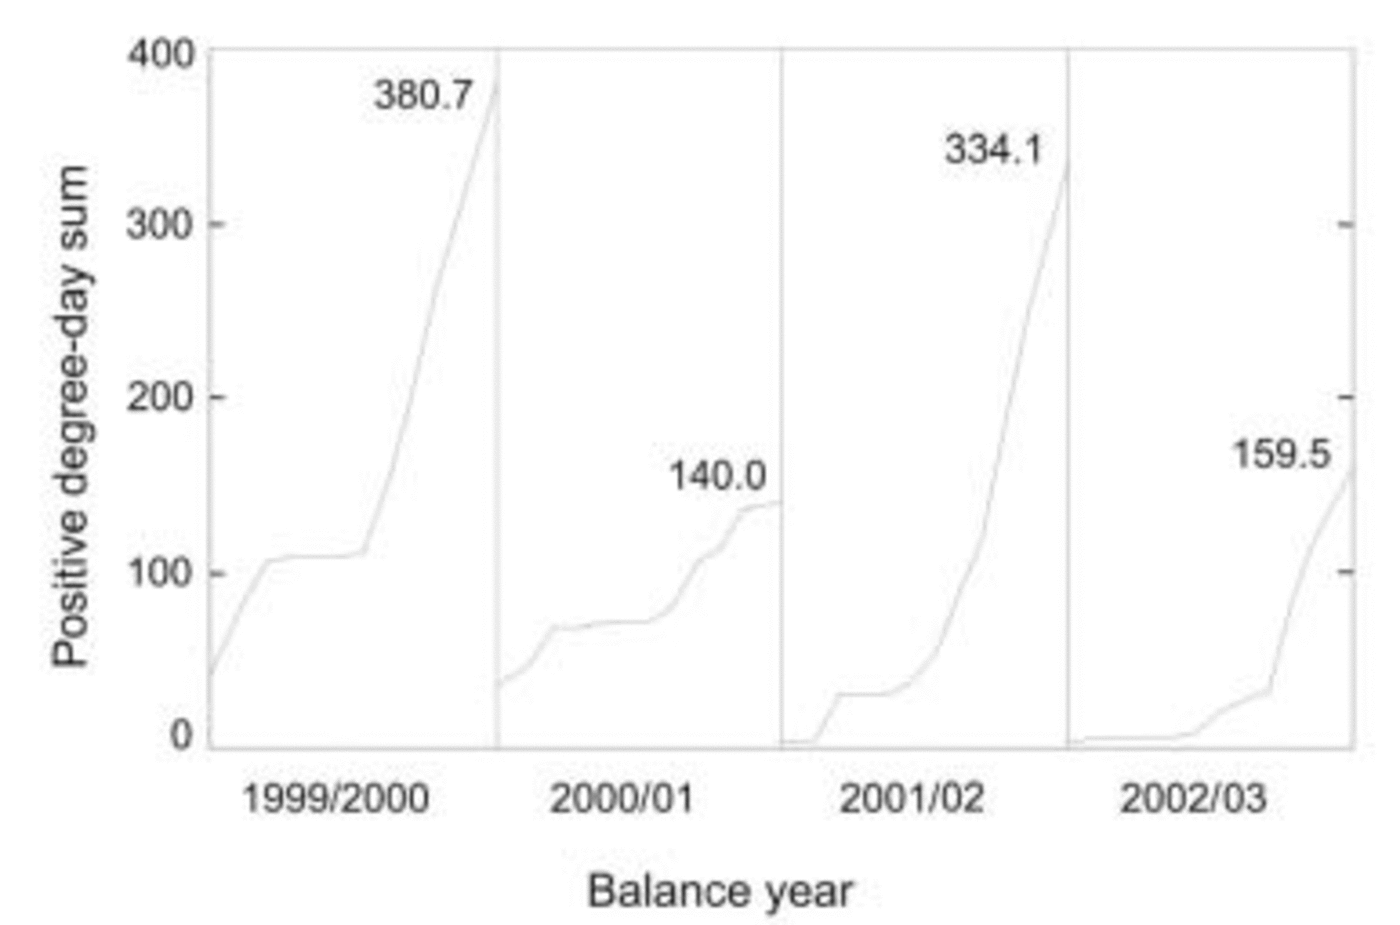
The thinning rates averaged over the lower part of GBD surveyed during the period of mass balance are closely related to positive degree-day (PDD) sums. Figure 6 shows monthly PDD sums (in degree-days) derived from VIAWS during the period of mass-balance surveys. In 1999/2000 the thinning rate increased considerably to 1.6ma–1, from 1.0ma–1 in 1985–98, due to a very warm summer with a PDD of 381 degree-days. During the balance year 2000/01, MSAT was low (–0.8˚C) (140 degree-days), and the thinning rate sharply decreased to 0.4ma–1. The rate of lowering averaged over 2001–03 increased to 1.4ma–1 because of very high summer temperatures in 2001/02, the warmest summer recorded in the northeastern AP region since 1903 (Reference Skvarca, De Angelis, Domack, Leventer, Conley, Kirby and BindschadlerSkvarca and De Angelis, 2003). The PDD sums for balance years 2001/02 and 2002/03 were 334 and 160 degree-days, respectively (Fig. 6). It can be argued that the observed response of GBD could also be a result of changes in its internal polythermal condition, since it is known that the thermal state of subpolar ice masses can be severely affected by climate change (Reference Blatter and HutterBlatter and Hutter, 1991). However, the lack of sufficient englacial temperature observations prevents us from further assessing the thermodynamics.
Cumulative positive degree-day (PDD) during balance years as derived from VIAWS.
An indication that ice is also thinning on the southwestern AP is given by surface lowering detected between 1989 and 1997 on the ~600m long ice ramp at Rothera Point (RP; 67.57˚ S, 68.12˚ W) in Marguerite Bay, associated with long term-increase in air temperature and decrease in surface mass balance (Reference Smith, Vaughan, Doake and JohnsonSmith and others, 1998). Although MAATs at both sites are very similar (RP: –6.4˚C; GBD: –5.5˚C), the mean thinning rate of 0.32 ma–1 reported for RP ice ramp is lower than the 1.0ma–1 surface lowering of GBD averaged over a larger area and longer period (1985–98). This might be explained by different climatic regimes, continental and maritime, affecting the eastern and western AP, respectively (Reference SchwerdtfegerSchwerdtfeger, 1984). Detection of ice thinning and negative mass balances of ice masses on both sides of the AP are a clear indicator of the general warming trend affecting this region.
Conclusions
The results of direct mass-balance measurements clearly indicate that GBD was wasting mass from 1999 to 2003, at a mean rate of 0.32 mw.e. a–1. However, the data on glacier thinning rates available since 1985 and the high correlation between VIAWS and nearby Esperanza weather station, which shows MSATs at or above 0˚C from 1980 to the present, suggest that negative balances extended back at least to the mid-1980s. Therefore, GBD probably has had a negative mass budget over the last two decades due to the increasing warming trend. This is supported by measurements of glacier thinning since 1985.
Acknowledgements
The authors express their thanks to T. Toconás, J.C. Quinteros and D. Lepe for their efficient support during field campaigns. Discussions with P. Holmlund and P. Jansson, as well as comments made by G. Casassa, A. Fountain and M. Hoelzle, helped greatly to improve the manuscript. This work is a contribution to the project ‘Interaccion Hielo-Clima y Dinámica de Glaciares en Península Antártica y Patagonia Austral’, funded by Direcciόn Nacional del Antártico–Instituto Antártico Argentino.



