1. Introduction
Dense suspensions are materials with broad applications both in industrial processes (e.g. waste disposal, concrete, drilling muds, metalworking chip transport and food processing) and in natural phenomena (e.g. flows of slurries, debris and lava). In most applications, these suspensions generally consist of solid particles with a broad range of sizes. Often, the fine colloidal particles interact to constitute a non-Newtonian fluid exhibiting a yield stress. This effective fluid can then act as a suspending fluid able to carry the coarser solid particles. There is a compelling need to capture the rheological behaviour of these complex suspensions in order to predict their flow in various practical situations. This is precisely the objective of the present paper, which aims at understanding the rheology of dense suspensions of non-colloidal spherical particles suspended in a yield-stress fluid.
Over the last century, there has been extensive work on the rheology of Newtonian suspensions, i.e. suspensions composed of a Newtonian suspending fluid and non-colloidal particles interacting mainly through hydrodynamics (see, e.g., Guazzelli & Morris Reference Guazzelli and Morris2012). In the case of neutrally buoyant solid spheres subjected to a steady shear flow, the linearity of the Stokes equation implies that the scaling of the shear stress
 ${\it\tau}$
is viscous, i.e.
 ${\it\tau}={\it\eta}_{s}({\it\phi})\,{\it\eta}_{f}\dot{{\it\gamma}}$
, where
 $\dot{{\it\gamma}}$
is the shear rate and
 ${\it\eta}_{f}$
is the viscosity of the suspending Newtonian fluid. The dimensionless effective shear viscosity
 ${\it\eta}_{s}$
only depends on the particle volume fraction
 ${\it\phi}$
, and increases with increasing
 ${\it\phi}$
, diverging at maximum packing fraction,
 ${\it\phi}_{m}$
. In addition to this quasi-Newtonian shear-stress law, there exists a particle normal stress
 $P$
which also scales viscously. To be more precise,
 $P$
is linear in the modulus of the shear rate, because it must be independent of the sign of the shear rate (Hinch Reference Hinch2011). It can be written as
 $P={\it\eta}_{n}({\it\phi})\,{\it\eta}_{f}\dot{{\it\gamma}}$
, where
 $\dot{{\it\gamma}}$
is conveniently defined in an invariant form as
 $\dot{{\it\gamma}}=\sqrt{2\,\unicode[STIX]{x1D640}:\unicode[STIX]{x1D640}}$
where
 $\unicode[STIX]{x1D640}$
is the rate of strain. The dimensionless effective normal viscosity
 ${\it\eta}_{n}$
is again a sole function of
 ${\it\phi}$
, and presents the same divergence as
 ${\it\eta}_{s}({\it\phi})$
when approaching jamming at
 ${\it\phi}_{m}$
.
There is an equivalent approach to this classical view in terms of effective viscosities, which comes from the rheology of dry granular materials and hinges on a frictional view of the problem (see, e.g., Andreotti et al.
Reference Andreotti, Forterre and Pouliquen2013). When an assembly of particles is subjected to steady shear under a confining particle pressure
 $P$
, there is only one dimensionless control parameter, a dimensionless shear rate which can be interpreted as the ratio of the time scale for particles to rearrange due to the pressure
 $P$
to the time scale of the flow
 $\dot{{\it\gamma}}^{-1}$
. The friction
 ${\it\mu}={\it\tau}/P$
and the volume fraction
 ${\it\phi}$
are sole functions of this dimensionless number. In the case of immersed granular media, when viscous forces are dominant, the dimensionless number is
 $J={\it\eta}_{f}\dot{{\it\gamma}}/P$
and is viscous, in contrast to dry granular flows where it is inertial (Lemaître et al.
Reference Lemaître, Roux and Chevoir2009). Using an original pressure-imposed shear cell, Boyer et al. (Reference Boyer, Guazzelli and Pouliquen2011) found that
 ${\it\mu}(J)$
and
 ${\it\phi}(J)$
once again collapse onto universal curves. This alternative way of looking at suspensions enabled them to circumvent the divergence observed in volume-imposed rheometry and provided examination of the rheology close to the jamming transition. In particular, this approach yields accurate measurements of the particle pressure, a quantity not often easily captured.
While the rheology of Newtonian suspensions is a rather mature subject, much less is known for suspensions of solid particles in a yield-stress fluid (also termed viscoplastic fluid). The understanding of these fluids themselves (i.e. even in the absence of particles) has not been fully achieved, and is a very active body of research (see, e.g., Balmforth et al. Reference Balmforth, Frigaard and Ovarlez2014). Some work has been undertaken on flows around a single particle in a viscoplastic fluid, in particular in settling (or rising) situations where the yield stress competes with buoyancy and eventually holds the particle stationary (for a recent review see Maleki et al. Reference Maleki, Hormozi, Roustaei and Frigaard2015). Progressing beyond a single sphere and tackling the dynamics of multiple particles is a much more difficult task. In particular, the nonlinearity of the fluid rheological law makes the Stokes viscoplastic equations nonlinear, and thus the viscoplastic versions of the analytical results and numerical methods available in the Newtonian case are still out of reach.
Viscoplastic suspensions can be alternatively addressed from a continuum-level closure perspective. The fundamental objective is then to characterise their rheological properties according to the particle concentration and properties of the interstitial fluid. The addition of particles to a yield-stress fluid usually induces an increasingly marked enhancement of the viscosity (to be more precise, the consistency) and the yield stress (Ancey & Jorrot Reference Ancey and Jorrot2001; Geiker et al. Reference Geiker, Brandl, Thrane and Nielsen2002; Erdogan Reference Erdogan2005; Mahaut et al. Reference Mahaut, Chateau, Coussot and Ovarlez2008; Mahaut Reference Mahaut2009). These observations are consistent with a nonlinear homogenisation approach proposed by Chateau et al. (Reference Chateau, Ovarlez and Trung2008), although the agreement is not fully satisfactory due to large experimental scatters. Further assessment of the rheological properties of these viscoplastic suspensions is clearly needed, in particular in the concentrated regime where only scarce data are available. This is precisely the objective of the present work.
In this paper, we propose to use a pressure-imposed shear cell derived from that of Boyer et al. (Reference Boyer, Guazzelli and Pouliquen2011) to explore the rheology of non-colloidal suspensions composed of a yield-stress fluid and neutrally buoyant solid spheres in the dense regime. The experimental apparatus and methods are presented in § 2. The rheological measurements are presented in § 4 in the light of scaling arguments and modelling assumptions introduced in § 3. Conclusions are drawn in § 5.
2. Experiments
2.1. Particles and fluids
A single batch of polystyrene spheres (Dynoseeds TS 500, Microbeads SA) having a density of 1.05 and a diameter
 $d=580\pm 10~{\rm\mu}\text{m}$
was used in the experiments. These large particles are insensitive to Brownian motion and colloidal interactions. Four suspending fluids having different rheological behaviours were selected. A test case Newtonian fluid was chosen to be polyethylene glycol-ran-propylene glycol monobutylether of viscosity
 ${\it\eta}=2.27~\text{Pa}~\text{s}$
at a temperature of 24 °C and of density closely matched to that of the particles. The three other non-Newtonian suspending fluids were emulsions of water droplets in dodecane at different water volume percentages (68 %, 72 % and 80 %). Span 80 was added to the oil phase as a stabiliser and salt to the water phase to ensure neutral buoyancy of the particles. The emulsions were prepared with a Silverson L5M emulsifier according to the following protocol: water was added gradually to the oil with the motor of the emulsifier at 1000 r.p.m., then the speed was raised by plateaus of 1000 r.p.m. to reach a final value of 6000 r.p.m., each plateau lasting 20 min. This protocol ensured reproducible as well as stable emulsions with droplet size ranging between 1 and 10 μm.
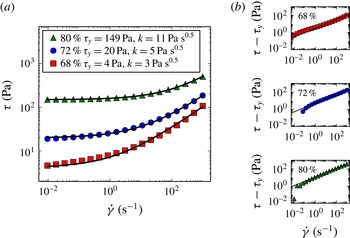
The rheological behaviours of the emulsions were inferred from accurate measurements with an MCR 501 (Anton Paar) rheometer. They all followed a Herschel–Bulkley law given by
 $$\begin{eqnarray}{\it\tau}={\it\tau}_{y}+k\dot{{\it\gamma}}^{n},\end{eqnarray}$$
as displayed by the solid lines in figure 1. Changing the water volume percentage changed the yield stress
 ${\it\tau}_{y}$
and the consistency
 $k$
, but did not significantly change the exponent
 $n$
, which stayed close to
 $n\simeq 0.5$
. We chose to fix
 $n$
at this value of 0.5 in fitting equation (2.1). No thixotropic effect was noticed. Ageing by oil evaporation was greatly reduced by insulating the shear cell, and was found to be inconsequential in the present rheological measurements (which are described in the following two sections) with regard to the large dimension of the apparatus (a few centimetres in depth) and time scale of the experiments (a couple of days at most).
(a) Rheological curves,
 ${\it\tau}$
versus
 $\dot{{\it\gamma}}$
, of the emulsions at different water volume percentages (68 %, 72 % and 80 %). (b) Log–log plots exhibiting that the exponent
 $n\simeq 0.5$
.

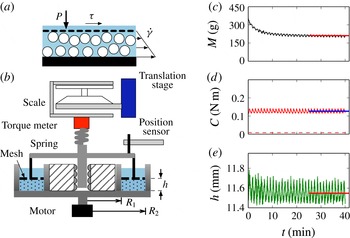
(a) Principle of the pressure-imposed rheometry: the porous plate exerts a pressure (
 $P$
) on the grains while the suspension is sheared (
 $\dot{{\it\gamma}}$
) and the shear stress (
 ${\it\tau}$
) is measured. (b) Sketch of the experimental apparatus. Measurements of (c) the weight of the top plate, (d) the torque and (e) the position of the top plate, for a rotation speed of
 ${\it\omega}=8.6\times 10^{-2}~\text{rad s}^{-1}$
and a target position
 $h=11.55~\text{mm}$
. After a transient regime, the system reaches a stationary state from which average quantities are extracted (horizontal solid lines on the graphs).

2.2. Experimental apparatus
The experiments were conducted with an apparatus derived from that of Boyer et al. (Reference Boyer, Guazzelli and Pouliquen2011), which was specifically designed to impose a pressure on the particle phase of the suspension, as sketched in figure 2(a). The shear cell consisted of two parts: a bottom annular cylinder (
 $R_{1}=43.95~\text{mm}$
,
 $R_{2}=90.28~\text{mm}$
,
 $H=29.00~\text{mm}$
) that contained the suspension and rotated, and a top cover plate that did not rotate but could be moved vertically and inserted into the annulus through a precise alignment ensured by a linear bearing, see figure 2(b). It should be noted that the two parallel bottom and top plates were made rough by positioning regularly spaced stripes of 0.5 mm height and width onto their surfaces. It should also be noted that the plate–plate geometry was chosen since no shear-induced migration is observed in that case (see, e.g., Morris & Boulay Reference Morris and Boulay1999).
The important feature was that the fluid could flow through the top plate, as this plate had been made porous by being manufactured with 2–5 mm holes covered by a 0.2 mm nylon mesh. In a typical experimental run, the annulus was first filled with the desired amount of fluid and particles. The porous top plate was then slowly lowered to the desired position. The bottom annular cylinder was rotated until steady state was achieved, see figure 2(c–e). From the measurements of the position of the top plate, the rotation rate of the bottom annulus and the normal force and torque exerted on the top plate, it was then possible to extract the volume fraction
 ${\it\phi}$
, the shear rate
 $\dot{{\it\gamma}}$
, the particle pressure
 $P$
and the shear stress
 ${\it\tau}$
. It should be noted that the so-called measured pressure
 $P$
was the pressure exerted by the particles on the top plate and corresponded to the particle normal stress in the gradient direction.
2.3. Experimental techniques
To be more specific, the experimental apparatus and measuring devices are sketched in figure 2(b). The torque exerted on the top plate was measured by a torque transducer (TEI-CFF401), see figure 2(d). A vertical spring was inserted between the torque transducer and the top plate to provide some softness to the whole system. The ensemble comprising the top plate and the torque transducer was suspended from a precision scale (Mettler-Toledo XS6002S) which measured the apparent weight of the top plate used for the determination of the granular pressure
 $P$
, see figure 2(c). The scale was itself placed on a vertical translation stage driven by a LabVIEW code which imposed either the granular pressure via a feedback loop involving the scale measure or the position of the top plate measured independently by a position sensor (Novotechnik T-50), see figure 2(e). The position
 $h$
of the top plate together with the knowledge of the mass
 $M_{g}$
of the particles provided the volume fraction
 ${\it\phi}=M_{g}/{\it\rho}_{f}hS$
(with
 ${\it\rho}_{f}$
the fluid density and
 $S$
the cell surface area). Finally, the bottom cell was rotated at a rotation rate
 ${\it\Omega}$
by an asynchronous motor (Parvalux SD18) controlled by a frequency controller (Omron MX2 0.4 kW) which spanned over three decades of rotation speed. The mean shear rate was then written as
 $\dot{{\it\gamma}}={\it\Omega}(R_{2}+R_{1})/2h$
.
Care should be taken in the evaluation of the shear stress from the torque measurements. The measured torque indeed comprised not only the bulk suspension contribution
 $C_{\mathit{bulk}}$
but also undesired contributions resulting from the friction at the central axis and the shear in the thin gap between the top plate and the cell walls. These additional contributions were carefully evaluated by performing preliminary measurements with pure suspending fluids, and then fitted and subtracted from the measurements with the particles. These preliminary measurements also enabled measurement of the buoyancy force exerted by the fluid on the top plate, which was also subtracted from the scale measurements to obtain the particle normal stress. Finally, the mean shear stress
 ${\it\tau}$
was deduced from the bulk torque
 $C_{\mathit{bulk}}$
assuming that the local shear stress varies linearly with the local shear rate (which varies linearly with the radial position) as
 ${\it\tau}=C_{\mathit{bulk}}(R_{1}+R_{2})/{\rm\pi}(R_{2}^{4}-R_{1}^{4})$
. This assumption is certainly inaccurate when the suspending fluid is non-Newtonian. It was used nonetheless since, when using non-Newtonian rheological laws such as a pure plastic or a pure shear-thinning law, the resulting error was less than 5 % given the dimensions of the shear cell.
3. Scaling arguments and modelling
As mentioned in § 1, for a suspension consisting of neutrally buoyant spheres in a Newtonian fluid of viscosity
 ${\it\eta}_{f}$
, the use of dimensional analysis is sufficient to infer the general form of the constitutive laws. The only stress scale is given by a viscous stress. Consequently, the shear stress
 ${\it\tau}$
and particle pressure
 $P$
developing in the suspension sheared under a constant shear rate
 $\dot{{\it\gamma}}$
at concentration
 ${\it\phi}$
are given by
 $$\begin{eqnarray}{\it\tau}={\it\eta}_{f}{\it\eta}_{s}({\it\phi})\dot{{\it\gamma}}\quad \text{and}\quad P={\it\eta}_{f}{\it\eta}_{n}({\it\phi})\dot{{\it\gamma}}.\end{eqnarray}$$
The rheology thus reduces to the knowledge of the two functions
 ${\it\eta}_{s}({\it\phi})$
and
 ${\it\eta}_{n}({\it\phi})$
which are known to diverge in a similar way at maximum volume fraction
 ${\it\phi}_{m}$
.
In the case of a suspension consisting of neutrally buoyant spheres in a yield-stress fluid following a Herschel–Bulkley equation (2.1), dimensional arguments no longer provide the full form of the constitutive laws as the yield stress
 ${\it\tau}_{y}$
introduces an additional stress scale. One can just write the following two relations for the shear stress and pressure:
 $$\begin{eqnarray}\frac{{\it\tau}}{k\dot{{\it\gamma}}^{n}}={\it\tau}^{\ast }\left(\frac{{\it\tau}_{y}}{k\dot{{\it\gamma}}^{n}},{\it\phi}\right)\quad \text{and}\quad \frac{P}{k\dot{{\it\gamma}}^{n}}=P^{\ast }\left(\frac{{\it\tau}_{y}}{k\dot{{\it\gamma}}^{n}},{\it\phi}\right).\end{eqnarray}$$
Additional assumptions are thus needed in order to obtain the detailed constitutive laws. One can first assume that the dynamics of the particles close to
 ${\it\phi}_{m}$
is mainly controlled by geometrical constraints and is independent of the nature of the suspending fluid. The constitutive laws close to jamming are thus supposed to have a form similar to that for a Newtonian suspending fluid, and are written as
 $$\begin{eqnarray}{\it\tau}={\it\eta}_{ap}{\it\eta}_{s}({\it\phi})\dot{{\it\gamma}}\quad \text{and}\quad P={\it\eta}_{ap}{\it\eta}_{n}({\it\phi})\dot{{\it\gamma}},\end{eqnarray}$$
where
 ${\it\eta}_{s}({\it\phi})$
and
 ${\it\eta}_{n}({\it\phi})$
are identical to the functions found in the Newtonian suspensions and
 ${\it\eta}_{\mathit{ap}}$
is the apparent averaged viscosity seen by the particles. In a non-Newtonian fluid, the apparent viscosity itself depends on the shear rate. Adopting a homogenisation point of view, we can then assume that an averaged local shear rate
 $\dot{{\it\gamma}}_{\mathit{local}}$
can be defined. This corresponds to the typical shear rate that developed in the interstices between the particles during shear. For a yield-stress fluid, the apparent viscosity can be simply related to the local shear rate in the following way:
 $$\begin{eqnarray}{\it\eta}_{ap}=\frac{{\it\tau}_{y}+k\dot{{\it\gamma}}_{\mathit{local}}^{n}}{\dot{{\it\gamma}}_{\mathit{local}}}.\end{eqnarray}$$
The last step consists in relating the local shear rate
 $\dot{{\it\gamma}}_{\mathit{local}}$
to the macroscopic shear rate
 $\dot{{\it\gamma}}$
. If one again assumes that the local shear rate is solely imposed by the dynamics of the particles which is supposed to be mainly controlled by geometrical constraints, one can then write
 $$\begin{eqnarray}\dot{{\it\gamma}}_{\mathit{local}}=\dot{{\it\gamma}}\mathscr{F}({\it\phi}),\end{eqnarray}$$
where
 $\mathscr{F}({\it\phi})$
is a sole function of
 ${\it\phi}$
which is to be determined. Different theoretical arguments can be found in the literature to derive the function
 $\mathscr{F}({\it\phi})$
which will be discussed in §§ 4 and 5. At the present stage, we keep
 $\mathscr{F}({\it\phi})$
as an unknown function, and combining the above equations (3.3a,b
)–(3.5), the constitutive laws can be written as
 $$\begin{eqnarray}\displaystyle {\it\tau}=\frac{{\it\eta}_{s}({\it\phi})}{\mathscr{F}({\it\phi})}({\it\tau}_{y}+k\dot{{\it\gamma}}^{n}\mathscr{F}({\it\phi})^{n}), & & \displaystyle\end{eqnarray}$$
 $$\begin{eqnarray}\displaystyle P=\frac{{\it\eta}_{n}({\it\phi})}{\mathscr{F}({\it\phi})}({\it\tau}_{y}+k\dot{{\it\gamma}}^{n}\mathscr{F}({\it\phi})^{n}). & & \displaystyle\end{eqnarray}$$
4. Results
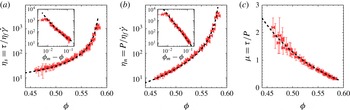
We start by presenting the rheological data for the test Newtonian case in figure 3. The key features found by Boyer et al. (Reference Boyer, Guazzelli and Pouliquen2011) are recovered. As expected by the viscous scaling for the stresses, the Newtonian suspension rheology is fully described by the dimensionless effective shear and normal viscosities
 ${\it\eta}_{s}({\it\phi})$
and
 ${\it\eta}_{n}({\it\phi})$
, which both increase with increasing
 ${\it\phi}$
. These viscosities do present the same divergence
 $({\it\phi}-{\it\phi}_{m})^{-2}$
, as demonstrated by the finite value
 ${\it\mu}_{0}\approx 0.3$
reached by
 ${\it\mu}={\it\eta}_{s}/{\it\eta}_{n}$
when
 ${\it\phi}\rightarrow {\it\phi}_{m}\approx 0.585$
. Since we address the dense-suspension regime, we choose to fit the data for
 ${\it\mu}$
by an expansion in
 $({\it\phi}_{m}-{\it\phi})/{\it\phi}$
close to jamming,
 $$\begin{eqnarray}{\it\mu}({\it\phi})={\it\mu}_{0}+{\it\alpha}\left(\frac{{\it\phi}_{m}-{\it\phi}}{{\it\phi}}\right)+{\it\beta}\left(\frac{{\it\phi}_{m}-{\it\phi}}{{\it\phi}}\right)^{2},\end{eqnarray}$$
with
 ${\it\alpha}=4.6$
and
 ${\it\beta}=6$
, see the dashed line in figure 3(c). Following Boyer et al. (Reference Boyer, Guazzelli and Pouliquen2011), the rheological law for
 ${\it\eta}_{n}$
is written as
 $$\begin{eqnarray}{\it\eta}_{n}({\it\phi})={\it\kappa}\left(\frac{{\it\phi}_{m}-{\it\phi}}{{\it\phi}}\right)^{-2},\end{eqnarray}$$
with a coefficient
 ${\it\kappa}=0.75$
similar to that proposed by Morris & Boulay (Reference Morris and Boulay1999), see the dashed line in figure 3(b). The rheological law for
 ${\it\eta}_{s}$
is then just given by
 $$\begin{eqnarray}{\it\eta}_{s}({\it\phi})={\it\mu}({\it\phi}){\it\eta}_{n}({\it\phi}),\end{eqnarray}$$
see the dashed line in figure 3(a).
Newtonian rheological data (bowties) and fitted rheological laws (dashed lines) for (a)
 ${\it\eta}_{s}={\it\tau}/{\it\eta}_{f}\dot{{\it\gamma}}$
, (b)
 ${\it\eta}_{n}=P/{\it\eta}_{f}\dot{{\it\gamma}}$
and (c)
 ${\it\mu}={\it\tau}/P$
versus
 ${\it\phi}$
. Insets: the same plots versus
 ${\it\phi}_{m}-{\it\phi}$
.

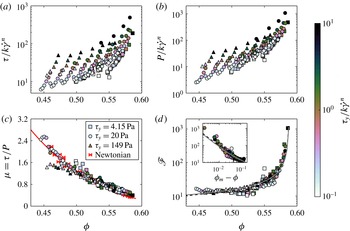
Non-Newtonian rheological data and fitted rheological laws for (a)
 ${\it\tau}/k\dot{{\it\gamma}}^{n}$
, (b)
 $P/k\dot{{\it\gamma}}^{n}$
, (c)
 ${\it\mu}={\it\tau}/P$
(red solid line: (4.1)) and (d)
 $\mathscr{F}$
versus
 ${\it\phi}$
(grey line:
 $2.8\sqrt{{\it\eta}_{s}({\it\phi})}$
; black dashed line:
 $2\sqrt{{\it\eta}_{s}({\it\phi})/1-{\it\phi}}$
; inset:
 $\mathscr{F}$
versus
 ${\it\phi}_{m}-{\it\phi}$
). The symbols correspond to the suspending fluids and the colourmap to the range of
 ${\it\tau}_{y}/k\dot{{\it\gamma}}^{n}$
.

We now turn to the rheological data obtained with the three yield-stress suspending fluids. As the yield stress
 ${\it\tau}_{y}$
introduces an additional stress scale, the rheology of these viscoplastic suspensions is no longer described by a single dimensionless parameter, as evidenced in figure 4(a,b) where
 ${\it\tau}/k\dot{{\it\gamma}}^{n}$
and
 $P/k\dot{{\it\gamma}}^{n}$
are plotted against
 ${\it\phi}$
for different values of
 ${\it\tau}_{y}/k\dot{{\it\gamma}}^{n}$
. However, all the data including those for the Newtonian case collapse onto a single curve
 ${\it\tau}/P={\it\mu}({\it\phi})$
in figure 4(c), as predicted by the constitutive laws (3.3a,b
). The expansion (4.1) again yields an excellent estimate for this curve in the dense regime, as shown by the red solid line in figure 4(c). We can go further in the testing of the rheological modelling presented in § 3. By injecting the measured values of
 ${\it\tau}$
,
 $P$
and
 $\dot{{\it\gamma}}$
into the constitutive laws (3.6) or (3.7), we can infer the values of the function
 $\mathscr{F}$
relating the local to the macroscopic shear rate for each measurement. We can show that, when plotted against
 ${\it\phi}$
, these values collapse onto a single master curve
 $\mathscr{F}({\it\phi})$
, see figure 4(d). In the dense regime explored (
 ${\it\phi}\gtrsim 0.45$
), the obtained values are in equal agreement with the model of Chateau et al. (Reference Chateau, Ovarlez and Trung2008),
 $\mathscr{F}({\it\phi})\propto \sqrt{{\it\eta}_{s}({\it\phi})/(1-{\it\phi})}$
(solid line in figure 4(d)), and with a prediction that can be deduced from Lerner et al. (Reference Lerner, Düring and Wyart2012),
 $\mathscr{F}({\it\phi})\propto \sqrt{{\it\eta}_{s}({\it\phi})}$
(dashed line in figure 4(d)), with adjustable coefficients of 2 and 2.8 respectively. In the following we select
 $\mathscr{F}({\it\phi})=2\sqrt{{\it\eta}_{s}({\it\phi})/(1-{\it\phi})}$
. It should be emphasised that the collapse of both
 ${\it\mu}({\it\phi})$
and
 $\mathscr{F}({\it\phi})$
gives strong support to the assumptions made in § 3.
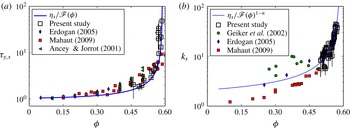
Dimensionless effective (a) yield-stress
 ${\it\tau}_{y,s}$
and (b) consistency
 $k_{s}$
of the viscoplastic suspensions versus
 ${\it\phi}$
.

As deduced from equation (3.6) and previously found by Chateau et al. (Reference Chateau, Ovarlez and Trung2008), the properties of these viscoplastic suspensions can be satisfactorily modelled as that of a Herschel–Bulkley fluid with an exponent equal to that of the suspending fluid,
 $$\begin{eqnarray}{\it\tau}={\it\tau}_{y,s}({\it\phi}){\it\tau}_{y}+k_{s}({\it\phi})k\dot{{\it\gamma}}^{n},\end{eqnarray}$$
where the dimensionless effective yield stress and consistency of the viscoplastic suspensions are sole functions of
 ${\it\phi}$
. This is evidenced in figure 5, where
 ${\it\tau}_{y,s}$
and
 $k_{s}$
inferred from the present rheological measurements (▫) have been plotted versus
 ${\it\phi}$
. Good agreement is found with the dimensionless effective yield stress and consistency (solid lines) given by the model presented in § 3,
 $$\begin{eqnarray}{\it\tau}_{y,s}={\it\eta}_{s}({\it\phi})/\mathscr{F}({\it\phi})\quad \text{and}\quad k_{s}={\it\eta}_{s}({\it\phi})/\mathscr{F}({\it\phi})^{1-n},\end{eqnarray}$$
where
 ${\it\eta}_{s}({\it\phi})$
is the dimensionless effective shear viscosity measured for the test Newtonian suspending fluid and given by equation (4.3), and
 $\mathscr{F}({\it\phi})$
is the fitted curve in figure 4(d). Favourable comparison is found with the data found in the literature (Ancey & Jorrot Reference Ancey and Jorrot2001; Geiker et al.
Reference Geiker, Brandl, Thrane and Nielsen2002; Erdogan Reference Erdogan2005; Mahaut Reference Mahaut2009). It should be noted that the present experiments provide data in the dense regime
 ${\it\phi}\gtrsim 0.45$
, in particular for the consistency where only scarce and scattered data could be found in the literature.
Finally, we can alternatively address the rheology of these viscoplastic suspensions by adopting a pressure-imposed approach instead of the classical concentration-imposed approach presented in the two preceding paragraphs (Boyer et al.
Reference Boyer, Guazzelli and Pouliquen2011). Two dimensionless parameters
 $J=k\dot{{\it\gamma}}^{n}/P$
and
 $J_{y}={\it\tau}_{y}/P$
are needed to describe these systems, and the friction coefficient and volume fraction must be functions of both,
 $$\begin{eqnarray}{\it\tau}/P={\it\mu}(J_{y},J)\quad \text{and}\quad {\it\phi}={\it\phi}(J_{y},J).\end{eqnarray}$$
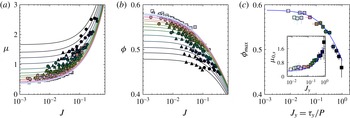
The experimental data presented in figure 4(a,b) are replotted in figure 6(a,b) in terms of this pressure-imposed framework, i.e.
 ${\it\mu}$
and
 ${\it\phi}$
against
 $J$
for different values of
 $J_{y}$
. The rheological model presented in § 3 can be reshaped within this framework. First,
 ${\it\phi}(J_{y},J)$
can be numerically computed by using equation (3.7) divided by
 $P$
,
 $$\begin{eqnarray}1=\frac{{\it\eta}_{n}({\it\phi})}{\mathscr{F}({\it\phi})}(J_{y}+J\mathscr{F}({\it\phi})^{n}).\end{eqnarray}$$
The friction can then be deduced from (4.1). These calculations provide the dependence of
 ${\it\mu}$
and
 ${\it\phi}$
on
 $J$
and
 $J_{y}$
as written in (4.6a,b
). This modelling is tested against the experimental data in figure 6(a,b) (solid lines). Good agreement is observed. Strikingly, the maximum volume fraction reached when
 $J\rightarrow 0$
decreases for increasing
 $J_{y}$
, see figure 6(b). These maximum values
 ${\it\phi}_{\mathit{max}}$
have been estimated as the measurements taken at the smallest
 $J$
for a given
 $J_{y}$
, and are plotted in figure 6(c) versus
 $J_{y}$
. Good agreement is again recovered by comparing with the theoretical value that is given by (4.7) at
 $J=0$
, see the solid line in figure 6(c). This decrease of
 ${\it\phi}_{\mathit{max}}$
with increasing
 $J_{y}$
can be understood as the resistance of the yield-stress fluid to the squeezing between particles. Moreover, the quasi-static friction coefficient
 ${\it\mu}_{0,s}$
at
 $J=0$
increases with
 $J_{y}$
(see the inset of figure 6(c)) in a way reminiscent of what is seen in cohesive suspensions (Rognon et al.
Reference Rognon, Roux, Naaïm and Chevoir2008).
Non-Newtonian frictional rheological data and fitted rheological laws for (a)
 ${\it\mu}$
and (b)
 ${\it\phi}$
versus
 $J=k\dot{{\it\gamma}}^{n}/P$
for different
 $J_{y}={\it\tau}_{y}/P$
. The symbols correspond to the suspending fluids and the colourmap to the range of
 $J_{y}$
. (c) Maximum volume fraction
 ${\it\phi}_{max}$
(inset: quasi-static coefficient
 ${\it\mu}_{0,s}$
) reached when
 $J\rightarrow 0$
for a given
 $J_{y}$
. The solid line corresponds to the theoretical value that is given by (4.7) at
 $J=0$
.

5. Conclusions
Using a pressure-imposed rheometry derived from that of Boyer et al. (Reference Boyer, Guazzelli and Pouliquen2011), we have investigated the rheology of non-colloidal suspensions composed of a yield-stress fluid and neutrally buoyant solid spheres. Accurate measurements for both the shear stress and the particle normal stress have been obtained in the dense regime (
 ${\it\phi}\gtrsim 0.45$
).
The rheological measurements are in agreement with a model based on scaling arguments and homogenisation methods. In particular, all of the data, including a Newtonian test case, show a perfect collapse of
 ${\it\tau}/P={\it\mu}({\it\phi})$
. This demonstrates unambiguously that the dynamics of the particles close to jamming is mainly controlled by geometrical constraints and is independent of the suspending fluid. This scaling approach has been further tested by inferring the function relating the local shear rate seen by the particles to the macroscopic shear rate imposed by the rheological flow, and by showing that an excellent collapse is obtained with a sole dependence on
 ${\it\phi}$
. This experimental master curve
 $\mathscr{F}({\it\phi})$
agrees well with an expression derived from a nonlinear homogenisation approach by Chateau et al. (Reference Chateau, Ovarlez and Trung2008),
 $\mathscr{F}({\it\phi})\propto \sqrt{{\it\eta}_{s}({\it\phi})/(1-{\it\phi})}$
, but with a coefficient of
 $2$
. It also seems to agree with an expression that can be deduced from the study of jamming by Lerner et al. (Reference Lerner, Düring and Wyart2012),
 $\mathscr{F}({\it\phi})\propto \sqrt{{\it\eta}_{s}({\it\phi})}$
, but with a coefficient of 2.8. Such expressions for
 $\mathscr{F}({\it\phi})$
are clearly incorrect when
 ${\it\phi}\rightarrow 0$
and are thus only valid in the concentrated range of volume fractions explored in the present rheological measurements. This is probably the signature of a more complex variation of the function
 $\mathscr{F}$
over the full range of
 ${\it\phi}$
which needs to be further investigated.
As previously found by Chateau et al. (Reference Chateau, Ovarlez and Trung2008), the properties of the viscoplastic suspensions can be satisfactorily modelled as those of a Herschel–Bulkley fluid with an exponent equal to that of the suspending fluid. The dimensionless effective yield stress and consistency are found to be sole functions of
 ${\it\phi}$
that can be deduced from the knowledge of
 $\mathscr{F}({\it\phi})$
and the dimensionless effective viscosity
 ${\it\eta}_{s}({\it\phi})$
of the test Newtonian suspending fluid.
The present study opens new perspectives in the study of even more complex particulate systems, as the knowledge of the rheological constitutive laws in the Newtonian case and the calculation of the function relating the local to the macroscopic shear rate seem to be the sole ingredients needed to infer the rheological properties of these suspensions. This can be, in particular, extended to shear-thinning or shear-thickening suspending fluids along the same lines as in Liard et al. (Reference Liard, Martys, George, Lootens and Hebraud2012).
Acknowledgements
This work was undertaken under the auspices of ANR projects ‘Dense Particulate Systems’ (ANR-13-IS09-0005-01), ‘Laboratoire d’Excellence Mécanique et Complexité’ (ANR-11-LABX-0092) and ‘Initiative d’Excellence’ A∗MIDEX (ANR-11-IDEX-0001-02). It also benefited from funding from Etudes et Productions Schlumberger and discussions with J. Desroches and B. Lecampion. We also thank G. Ovarlez for providing the data of Mahaut (Reference Mahaut2009). S.H. thanks the NSERC Postdoctoral Fellowships Program for support (PDF-439036-2013).