Introduction
Many studies have recently been conducted on short food supply chains. In countries that have undergone a process of agricultural modernization, researchers have examined how these marketing channels offer alternatives to agro-industrial models of production and consumption that promote standardized food products and are supported through agricultural policies (Kloppenburg et al., Reference Kloppenburg, Hendrickson and Stevenson1996; Lyson, Reference Lyson2004; Wiskerke and van der Ploeg, Reference Wiskerke and van der Ploeg2004; Watts et al., Reference Watts, Ilbery and Maye2005; Maye et al., Reference Maye, Holloway and Kneafsey2007). Many authors argue that short supply chains represent a hybrid model between ‘conventional’ and ‘alternative’ food systems (Sonnino and Marsden, Reference Sonnino and Marsden2006; Le Velly and Dufeu, Reference Le Velly and Dufeu2016). At the same time, it is recognized that such channels have the capacity to circumvent and even disrupt an agro-industrial food system that has become increasingly concentrated in the hands of a few giant companies (IPES-Food, 2017).
Stakeholders and practitioners involved in short food supply chains have highlighted the many benefits of direct agricultural marketing (La Trobe, Reference La Trobe2002; Blouin et al., Reference Blouin, Lemay, Ashraf, Imai and Konforti2009; Saltmarsh et al., Reference Saltmarsh, Meldrum and Longhurst2011; Yorn et al., Reference Yorn, Bachant, Puskas and Bisson2012). They argue that closer food networks promote solidarity, a more equitable distribution of profits, fair trade relationships, product quality and benefit the environment by supporting agricultural proximity. Several researchers also point out that direct marketing gives farmers a sense of satisfaction because it allows them to directly engage with customers. Through these exchanges, farmers are also socially recognized for the work they do (Dufour et al., Reference Dufour, Hérault-Fournier, Lanciano, Pennec and Traversac2010; Mundler and Laughrea, Reference Mundler and Laughrea2016). In addition, new research has explored the possibility that direct marketing channels can lead to better health and nutrition outcomes (Martinez et al., Reference Martinez, Hand, Da Pra, Pollack, Ralston, Smith, Vogel, Clark, Lohr, Low and Newman2010; Conner et al., Reference Conner, King, Kolodinsky, Roche, Koliba and Trubek2012; Allen et al., Reference Allen, Rossi, Woods and Davis2016), improve people's sense of taste and reduce greenhouse gas emissions. However, there is a debate around some of the supposed benefits of short supply chains, such as whether reductions in food miles have any real impact on energy consumption (Schlich and Fleissner, Reference Schlich and Fleissner2005; Coley et al., Reference Coley, Howard and Winter2009; Mundler and Rumpus, Reference Mundler and Rumpus2012).
Furthermore, it remains unclear whether shorter food distribution channels are sustainable for farmers who rely on them. The development of short supply chains goes against the current trend of increased labor specialization since the farmers involved are required to take on a series of production, processing (or packaging) and distribution-related tasks. Under these conditions, it is often difficult (in terms of organizing the work) and costly (in terms of investment) for farmers to attain both economies of scale and high levels of productivity in all areas of their business. As other studies have indicated, the problem is especially acute when farmers diversify their production systems to meet client expectations, which further complicates their ability to organize tasks (Aubry et al., Reference Aubry, Bressoud, Petit, Béguin, Dedieu and Sabourin2011; Darduin et al., Reference Darduin, Delanoë, Nicourt and Cabaret2012; Lemay et al., Reference Lemay, Boulianne, Boursiquot and Galarneau2012).
These challenges highlight two important issues regarding how farmers pursue their personal and professional goals. The first is that farmers who mostly sell directly to clients perform work that is both physically and mentally demanding (Dedieu et al., Reference Dedieu, Laurent and Mundler1999; Donham and Larabee, Reference Donham and Larabee2009; Galt et al., Reference Galt, Bradley, Christensen, Van Soelen Kim and Lobo2016; Dumont and Baret, Reference Dumont and Baret2017). Secondly, earnings from short supply chains are relatively modest when compared to the total number of hours worked (Levins, Reference Levins2000; Tegtmeier and Duffy, Reference Tegtmeier and Duffy2005; Feagan and Henderson, Reference Feagan and Henderson2009; Galt, Reference Galt2013; Paul, Reference Paul2019). As a result, farmers who pursue direct marketing often pay a heavy price for the ability to work autonomously from the agro-industrial food system. Many researchers use the term ‘self-exploitation’ to describe this phenomenon and to illustrate the fact that direct marketing networks rely to a large extent on the work that farmers perform to sustain them (Hinrichs, Reference Hinrichs2000; Guthman, Reference Guthman2004; Jarosz, Reference Jarosz2008; Galt, Reference Galt2013; Galt et al., Reference Galt, Bradley, Christensen, Van Soelen Kim and Lobo2016; Hvitsand, Reference Hvitsand2016; Bruce and Som Castellano, Reference Bruce and Som Castellano2017).
In this study, we analyze the earnings of farmers who market in short supply chains. Specifically, we examine the possibility that farmers struggle to integrate production, processing and marketing tasks and have difficulty achieving the same levels of productivity as specialized operators. To explore this question, we analyzed productivity across different activity segments. Our goal in doing so was to verify two hypotheses. The first one relates to the unique range of activities performed on each farm. As previously mentioned, researchers have found that farmers in short supply chains are often poorly compensated for their work. Having said that, we hypothesize that labor productivity can vary from one farm to another, depending on the production sector, work organization patterns and the activity system in place. Our second hypothesis is that objective measures of labor productivity cannot be separated from how farmers themselves subjectively perceive their work. In other words, it is important to account for the degree of satisfaction among farmers with their activity system, the enjoyment they derive from their work and the social recognition they receive. As such, labor earnings cannot simply be evaluated in monetary terms. It is also necessary to determine whether farmers regard their earnings as adequate compensation for the work they perform.
In the first section, we present the social and research context of our study. We begin with a brief overview of short food supply chains in Quebec. This is followed by a review of prior research on direct marketing as it relates to work patterns on farms and farmers' perceptions. The second section presents the farms surveyed and our methodological framework. We finish with a presentation and discussion of the results obtained.
Short food supply chains in Quebec
In Quebec, there are different types of short supply chains, with farmer's markets being the oldest category. In recent years, the number of farmer's markets has been increasing (Lemay et al., Reference Lemay, Boulianne, Boursiquot and Galarneau2012), and there are currently around 150 of them operating across the province. Many farmers in Quebec also sell directly from their farm by running U-pick operations or setting up stands. Products are also sold to clients on an individual basis or through different marketing networks that promote specific themes or regions. In addition, a Community Supported Agriculture (CSA) program, which allows clients to subscribe for a season to a regular basket of organic food, has operated in Quebec since 1995. The CSA network currently brings together more than 130 organic farms and serves around 17,000 households. Other food basket distribution programs have also been established. Moreover, new initiatives have sprung up in recent years, such as virtual markets, which are online platforms that consumers can access to purchase regional products that are only delivered within a certain geographical area.
According to the most recent agriculture census (Statistics Canada, 2016), 18.9% of farmers in Quebec declared having participated in short supply chains, with annual median sales from direct marketing of $20,000 (all figures in Canadian dollars). The farms involved are relatively small (64.6% reported gross revenues of less than $50,000). According to data from Quebec's Ministry of Agriculture, Fisheries and Food (the acronym in French is MAPAQ), $270 M in food sales are generated annually through direct marketing, which represents slightly more than 3% of gross agricultural revenue in Quebec (Colombani-Lachapelle and Pouliot, Reference Colombani-Lachapelle and Pouliot2012). Communities also view short supply chains as providing a wide range of social and economic benefits (Mundler and Laughrea, Reference Mundler and Laughrea2016). For instance, farms involved in direct marketing are smaller, create more jobs and have a greater presence in the territories in which they operate. Many of them are also new businesses and practice organic agriculture. For local residents, farms that participate in short supply chains promote better diets since they supply fresh products and offer services that educate consumers about healthy food choices.
Farms in short food supply chains: a complex activity system
Work organization on farms is determined by how labor resources are allocated to different tasks over the course of a year (Hostiou et al., Reference Hostiou, Cialdella, Vazquez, Müller and Le Gal2015). Moreover, farmers are often required to integrate agricultural tasks into a much larger group of activities. In Quebec, various studies have shown that most farm households pursue salaried or independent work in addition to farming (Gervais et al., Reference Gervais, Gouin and Parent2009). Due to the large presence of small farmers in short supply chains across Quebec, we speculate that revenue from agriculture often represents only a portion of overall farm household income. Furthermore, households with larger farms that process and market their own products directly to customers often set up and manage several businesses that are legally and financially independent.
For these reasons, we chose to study farms that market in short supply chains from the perspective of ‘activity systems.’ Previous studies that explored this concept have shown that different farming systems can be created through various combinations of activities. They also suggest that farm household decisions can be explained by examining how tasks are connected (Laurent et al., Reference Laurent, Cartier, Fabre, Mundler, Ponchelet and Rémy1998; Gasselin et al., Reference Gasselin, Vaillant and Bathfield2012). Following Dedieu et al. (Reference Dedieu, Laurent and Mundler1999), we define these systems as ‘complex’ since, even when household members are not employed off-farm, they are still required to perform different types of work (such as production, processing, sales and tourism hospitality). Several authors have noted that this complexity significantly increases farm workloads (Jarosz, Reference Jarosz2008; Hostiou, Reference Hostiou2013; Bruce and Som Castellano, Reference Bruce and Som Castellano2017).
At the production level, farmers in short food supply chains strive to meet the expectations of their clients (with whom they are directly in contact). This leads many of them to diversify their production-related activities by offering customers products that stand out in terms of their quality (as it relates to nutrition, taste, ethics and environmental benefits). However, such a strategy requires that farmers know about agronomy (such as cropping cycles and agronomic techniques), be able to strictly coordinate the layout of their production system over time (including plot management and crop rotation) and have an excellent understanding of their clientele (Petit et al., Reference Petit, Bressoud and Aubry2010; Béguin et al., Reference Béguin, Dedieu and Sabourin2011; Bruce and Som Castellano, Reference Bruce and Som Castellano2017).
At the same time, farmers in short supply chains process (or package) their food products prior to sale. In order to carry out such tasks on their own, farmers must acquire specific technical and regulatory knowledge and be willing to invest in the necessary physical infrastructure (Darduin et al., Reference Darduin, Delanoë, Nicourt and Cabaret2012). For instance, cheese producers who diversify their activities need to have solid training in cheese making (Cournut and Chauvat, Reference Cournut and Chauvat2010). By accomplishing a series of processing tasks, farmers who pursue direct marketing can offer their clients a wider range of products.
Marketing activities can also be constraining and time-consuming as vendors must respect opening hours and delivery schedules, among other factors (Laurent et al., Reference Laurent, Blanchemanche, Hassani and Mundler2000; LeRoux et al., Reference LeRoux, Schmit, Roth and Streeter2010; Béguin et al., Reference Béguin, Dedieu and Sabourin2011). Moreover, researchers have noted that farmers in short supply chains often diversify their marketing options by using different sale channels (LeRoux et al., Reference LeRoux, Schmit, Roth and Streeter2010; Petit et al., Reference Petit, Bressoud and Aubry2010; Bruce and Som Castellano, Reference Bruce and Som Castellano2017). In Quebec, a study found that farmers involved in direct marketing use up to eight distribution channels through both short and conventional supply chains (Yorn et al., Reference Yorn, Bachant, Puskas and Bisson2012).
As we mentioned in the Introduction, the research suggests that selling prices and production volumes do not adequately compensate farmers in short supply chains for the work they perform (Levins, Reference Levins2000; Tegtmeier and Duffy, Reference Tegtmeier and Duffy2005; Feagan and Henderson, Reference Feagan and Henderson2009; Galt, Reference Galt2013). Furthermore, several studies that looked at CSA initiatives have indicated that farmers set prices based on their estimates of consumers' willingness to pay rather than on production costs (Cooley and Lass, Reference Cooley and Lass1998; Tegtmeier and Duffy, Reference Tegtmeier and Duffy2005; Donaher and Lynes, Reference Donaher and Lynes2017). In many cases, farmers have trouble identifying their actual costs and instead determine prices intuitively by observing the sales practices of local competitors or prices listed on the internet. As a result, the prices that are set often do not fully capture production costs (Levins, Reference Levins2000; Darduin et al., Reference Darduin, Delanoë, Nicourt and Cabaret2012; Galt, Reference Galt2013) as they fail to account for the actual number of hours worked or the assistance (often volunteer work) provided by friends or family members (Dedieu et al., Reference Dedieu, Laurent and Mundler1999; Tegtmeier and Duffy, Reference Tegtmeier and Duffy2005; Biewener, Reference Biewener2016). A study conducted by Équiterre (2006) noted a similar tendency among farmers in Quebec who sell to clients in short supply chains.
Since farmers involved in direct marketing often receive low earnings, many of them are unsatisfied with the long-term financial performance of their businesses (Dufour et al., Reference Dufour, Hérault-Fournier, Lanciano, Pennec and Traversac2010; Aubry et al., Reference Aubry, Bressoud, Petit, Béguin, Dedieu and Sabourin2011). While certain studies have shown that producers in short supply chains have higher than average net earnings (Govindasamy et al., Reference Govindasamy, Hossain and Adelaja1999; Richard et al., Reference Richard, Chevallier, Dellier and Lagarde2014), individual net earnings were found to vary widely.
To summarize, researchers have produced differing estimates of how much revenue is generated through short supply chains. Nevertheless, the accumulation of various tasks by farmers involved in such marketing channels often implies that labor productivity is lower compared to more specialized firms.
Farmer satisfaction
According to several studies, producers in short supply chains make decisions based on their values, principles and ethical beliefs (Galt, Reference Galt2013; Hvitsand, Reference Hvitsand2016). Similarly, in Quebec, Yorn et al. (Reference Yorn, Bachant, Puskas and Bisson2012) noted that personal values influence the kinds of marketing channels that farmers use. The degree of satisfaction among farmers with their activity system is thus not solely dependent on financial considerations (Ilbery and Kneafsey, Reference Ilbery and Kneafsey1999; Macombe, Reference Macombe2006; Dufour et al., Reference Dufour, Hérault-Fournier, Lanciano, Pennec and Traversac2010). Other important factors that farmers consider include the opportunity to be socially recognized for their work and their own professional expectations. As a result, farmers are often willing to work more if, by doing so, they can meet the ecological, social and quality standards they have. In this light, farm diversification, whether at the production, processing or marketing level, can be viewed as desirable as it allows farmers to avoid routines, vary their work schedule and foster direct relationships with clients (Mundler and Laughrea, Reference Mundler and Laughrea2016).
Profit maximization is thus not necessarily the end goal of producers in short supply chains. In fact, a study by Kneafsey et al. (Reference Kneafsey, Venn, Schmutz, Balázs, Trenchard, Eyden-Wood, Bos, Sutton and Blackett2013), which reviewed the research conducted in Europe around this question, found that many farmers who participate in direct marketing put the collective welfare of their communities ahead of their own personal interests. These types of farmers are ‘profit sufficers’ rather than ‘profit maximizers’ since they are largely motivated by ethical considerations (p. 14).
Overall, the level of satisfaction that farmers derive from their work depends on how productively they can accomplish the various tasks set out. In addition, productivity hinges on the motivations of farmers and how they put their values into practice.
Material and methods
The farms surveyed
Our research focuses on 32 farms in Quebec that market all or a portion of their output to clients through short supply chains. The selection of farms was intended to highlight the diversity of farmers in Quebec that participate in direct marketing (Jean-Gagnon, Reference Jean-Gagnon2016). To explore our first hypothesis that differences in productivity exist across farm categories, we selected farmers who produced fruits and vegetables (n = 13: E1 to E13), meat (n = 10: E14 to E23) or dairy products (n = 9: E24 to E32). The farms selected were heterogeneous, differing in size (which in our study refers to gross revenue), production methods, marketing strategies and levels of diversification. We also ensured that most regions in Quebec were represented in our sample.
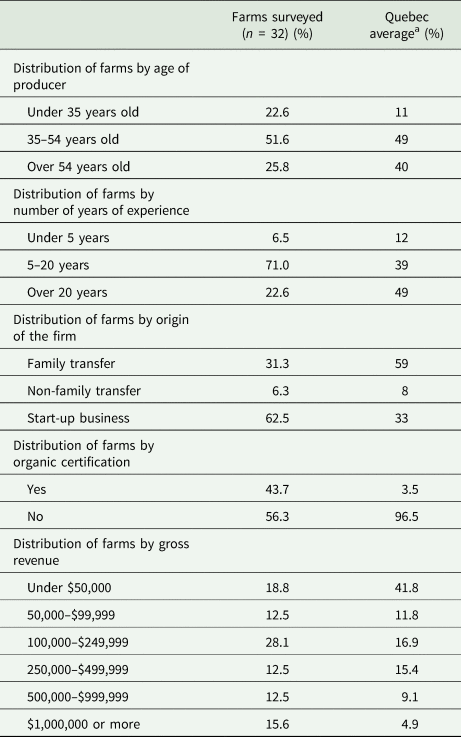
Table 1 presents some general characteristics of the farms that participated in our study. For comparison, the right-hand column shows the corresponding averages for all farms in Quebec (not just those that market through short supply chains). We note that surveyed respondents were younger than the average farmer in Quebec and were more likely to have started their own farm. This confirms what previous studies have found, namely that producers whose farms are not the result of a family transfer are more likely to market their products directly through short supply chains (Barbieri and Mahoney, Reference Barbieri and Mahoney2009; Capt and Wavresky, Reference Capt and Wavresky2011). In addition, a greater percentage of farms in our sample practiced certified organic agriculture compared to the average in Quebec, which is a phenomenon about producers involved in direct marketing that has also been noted elsewhere (Martinez et al., Reference Martinez, Hand, Da Pra, Pollack, Ralston, Smith, Vogel, Clark, Lohr, Low and Newman2010; Kneafsey et al., Reference Kneafsey, Venn, Schmutz, Balázs, Trenchard, Eyden-Wood, Bos, Sutton and Blackett2013). We found that smaller farms (those that generated less than $50,000 in gross revenue) were underrepresented in our sample, whereas medium and large farms were overrepresented when compared to the percentage distribution of Quebec farms in each size category. The results are thus not in line with the 2016 census data on direct marketing from Statistics Canada. We attribute this discrepancy to the fact that we targeted farmers who advertised their involvement in short supply chains (via websites, market posters and other promotional materials). Admittedly, many small farms that sell locally do not produce these types of promotional materials. It could also be due to our inclusion of dairy producers. Since Canada's dairy sector is under supply management, only a limited number of dairy farms produce and sell their own products (20 cow's milk producers in Quebec do so), and all of them generate more than $500,000 in gross revenue.

The ‘Work Assessment’ method
To measure labor productivity, we needed to identify work patterns on the farms surveyed by calculating the amount of time spent on each activity. To do so, we applied a model that was developed in France for studying work organization on livestock farms known as the ‘Work Assessment’ method (Dedieu et al., Reference Dedieu, Coulomb, Servière and Tchakérian1993; Madelrieux and Dedieu, Reference Madelrieux and Dedieu2008). It involves asking farmers to report on their practices and to use their memory and monitoring tools to calculate the number of hours devoted to each task. The method has been successfully applied in different settings to analyze farm work (Martel et al., Reference Martel, Dourmad and Dedieu2008; Aubron et al., Reference Aubron, Cochet, Brunschwig and Moulin2009; Hostiou et al., Reference Hostiou, Cialdella, Vazquez, Müller and Le Gal2015; Sraïri, and Ghabiyel, Reference Sraïri and Ghabiyel2017), as well as complex activity systems, including processing and marketing activities (Dedieu et al., Reference Dedieu, Laurent and Mundler1999).
The farming year is characterized by seasonal cycles, during which work requirements can vary widely. This is especially true in Quebec, which has a long winter season. However, the ‘Work Assessment’ method can be used to help producers divide the year into different periods, each one associated with a specific set of work tasks and labor requirements (Hostiou and Dedieu, Reference Hostiou and Dedieu2012). A typical week is modeled for each period, and the data is then extrapolated to describe the month, period and year. The ‘Work Assessment’ method also distinguishes between two categories of workers (Madelrieux and Dedieu, Reference Madelrieux and Dedieu2008): the basic group (those responsible for the farm or salaried workers that spend most of their time and earn most of their income from farming) and other workers (seasonal employees and volunteers).
A distinction is also made between three kinds of work: routine work (RW), seasonal work (SW) and work repaid (WR) (Dedieu et al., Reference Dedieu, Coulomb, Servière and Tchakérian1993; Madelrieux and Dedieu, Reference Madelrieux and Dedieu2008). RW refers to tasks that must be carried out daily or almost daily and cannot be concentrated (completed faster) or deferred (postponed to a later date). Animal care is a typical example. In the case of farms that market their output through short supply chains, Dedieu et al. (Reference Dedieu, Laurent and Mundler1999) make a further distinction between daily routine work (DRW) and non-daily routine work (NDRW). Activities corresponding to the latter category are not performed every day but are considered essential, cannot be deferred or concentrated and determine overall work patterns. Examples include manning weekly market stalls or using a processing facility at a reserved time every week. SW, which covers activities that can be more easily deferred or concentrated, is measured in days to avoid general or normative responses (such as work hours per hectare). WR refers to the time spent repaying others for assistance; it is also measured in days.
Furthermore, additional activities carried out by the basic group were folded into a single indicator: the remaining calculated time (RCT). This indicator specifies how much time the basic group has left over to perform tasks that are not accounted for, such as work projects that can be deferred and concentrated (e.g., fence and machinery maintenance and accounting work) or free time activities (Madelrieux and Dedieu, Reference Madelrieux and Dedieu2008; Hostiou and Dedieu, Reference Hostiou and Dedieu2012).
Finally, we made two modifications to the ‘Work Assessment’ method to better reflect labor practices on farms in Quebec, including those surveyed. The first change involved eliminating the WR category, which is tied to a strong tradition of communal work (e.g., silaging) on livestock farms in France. However, the category was not applicable to Quebec, where such activities are rarely practiced and, if they are, do not determine how farm work is organized. The second change related to the way management activities were accounted for. On several of the farms surveyed, notably the larger ones, various administrative duties (such as workforce management and billing activities) could not be concentrated or deferred, even though they influenced overall work patterns, especially during specific periods of the year. Therefore, we factored in the time required to accomplish these tasks when calculating NDRW.
The table in Appendix 1 illustrates how tasks were classified according to the work categories discussed.
Overall, the ‘Work Assessment’ method has allowed researchers to analyze farm activities from both a worker and farm level perspective (Dedieu et al., Reference Dedieu, Laurent and Mundler1999). To evaluate the roles assigned to workers, it is necessary to specify who does what within a given period of the year. By contrast, a farm-level analysis is carried out by placing and connecting the aggregated data from all workers in each period on to a calendar.
Measuring productivity by activity segment
The data for measuring labor productivity in each activity segment was gathered in two stages. Firstly, each farmer responded to a questionnaire, which allowed us to collect data on farm characteristics, the workforce and financial results during the prior year (2014).
This step was followed by a visit to each farmer in person. The information that had been gathered from the questionnaire laid the groundwork for the interviews that followed. During each visit, farmers provided a detailed picture of the work organization in each period. Data was also collected on the distribution of costs and benefits across activity segments (production, processing and marketing).
Focusing on labor inputs provides a measure of ‘apparent’ labor productivity since productivity is not solely determined by one production factor but several. When weighted by price, labor productivity can be expressed by the following equation:
 $$\eqalign{& {\rm Apparent}\,{\rm Hourly}\,{\rm Productivity}\,{\rm of}\,{\rm Labor}\,({\rm AHPL}) \cr & \qquad = \displaystyle{{{\rm Value\; added}\,{\rm by}\,{\rm production}} \over {{\rm Work}\,{\rm volume}\,({\rm hours}\,{\rm worked})}}}$$
The AHPL indicator can also be applied to farms in short supply chains to calculate the value added by each activity segment. This involves dividing the value-added contribution of each step undertaken internally by the farm (step 1: production, step 2: processing and step 3: marketing) by the number of hours devoted to each step:
 $$\eqalign{&{\rm AHPL}\,{\rm for}\,{\rm each}\,{\rm step} \cr & = \displaystyle{{{\rm Value}\,{\rm added}\,{\rm by}\,{\rm the}\,{\rm step}\,({\rm production},\,{\rm processing}\,\; {\rm or}\,{\rm distribution})} \over {{\rm Number}\,{\rm of}\,{\rm hours}\,{\rm spent}\,{\rm on}\,{\rm the}\,{\rm step}}}}$$
For every activity segment, the added value was measured by subtracting total costs from the total revenue generated. Moreover, revenue was estimated by simulating a market exchange between each step. For example, if a vegetable farmer sold produce directly to customers, we considered two stages: vegetable growing (step 1) and marketing (step 2). The value added from production was calculated by estimating the price the farmer would receive for selling the same produce to buyers in conventional supply chains. Next, the value-added by marketing activities was derived using the difference in sales prices for vegetables sold in short and conventional supply chains minus any distribution costs, such as vehicle depreciation, fuel transportation expenses and packaging.
To calculate how costs were spread across activity segments, interviewed farmers used their financial statements to determine their production, processing and distribution expenses. When the value added by a specific step could not be calculated using the farm's financial records, we estimated a hypothetical markup. For example, we applied a distribution markup of 30%, which was equivalent to the average markup reported by farmers who sold their output in both short and conventional supply chains.
Additional details about our methodology should also be highlighted:
- Packaging expenses were included in distribution costs, given that packaging and marketing activities are often implicitly linked;
- General farm costs that could not be tied to a single activity segment were added proportionally to the costs incurred at each stage (production, processing and distribution);
- For vegetable farms (for example CSA farms) who grew a wide variety of produce, we estimated the average vegetable yield per hectare based on data from the financial statements of horticultural farms, which were accessed through the Quebec Reference Center for Agriculture and Agri-Food. For conventionally grown vegetables, the estimate was based on the average yield per hectare for 15 vegetable types. In the case of organic growers, the estimate was derived from the average yield per hectare for six categories of vegetables.
It should be noted that our calculations are theoretical and do not provide a full picture of work organization on farms in short supply chains. For example, produce farmers who directly market their output often grow different types and varieties of vegetables to meet client expectations. Estimating how much these producers would earn if they sold their produce through conventional supply chains ‘penalizes’ them since their farming systems were designed for short supply chains. Our calculation methods thus discount much of the value added by the ‘production’ activities of produce farmers, especially when they grow vegetables intensively (e.g., under tunnels). Duck fattening farms are another example. While the practice of fattening ducks significantly increases workloads, conventional supply chains do not adequately compensate duck farmers for the work involved. Both examples illustrate how labor productivity at the production stage is often less than what is theoretically attainable. On the other hand, this underperformance is often offset by higher levels of productivity during processing and distribution.
Data analysis
Our survey tools allowed us to gather detailed data on both work organization patterns and the revenues and costs generated by each activity segment (production, processing and distribution). We carried out our analysis in three steps. Firstly, for each farm, we organized the data that had been collected. Farmers who participated in our study received a summary of the results for their farm and were invited to provide commentary or feedback. Secondly, we analyzed the results by sector (fruits and vegetables, dairy and meat). Finally, we carried out a cross-sectional analysis of the results from all 32 farms.
For each farm, we inputted the data into five tables or graphs that describe:
- the annual work calendar;
- the relative importance of different activities (as a percentage of annual work hours performed by the basic work), which are classified in Appendix 1;
- the number of hours devoted per period to each activity segment;
- the added value and labor productivity associated with each activity segment (production, processing and distribution);
- the degree of satisfaction among farmers with their activity system in terms of work performance, recognition and financial results.
We used an online spreadsheet (with variables organized by columns) to evaluate the farms by sector and to carry out our cross-sectional analysis. This allowed us to identify the unique features of each farm, as well as the common attributes they share. Only the main results of the cross-sectional analysis are presented here. As mentioned previously, we do not claim to provide a full picture of work patterns on Quebec farms involved in short supply chains. Nevertheless, our study does provide an overall perspective by analyzing harmonized data on labor productivity from a sample of 32 farms.
Main results
Characteristics of the farms surveyed
Table 2 presents the data collected for each farm sector in terms of the number of distribution channels used, the percentage of sales generated through direct marketing, the number of work units per farm and the average markup.
Marketing channels, number of workers and average markup

a The markup was calculated using the following formula: 1 − (operating costs/gross revenue).
b Farm E13, which had just started operations and had limited production, was not included in the calculations.
On average, fruit and vegetable farmers used five different marketing channels. As a percentage of their sales revenue, conventional supply chains were the most important channel (23%), followed by CSA baskets (21%) and farm stands (17%). On the other hand, meat producing farms generated almost all their revenue through short supply chains. In total, half (50%) of their sales revenue came from on-farm sales, with virtual markets being the second most important outlet (internet sales were responsible for 14% of revenue). Finally, for dairy producers, a high percentage of revenue was tied to conventional supply chains (25%) and retailers (21%), although farm-gate sales were also an important revenue source (38%).
Table 2 also indicates that dairy farms hired the most workers. Compared to other food categories, meat production farms were smaller in size, had lower levels of profitability and the workforce was more likely to be made up of family members.
Farm size and economic performance
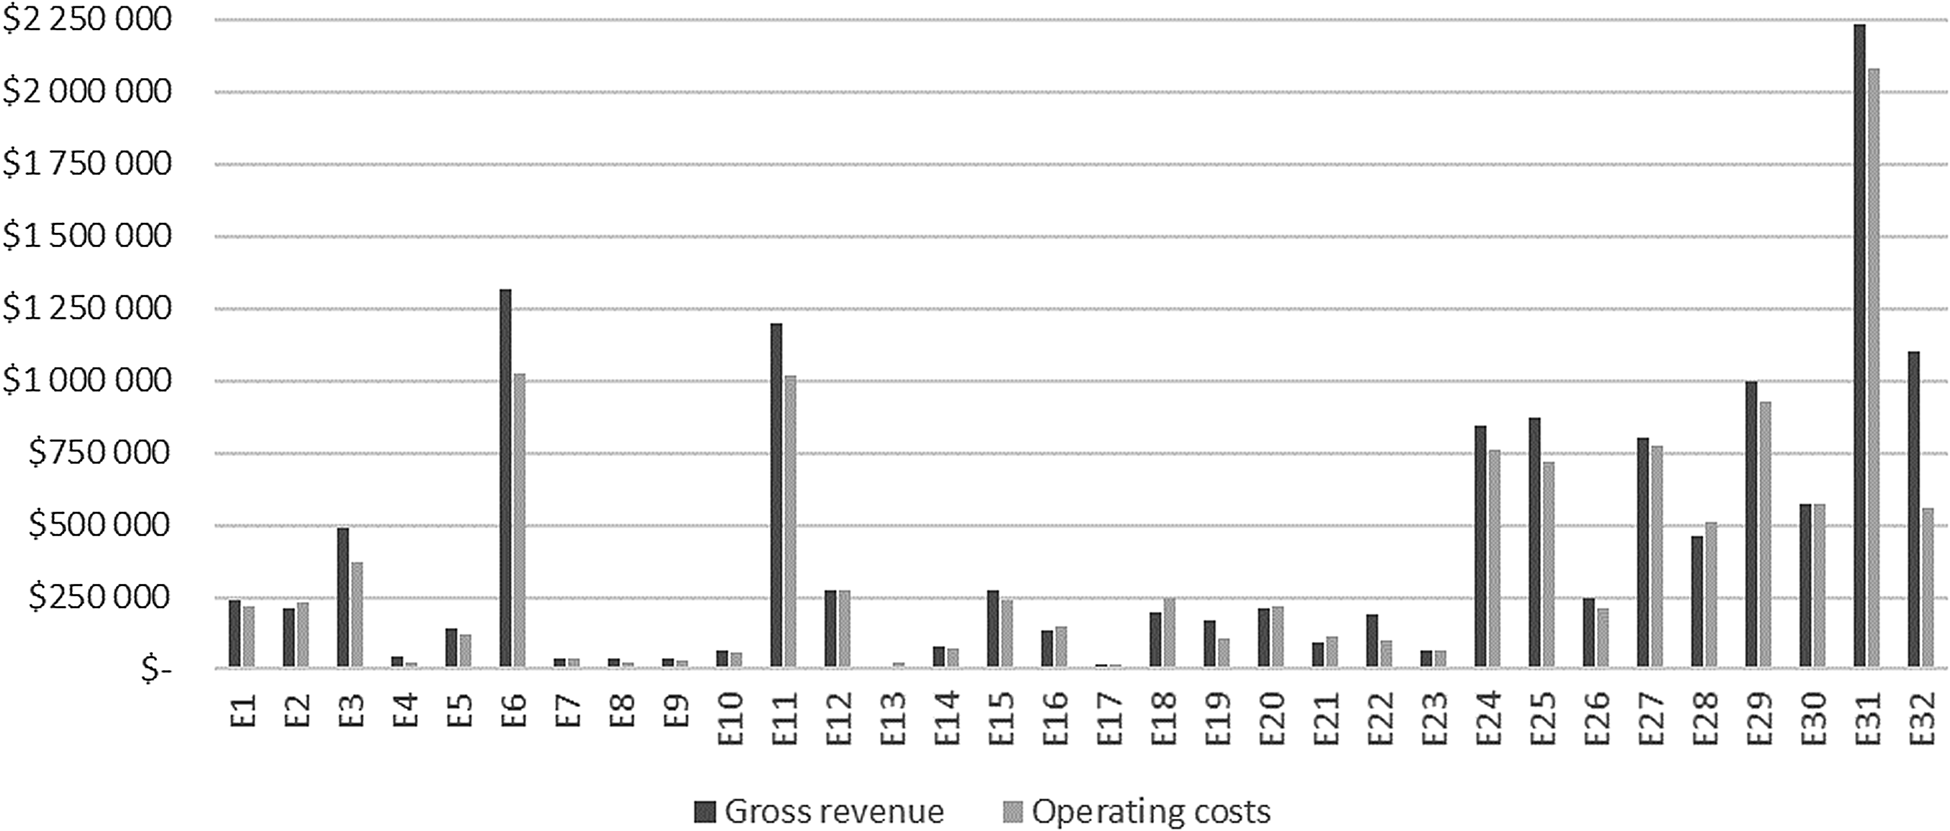
The farms surveyed differed in terms of their economic profile. Overall, fruit and vegetable and meat-producing farms had lower gross revenues than dairy farms (except in three instances). Dairy farmers who raised goats and sheep for milk ran smaller farms, whereas all cow's milk producers registered gross revenues exceeding $500,000 (see Fig. 2).
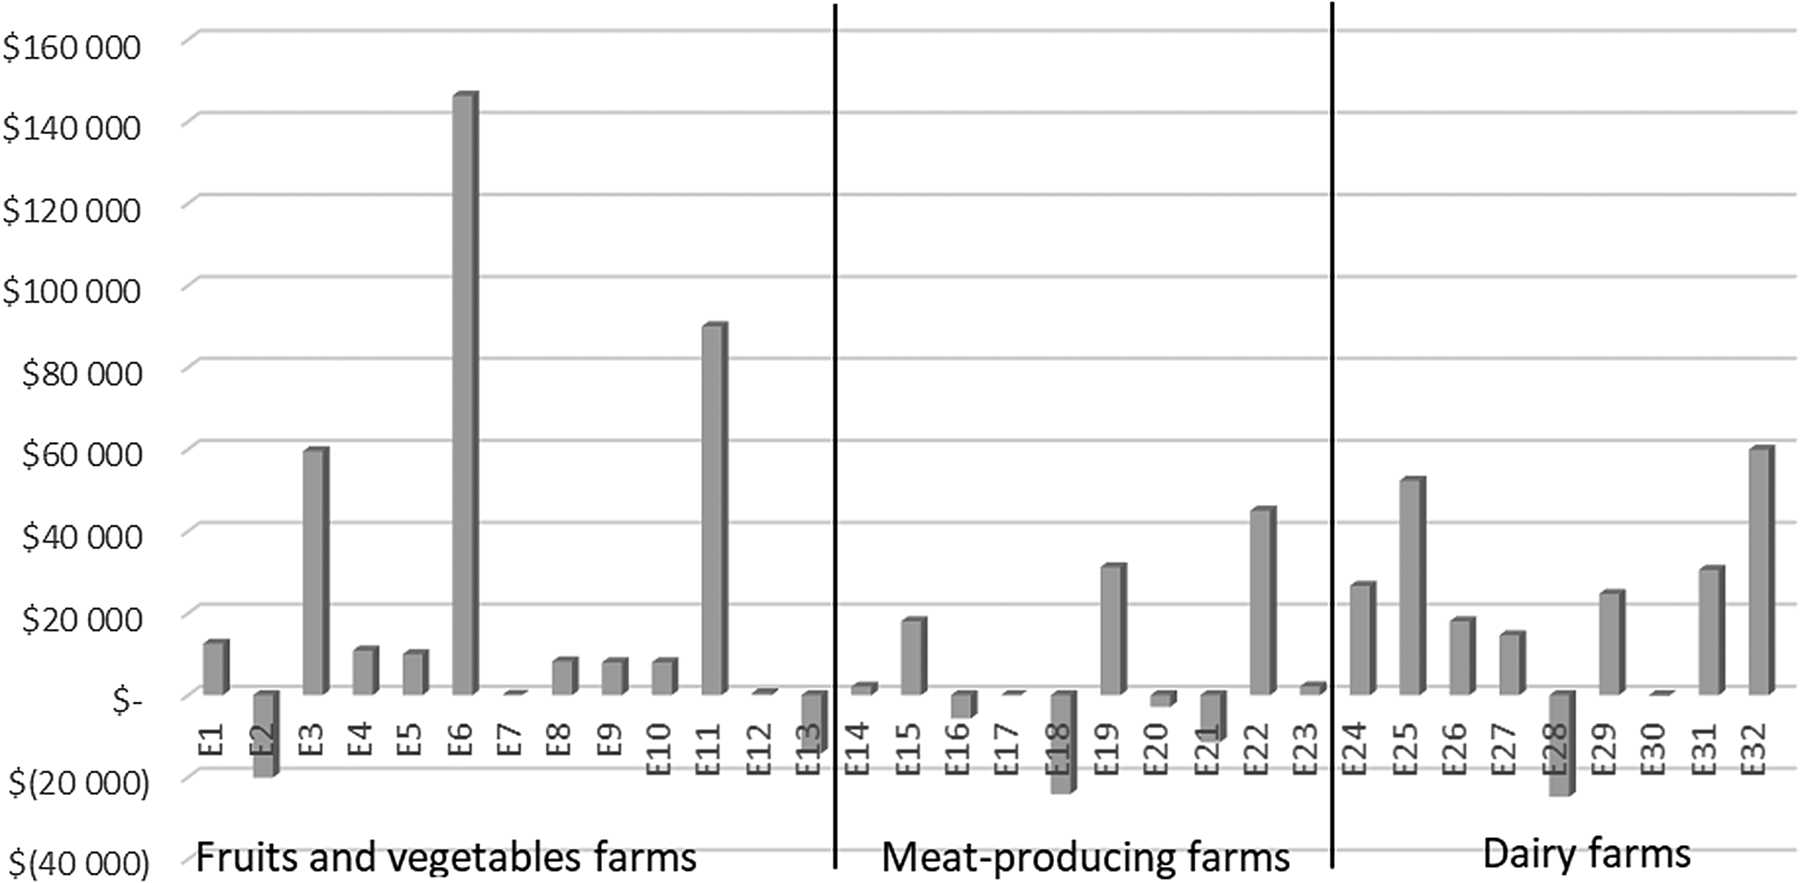
Net earnings per farmer were obtained by dividing the total net revenue for each farm by the number of farmers. In total, 25% of farmers reported negative earnings, 50% had positive net earnings under $30,000 and 25% had net earnings above $30,000 (see Fig. 1).
Net earnings per farmer (reference year: 2014).

In general, net earnings per farmer were positively correlated with farm size. However, a few small farms performed exceptionally well, as can be seen in Figure 2, which shows the relationship between operating costs and gross revenue. On average, the cost-to-revenue ratio was 0.94 and varied from 0.51 to 2.45 (the latter figure corresponded to E13, a recently established farm with limited production). By removing this outlier, the average ratio fell to 0.89.
Comparison of gross revenues and operating costs (reference year: 2014).

Smaller farms usually did not generate enough revenue to provide producers and capital with adequate returns, although the results do suggest that small-scale farms can be run efficiently. For example, farm E4 had one of the most favorable cost-to-revenue ratios in our sample (0.54), even though its gross revenue was under $50,000. The small producers in our survey often worked off-farm to supplement their income. Occasionally, outside employment was even their main source of income if farming played a secondary role in their household's activity system. Usually, the spouse that was less involved in farming activities worked full-time off-farm to meet family needs. Outside employment was sometimes even necessary for the household to practice farming (in such cases, income earned off-farm compensated for farm losses).
Labor productivity in production, processing and distribution
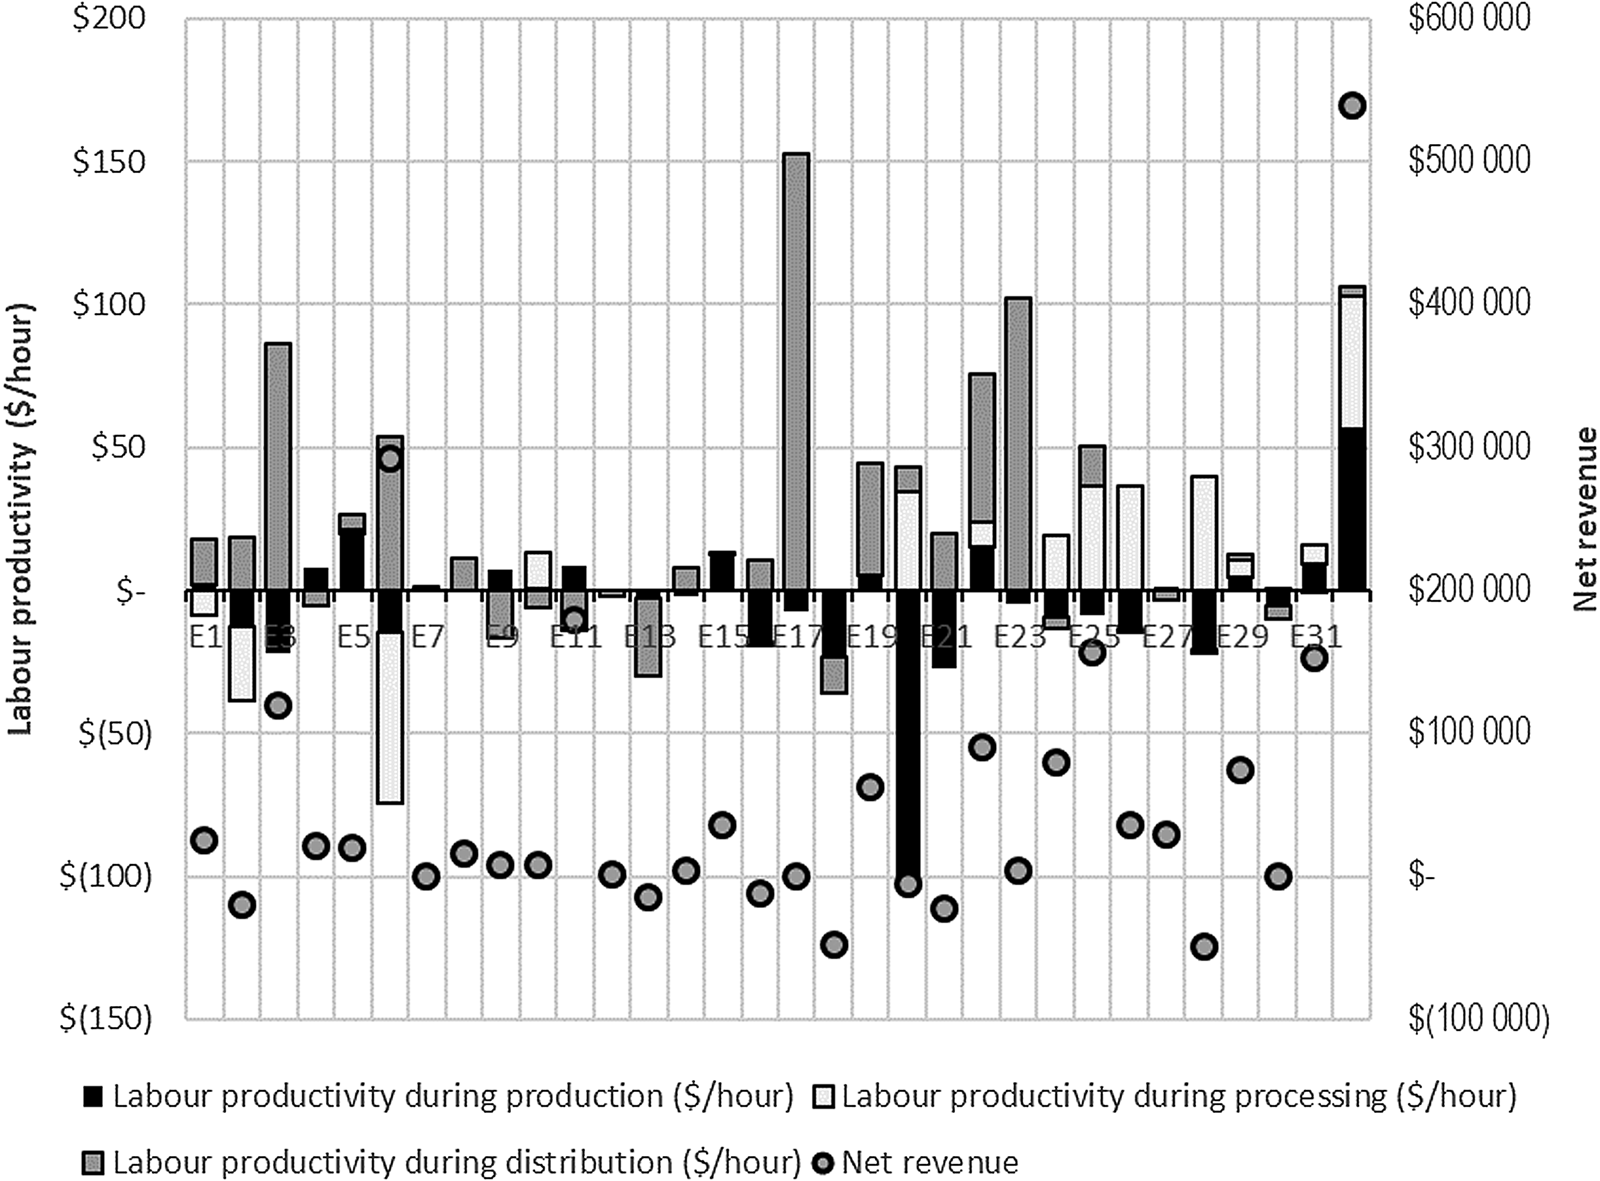
Figure 3 shows labor productivity levels (measured in dollars per hour) for each activity segment. Negative productivity values indicate that the activity segment's operational costs were greater than the revenue generated by the markup. Farm net revenues are indicated on the right-hand scale, for comparison.
Labor productivity in each activity category and farm net revenue.

As the figure shows, farm performance varies widely, with labor productivity ranging from negative values to more than $100 per hour for certain activity categories. Farms with higher net revenues performed processing tasks (if the food was processed) and marketing activities more productively. Each farm also pursued its own marketing strategy, which included organizing delivery points more efficiently (E3), selling products exclusively at the farm by bringing in a constant flow of clients attracted by the hospitality services and range of products on offer (E6), increasing processing efficiency by selling baskets with no packaging (E19) or prioritizing farm-gate sales through product diversification (E22). Dairy farms (E24 to E32) were productive during processing, although their marketing performance was weaker since they could not sell their entire output through short supply chains. The other two farm categories (fruits/vegetables, meat) scored higher levels of productivity when it came to distribution.
It is noteworthy that, apart from farm E32, all the farms registered low or even negative levels of labor productivity during the production phase. This could be partly attributed to our calculation methods. However, farms in short supply chains (which offer more product variety and use labor more intensively) do tend to be less productive when carrying out production-related tasks. Even so, this is often compensated for with higher levels of productivity in downstream activities (processing and distribution).
For certain farm categories, it was difficult to determine the value added from processing and distribution activities. This was especially the case for sheep and apple farms. For many sheep farms (E16, E18, E21 and E28), even sales prices in short supply chains failed to cover their production costs. Farms producing conventionally grown apples (E2 and E12) also faced a similar situation. As a result, Quebec farmers in both sectors often turn to revenue insurance (MAPAQ, 2015, 2019).
We found that the number of processing activities was negatively correlated with productivity. In other words, increasing the range of finished food items for sale reduced labor productivity during the processing stage. This was illustrated in the previous figure by farm E6, which offered its clients more than 75 finished products. Our cross-analysis revealed that processing fruits and vegetables did not increase added value as the costs incurred were generally higher than the resulting markup.
On certain farms (E16 and E20), low productivity highlighted a conflict between the aspirations and values of farmers and market realities. Farm E20, which registered very low levels of productivity, combined strict animal welfare standards with limited production volumes. Productivity on farm E16 was also constrained by similar norms and by the wide range of animals being raised. In both cases, the farmers made certain choices because they enjoyed working with animals, although this enjoyment was tempered in part by the need to perform processing and marketing tasks.
Workforce and economic performance
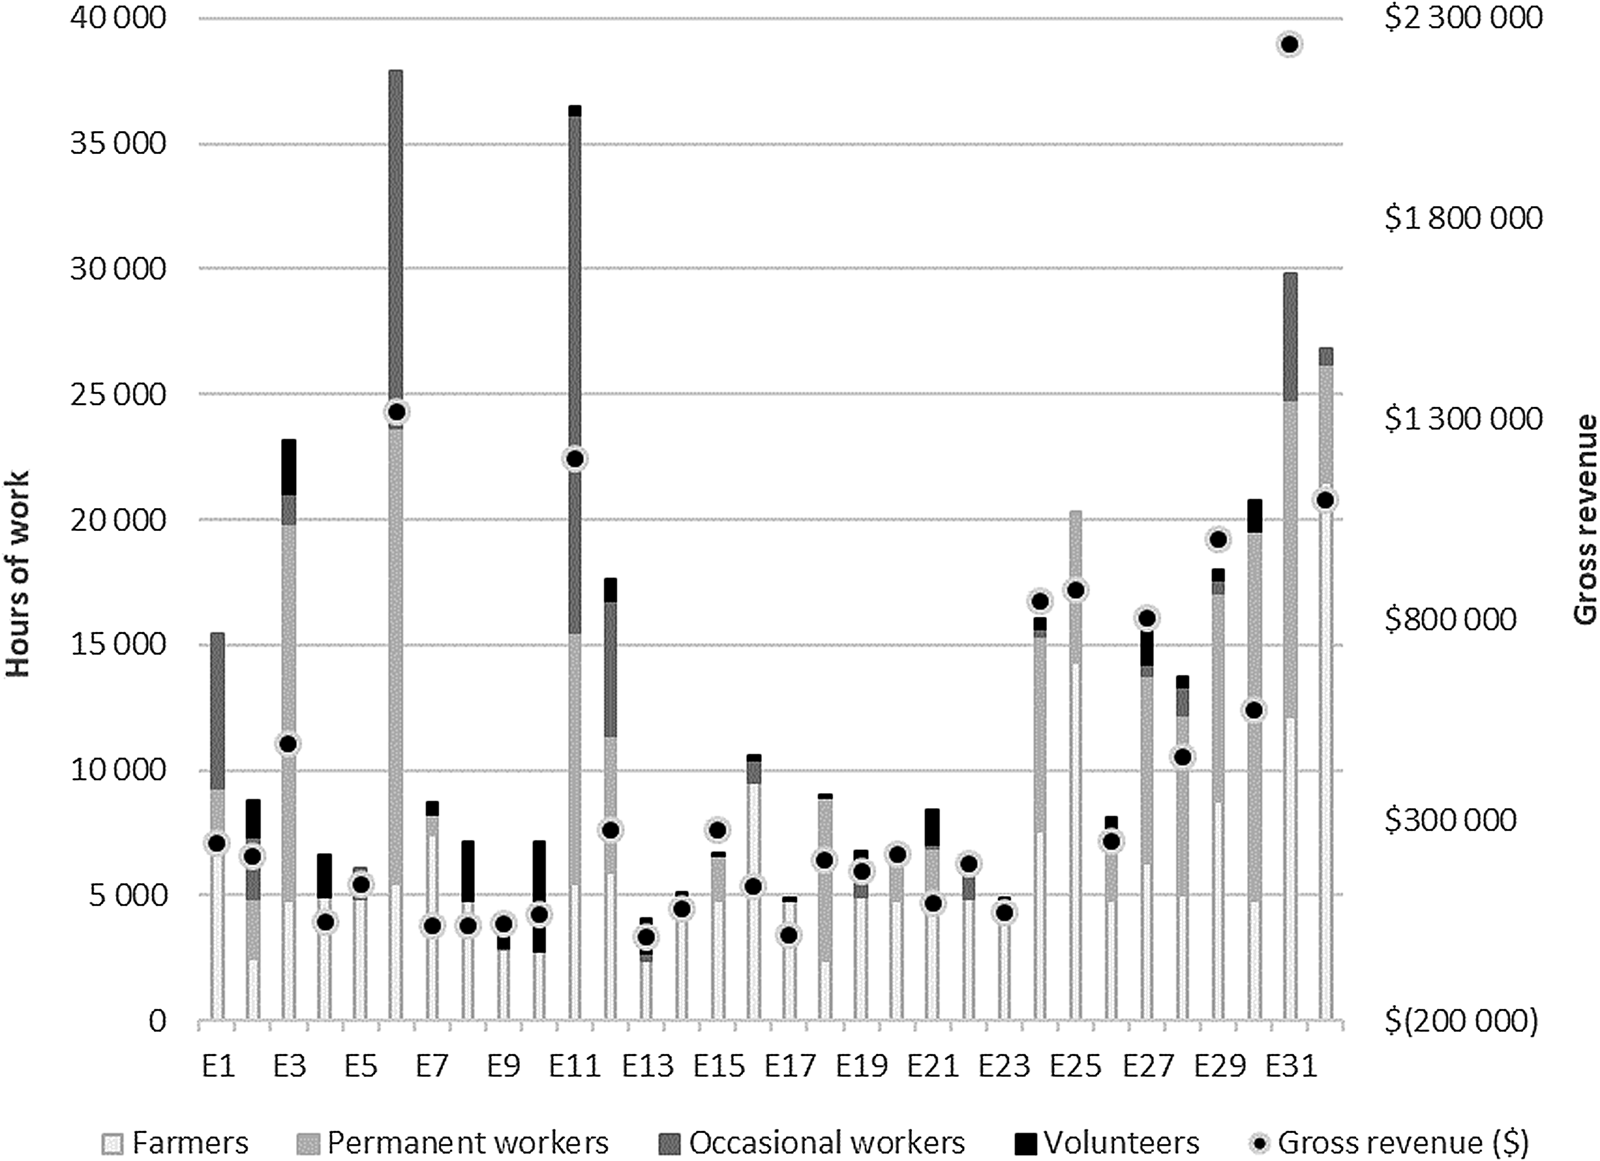
Almost all the farms in our sample that were family-owned hired permanent or occasional workers. Figure 4 shows the workload distribution among family members, permanent workers, occasional workers and volunteers, measured in total annual hours. The scale on the right provides a reminder of each farm's gross revenue.
Workload distribution by worker category and gross farm revenue.

In Quebec, there is no standard definition of an annual work unit (AWU). For our study, we defined one AWU as 2400 annual hours, which is equivalent to 46 h of work per week. Using a standardized unit to calculate the amount of work performed on each farm allowed us to measure workloads at different periods of the year. On average, the farms in our sample employed the equivalent of 5.1 AWUs, which is higher than the average for Quebec farms (2.47). In addition, six farms reported low-net revenue figures, even though salaried workers carried more than half the workload. Certain farmers explained that, as entrepreneurs, they took very seriously the impact their farm business had on local employment. Finally, several small farms relied considerably on volunteer work (in one case, volunteers were responsible for 60% of the workload).
The remaining calculated time, a flexible indicator for analyzing activity systems
As we mentioned, RCT in the ‘Work Assessment’ model is an indicator of how much time is left over after deducting the hours spent caring for livestock, growing crops, processing food and marketing products. Furthermore, management tasks were included as part of NDRW since it had been mentioned during interviews that these activities were essential and could not be deferred or concentrated. For farms in short food supply chains, management responsibilities thus play a crucial role in determining the organization of work.
The RCT value does not indicate how much free time is available (Hostiou and Dedieu, Reference Hostiou and Dedieu2012). Rather, it specifies the number of hours left over for farm tasks that can be deferred, such as maintenance work. In our study, the RCT also denotes how much time is available for off-farm work and free time and is measured in terms of annual hours (Dedieu et al., Reference Dedieu, Coulomb, Servière and Tchakérian1993). For the farms in our sample, the RCT ranged from only 5 h (E16) to more than 13,000 h (E32). The former case was that of a sheep farm where the basic group consisted of only two work units who spent almost 4800 h per year performing tasks classified as DRW, NDRW or SW. The latter case involved a dairy farm that produced cheese with a basic group of 9.3 work units. This farm stood out due to high-labor productivity during production and processing and a high-net revenue figure.
Table 3 shows the average percentage of time devoted to different tasks for each of the three farm categories studied. To create a standardized measurement, we chose to express the RCT as a percentage of total annual work hours. In the case of fruit and vegetable farms, a significant amount of time was dedicated to SW. These tasks were closely associated with NDRW, especially during the harvest period since they could not be deferred (the harvest schedule was determined by market or basket delivery days). Produce farmers thus had very little work flexibility, especially during the growing season or if they ran small farms and were less reliant on salaried workers.
Distribution and relative importance of work categories

On dairy farms, a great deal of time was dedicated to DRW or NDRW. However, one of the unique features of dairy farms was that the work involved varied little by season.
Across all farm categories, marketing activities influenced how workers, especially members of the basic group, organized themselves. For instance, sales and delivery hours had a dual effect on producers who ran farm stands, sold their goods in farmer's markets or delivered weekly baskets. Firstly, such marketing outlets often require the farmer to be present at the point of sale. Secondly, they determine how pre-sale harvesting, slaughtering and processing activities are organized, which suggests that work patterns on farms are shaped to a certain extent by client expectations. However, these sales outlets can result in long waiting periods (such as when a farmer needs to man a stall or be present during U-pick hours). Consequently, while tasks associated with marketing cannot be deferred, it is often difficult for farmers to know in advance how much work will be involved. In a previous study, Laurent et al. (Reference Laurent, Blanchemanche, Hassani and Mundler2000) also noted that client expectations have made it more difficult to organize farm work and have led to the breakdown of traditional production cycles. While dependent on agroclimatic conditions, these cycles were not continuously re-organized to meet the needs of consumers. Aubry et al. (Reference Aubry, Bressoud, Petit, Béguin, Dedieu and Sabourin2011) found that, when possible, farmers try to at least partly separate their sales and production activities, for instance by limiting the amount of time they spend directly selling to customers. Several farmers in our study reported doing this, particularly produce growers but also dairy producers who ran farm stores. In such cases, farmers assigned sales duties to employees or family volunteers. This practice does not appear though to have any negative effect on client satisfaction. In their systematic review, Prigent-Simonin et al. (Reference Prigent-Simonin, Hérault-Fournier, Merle, Prigent-Simonin and Hérault-Fournier2012) suggest that, for clients, having access to farmers (being able to communicate with them should clients wish to do so) is more important than maintaining face-to-face relationships. In addition, the results from case studies in Quebec (Mundler and Laughrea, Reference Mundler and Laughrea2016) indicate that the rhetoric around the importance of direct relationships between producers and consumers often brushes up against the reality of work constraints, which compels farmers to hire workers to supervise sales.
Our results also indicate that the RCT indicator masks SW variations. Many farmers, particularly produce growers, reported being overworked at certain points in the year and could not modify their work schedules during the summer season. During these periods, the RCT value became negative as all members of the basic group were working more than 46 h a week.
Finally, we note that certain farmers, especially those who produced meat, were part-time farmers who were either retired or worked another job as their main source of income. Their farms were generally smaller, had lower levels of productivity and had RCT values that were above average.
Farmer satisfaction with their activity system
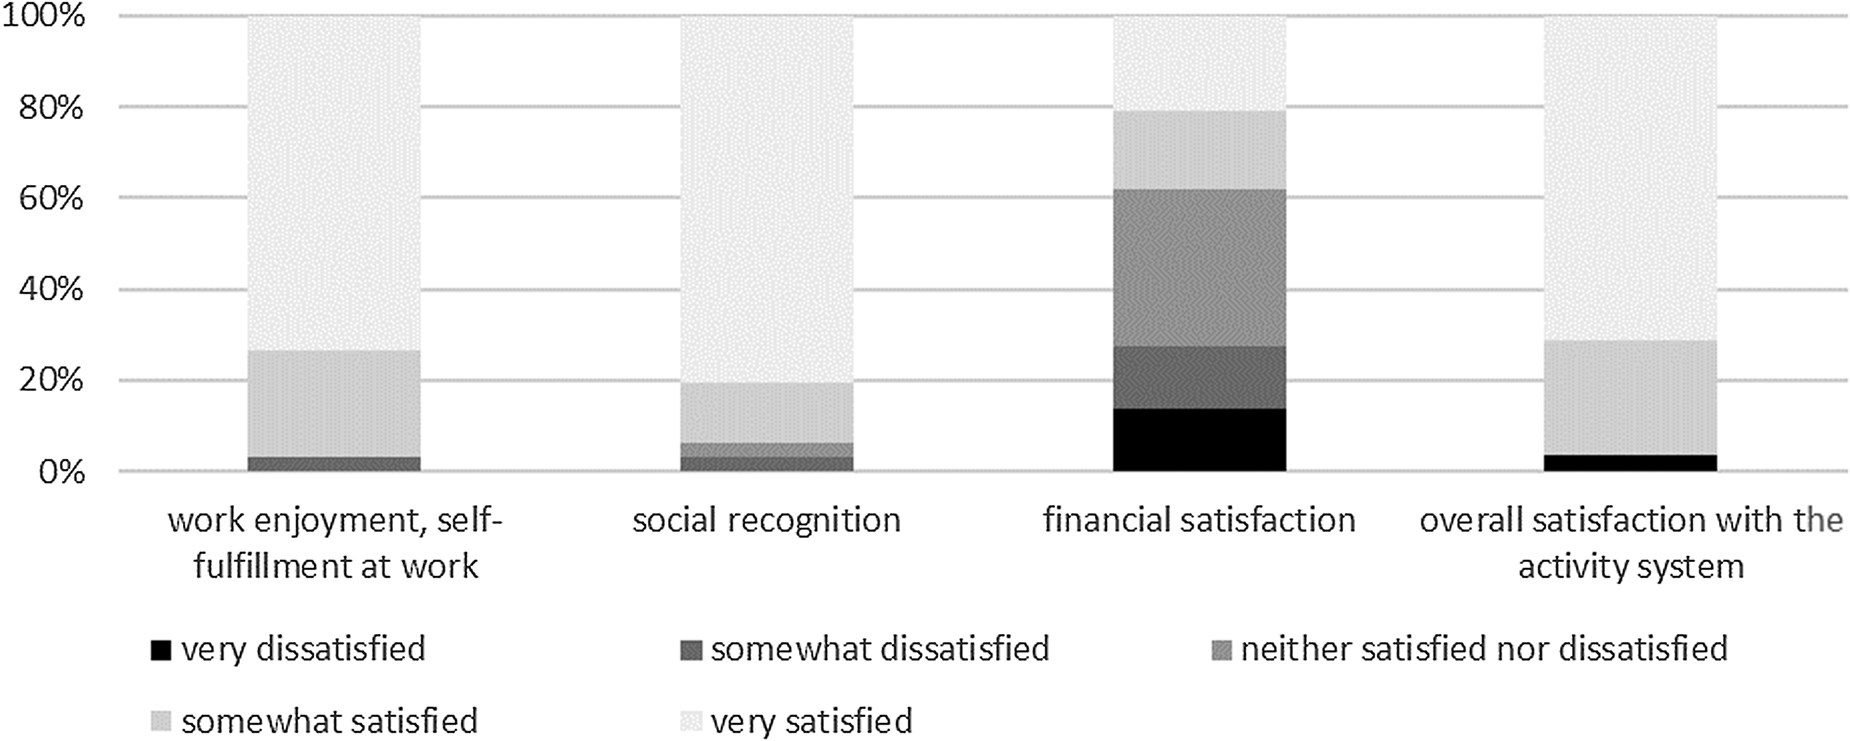
As Figure 5 shows, most of the farmers interviewed expressed high levels of satisfaction with their activity systems, and only one farmer declared being completely unsatisfied. Among the main reasons for being satisfied, farmers cited the benefits of running one's own business, the feeling of independence it provided and the enjoyment of their work. Many of the farms in our sample performed a range of activities associated with production (this was especially the case for farms selling produce baskets), processing or marketing. As previously mentioned, diversifying production did not have a uniform effect on labor productivity. However, several farmers believed that diversification was beneficial because it allowed them to perform activities that were more stimulating and less routine-based and because it gave clients a wider range of product options.
The satisfaction of farmers with their activity system.

Nevertheless, farmers face many hardships, both physical (due to the demanding nature of many tasks) and psychological (given the need to organize work schedules and master a variety of skills). Several farmers said they felt overworked or had even lost control of their activity system at some point in the year. At the same time, these stressful episodes do not appear to have a significant impact on work satisfaction among farmers.
It is noteworthy that farmer well-being appears to depend crucially on the social recognition they receive for their work. Specifically, farmers cited the ability to interact with clients as the main reason for their participation in short supply chains, which seems to contradict the common practice among many producers of recruiting salaried workers to oversee sales.
Finally, we note that participants were relatively unsatisfied with their farm's financial results. Following Dufour et al. (Reference Dufour, Hérault-Fournier, Lanciano, Pennec and Traversac2010), we compared levels of satisfaction in three key areas: work fulfillment, social acknowledgment and financial performance. As various studies have indicated (Dufour et al., Reference Dufour, Hérault-Fournier, Lanciano, Pennec and Traversac2010; Mundler and Laughrea, Reference Mundler and Laughrea2016), farmers in short supply chains value their work and derive satisfaction from the recognition they receive from clients and colleagues. However, farmers are often less satisfied with their earnings, which, in their view, do not adequately compensate them for the work they carry out.
Discussion and conclusion
Given the mixed results of our study, caution should be exercised when drawing conclusions. However, the findings we obtained do confirm our first hypothesis. In other words, on most of the farms studied, the value added by processing and marketing activities allowed farmers to financially sustain their activity systems.
Dairy farmers registered the best performance in terms of overall profitability. They notably achieved high levels of productivity during processing, although less so during the marketing phase. Given their large production volumes, dairy farmers marketed a portion of their output to retailers or distributors since not everything could be sold through short supply chains. By contrast, vegetable and meat-producing farms were more productive during marketing. Our results suggest that, by pursuing different strategies, farmers in short supply chains successfully utilize their internal resources (e.g., financial assets, equipment, skills and labor) and take advantage of external opportunities (including proximity to clients and regional infrastructure).
Farms with lower net revenues (those that generated less than $5000 in net income per farmer) suffered from low productivity in production, which could not be sufficiently offset by higher productivity during processing and distribution. This was notably the case for sheep and apple farmers who often struggled, even via short supply chains, to obtain sales prices that covered production and processing costs and offered an adequate return. In several instances, we also found that certain values or principles defended by farmers conflicted with a purely economic approach to farming.
Our results indicate that Quebec farmers in short supply chains diversify their marketing channels (see Table 2), which is in line with the findings of other researchers (Perez et al., Reference Perez, Allen and Brown2003; Mundler and Laughrea, Reference Mundler and Laughrea2016). Through further analysis, we also found that no marketing channel stood out as having a clear positive impact on economic performance, as measured by net revenue. The benefits of farm-gate marketing (stands, U-picks and hospitality tourism), food baskets deliveries, farmer's markets and special events varied widely, which suggests that financial performance depends more on how farmers organize their work and control marketing costs than on the types of distribution channels they use. Previous studies on this question have also obtained mixed results. For instance, LeRoux et al. (Reference LeRoux, Schmit, Roth and Streeter2010) concluded that food basket deliveries and on-farm sales were the most profitable marketing strategies, while Uematsu and Mishra (Reference Uematsu and Mishra2011) found that all direct distribution channels had a positive effect, except for farmer's markets. In a more recent article, Paul (Reference Paul2019) estimated that prices for CSA baskets did not provide farmers with high-enough earnings. For the fruit and vegetable growers in our study, the sale of CSA baskets represented on average only 21% of total earnings, although five farms sold all their produce in this way.
The effect of marketing diversification on labor productivity was also not straightforward. For several of the farmers interviewed, diversifying products and marketing outlets made their work more varied and interesting. These observations corroborate the findings of Uematsu and Mishra (Reference Uematsu and Mishra2011) regarding the dual nature of acquiring new skills, which farmers can view as an obstacle to productivity growth but also as an opportunity to pursue fulfilling work. Contrary to what Aubert (Reference Aubert2013) found, no farmer in our study mentioned having diversified production in order to manage risks.
The study results also confirmed our second hypothesis. In general, participating farmers were satisfied with their activity system and strongly believed that it should be developed to reflect their personal values and projects. When we compared the three categories of satisfaction (work fulfillment, social recognition and financial performance) with overall satisfaction levels, we found that farmers were pleased with the activity systems they had built, even if they were unsatisfied with their financial results. Only one farmer reported being completely unsatisfied overall. Generally, we found that farmers were satisfied with what they earned, although they hoped to increase their revenues. This phenomenon appears to be rather common, both in Europe (Kneafsey et al., Reference Kneafsey, Venn, Schmutz, Balázs, Trenchard, Eyden-Wood, Bos, Sutton and Blackett2013) and Quebec (Mundler and Laughrea, Reference Mundler and Laughrea2016).
It is also noteworthy that extending the number of farm activities produced mixed results. As we mentioned, having a greater range of finished products reduced labor productivity during the processing stage. However, diversifying tasks and products allowed farmers to meet client expectations while giving them the opportunity to engage in varied and stimulating work. Many producers also increased their motivation to farm by developing new projects (such as manning off-farm stands, entering contests and growing more traditional crop varieties). In certain cases, a product line was added to accommodate a new full-time farm worker. On the other hand, sheep and apple farmers often had poor financial results due to a lack of product variety and because sales prices were too low.
Our results raise general questions about the supposed economic benefits of short food supply chains. In particular, the findings highlight the crucial importance of scale as net earnings from family work were higher on larger farms. This suggests that, contrary to what is often believed, short supply chains might not always favor the growth of small farms (Feenstra et al., Reference Feenstra, Lewis, Hinrichs, Gillespie and Hilchey2003; Martinez et al., Reference Martinez, Hand, Da Pra, Pollack, Ralston, Smith, Vogel, Clark, Lohr, Low and Newman2010). Many studies also indicate that consumers who purchase locally produced food do so because they wish to support local farmers (Winter, Reference Winter2003; Tregear and Ness, Reference Tregear and Ness2005; Megicks et al., Reference Megicks, Memery and Angell2012; Bianchi and Mortimer, Reference Bianchi and Mortimer2015; Aprile et al., Reference Aprile, Caputo and Nayga2016). However, our results show that farmers who participate in direct marketing initiatives accept labor-intensive work conditions and lower earnings (when compared to the number of hours worked). Short supply chains thus embody a fundamental contradiction. On the one hand, they give farmers the opportunity to no longer rely on conventional supply chains and downstream operators who have considerable market power. On the other hand, even in local food networks, farmers remain price takers who are forced to follow market prices. Moreover, since their activity systems are diversified, farmers who pursue direct marketing essentially work as small craftsmen in all areas of their business (production, processing and distribution), which means they have lower levels of productivity compared to specialized firms. As a result, farmers and their households are not fully compensated for the hours of work they do. Finally, our findings raise questions about the working conditions on farms that claim to represent an alternative to conventional food systems (Weiler et al., Reference Weiler, Otero and Wittman2016; Bruce and Som Castellano, Reference Bruce and Som Castellano2017).
Acknowledgements
This research project was financially supported by the ‘Programme de soutien à l'innovation en agroalimentaire,’ a program for supporting innovation in agriculture established following the ratification of the Growing Forward initiative between Quebec's ministry of agriculture (MAPAQ) and Agriculture and Agri-Food Canada.
Appendix 1: Classification of tasks