INTRODUCTION
The aim of this review is to explain mass spectrometry-based metabolomics to non-specialists and to give some indication of its potential in elucidating parasite metabolomes. The major part of the review will focus on the mass spectrometric techniques in metabolomics using examples from the author's work at the same time citing, where relevant, recent advances in the field produced by other research groups. Finally a review is made of the applications of mass spectrometry in the study of low molecular weight (<1000 amu) metabolites in parasites.
Biomarkers have been sought for many years in a variety of ways. Changes in the expression of metabolites are important with regard to disease diagnosis and treatment and there are many examples in the literature e.g Woods et al. Reference Woods, Tuchman, Robison, Bernstein, Leclerc, Brisson, Brossard, Hill, Shuster, Luepker, Byrne, Weitzman, Bunin and Lemieux1996; Xu et al. Reference Xu, Shen, Wiper, Wu, Morton, Elson, Kennedy, Belinson, Markman and Casey1998; Zytkovicz et al. Reference Zytkovicz, Fitzgerald, Marsden, Larson, Shih, Johnson, Strauss, Comeau, Eaton and Grady2001; Chace et al. Reference Chace, Kalas and Naylor2003; Frank et al. Reference Frank and Hargreaves2003; Wang et al. Reference Wang, Gona, Larson, Tofler, Levy, Newton-Cheh, Jacques, Rifai, Selhub, Robins, Benjamin, D'agostino and Vasan2006. In the field of parasitology, markers of unusual metabolism may provide leads providing the possibility of new therapeutic targets. Thus, for instance, as early as the 18th century a black pigment was observed to accumulate in the brains and spleens of people who had died from malaria (Hänscheid et al. Reference Hänscheid, Egan and Grobusch2007). The pigment, haemazoin, represents something unique about the metabolism of Plasmodia in that they have to detoxify the haemoglobin they accumulate during their intraerythrocytic stage. Unwittingly, according to recent theory, this pigment was selected as the therapeutic target of quinine, and subsequently related antimalarials, which inhibits its formation and is thus indirectly toxic to the parasite. Differences in metabolic pathways between parasites and their mammalian hosts could potentially be exploited as drug targets. The most suitable targets would be those where mammalian and parasite metabolism diverge most widely so that drugs targeting such differences would have low toxicity in the host. Metabolomic approaches have the potential to uncover such differences. The principal difference between metabolomics/metabonomics and earlier metabolite profiling methods is that advances in instrumental and data processing methods have made it possible to profile a greater portion of the metabolome in a single analysis.
The terms metabolomics and metabonomics are often used interchangeably and they both belong in the group of ‘omics’ technologies. Genomics identifies genes, transcriptomics indicates which genes are being converted into RNA, proteomics indicates whether or not the RNA is translated into protein and then further downstream whether or post-translation modifications such as phosphorylation or glycation are made to the protein, and finally metabolomics/metabonomics indicates whether or not protein expression results in changes in metabolite profiles. Trying to make or omitting to make a distinction between metabolomics and metabonomics generally excites controversy. In this review metabolomics is used to cover both terms. Since the range of metabolites covered by metabolomics is so broad, specialist branches of metabolomics, such as lipidomics, glycomics and even metallomics have also evolved (Morrelle et al. Reference Morelle, Chirat, Faid and Michalski2006; Watson, Reference Watson2006).
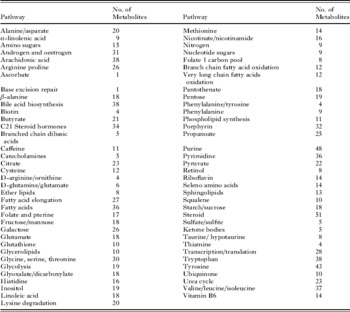
A fundamental question in metabolomics is how many metabolites would we expect to see within a metabolome? The human metabolome database has 6500 entries (Table 1) for metabolites. However, there are effectively many more potential metabolites not included in Table 1 such as the abundant permutations of lipid structures and the numerous small peptides. There are no lists of metabolites which are entirely comprehensive. Many important metabolites are present at low levels and are thus difficult to detect. Thus there are two questions which are difficult to answer when attempting to create a metabolic profile: (1) Which metabolites are not detected because they are only present in small amounts? (2) Which metabolites are not detected because the analytical method used is not suitable for their analysis?
Metabolites and their pathways taken from the human metabolome database (www.hmdb.ca).

The most comprehensive attempt to answer this question to date has been made by van der Werf et al. (Reference van der Werf, Overkamp, Muilwijk, Coulier and Hankemeier2007) who used a combination of two liquid chromatographic methods in combination with high resolution mass spectrometry and two gas chromatography-mass spectrometry methods which enabled detection of around 500 metabolites. This was the majority of metabolites predicted from the genomes of Escherichia coli, Saccharomyces cerevisiae and Bacillus subtilis. Phospholipids were not included in the profile.
The first technique to be widely applied in metabolomics was nuclear magnetic resonance spectroscopy (NMR). NMR can provide complementary information to mass spectrometric-based metabolomic profiling although it is generally a less sensitive and less specific technique.
Mass spectrometry is a powerful metabolomic technique since it is able to observe a large number of metabolites over a wide dynamic range (Kamleh et al. Reference Kamleh, Dow and Watson2009). As mentioned above, a number of different mass spectrometry techniques are required to maximize coverage of the metabolome. In selecting an analytical method to detect a metabolite or set of metabolites both the ionisation method and the chromatographic method used to introduce the sample into the mass spectrometer have to be considered. In addition, the dynamic range of the MS instrument is important since concentrations of metabolites range over several orders of magnitude. Some of the options for carrying out mass spectrometric analysis are discussed below. However, the first step is to extract the sample.
SAMPLE EXTRACTION
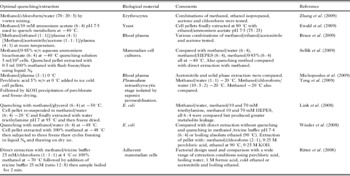
Much of the source of variability in metabolomic studies is probably due to how quickly metabolism can be stopped. There is no established rule for how extraction should be carried out since every biological system is different and the possible variations in extraction protocols are vast. Table 2 summarises some of the methods which have been tested. There seems to an increasing consensus that the quenching of metabolism and extraction should be two separate steps. Rationally this is correct since biological stability is a much greater issue than chemical stability with enzyme-catalyzed reactions occurring at a much greater rate than most chemical degradation reactions. This point is re-enforced by some of the protocols shown in Table 2 where rapid metabolic quenching is carried out at very low temperatures but metabolite extraction is carried out at high temperatures since enzymes tend to speed up as temperature rises even if the heating time required to produce denaturation is in milliseconds. There might be an argument that metabolism can be quenched quickly at high temperatures and the argument for low temperatures rests on allowing the cells, where cells are being used, to remain intact during the quenching process so that culture medium can be removed along with the quenching solution with minimal leakage of metabolites from the cells. Storage of extracts is carried out at low temperatures but if extraction has been carried out at high temperature then there is no great logic in using low storage temperatures since any unstable molecules will have already degraded. In fact, low temperature storage could have deleterious effects through promoting physical instability of the sample through causing precipitation or adherence of metabolites to the storage container wall.
Some extraction methods used in metabolomics.

MASS SPECTROMETRY IONISATION METHODS
Positive ion electrospray ionisation (PIESI)
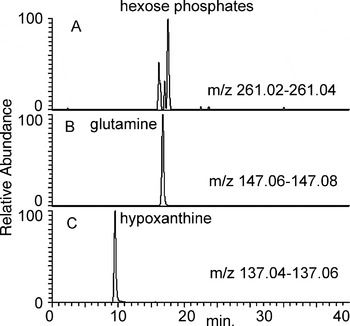
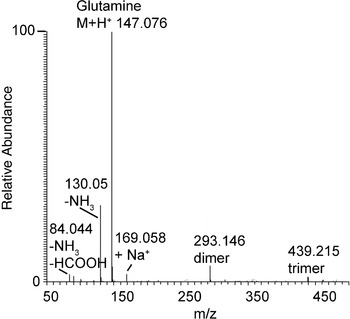
PIESI is the most common ionisation technique which is used in conjunction with liquid chromatography (LC). It is most sensitive for compounds containing an amine group and such compounds should be detectable to levels below 1 ng/ml. However, the technique also works well for amides and, surprisingly, also quite well for phosphates. Fig. 1 shows narrow range extracted ion traces representing three classes of molecule in an extract from in vitro cultured trypanosomes. Trace A shows three protonated hexose phosphates, trace B shows glutamine which is an amine, and trace C shows hypoxanthine which, despite containing four nitrogen atoms, is a weakly acidic nitrogen compound. PIESI does not work well for polar acids such as Krebs cycle acids or for neutral sugars, although some fatty acids can be observed in this mode. PIESI produces more efficient ionization when the content of organic solvent in the mobile phase is high since this encourages droplet evaporation and the formation of gas phase ions. In addition, it is important to consider ionization suppression under ESI conditions where high levels of environmental contaminants or abundant matrix constituents can reduce ionisation efficiency. Thus it is generally best to combine mass spectrometry with a chromatographic step rather than directly infusing samples into the instrument where ion suppressive molecules, such as salts, are introduced at the same time as the analytes of interest. The spectra produced in PIESI mode are generally quite simple. Fig. 2 shows the mass spectrum of glutamine. The spectrum is dominated by the protonated molecular ion although some additional ions can be observed such as: the ion at m/z 130·05 which is a fragment ion formed by loss of ammonia from the molecular ion; the ion at m/z 169·06 which is due to addition of sodium to the molecular ion rather and a proton, the ion at m/z 84·04 is due to loss of formic acid and ammonia from the molecular ion and the ion at m/z 293·15 is due to a dimer of glutamine which forms within the instrument. Such ions complicate the analysis of global metabolite profiles since they can be attributed to metabolites and have greater intensities than the peaks for some of the low level metabolites. Thus care has to be taken to check data for such artifacts.
Extracted ions traces of some of the metabolites in a trypanosome pellet analysed in PIESI mode on a HILIC column (4·6×150 mm, 5 μm particle size, mobile phase A 0·1% formic acid in water mobile phase B 0·1% formic acid in acetonitrile, 0·3 ml/min. Solvent program 0 min. 80% B-12 min 50% B-26 min 50% B-36 min 20% B).

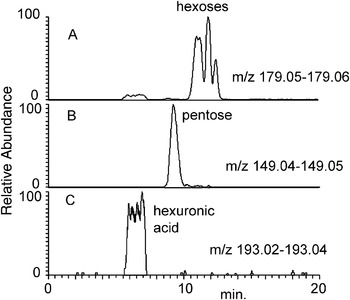
Extracted ion traces of some of the metabolites in a trypanosome pellet analysed in NIESI on a HILIC column (conditions as in Fig. 1).

Negative ion electrospray ionisation (NIESI)
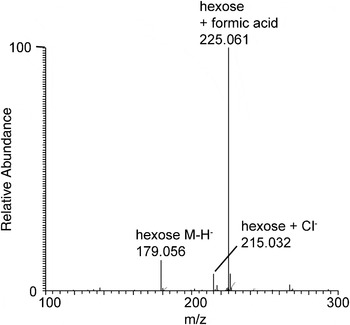
NIESI is generally somewhat less sensitive than PIESI and consequently detects fewer compounds. Some compounds show up both in NIESI and PIESI modes. For example, the amino acids can carry either a positive or a negative charge. The main groups of compounds which can be detected exclusively in negative ion mode are neutral sugars and organic acids such as the Krebs cycle acids. Fig. 3A shows a group of hexoses, Fig. 3B, a pentose and Fig. 3C glucuronic acid extracted from trypanosomes and analysed in NIESI. These compounds cannot be observed in PIESI. The chromatographic peak for glucuronic acid is rather broad and good chromatographic peak-shape is difficult to obtain for polar acids analysed by LC-MS since there is a lack of a column suitable for their analysis. The spectra, as in PIESI mode, are quite simple. Fig. 4 shows the NIESI spectrum of a hexose. The deprotonated molecular ion for the sugar at m/z 179·06 is of relatively low intensity and the spectrum is dominated by an adduct ion at m/z 225·06 which is formed between the hexose and formate, which is a component in the chromatographic mobile phase. In addition, there is an adduct ion at m/z 215·03 which is due to the formation of an adduct between the sugar and traces of chloride present in the mobile phase. Again such additional ions complicate interpretation of global metabolic profiles.
PSESI spectrum of glutamine showing adduct and fragment ions which contribute to the metabolite profile.

Spectrum of a hexose extracted from a trypanosome pellet analysed in NIESI mode.

Electron impact ionisation (EI)
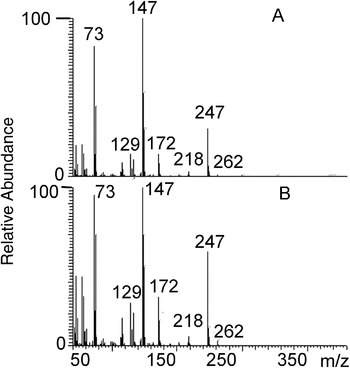
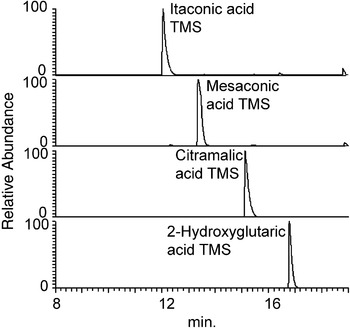
EI is usually used in gas chromatography mass spectrometry (GC-MS). No satisfactory interface combining LC with EI has been developed. An advantage of EIMS is that the spectra obtained contain many fragments and such fragments can be used to produce a diagnostic fingerprint which can be matched to spectral libraries via mass/intensity correlation. Since EI as a technique has been around for nearly 60 years, compared to 20 years for ESI, the spectral libraries are extensive and contain over 100,000 spectra; in addition fragmentation patterns are very reproducible in this mode. Fig. 5 shows a comparison of the spectra obtained for the di-trimethylsilyl (TMS) derivative of succinic acid extracted from trypanosomes compared with the TMS derivative of a succinic acid standard. In the case of organic acids, good chromatographic resolution is important since in many cases more than one isomer is possible. Fig. 6 shows the extracted ion chromatograms of two pairs of isomers, itaconic and mesaconic acids and citramalic and 2-hydroxyglutaric acids; these pairs cannot be readily separated by LC methods but the high resolving power of a GC capillary column allows their separation.
Comparison of the EI spectrum of succinic acid di TMS extracted from trypanosomes (A) compared a with succinic di TMS standard (B).

GC-MS separation of itaconic/mesaconic and citramalic/2-hydroxyglutaric acid TMS derivatives on a Rtxi column 30×0·25 mm i.d×0·25 μm film.

Matrix assisted laser desorption (MALDI)
MALDI, or a technique like it, is the missing ionization technique for use in conjunction with chromatographic techniques. It is used as a static technique requiring the sample to be deposited on a plate. There are some molecules which are difficult to ionise under ESI conditions but which ionise efficiently with MALDI. For example, highly phosphorylated compounds such as ATP, NADP and acetyl CoA are readily ion suppressed under ESI conditions but ionise well when MALDI is used. Extensively phosphorylated compounds tend to pair strongly with ions commonly available in the biological matrix such as sodium and the tight ion pairs formed do not ionise readily under ESI conditions. Although MALDI does not interface readily with chromatography, it is possible to get automated systems which collect LC fractions and spot these onto MALDI plates. MALDI will become increasingly important for the spatial mapping of biomarkers for example in tissues infected by parasites. Recently a sensitive method for the combination of capillary electrophoresis separation and MALDI with automated collection of fractions has been reported (Amantonico et al. Reference Amantonico, Urban and Zenobi2009).
SEPARATION METHODS
Some early work in metabolomics used direct infusion of samples into ion cyclotron resonance mass spectrometers. However, a chromatographic step is generally important in order to minimize the risk of ion suppression effects and also in order to be able to distinguish between isomers.
Reversed phase chromatography
Reversed-phase chromatography (RPC) is often used for analysis of metabolomic samples. It is very useful for lipophilic compounds and is the technique of choice for the analysis of most drugs in biological matrices. There is a disadvantage to using RPC with biological samples because lipophilic compounds such as phospholipids and polymeric residues from plastic-ware tend to accumulate on-column and elute in subsequent runs causing interference and ion suppression, unless a washout programme with high levels of organic solvent is included in the run. In metabolic profiling, the resolving power of RPC can be increased by using ultra performance liquid chromatography (UPLC) (Plumb et al. Reference Plumb, Granger, Stumpf, Johnson, Smith, Gaulitz, Wilson and Castro-Perez2005; Dunn et al. Reference Dunn, Broadhurst, Brown, Baker, Redman, Kenny and Kell2008; Gika et al. Reference Gika, Theodoridis, Extance, Edge and Wilson2008a; Zelena et al. Reference Zelena, Dunn, Broadhurst, Francis-McIntyre, Carroll, Begley, O'Hagan, Knowles, Halsall, Wilson, Kell and Consortium2009). UPLC offers high chromatographic efficiency: a typical 1·7 μm particle size column delivers about 2·5 times the efficiency of a 5 μm particle column and, because of the flat van Deemter plot obtained with low particle size, very high mobile phase flow rates can be used without compromising efficiency. While fast separations can be obtained by using UPLC, because of the high back pressures the number of plates per column is limited i.e. the pressure required to pump solvent through long columns is high. The highest number of theoretical plates (peak capacity) could be obtained by connecting several 5 μm columns in series (Desmet, Reference Desmet2008). The disadvantage of this approach is that run times are relatively long; however in biomarker discovery, high throughput analyses are less important than accurate identification. UPLC is perhaps more appropriate for rapid screening post-biomarker discovery. Many biomolecules are not well retained in RPC and thus polar amino acids such as glycine and alanine will elute in the void volume of most columns – as will sugars, small peptides, pyrimidines and polyamines. Elution in the void volume is not desirable because no true chromatographic information is available and also there is the risk of ion suppression since the inorganic salts present in the biological matrix also elute in the void. Some of these problems can be solved by using hydrophilic interaction chromatography (HILIC).
HILIC
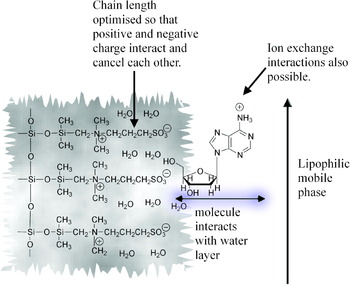
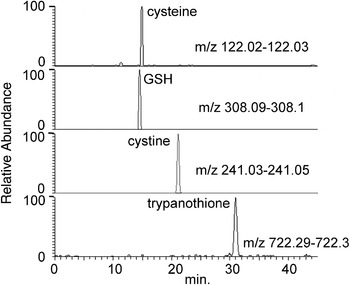
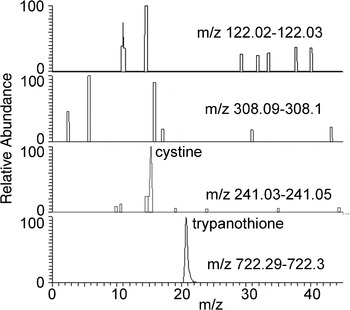
HILIC provides an alternative to reversed-phase chromatography. This option has been around for years in the form of aminopropyl columns which are commonly used in the analysis of sugars. Fig. 7 illustrates the principle behind HILIC, on the ZICHILIC phase from Sequant, which involves the use of the water layer associated with column surface as a pseudo-stationary phase. The zwitter ion coating in theory is charge neutral thus minimising ion exchange interactions with the analyte and the chain length separating the positive and negative charges of the ZICHILIC column is optimised so that the charges on the column surface can fold round and interact to neutralise each other; undoubtedly some ion exchange interactions occur. The column is used with a high organic solvent content in the mobile phase which favours ionisation under ESI conditions and is also beneficial in reducing the diffusion related mass transfer terms in the van Deemter equation thus increasing column efficiency. Fig. 8 shows some polar compounds extracted from a trypanosome pellet analysed on a ZICHILIC column. These compounds do not retain even on polar embedded C18 columns. There is an increasing number of HILIC columns on the market or under development (Gika et al. Reference Gika, Theodoridis and Wilson2008b; Pesek et al. Reference Pesek, Matyska, Fischer and Sana2008, Reference Pesek, Matyska, Loo, Fischer and Sana2009; Callahan et al. Reference Callahan, Souza, Bacic and Roessner2009; Weisenberg et al. Reference Weisenberg, Butterfield, Fischer and Rhee2009). Fig. 9 shows the same set of polar compounds shown in Fig. 8 analysed on a TSK amide HILIC column. The mobile phase conditions were the same as for the ZICHILIC column. The column produces good retention for trypanothione but cysteine, cystine and GSH were not detected. The reason for this is currently unclear but there may be some additional ion suppression effects on this column (see discussion below). Figs. 10 and 11 compare the retention times of some other polar compounds on the ZICHILIC column and the TSK column. Although putrescine can be seen on both columns a satisfactory peak for the more polar polyamine spermidine is only obtained on the TSK amide column. Two phosphates, AMP and NAD, are well retained on both columns but their peak shapes are better on the ZICHILIC column. Thus it is clear that the type of column used can have a strong effect on the results obtained.
The mechanism of action of a ZICHILIC column.

Separation of polar sulphur compounds extracted from trypanosomes on a ZICHILIC column (conditions as in Fig. 1).

Sulphur compounds in a trypanosome pellet analysed on a TSK amide HILIC column (2·1 mm×150 mm, 5 μm particle size. Mobile phase conditions as in Fig. 1 with a flow rate of 0·1 ml/min).

Putrescine, spermidine, AMP and NAD in a trypanosome pellet analysed on a ZICHILIC column (conditions as in Fig. 1).

Putrescine, spermidine, AMP and NAD in a trypanosome pellet analysed on a TSK gel amide column (conditions as in Fig. 9).

Capillary GC
Capillary GC offers very high separation efficiency and typical efficiencies for a standard 30 metre GC capillary column are ca 140,000 plates compared to efficiencies of around 20,000 plates for a 15 cm HPLC column packed with 3 μm particles. This equates to a resolving power for the GC column which is 2·6 times that of the HPLC column. The drawback of GC is that the sample has to be volatile and not all compounds are volatile. A wide range of compounds are volatile once they are converted to their trimethylsilyl (TMS) derivatives including: Krebs cycle acids, amino acids, sugars and sugar phosphates and steroids. There is a choice of capillary GC columns but generally non-polar columns such as DB-1 or weakly polar columns such as DB-5 are used. An advantage of GC is that peak resolution can be simply controlled by the temperature programme used for the GC oven. Thus GC-MS methods are completely complementary to LC-MS methods and allow analysis of certain sets of metabolites such as Krebs cycle acids with a high degree of confidence.
Capillary electrophoresis
Capillary electrophoresis (CE) interfaced with mass spectrometry is a popular method of analysis for metabolomic samples with over 100 publications employing it within the last five years, 50 of these falling within the past year. It has a similar or even better resolving power than capillary GC and thus is very good for separating isomeric compounds and it also allows injection of extremely small volumes. Recently the direct analysis of aliquots (6 nl) of the contents of a single cell using CEMS was reported (Lapainis et al. Reference Lapainis, Rubakhin and Sweedler2009). Since the volumes which can be loaded onto CE columns are only very small it has suffered from a lack of sensitivity but the stability of the interfaces between CE and MS have improved allowing much more sensitive analyses. Sensitivity in CE can also be improved by sweeping and stacking methods which utilise the ability of CE to focus analytes injected in large volumes on the basis of differential migration rates. The simplest stacking method is to inject the sample in an electrolyte of low conductivity compared to the running buffer so that the ions in the sample experience a relatively high potential difference compared to the background electrolyte and focus at the leading edge of the sample plug. A recent paper on metabolomics used isotachophoresis to focus a plug of sample ions between plugs of formic acid and ammonium hydroxide. In simple terms, an individual analyte, which has to be pH sensitive, is squeezed into a narrow band since the formic acid and ammonia force it in opposite directions until its molecules are uniformly charged (Baidoo et al. Reference Baidoo, Benket, Neususs, Pelzing, Kruppa, Leary and Keasling2008).
ION SUPPRESSION
Ion suppression can take two forms. Abundant background ions can compete for charge during the formation of charged ions in the electrospray. Also high levels of background ions generated from environmental contaminants can compete for space in an ion trap thus reducing the signal due to the ions of interest. Fig. 12 shows a typical series of cluster ions eluting from the TSK amide column which may be responsible for ion suppression since it co-elutes with cysteine and GSH. This series is formed from sodiated sodium formate ions and the spacing of m/z 68 within the series corresponds to one sodium formate unit, formic acid is used in the chromatographic mobile phase. In addition to causing ion suppression, such series complicate interpretation of metabolomic data. Ideally background ions should be subtracted just leaving ions originating from metabolites but not all data processing software allows this.
Sodiated sodium formate ion cluster eluting from TSK amide HILIC column.

ION SEPARATION METHODS
Quadrupoles
Single quadrupole instruments provide entry level mass spectrometry systems and they can provide complex data sets particularly if combined with good chromatography. Their main drawback is their limited ability to produce fragmentation information in LC-MS mode and low resolution which is typically 0·5 amu. In GC-MS mode with EI, fragmentation information is available as outlined above which makes single quadrupole separations more information rich in this mode. Tandem MS systems, which use three quadrupoles in series, are the standard configuration for sensitive determination drugs in pharmacokinetic studies. They deliver the most sensitive analyses in terms of detection limits being about two orders of magnitude more sensitive than trap-based instruments. They are also widely used in proteomics studies where the output is readily integrated with database searching. Ion-trap instruments do not deliver the same level of sensitivity as tandem instruments but they can carry out multiple fragmentation experiments in order to provide more detailed structural information on a compound.
Time of flight (TOF) instruments
Initially TOF was mainly linked to the pulsed ionization technique MALDI. Hybrid instruments combining quadrupole ion focusing with TOF (QTOF) have been developed over the last 15 years. In this type of instrument, TOF separation is compatible with chromatographic systems interfaced to an ESI source. Thus QTOFMS is one of the methods of choice in metabolomic analyses since it can deliver accurate mass data enabling determination of elemental compositions. The technology has been gradually improved with regard to the ability of instruments to deliver a wide dynamic range. Linear dynamic ranges are around 103 and resolving power of around 3 ppm on most instruments. There is a physical limitation to the resolving power of the instrument which is that greater resolution depends on longer flight tubes and at least one manufacturer has produced an instrument with an extended flight tube offering greater resolution.
Fourier transform ion cyclotron resonance (FT-ICR)
FT-ICR offers the highest resolving power and accuracy of all MS instruments to date and, although it offers superb resolution, the ion-ion interactions in FT-ICR decrease the dynamic range of measurement and thus inevitably metabolite coverage. FT-ICR also requires a longer time to make accurate mass measurements and is thus less compatible with chromatographic methods than other ion separation methods.
The Orbitrap mass spectrometer
In the Orbitrap, the ion separation technology is based on electrostatic trapping the ions injected into the trap between an outer barrel-like electrode and an inner spindle-like electrode (Makarov, Reference Makarov1999). The ions exhibit angular, radial and axial oscillations at frequencies all of which are mass dependent (Hu et al. Reference Hu, Noll, Li, Makarov, Hardman and Cooks2005). The m/z ratio is measured by an image current generated by the axial oscillation which is completely independent of energy and of the spatial spread of the ions. The instrument produces fast measurement of accurate masses and is thus compatible with chromatography. The instrument is very sensitive and capable of measuring analytes at a concentration of <1 ng/ml (Makarov et al. Reference Makarov, Denisov, Lange and Horning2006). The Orbitrap has some of the limitations of an FT-ICR instrument in that space-charge effects limit the number of ions that can be delivered to the trap and thus the dynamic range. In the author's experience dynamic ranges approaching 105 can be achieved. The Orbitrap is now available in three configurations: the Exactive which can measure accurate masses but has no fragmentation capability, the Discovery which can measure accurate masses and produce fragmentation information and the Orbitrap XL which can deliver accurate mass and both high and low energy fragmentation.
DATA PROCESSING
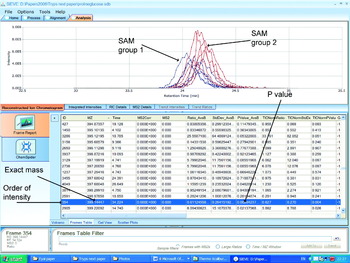
The greatest amount of time in metabolomic experiments is devoted to data processing. The first metabolomics experiments were carried out by using NMR and the standard way presenting differences between sample groups was by use of principal components analysis (PCA) in which multidimensional data were reduced to two or three dimensions. This approach is generally less useful with high resolution mass spectrometry data since the dimensions (peaks) present in a sample run can be >20,000 and PCA does not really assist in uncovering the components which have changed because the data in the loadings plots provided by the mass spectrometry data are complex. Most commercial data processing software aims to plot extracted ion chromatograms across the full scan range of the mass spectrometer. In order to do this a bin width for the ions is set e.g. 0·02 amu and extracted ion chromatograms in these bins are compared between two sample groups. Differences in the plots are highlighted and the exact masses of the ions producing the differences can be determined. This is best observed in Fig. 13 where the software has observed a difference in the intensity of the peak for S-adenosylmethionine (SAM) between trypanosomes cultured with glucose as their carbon source and trypanosomes cultured with proline as their carbon source. The red plots for the ion at m/z 399·14447 show the levels of SAM in 5 glucose grown samples and the blue plots the levels of SAM in the 5 proline grown samples. The software gives a ratio for the mean peak areas and a P value. The P value is affected by how well the chromatograms align and with poor alignment the P value will not be accurate. In Fig. 13 the alignment of the chromatographic peaks from different runs is good but not perfect. With Sieve software the data have to be carefully checked in order to ensure that no artifacts are produced by poor peak alignment. Another task in data processing is to identify metabolites from their exact masses. Automated database searching is incorporated in Sieve software but the output is not user friendly. It is possible to write a macro in Excel to search against compound lists such as the Kegg database. In practice there are many compounds which yield clear chromatographic peaks where their exact mass does not correspond to compounds in any database thus the metabolome databases are far from complete.
Comparison of S-adenosyl methionine between trypanosomes grown with glucose and their carbon source and trypanosomes grown with proline as their carbon source using Sieve software.

APPLICATIONS OF MASS SPECTROMETRY IN METABOLIC PROFILING IN PARASITES
In recent years, the main application of mass spectrometry in the study of parasites has been in the characterization of parasite proteomes. The intention of the current review is to focus on low molecular weight non-protein metabolites. There are many examples of applications of mass spectrometry in proteomic analysis of parasites and these provide most of the references to the applications of mass spectrometry to the characterization of parasites. The dividing line between metabolomic profiling and the earlier more targeted approaches to metabolite identification is not that well defined and the essentially the same techniques described above for metabolomic profiling apply albeit with less data processing involved.
Mass spectrometry has been used extensively to characterize the surface lipids and glycans of parasites. Examples include: the characterization of sulphated glycosphingolipids from the cell surface of Plasmodium falciparum by MALDITOFMS (Landoni et al. Reference Landoni, Duschak, Peres, Nonami, Erra-Balsells, Katzin and Couto2007); lipidomic analysis of Toxoplasmosa gondii which revealed the presence of usual lipids with relatively short acyl chains (Welti et al. Reference Welti, Mui, Sparks, Wernimont, Isaac, Kirisits, Roth, Roberts, Botte, Marechal and Mcleod2007); mass spectrometric characterization of parasite-specific inositol phosphorylceramides believed to be essential for survival in the host (Zhang et al. Reference Zhang, Hsu, Scott, Docampo, Turk and Beverley2005); characterization of phosphorylcholine-containing glycoconjugates in nematodes (Houston and Harnett, Reference Houston and Harnett2004); MALDITOFMS characterization of glycosphinoglipids in P. falciparum (Couto et al. Reference Couto, Caffaro, Uhrig, Kimura, Peres, Merino, Katzin, Nishioka, Nonami and Erra-Balsells2004); characterization of the N-linked glycans of Giardia intestinalis by MALDITOF and ESIMS (Morelle et al. 2005); characterization of glycosphingolipids in Schistosoma mansoni by MALDITOFMS and nanospray ESI (Wuhrer et al. Reference Wuhrer, Dennis, Doenhoff and Geyer2000, Reference Wuhrer, Kantelhardt, Dennis, Doenhoff, Lochnit and Geyer2002).
The applications of mass spectrometry in the characterization of natural and drug metabolites in parasites is quite diverse but not as extensive as might be expected. Recently PIESIMS with lithium cationisation was used to detect carotenoids in the intraerthyrocytic stage of P. falciparum (Tonhosolo et al. Reference Tonhosolo, D'alexandri, De Rosso, Gazarini, Matsumura, Peres, Merino, Carlton, Wunderlich, Mercadante, Kimura and Katzin2009). All trans β-carotene and all trans lutein were detected. The ability of the parasite to biosynthesise these compounds was confirmed by using tritium-labeled precursors.
PESIMS with reversed phase chromatography was used to determine the intracellular pools of sugar nucleotides in T. brucei, T. cruzi and Leishmania major (Turnock and Ferguson, Reference Turnock and Ferguson2007). The nucleotides GDP-mannose, UDP-N-acetylglucosamine, UDP-glucose, UDP-galactopyranose, and GDP-fucose were found in all three organisms. UDP-xylose, UDP-rhamnose and UDP-glucuronic acid were only found in T. cruzi and UDP-arabinose was only found in L. major. The identities of the nucleotides were confirmed by MS/MS. 14C-labeled purines were used to prove that purine salvage pathways in P. falciparum proceed via methylthioinosine (Ting et al. Reference Ting, Shi, Lewandowicz, Singh, Mwakingwe, Birck, Ringia, Bench, Madrid, Tyler, Evans, Furneaux, Schramm and Kim2005). Accelerator mass spectrometry was used for the analysis, this technique is highly sensitive to radio-isotope labeling.
MALDITOFMS was used to characterize oligosaccharides in urine arising for Schistosoma mansoni infection as a potential diagnostic tool (Robijn et al. Reference Robijn, Planken, Kornelis, Hokke and Deelder2008). The assay employed an antibody extraction technique for the oligosaccharides and was sufficiently sensitive to detect low level infections. In a similar vein, a MALDITOFMS method was developed as a potential diagnostic tool for P. falciparum infection (Demirev et al. Reference Demirev, Feldman, Kongkasuriyachai, Scholl, Sullivan and Kumar2002). The parasites were cultured with red blood cells and then the red blood cell membrane was selectively removed along with any haem outside the parasite cells. The hyper-accumulation of haem by the parasites could then be detected with great sensitivity.
Gas chromatography mass spectrometry was used to characterize mannans (DP4-40) in Leishmania mexicana. The sugar monomer was characterized by methanolysis followed by trimethylsilyation and the sugar linkages were characterized as being 1,2-linkages by permethylation followed by hydrolysis, acetylation and analysis of the resultant partially methylated alditol acetates by GC-MS (Ralton et al. Reference Ralton, Naderer, Piraino, Bashtannyk, Callaghan and McConville2003).
There are surprisingly few studies on drug metabolism by parasites themselves. The mode of action of clotrimazole against P. falciparum was explored and a complex formed between haem at the active site of haemoperoxidase and an oxidation product of clotrimazole could be identified by PESIMS. Inhibition of the enzyme produces oxidative stress in the parasite (Trivedi et al. Reference Trivedi, Chand, Srivastava, Puri, Maulik and Bandyopadhyay2005). An in vitro study demonstrated the reduction of antimony (V) to antimony (III) by trypanothione and a complex between antimony (III) and trypanothione was observed by using PESIMS and this was proposed as a mechanism for detoxification of antimony containing drugs by leishmania (Yan et al. Reference Yan, Li, Ding and Sun2003). MALDIMS was used to investigate the ability of T. cruzi to conjugate glutathione to a variety of polyamine substrates. It was found that T. cruzi was capable of conjugating glutathione with spermidine, spermine, N-acetylspermine, and N1- and N8-acetylspermidine the products being characterized as their thiol-bimane adducts (Ariyanayagam et al. Reference Ariyanayagam, Oza, Mehlert and Fairlamb2003). The metabolism of ethidium (Et) and isometamidium (ISM) by Trypansoma brucei was studied by using PESIMS and it was found that there was no metabolism of ISM whereas a hydroxylated and methylated metabolite of ethidium could be identified (Boibessot et al. Reference Boibessot, Turner, Watson, Goldie, Connel, Mcintosh, Grant and Skellern2002). Leishmania amazonis was treated with an anti-leishmanial chalcone, the drug was found to alter the profile of steroids in leishmania, as judged by GC-MS analysis, so that levels of C-14 demethylated and 24 alkylated sterols were changed (Torres-Santos et al. Reference Torres-Santos, Sampaio-Santos, Buckner, Yokoyama, Gelb, Urbina and Rossi-Bergmann2009). The effects of RNAi depletion of mitochondrial acyl carrier protein on respiration in procyclic T. brucei could be attributed to a decrease in phospholipid content in the mitochondrial membrane which was observed by using PESIMS (Guler et al. Reference Guler, Kriegova, Smith, Lukes and Englund2008). Gas chromatography mass spectrometry was used to monitor polyamine levels in P. falciparum treated with inhibitors of spermidine biosynthesis (Kaiser et al. Reference Kaiser, Gottwald, Wiersch, Lindenthal, Maier and Seitz2001). Dicylohexylamine, 1,7 diaminoheptane and agatamine all caused a fall in spermidine levels within the cells and also reduced the levels parasitaemia when the parasites were cultured with human erythrocytes. Supplementation with spermidine restored the levels of parasitaemia in the presence of the inhibitory drugs. GC-MS also detected the presence of homospermidine in P. falciparum.
Although the general field of mass spectrometry-based metabolomics is expanding rapidly there are relatively few papers which are focused on the used of mass spectrometry in parasite metabolomics. One of the first publications on parasite metabolomics per se was on the analysis of the metabolic profile of trypanosomes by direct infusion Fourier transform MS (Breitling et al. Reference Breitling, Ritchie, Goodenowe, Stewart and Barrett2006), information-rich data sets were produced containing many lipid species. At about the same, time a paper on the application of GC-MS in the metabolic profiling of leishmania was published (De Souza et al. Reference De Souza, Saunders, McConville and Likic2006), wild type and resistant strains of leishmania could be separated on the basis of the pattern of their metabolites. The method for the handling of GC-MS data collected from extracts of parasites was refined in a subsequent paper (Robinson et al. Reference Robinson, De Souza, Keen, Saunders, McConville, Speed and Likic2007). The application of hydrophilic interaction chromatography (HILIC) coupled with Fourier transform mass spectrometry (FT-MS) to the profiling of procyclic trypanosomes cultured with glucose or proline as their carbon source was reported by Kamleh et al. (Reference Kamleh, Barrett, Wildridge, Burchmore, Scheltema and Watson2008), the switch to proline as a carbon source increased the levels of a number of metabolites including glutamine and glutathione. A new methodology for handling data sets derived from FT-MS analysis of trypanosomes delivering improved mass accuracy and subtracting background peaks was reported (Scheltema et al. Reference Scheltema, Kamleh, Wildridge, Ebikeme, Watson, Barrett, Jansen and Breitling2008). Mass spectrometry-based metabolomics of the parasite Plasmodium falciparum were carried out over its 48 hr intraerythrocytic developmental cycle (Olszewski et al. Reference Olszewski, Morrisey, Wilinski, Burns, Vaidya, Rabinowitz and Linas2009), metabolites were found to fluctuate over the developmental cycle. Arginine was found to be an important metabolite with the parasite converting it to ornithine and this might account for the development of hypoarginemia in cerebral malaria.
ACKNOWLEDGEMENTS
I thank my collaborators at Glasgow University Mike Barrett, Richard Burchmore, David Wildridge and Isabel Vincent for providing trypanosome samples.