Introduction
Rare earth elements (REEs) are critical resources, many deposits of which are associated with magmatic carbonatites in orogenic belts (Nabyl et al., Reference Nabyl, Massuyeau, Gaillard, Tuduri, Iacono-Marziano, Rogerie, Trong, Carlo, Melleton and Bailly2020; Beland and Williams-Jones, Reference Beland and Williams-Jones2021; Wang et al., Reference Wang, Li, Santosh, Yan, Shen, Yuan, Alam and Li2024). The origin of the well-known Bayan Obo carbonatite REE-Nb-Fe deposit, which is the world’s largest supplier of REE metals (Song et al., Reference Song, Xu, Smith, Chakhmouradian, Brenna, Kynický, Chen, Yang, Deng and Tang2018; Wang et al., Reference Wang, Li, Santosh, Yan, Shen, Yuan, Alam and Li2024) occurring along the northern margin of the North China Craton is linked to the partial melting of carbonated ocean crust and REE-rich sediments subducted to the mantle (Hou et al., Reference Hou, Tian, Yuan, Xie, Yin, Yi, Fei and Yang2006; Xu et al., Reference Xu, Kynicky, Chakhmouradian, Campbell and Allen2010, Reference Xu, Kynicky, Chakhmouradian, Li and Song2015a). However, high-pressure experimental studies substantiating this hypothesis are currently lacking. Several natural hydroxyl REE carbonate minerals, such as hydroxylbastnäsite-(La, Ce, Nd), and kozoite-(La, Nd), have been identified globally in subduction-related regions such as Hungary, Bosnia and Herzegovina (former Yugoslavia), and Japan (Farkas et al., Reference Farkas, Maksimovic and Panto1985; Jovic et al., Reference Jovic, Radusinovic and Pajovic2009; Kirillov, Reference Kirillov1964; Maksimovic and Panto, Reference Maksimovic and Pantó1985; Miyawaki et al., Reference Miyawaki, Matsubara, Yokoyama, Takeuchi, Terada and Nakai2000, Reference Miyawaki, Matsubara, Yokoyama, Iwano and Yukinori2003; Michiba et al., Reference Michiba, Tahara, Nakai, Miyawaki and Matsubara2011, Reference Michiba, Miyawaki, Minakawa, Terada, Nakai and Matsubara2013; Voigt et al., Reference Voigt, Rodriguez-Blanco, Vallina, Benning and Oelkers2016). These occurrences, linked to the Alps-Carpathian orogen and Circum-Pacific island arcs, support the hypothesis that REE-bearing carbonates can form through the recycling of oceanic carbonate and sediments in subduction zones (Elderfield et al., Reference Elderfield, Hawkesworth, Greaves and Calvert1981; Wang et al., Reference Wang, Fan, Zhou, Yang and She2020; Turchyn et al., Reference Turchyn, Bradbury, Walker and Sun2021). Understanding the stability of these minerals under high-pressure conditions is essential for tracing REE, carbon and water transport into the deep Earth in subduction zones. Some carbonate minerals, such as calcite, aragonite, magnesite, and their solid solution phases (Gao et al., Reference Gao, Huang, Wu, Fan, Wu, Xia and Qin2015; Oganov et al., Reference Oganov, Glass and Ono2006; Ono et al., Reference Ono, Kikegawa, Ohishi and Tsuchiya2005) have been investigated using high-pressure and high-temperature experiments. Similarly, hydrous carbonates, including malachite and azurite, have been investigated at high pressures (Merlini et al., Reference Merlini, Perchiazzi, Hanfland and Bossak2012; Xu et al., Reference Xu, Kuang, Zhang, Liu, Fan, Zhou and Xie2015b). Hydroxyl REE carbonates, such as Ce(CO3)OH, Nd(CO3)OH, Y(CO3)OH and Dy(CO3)OH, have also been synthesized experimentally (Kirillov, Reference Kirillov1964; Christensen et al., Reference Christensen, Sundström, Wachtmeister, Songstad, Norbury and Swahn1973; Chai and Mroczkowski, Reference Chai and Mroczkowski1978; Kutlu and Meyer, Reference Kutlu and Meyer1999). Among these, hydroxylbastnäsite-(Ce) has a hexagonal structure (Kirillov, Reference Kirillov1964), while kozoite-(Nd) and kozoite-(La) are orthorhombic (Dexpert and Caro, Reference Dexpert and Caro1974; Miyawaki et al., Reference Miyawaki, Matsubara, Yokoyama, Iwano and Yukinori2003). However, only very limited high-pressure experimental studies have been conducted on RE(CO3)OH phases (e.g. Song et al., Reference Song, Liu, Li, Jin, Wang and Wu2019, on hydroxylbastnäsite-(Ce)), leaving their stability and behaviour under extreme conditions largely unexplored.
In this study, we employed a cubic-anvil-type apparatus to synthesize high-quality single crystals of ‘hydroxylbastnäsite-(Sm)’, [Sm(CO3)OH], at 3 GPa and 1073 K. The crystal structure of the ‘hydroxylbastnäsite-(Sm)’ phase was determined using single-crystal X-ray diffraction (XRD). Note: at present [Sm(CO3)OH] is not known to have been found as a natural mineral and it is not on the list of minerals approved by the IMA, hence it is listed in quotes as the ‘hydroxylbastnäsite-(Sm)’ phase. Its high-pressure behaviour was investigated using in situ synchrotron radiation XRD and Raman spectroscopy. We present a detailed discussion of the experimental results, focusing on the structural stability, phase behaviour, and potential geochemical implications of ‘hydroxylbastnäsite-(Sm)’ under high-pressure and high-temperature conditions.
Sample and experimental setup
Synthesis of the ‘hydroxylbastnäsite-(Sm)’ crystal
The starting materials Sm2(C2O4)3·10H2O (99.99%, Alfa Aesar) and H2C2O4 (anhydrous, 98%, Alfa Aesar) were mixed (molar ratio 1:2) and ground in an agate mortar. The sample pellet was sealed into a silver capsule (0.1 mm thick) of 5 mm diameter and 3 mm length. Using pyrophyllite as a pressure medium, the high-pressure synthesis was performed on a DS 6×600 t cubic-anvil-type apparatus (CAS Key Laboratory of High-Temperature and High-Pressure of Earth’s interior, Institute of Geochemistry Chinese Academy of Sciences) at the conditions of 3 GPa and 1073 K for 2 h. Subsequently, it was quenched to room temperature, and the pressure was released over at least three hours. The ‘hydroxylbastnäsite-(Sm)’, was retrieved after removing the silver cover. Next, the products were filtered through glass vacuum filters with 2.5 μm filter paper and rinsed several times with deionized water and isopropyl alcohol. The resultant samples were dried at room temperature for 12 hours. The synthesized sample is a hexagonal prismatic single crystal with excellent crystallinity, confirmed by optical microscopy and X-ray diffraction analysis. The detailed assembly design of the DS 6×600 t cubic-anvil-type apparatus is described in He et al. (Reference He, Tang, Fei and Liu2014). This assembly method is commonly used in hinge-type multi-anvil apparatus.
XRD analysis
A Rigaku Xtalab PRO diffractometer with a HyPix-6000 HE detector was used for single crystal XRD measurements at room temperature and ambient pressure. A 1.2 kW water-cooled microfocus source with a Mo rotor target and multilayer mirrors was used to acquire intensity data. The CrysAlisPro processing software was used to process the data (CrysAlis, 2014). The structure was determined by the SHELXS package and refined with the SHELXL program (Sheldrick, Reference Sheldrick2008) in the anisotropic approach for non-hydrogen atoms. The positions of the hydrogen atoms were modelled based on geometric considerations and not determined experimentally in this study. The crystal structure of ‘hydroxylbastnäsite-(Sm)’ phase, was visualized by VESTA3 (Momma and Izumi, Reference Momma and Izumi2011).
The crystallographic data for ‘hydroxylbastnäsite-(Sm)’ are listed in the Supplementary material, in Table S1. The final atomic coordinates and isotropic displacement parameters for all atoms are listed in Table S2. Table S3 shows the anisotropic displacement parameters for the Sm sites. The values in parentheses show standard deviations in the last digit. Selected bond lengths and angles calculated from the atomic parameters are listed in Table S4 and S5, respectively. The CIF has been deposited with the Supplementary material.
Synchrotron X-ray diffraction experiment
A BX90 diamond anvil cell (DAC) with 400 μm culet diamond anvils generated high pressure (Kantor et al., Reference Kantor, Prakapenka, Kantor, Dera, Kurnosov, Sinogeikin, Dubrovinskaia and Dubrovinsky2012). A rhenium plate with a pre-indented thickness of 50 μm was used as the gasket, and a hole with a diameter of 200 μm was drilled as a sample chamber. Silicone oil was used as a quasi-hydrostatic pressure-transmitting medium, and a spherular ruby was used as a pressure gauge (Mao et al., Reference Mao, Xu and Bell1986). Pressures were determined before and after the measurement with an accuracy of better than ± 1 GPa. It reflects the uncertainty in pressure determination due to the ruby fluorescence method and the quasi-hydrostatic conditions provided by silicone oil. In situ high-pressure powder XRD measurements were carried out at the 4W2 beamline of the Beijing Synchrotron Radiation Facility (BSRF). The synchrotron X-ray beam is monochromatic with a wavelength of 0.6199 Å. An image plate detector Pilatus (Pixels:1475×1679; Pixel size:172×172) was used to collect the three-dimensional diffraction patterns, and the CeO2 standard calibrated the geometric parameters. Synthesized Sm(CO3)OH crystals were ground into fine powder in an agate mortar and loaded into the sample chamber. In this experiment, 14 diffraction patterns were collected for 60 s per pattern. The diffraction patterns were integrated by the Fit2D program (Hammersley, Reference Hammersley2016). The unit cell parameters were calculated and refined using the software PDIndexer (Seto, Reference Seto2010).
Raman spectroscopy experiments
A HORIBA Lab RAM HR Evolution spectrometer with a 532 nm excitation laser and 1800 grating was used to measure the Raman spectra at ambient conditions. A laser beam of 2 µm diameter was focused on with a CCD detector having a spectral resolution of <1 cm−1. For the Raman measurement at ambient conditions, 10 times of 20 s acquisitions with an output power of 40 mW were performed in each run. The spectra were obtained initially with Horiba Labspec6 (HORIBA France SAS), then with Origin 8.5 and the Gaussian peak fitting algorithm. The high-pressure Raman scattering experiment used a confocal Raman system with a solid laser. The laser wavelength was 532 nm in all the runs, and a triple grating monochromator (Andor Shamrock SR-303i-B, EU) was combined with a CCD Model DU970P-UVB and ANDOR Newton, EU. The spectrometer was calibrated with silicon wafers before each operation (Temple and Hathaway, Reference Temple and Hathaway1973) to ensure the uncertainty was ∼0.5 cm−1. The acquisition condition was modified to 20 times for every 5 seconds under the output power of 40 mW in each run to obtain the high-pressure Raman spectra.
High pressures and high temperatures were generated by a resistance external heating system set up in a DAC. The high-temperature environment in this study was simulated using an external resistance heating method in a DAC. Platinum metal wires were wound around the DAC sample chamber to generate heat through electrical resistance (Kantor et al., Reference Kantor, Prakapenka, Kantor, Dera, Kurnosov, Sinogeikin, Dubrovinskaia and Dubrovinsky2012; Mao et al., Reference Mao, Fan, Lin, Yang, Tkachev, Zhuravlev and Prakapenka2015). The temperature of the sample was determined by a K-type thermocouple attached to one of the diamond anvils ∼500 µm away from the diamond culet. This heating method was chosen for its slight temperature gradient, strong temperature control capability, and low-temperature error, which were well-suited to the experimental requirements of this study. High-pressure and high-temperature Raman scattering measurements were conducted with a laser wavelength of 532 nm and a triple grating monochromator (Andor Shamrock SR-303i-B, EU), combined with a CCD Model 133 DU970P-UVB, by ANDOR Newton, EU.
Results and discussion
XRD: crystal structure and compressibility
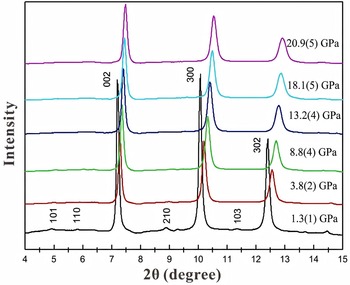
The single-crystal XRD measurement at ambient conditions of the synthesized crystal of Sm(CO3)OH revealed a hexagonal structure with cell parameters of a = b = 12.2143 (7) Å, c = 9.8393 (6) Å, V = 1271.26 (17) Å3 and a space group of  $P\bar 6$. The unit cell of the ‘hydroxylbastnäsite-(Sm)’ phase contains 18 Sm(CO3)OH formula units and is isomorphous with the series of synthesized hexagonal RE(CO3)OH, such as Ce(CO3)OH (Michiba, et al., Reference Michiba, Tahara, Nakai, Miyawaki and Matsubara2011). The SmO9 tricapped trigonal prisms are the building units in the crystal structure (Fig. 1). The (OH)− ions are located at the centre of triangles formed by three Sm cations to connect these Sm cations (Fig. 1, lower). The crystal structure of ‘hydroxylbastnäsite-(Sm)’ can be described as stackings of 2∞[(OH)Sm3/3]2+ layers extending parallel to the ab plane. The layers are linked by (CO3)2− groups as bidentate and monodentate ligands, and stack in the [001] direction (Fig. 1, upper). The high-pressure experiments on the Sm(CO3)OH crystal were performed in the pressure range of 1.3–20.9 GPa, and the representative powder XRD patterns are shown in Fig. 2. Due to experimental limitations, XRD data at ambient conditions were not collected. No significant appearance of new XRD peaks or systematic disappearance of major peaks was observed during the experiment, though some weak peaks (e.g. 101, 110, 210 and 103) became gradually undetectable at higher pressures. This is probably due to their inherently low intensity rather than a phase transition, as the overall consistency of the XRD patterns supports structural stability under high pressure. The lattice parameters are listed in Table S6.
Projection of the crystal structure of ‘hydroxylbastnäsite-(Sm)’ onto (100) (upper) and (001) (lower). Blue, brown, red and pink spheres represent Sm, C, O and H (modelled positions), respectively. The crystal structures were rendered by the structure-drawing program VESTA3 (Momma and Izumi, Reference Momma and Izumi2011).

Figure 1 Long description
The upper projection displays the crystal structure with blue spheres in a layer representing Sm, connected to red H spheres. The H are connected to C shown as brown spheres with the C in the centre of a pyramid. Pink oxygens are also present attached to some hydrogens.The lower projection shows a different view of the same crystal structure, with similar atomic arrangements.
The XRD patterns of Sm(CO3)OH at different high-pressures and ambient temperature.

Figure 2 Long description
A graph showing X-ray diffraction patterns of Sm(CO3)OH at different pressures. The x-axis is labelled as 2 theta degree, ranging from 4 to 15. The y-axis is labelled as intensity. Six curves are plotted, each representing a different pressure: 1.3, 3.8, 8.8, 13.2, 18.1 and 20.9 gigapascal. All spectra have three distinct peaks for 002, 300 and 302, though the degrees two theta increases slightly with pressure for each. Very weak peaks for 101, 110, 210 and 103 are visible on the 1.3Gpa lower presuure spectra only.
The pressure-volume data were fitted with a third-order Birch-Murnaghan (III-BM) EoS, which is represented as follows:
 \begin{align}P = &\frac{3}{2}{K_0} \times \left[ {{{\left( {\frac{{{V_0}}}{V}} \right)}^{\frac{7}{3}}} - {{\left( {\frac{{{V_0}}}{V}} \right)}^{\frac{5}{3}}}} \right]\nonumber\\
&\quad \times \left\{ {1 + \frac{3}{4}\left( {K_0^{\prime} - 4} \right)\left[ {{{\left( {\frac{{{V_0}}}{V}} \right)}^{\frac{2}{3}}} - 1} \right]} \right\}\end{align}
 \begin{equation*}K_0^{\prime} = \frac{{\partial {K_0}}}{{\partial P}}\end{equation*}
Where V 0, V, K 0 and K 0ʹ are the zero-pressure volume, high-pressure volume, isothermal bulk modulus, and its pressure derivative, respectively.
Analyses of equation 1 with all parameters free yield V 0 = 1281.2(5) Å3, K 0 = 76(11) GPa, K 0ʹ = 13(2) for ‘hydroxylbastnäsite-(Sm)’. With the fixed K 0ʹ at 4, the fitting result yielded V 0 = 1270.5(8) Å3 and K 0 = 127(2) GPa. Figure 3a shows the unit-cell volume data as a function of pressure and the compression curve calculated from these fitted parameters. The volume Eulerian finite strain (fV = [V 0/V)2/3 – 1]/2) versus ‘normalized pressure’ (FV = P/[3fV(2fV + 1)5/2]) plot [fV – FV plot, (Angel, Reference Angel2000)] is shown in Fig. 3b. The weighted linear fit of the data points yields the intercept value of FV(0) = 84(1) GPa, which is consistent with bulk modulus obtained by the III-BM-EoS (K 0 = 76(11) GPa). Furthermore, it is clear from Fig. 3b that the data points lie on an inclined straight line with a positive slope, which is consistent with a value of K 0ʹ distinctly larger than 4 from III-BM-EoS (Angel, Reference Angel2000). This suggests that the P-V data in this study can be well described by the III-BM-EoS. The high K 0ʹ value indicates that the bulk modulus K 0 increases considerably with increasing pressure, at a larger rate than most of the reported carbonates (Ross and Reeder, Reference Ross and Reeder1992; Zhang and Reeder, Reference Zhang and Reeder1999; Ross, Reference Ross1997; Holl et al., Reference Holl, Smyth, Laustsen, Jacobsen and Downs2000; Ono et al., Reference Ono, Kikegawa, Ohishi and Tsuchiya2005; Lavina et al., Reference Lavina, Dera, Downs, Yang, Sinogeikin, Meng, Shen and Schiferl2010; Merlini et al., Reference Merlini, Perchiazzi, Hanfland and Bossak2012; Zhang et al., Reference Zhang, Liu, Qin, Lin, Xiong, Li and Bai2013; Gao et al., Reference Gao, Zhu, Lai, Huang, Qin, Chen, Liu, Zheng and Wu2014; Xu et al., Reference Xu, Kuang, Zhang, Liu, Fan, Zhou and Xie2015b; Wang et al., Reference Wang, Liu, Nie, Li, Wu, Gao, Wei and Wu2015; Rowland et al., Reference Rowland, Lavina, Vander Kaaden, Danielson and Burnley2020; Chuliá-Jordán et al., Reference Chuliá-Jordán, Santamaria-Pérez, Ruiz-Fuertes, Otero-de-la-Roza and Popescu2021a, Reference Chuliá-Jordán, Santamaria-Pérez, Ruiz-Fuertes, Otero-de-la-Roza and Popescu2021b; Zeff et al., Reference Zeff, Kalkan, Armstrong, Kunz and Williams2024), and smaller than silver carbonate Ag2CO3 (K 0ʹ = 20(2)) (Santamaria-Pérez et al., Reference Santamaria-Pérez, Pavic, Chuliá-Jordán, Ruiz-Fuertes, Popescu and Otero-de-la-Roza2023a). The values of the refined variables K 0 and K 0ʹ are strongly correlated (Angel, Reference Angel2000), and this correlation must be considered when comparing parameters of the equation of state obtained through least-squares refinement. To illustrate the correlation between these parameters, a series of confidence ellipses are typically used in the parameter space, with the x and y axes representing the values of K 0 and K 0ʹ, respectively (Bass et al. Reference Bass, Liebermann, Weidner and Finch1981). This approach has been followed in our study. Figure S1 shows the confidence ellipses for ‘hydroxylbastnäsite-(Sm)’ corresponding to the 68.3%, 95.4% and 99.7% confidence levels (see Angel, Reference Angel2000 for details). The detailed process for calculating the confidence ellipse can be found in the Supplementary materials. The ellipse of the ‘hydroxylbastnäsite-(Sm)’ is elongated with negative slopes which reflect the negative correlation between the K 0 and K 0ʹ parameters (Fig. S1).
Equation of state and linear compressibility of Sm(CO3)OH from synchrotron powder X-ray diffraction measurements at high-pressure and ambient temperature. Plots of: (a) pressure dependence of unit-cell volume, V; (b) finite strain (fV) vs. normalized pressure F V; (c) pressure dependence of lattice parameters a and c; and (d) linear finite strain (fl) vs. linear normalized pressure (Fl) for the lattice paraments a and c. In Fig. 3a and 3c, the error bars of the data points are smaller than the symbols. The values of the unit cell volume V and the unit cell parameters a and c at ambient pressure were obtained by fitting the data using the EOSFit7-GUI software (Angel et al., Reference Angel, Alvaro and Gonzalez-Platas2014; Gonzalez-Platas et al., Reference Gonzalez-Platas, Alvaro, Nestola and Angel2016).

Figure 3 Long description
The image contains four graphs. The top left graph shows the pressure dependence of unit-cell volume, with the x-axis labelled 'Pressure (GPa)' and the y-axis labelled 'V/V subscript 0'. Data points are plotted alongside a fitted curve labeled 'EoS'. The top right graph displays finite strain versus normalized pressure, with the x-axis labelled 'finite strain, f' and the y-axis labelled 'Normalized Pressure, F subscript V (GPa)'. Data points are shown with a fitted curve labelled 'EoS'. The bottom left graph illustrates pressure dependence of lattice parameters, with the x-axis labelled 'Pressure (GPa)' and the y-axis labelled 'a/a subscript 0' and 'c/c subscript 0'. Two sets of data points are plotted with fitted curves labeled 'EoS'. The bottom right graph shows linear finite strain versus linear normalized pressure for lattice parameters, with the x-axis labelled 'finite strain, f' and the y-axis labelled 'Normalized Pressure, F subscript c (GPa)'. Two sets of data points are plotted with fitted curves labelled 'EoS'.
Xu et al. (Reference Xu, Kuang, Zhang, Liu, Fan, Zhou and Xie2015b) compared the relative compressibility of anhydrous carbonates and partially hydrated carbonates. They demonstrated that the compressibility of anhydrous carbonates is largely controlled by the size of the metal cations, with larger cations leading to greater compressibility. The presence of [OH]− groups in the structure of hydrated carbonates results in a smaller isothermal bulk modulus compared to anhydrous carbonates. We compared the bulk modulus of several common carbonates (Ross and Reeder, Reference Ross and Reeder1992; Zhang and Reeder, Reference Zhang and Reeder1999; Ross, Reference Ross1997; Holl et al., Reference Holl, Smyth, Laustsen, Jacobsen and Downs2000; Ono et al., Reference Ono, Kikegawa, Ohishi and Tsuchiya2005; Ono, Reference Ono2007; Lavina et al., Reference Lavina, Dera, Downs, Yang, Sinogeikin, Meng, Shen and Schiferl2010; Mao et al., Reference Mao, Armentrout, Rainey, Manning, Dera, Prakapenka and Kavner2011; Merlini et al., Reference Merlini, Perchiazzi, Hanfland and Bossak2012; Zhang et al., Reference Zhang, Liu, Qin, Lin, Xiong, Li and Bai2013; Gao et al., Reference Gao, Zhu, Lai, Huang, Qin, Chen, Liu, Zheng and Wu2014; Xu et al., Reference Xu, Kuang, Zhang, Liu, Fan, Zhou and Xie2015b; Wang et al., Reference Wang, Liu, Nie, Li, Wu, Gao, Wei and Wu2015; Rowland et al., Reference Rowland, Lavina, Vander Kaaden, Danielson and Burnley2020; Santamaria-Pérez et al., Reference Santamaria-Pérez, Pavic, Chuliá-Jordán, Ruiz-Fuertes, Popescu and Otero-de-la-Roza2023a, Reference Santamaría-Pérez, Chuliá-Jordán, Otero-de-la-Roza, Oliva and Popescu2023b; Zeff et al., Reference Zeff, Kalkan, Armstrong, Kunz and Williams2024), and observed that minerals with higher bulk moduli tend to have smaller metal cations, which create a more tightly packed lattice structure. The bulk modulus (K 0) and effective ionic radii of metal cations (M2+ or M3+) of other carbonate and hydrous carbonate minerals are summarized in Table S7. Comparing the K 0 values of aurichalcite (Zn3.78(2)Cu1.22(2)(CO3)2(OH)6), azurite (Cu3(CO3)2(OH)2), and malachite (Cu2CO3(OH)2), we observe that hydrated carbonate minerals with larger cations tend to have greater compressibility. However, the ‘hydroxylbastnäsite-(Sm)’ phase does not follow the general trend where larger cations increase compressibility. This deviation is probably due to the unique electronic configurations and bonding characteristics of rare earth elements, which strengthen interatomic interactions and reduce compressibility despite the larger ionic radius. For anhydrous carbonate, bastnäsite-(La) also does not follow this trend. Because of the chemical similarity of rare earth elements, many trends observed with their atomic numbers can be attributed to the lanthanide contraction, which leads to a progressive decrease in ionic radius (Gupta and Krishnamurthy, Reference Gupta and Krishnamurthy1992). This reduction enhances the strength of metal-ligand bonds, reduces lattice voids, and results in increased structural rigidity. Kim et al. (Reference Kim, Anderko, Navrotsky and Riman2018) systematically studied the crystallography, thermochemistry, aqueous behaviour, and thermal decomposition trends of REE carbonates. They identified that these trends correlate with the lanthanide contraction, where the progressive decrease in ionic radii across the series leads to several characteristic changes. Specifically, the crystallographic unit cell parameters shrink with increasing atomic number, reflecting tighter lattice packing and higher lattice energy. This contributes to increased thermal stability and reduced solubility. Additionally, both the Gibbs free energy and enthalpy of formation decrease in magnitude along the series, demonstrating enhanced bond strength due to lanthanide contraction. These findings suggest that the compression behaviour and stability of REE carbonates are distinct from those of ordinary carbonates, governed by the unique chemistry of rare earth elements. Accordingly, we speculate that the compression behaviour of hydroxyl REE carbonate minerals is governed by the lanthanide contraction. This unique trend, characterized by reduced compressibility due to enhanced bond strength and minimized lattice voids, distinguishes them from ordinary carbonate minerals.
The unit-cell parameters a and c at different pressures are summarized in Table S6. Figure 3c shows these parameters as a function of pressure. To obtain linear compressibility, the axial compression data for ‘hydroxylbastnäsite-(Sm)’ were fitted to a linear formulation of Eulerian strain theory (Davies, Reference Davies1974; Weaver, Reference Weaver1976; Meade and Jeanloz, Reference Meade and Jeanloz1990; Angel, Reference Angel2000). For a and c axes, we have
 \begin{equation}\!\!\!\!\!\!\!\!\!\!\!\!\!\!\!\!\!\!\!\!\!\!\!\!\!\!\!{F_a}\, = \,\frac{{P{{(a{c_0}/{a_0}c)}^{2/3}}}}{{{f_a}{{\left( {1 + 2{f_v}} \right)}^{5/2}}}}\, = \,{K_a} + \,{m_a}{f_a}\end{equation}
and
 \begin{equation}\!\!\!\!\!\!\!\!\!\!\!\!\!\!\!\!\!\!\!\!\!\!\!\!\!\!\!{F_c}\, = \,\frac{{P{{({a_0}c/a{c_0})}^{2/3}}}}{{{f_c}{{\left( {1 + 2{f_v}} \right)}^{5/2}}}}\, = \,{K_c} + \,{m_c}{f_c}\end{equation}
where
 \begin{align}{f_a} = &\,\frac{1}{2}\left[ {{{\left( {\frac{{{a_0}}}{a}} \right)}^2} - 1} \right];\;{f_c} = \,\frac{1}{2}\left[ {{{\left( {\frac{{{c_0}}}{c}} \right)}^2} - 1} \right];\;\nonumber\\
&\quad {f_V} = \,\frac{1}{2}\left[ {{{\left( {\frac{{{V_0}}}{V}} \right)}^{\frac{2}{3}}} - 1} \right]\end{align}
Here Ka and Kc are the linear bulk modulus in a and c axes, respectively, and ma and mc are the adjustable parameters related to the third-order elastic constants. In general, the linear bulk modulus along the three unit cell axes are related to the bulk modulus by K –1 = K 1–1 + K 2–1 + K 3–1 (Nye, Reference Nye1985). For hexagonal structures, such as ‘hydroxylbastnäsite-(Sm)’, the linear bulk modulus are constrained by 1/K 0 = 2/Ka + 1/Kc, yielding Ka = 215(5) GPa and Kc = 265(5) GPa. This yields K 0 = 76(2) GPa, which is in excellent agreement with the result obtained from the third-order equation of state fitting. The relation between the linear Eulerian finite strain (fi) and the linear ‘normalized pressure’ (Fl) is plotted and shown in Fig. 3d. The ratio (βa:βc = 1.23:1) among the compressibility parameters of the a and c axis shows a compression anisotropy of ‘hydroxylbastnäsite-(Sm)’, and the compressibility along the a-axis is more significant than that along the c-axis. To more precisely evaluate the compressive behaviour of Sm(CO3)OH under various pressure conditions, we also conducted a finite strain analysis of the bulk and linear compressibility on the X-ray diffraction data within the hydrostatic limit of the methanol–ethanol mixture (Angel et al., Reference Angel, Bujak, Zhao, Gatta and Jacobsen2007; Klotz et al., Reference Klotz, Chervin, Munsch and Le Marchand2009), yielding K 0 = 86(2) GPa, Ka = 215(5) GPa, and Kc = 265(6) GPa. This is in excellent agreement with our previous results.
We compared the bulk and linear compressibilities of ‘hydroxylbastnäsite-(Sm)’ in this study with previously reported hexagonal and trigonal mineral phases (Meade and Jeanloz, Reference Meade and Jeanloz1990; Ross et al., Reference Ross, Shu and Hazen1990; Ross and Reeder, Reference Ross and Reeder1992; Fei and Mao, Reference Fei and Mao1993; Ross, Reference Ross1997; Frost and Fei, 1999; Zhang and Reeder, Reference Zhang and Reeder1999; Mookherjee and Stixrude, Reference Mookherjee and Stixrude2006; Mookherjee and Stixrude, Reference Mookherjee and Stixrude2009; Mookherjee and Steinle-Neumann, Reference Mookherjee and Steinle‐Neumann2009), and the data are summarized in Table S8. Compared to other phases, ‘hydroxylbastnäsite-(Sm)’ exhibits significantly weaker compressive anisotropy. This may be attributed to the specific crystal structure of Sm(CO3)OH (Fig. 1), which results in a more uniform compressibility in all directions for the phase. In the ‘hydroxylbastnäsite-(Sm)’ structure, a hydrogen bond is modelled to form between the O1–H1 hydroxyl group and an adjacent carbonate oxygen atom (O8). Based on measurements using VESTA3, the geometric parameters of this hydrogen bond are well-defined: the donor–acceptor distance (O1···O8) is 2.93(3) Å, the hydrogen bond distance (H1···O8) is 2.0(3) Å, and the O1–H1···O8 angle is 164(18)°. This planar arrangement of hydrogen bonds stabilizes the hexagonal layers within the ab-plane and contributes to the structural rigidity in this direction. These hydrogen bonding interactions may exhibit directionality, potentially leading to this distinctive anisotropic behaviour in the elastic properties of ‘hydroxylbastnäsite-(Sm)’ (Santos-Martins and Forli, Reference Santos-Martins and Forli2020; Goncharov et al., Reference Goncharov, Nisbet, Strzelecki, Benmore, Migdisov, Xu and Guo2022). The relatively weak compressive anisotropy of Sm(CO3)OH may suggest that it exhibits a more uniform mechanical response in different directions, which could contribute to its structural stability under high-pressure conditions.
Raman spectra: structural stability under high pressure
A 20 μm×10 μm×5 μm single crystal Sm(CO3)OH sample was chosen for the ambient micro-Raman spectroscopy study under ambient pressure and temperature. Thirteen Raman peaks were observed between 200 cm−1 and 1200 cm−1 in the wavenumber range (Fig. S2a). Among them, peaks at 1101 cm−1, 1088cm−1, 1079 cm−1 and 976 cm−1 are contributed to by the symmetrical stretching vibration of the [CO3]2− group. Three modes associated with the out-of-plane bend are at 792 cm−1, 852 cm−1 and 871 cm−1. The 731 cm−1 and 701 cm−1 peaks may be from the [CO3]2− group bending vibration in-plane. The peaks at 354 cm−1, 275 cm−1, 250 cm−1 and 211 cm−1 are derived mainly from the lattice vibration of Sm–O bonding. The characteristic triplet peaks around 1050 cm−1 to 1150 cm−1 in the Raman spectra of the synthesized Sm(CO3)OH crystal at ambient temperature and pressure are consistent with the results reported by Tahara et al. (Reference Tahara, Nakai, Miyawaki and Matsubara2007) and Yang et al. (Reference Yang, Dembowski, Conrad and Downs2008). For the [OH]− group stretching vibration, the peaks are primarily located at 3600–3650 cm−1, 3450–3500 cm−1, 3350–3400 cm−1 and 3200–3250 cm−1 (Fig. S2b). Factor-group analysis of the optic modes of ‘hydroxylbastnäsite-(Sm)’ with the space group  $P\bar 6$ (Fateley et al., Reference Fateley, McDevitt and Bentley1971; Rousseau et al., Reference Rousseau, Bauman and Porto1981; Dresselhaus et al., Reference Dresselhaus, Dresselhaus and Jorio2007), yields: Γoptic = 68A′(R) + 56A″(IR) + 68E′(R,IR) + 56E″(R).
Thus, the 192 Raman active and 124 infrared active vibrations predicted are significantly higher than observed. This discrepancy is common in complex, low-symmetry molecular crystals due to weak modes and accidental degeneracies (Vennari and Williams, Reference Vennari and Williams2019).
The high-pressure Raman spectra of the synthesized single crystal sample of Sm(CO3)OH were measured via the diamond window of the DAC under room temperature. The pressure was increased by ∼1 GPa per step up to 20.6 GPa (Fig. 4). To accurately identify and analyse vibrational modes in Raman spectra under ambient temperature and high pressure, we applied deconvolution techniques to process the Raman signals at 0.5 GPa (Fig. S3). Twenty vibrational peaks were observed in the wavenumber range of 200 cm−1 to 1200 cm−1, with their vibrational mode assignments shown in Table S9. Compared to the Raman spectrum at ambient temperature and pressure, five additional vibrational modes were observed under high pressure: two lattice vibrational modes (260 cm−1 and 509 cm−1), an in-plane bending vibrational mode of the [CO3]2− group (623 cm−1), and two symmetrical stretching vibrational modes of the [CO3]2− group (1135 cm−1 and 1173 cm−1) (Fig. S3a). The vibrational peaks at 1011 cm−1 and 1043 cm−1 are the vibration absorption modes of the pressure transfer medium (silicone oil). Our high-pressure synchrotron XRD results (see earlier section) indicate that under high-pressure conditions, intermolecular interactions (such as hydrogen bonds and van der Waals forces) in Sm(CO3)OH are enhanced. These strengthened interactions can lead to an increase in intermolecular coupling effects, causing certain vibrational modes to split or new vibrational modes to appear (Weiß et al., Reference Weiß, Zeller and Neudecker2024; Hirai and Kadobayashi, Reference Hirai and Kadobayashi2023). Thus, the newly observed peaks may be attributed to enhanced intermolecular interactions under high pressure, resulting in changes in vibrational modes.
Raman spectroscopy of Sm(CO3)OH under various high-pressure conditions. The red arrows indicate the merging of Raman peaks, while the slanted lines indicate the red-shift of Raman peaks. The vibrational peaks at 1011 cm−1 and 1042 cm−1 are the vibration absorption modes of the silicone oil. The pressure determination accuracy is based on Mao et al. (Reference Mao, Bell, Shaner and Steinberg1978).

Figure 4 Long description
The graph shows Raman spectra of Sm(CO)OH under different pressure conditions ranging from 0.51 GPa to 20.65 GPa. The x-axis is labelled 'Raman shift' in wavenumbers (cm superscript minus 1) and the y-axis is labelled 'Intensity' in arbitrary units (a.u.). Each spectrum is plotted at specific pressure levels, indicated next to each curve. The spectra display variations in peak positions and intensities as pressure increases. Red arrows highlight specific changes in the spectra, such as peak merging or shifts.
Nine Raman peaks were observed in the wavenumber range between 3200 cm−1 and 3800 cm−1 (Fig. S3b and Table S9). Compared to the Raman spectrum under ambient conditions, the hydroxyl stretching vibration peak exhibits clear splitting. This splitting phenomenon can be attributed to increased pressure, as higher pressure reduces intermolecular distances and strengthens hydrogen bonding, leading to frequency variations in hydroxyl vibrations across different local environments. Previous studies have shown that high pressure alters hydrogen-bonding networks, resulting in significant broadening and intensity changes of the hydroxyl stretching vibration peaks (Goncharov et al., Reference Goncharov, Goldman, Fried, Crowhurst, Kuo, Mundy and Zaug2005). Furthermore, theoretical analysis using a double-well potential model suggests that the splitting of hydroxyl stretching frequencies is closely related to the asymmetry of hydrogen bonds and variations in donor–acceptor distances. For strong hydrogen bonds (donor–acceptor distances < 2.6 Å), nonlinear splitting of vibrational energy levels may lead to the observed multi-peak phenomenon (Athokpam et al., Reference Athokpam, Ramesh and McKenzie2017). As shown in Fig. 4, when the pressure increases to 7.0 GPa, the hydroxyl stretching vibration peaks initially located at 3205 cm−1 and 3249 cm−1 merge into a single peak within the 3200–3250 cm−1 range. Additionally, three new vibration peaks were identified in the 3100–3200 cm−1, 3250–3300 cm−1 and 3700–3800 cm−1 ranges, probably attributed to pressure-induced intensity changes (Table S9). The peaks at 3490 cm−1 and 3509 cm−1 also merge, forming a new peak in the 3400–3450 cm−1 range. The peaks at 3655 cm−1 and 3679 cm−1 undergo degeneracy and disappear but reappear as pressure increases to 20.6 GPa (Fig. 4, Figs S3 and S4). From Fig. 4 and the deconvolution results, it is evident that the hydroxyl vibration frequencies shift to lower wavenumbers with increasing pressure. This shift is probably attributed to enhanced hydrogen bonding and weakened O–H bond strength under higher pressures (Basu et al., Reference Basu, Mookherjee, Clapp, Chariton and Prakapenka2023). The complex [OH]− vibration Raman spectra are closely related to its bonding, connection mode, and surrounding atomic environment in the structure. Michiba et al. (Reference Michiba, Tahara, Nakai, Miyawaki and Matsubara2011) observed two [OH]− Raman vibration bands, 3600–3700 cm−1 and 3480–3520 cm−1, from hexagonal REE hydroxycarbonate and proposed the former corresponds to the [OH]− vibration without hydrogen bonding, and the latter corresponds to the [OH]− vibration with hydrogen bonding. The 3650–3700 cm−1 band corresponds to the hydroxyl polarization direction perpendicular to (001), which fails to form hydrogen bonds with the oxygen atoms in the layer; the 3450–3500 cm−1 band corresponds to the polarization direction of the hydroxyl group parallel to (001), which can form hydrogen bonds with the oxygen atoms in the layer and the 3350–3400 cm−1 band reflects the vibration of the hydroxyl group between the layers (Michiba et al., Reference Michiba, Tahara, Nakai, Miyawaki and Matsubara2011). Similar complex Raman bands due to the presence of different types of hydroxyl groups have been observed in kaolinite (Frost et al., Reference Frost, Makó, Kristóf, Horváth and Kloprogge2001).
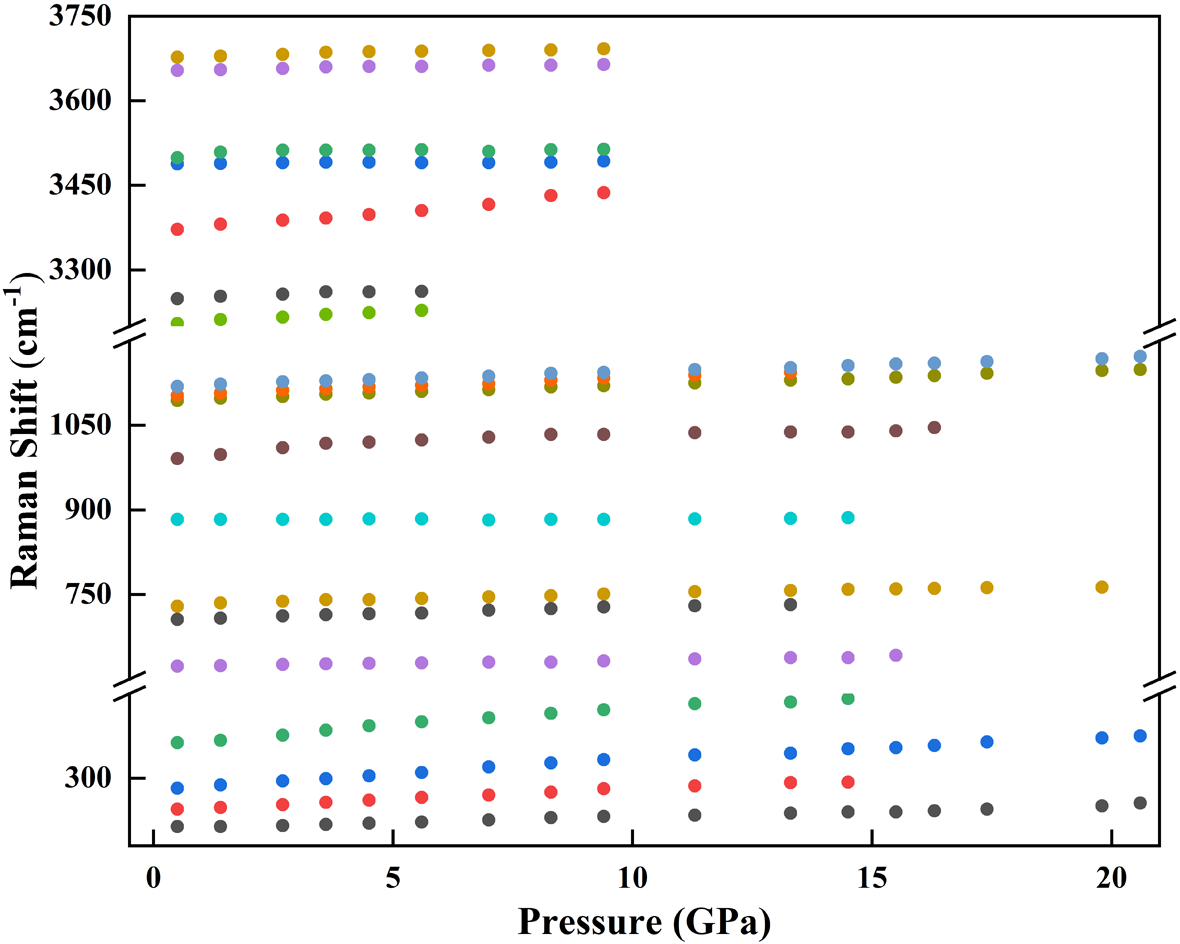
Figure 5 shows the pressure-dependent shift in Raman mode peak positions under high-pressure and room-temperature conditions, and Table S9 lists the functional relationships between these peak positions and pressure. Within the pressure range up to 20.6 GPa, the frequency of lattice modes increases with pressure, while their number and peak shape do not undergo significant changes (Fig. 4 and Fig. 5). Significant intensity variations observed in this pressure range probably result from a combination of pressure-induced elimination of accidental degeneracies and crystal orientation changes between different spectra (Mernagh and Liu, Reference Mernagh and Liu1990; Wen et al., Reference Wen, Zhang, Li, Jiao, Pei, Wang and Xia2023). The Raman active modes of the carbonate ion shift monotonically up to 20.6 GPa, indicating that no phase change occurs up to this pressure. As the pressure increases, the Raman peaks broaden, making it difficult to accurately identify and track certain peaks (e.g. 1102, 991, 881 and 623 cm−1) at pressures exceeding 14.5 GPa. Within the pressure range up to 20.6 GPa, the frequency of the symmetrical stretching mode (ν1) shifts approximately linearly with pressure, at an average rate of ∼2.79(12) cm−1/GPa. The carbonate out-of-plane bend (ν2) shifts at a rate of 0.15(5) cm−1/GPa. The carbonate in-plane bending mode (ν4) shifts at rates of 1.15(5), 2.14(10), and 1.71(8) cm−1/GPa, respectively. The vibrational frequencies of carbonate ions in ‘hydroxylbastnäsite-(Sm)’ observed in this study show significant similarity to those reported for bastnäsite-(Ce) by Vennari and Williams (Reference Vennari and Williams2019). Compared to carbonate ions, the hydroxyl group in ‘hydroxylbastnäsite-(Sm)’ exhibits more complex vibrational spectroscopic characteristics. At lower pressures (below 9.4 GPa), the νOH mode increases with pressure, i.e. dνOH/dP > 0 (Table S9). However, as the pressure increases further, the νOH mode shifts to lower frequencies (dνOH/dP < 0), a phenomenon commonly referred to as red-shift (Fig. 5). As discussed previously, this red-shift at higher pressures is attributed to the strengthening of hydrogen bonds, which consequently weakens the covalent O–H bond (Basu et al., Reference Basu, Mookherjee, Clapp, Chariton and Prakapenka2023). In the Raman spectra of Sm(CO3)OH obtained in our study, we observed significant differences in the influence of pressure on the vibrations of the [OH]− and [CO3]2− groups. The results from Raman spectroscopic analyses and high-pressure X-ray diffraction are consistent with the elastic anisotropy of Sm(CO3)OH.
Positions of peaks from the Raman spectra as a function of pressure at room temperature under compression. The same colour follows each peak as its wavenumber varies with pressure.

Figure 5 Long description
A scatter plot illustrating the relationship between Raman shift in centimetres superscript negative 1 and pressure in gigapascals. The x-axis is labelled 'Pressure (GPa)' and ranges from 0 to 20. The y-axis is labelled 'Raman Shift (cm superscript negative 1)' and spans from 300 to 3750. Multiple data points are plotted across the pressure range, showing various shifts in Raman mode positions. The plot includes distinct clusters of points at different pressure levels, indicating changes in Raman shift as pressure increases.
Raman spectra: structural stability under high pressure and high temperature
Figure 6 shows the high-temperature and high-pressure Raman spectra of the Sm(CO3)OH sample from 150–4100 cm−1, and accumulation curve graphs were plotted for the low-frequency range (150–1200 cm−1) and the high-frequency range (3500–4100 cm−1).
Raman spectrum of Sm(CO3)OH under various high pressures and high temperatures: (a) wavenumber range between 150 cm−1 to 1200 cm−1 and (b) wavenumber range between 3500 cm−1 to 4100 cm−1.

Figure 6 Long description
The image contains two graphs depicting Raman spectra of Sm(CO3)OH under different pressures and temperatures. The first graph (a) shows the intensity against Raman shift in the wavenumber range from 150 cm to 1200 cm. It includes four curves labelled with pressures and temperatures: 5.9 gigapascal at 473 Kelvin, 4.2 gigapascal at 423 Kelvin, 3.4 gigapascal at 382 Kelvin and 0.9 gigapascal at 295 Kelvin. The second graph (b) displays the intensity against Raman shift in the wavenumber range from 3500 cm to 4100 cm. It also features four curves with the same pressure and temperature labels: 5.9 gigapascal at 473 Kelvin, 4.2 gigapascal at 423 Kelvin, 3.4 gigapascal at 382 Kelvin and 0.9 gigapascal at 295 Kelvin.
On the basis of comparative analysis, the Raman peaks in the range of 100–450 cm−1 correspond to the external lattice vibrations of Sm–O. The peak at 731 cm−1 corresponds to the in-plane bending vibration mode of [CO3]2−. The peaks at 984 cm−1, 1082 cm−1 and 1106 cm−1 correspond to the symmetric stretching vibration modes of the [CO3]2− group. The characteristic peaks generally shift towards higher frequencies, related to the shortening of chemical bond lengths under high pressure. The Raman signals exhibit different forms of attenuation, indicating variations in the sensitivity of chemical bond vibration modes to pressure. The Sm–O lattice vibrations show the strongest dependence on temperature and pressure, while carbonate-group vibrations exhibit relatively weak dependence on both. To better characterize the changes in hydroxyl vibration modes under different conditions, we performed peak deconvolution and analysis of Raman spectra at 0.9 GPa, 295 K, and 5.9 GPa, 473 K (Fig. S5). In Fig. S5a, seven distinct Raman peaks are observed, with those in the 3450–3500 cm−1 range attributed to hydrogen-bonded hydroxyl vibrations, while higher-frequency peaks (e.g., 3600–4050 cm−1) correspond to non-hydrogen-bonded hydroxyl vibrations (Michiba et al., Reference Michiba, Tahara, Nakai, Miyawaki and Matsubara2011). A comparison with Fig. S5b reveals that increasing temperature and pressure weakens hydrogen bonding, probably due to lattice thermal expansion and an increase in O–H···O bond length. This leads to a significant reduction in the intensity of the 3450–3500 cm−1 peaks, which eventually become indistinguishable. Additionally, a blue shift in the Raman peaks within the 3600–4050 cm−1 range was observed, probably caused by high temperatures weakening hydrogen bonds, leading to O–H bond contraction and an increase in vibrational frequency (Ferreras Moreno et al., Reference Ferreras Moreno, Stinson, Shepherd, Welsh, Altaner and Crittenden2020). Raman spectra showed no significant changes as pressure increased from 0.9 to 5.9 GPa and temperature rose from room temperature to 473 K. This indicates that ‘hydroxylbastnäsite-(Sm)’ maintains structural stability within the studied pressure and temperature range, with no detectable phase transitions.
Conclusions
Among the three main types of carbon reservoirs in oceanic plates, including oceanic sediments, basaltic oceanic crust, and serpentine carbonate (He et al., Reference He, Liu and Chen2017; Xu et al., Reference Xu, Zeng, Song, Feng, Deng and Wei2017), calcite is the dominant phase of carbon, followed by dolomite and siderite (Nakamura and Kato, Reference Nakamura and Kato2004). These carbonate minerals, composed of Ca2+, Mg2+, Fe2+ and CO32− are the most crucial carbon sources in deep carbon cycling (Qin, Reference Qin2016; Hazen and Schiffries, Reference Hazen and Schiffries2013). Although slab melting can somewhat inhibit carbon transportation into the deep Earth, some carbonates may carry carbon to the deep mantle by changing their polymorphs (Thomson et al., Reference Thomson, Walter, Kohn and Brooker2016; Kelemen and Manning, Reference Kelemen and Manning2015). For example, calcite undergoes phase transitions (Suito et al., Reference Suito, Namba, Horikawa, Taniguchi, Sakurai, Kobayashi, Onodera, Shimomura and Kikegawa2001; Oganov et al., Reference Oganov, Ono, Ma, Glass and Garcia2008), magnesite transforms at higher pressures (Fiquet et al., Reference Fiquet, Guyot, Kunz, Matas, Andrault and Hanfland2002), and siderite experiences spin state changes (Cerantola et al., Reference Cerantola, McCammon, Kupenko, Kantor, Marini, Wilke, Ismailova, Solopova, Chumakov, Pascarelli and Dubrovinsky2015). These results suggest that carbonate minerals tend to display quite different behaviours at high pressure and high temperature and can work as potential carriers to transport carbon to the deep Earth. Additionally, studying the stability of hydrous minerals (e.g. epidote, phase D chlorite, kaolinite, topaz-OH and serpentine) under high-pressure and high-temperature conditions is crucial for understanding the storage and transport of water in the mantle (Mookherjee and Stixrude, Reference Mookherjee and Stixrude2009; Mookherjee and Mainprice, Reference Mookherjee and Mainprice2014; Mookherjee et al., Reference Mookherjee, Tsuchiya and Hariharan2016; Basu and Mookherjee, Reference Basu and Mookherjee2021; Xu et al., Reference Xu, Kakizawa, Gréaux, Inoue, Li and Gao2021; Li et al., Reference Li, Li and Li2023).
Hydroxylbastnäsite-(La, Ce, Nd) and kozoite-(La, Nd) occurs in many natural examples, including in the Alps-Carpathian orogen and Circum-Pacific island arc (Farkas et al., Reference Farkas, Maksimovic and Panto1985; Kirillov, Reference Kirillov1964; Michiba et al., Reference Michiba, Tahara, Nakai, Miyawaki and Matsubara2011, Reference Michiba, Miyawaki, Minakawa, Terada, Nakai and Matsubara2013; Miyawaki et al., Reference Miyawaki, Matsubara, Yokoyama, Takeuchi, Terada and Nakai2000, Reference Miyawaki, Matsubara, Yokoyama, Iwano and Yukinori2003; Jovic et al., Reference Jovic, Radusinovic and Pajovic2009; Maksimovic and Panto, Reference Maksimovic and Pantó1985; Voigt et al., Reference Voigt, Rodriguez-Blanco, Vallina, Benning and Oelkers2016). Our synthesis of a Sm(CO3)OH crystal (at 3 GPa and 1073 K) indicates that a hydroxyl REE carbonate phase ‘hydroxylbastnäsite-(Sm)’ can form at ∼80 km depth in subduction zones at pressure and temperature conditions of ∼3 GPa and 800–1000 K (compiled from Syracuse et al., Reference Syracuse, van Keken and Abers2010; Li et al., Reference Li, Li and Li2023), as the subducting oceanic plate with its overlying trench sediments is rich in REE, organic carbon and carbonate minerals (Kato et al., Reference Kato, Fujinaga, Nakamura, Takaya, Kitamura, Ohta, Toda, Nakashima and Iwamori2011; Yasukawa et al., Reference Yasukawa, Liu, Fujinaga, Machida, Haraguchi, Ishii, Nakamura and Kato2014; Zhang et al., Reference Zhang, Tao and Zhu2017). Our work also revealed the unique compressive behaviour of Sm(CO3)OH under conditions of 20.9 GPa and ambient temperature. Compared to other carbonate minerals, Sm(CO3)OH exhibits significantly distinct compressive characteristics, as its bulk modulus varies dramatically with pressure. This may be related to the unique 2∞[(OH)Sm3/3]2+ unit in its lattice, in which the Sm3+ ions are in a particular coordination environment (CN = 9), and the [OH]− also are aligned in a mutually perpendicular arrangement. The discovery of this compressive behaviour provides an important window into understanding the partition mechanisms of samarium between solid and melt phases under the high-pressure conditions of the Earth’s deep interior (Blundy and Wood, Reference Blundy and Wood1994, Reference Blundy and Wood2003). This insight is crucial for understanding the processes of elemental cycling within the Earth’s interior and how it influences the geological structure and chemical composition of the Earth. Zhang and Reeder (Reference Zhang and Reeder1999) studied the relative compressibility of calcite-group carbonates, demonstrating that the bulk modulus is approximately inversely linearly related to the metal cation radius. Subsequent research has confirmed that this trend applies to most carbonate minerals (Xu et al., Reference Xu, Kuang, Zhang, Liu, Fan, Zhou and Xie2015b). However, REE carbonates such as bastnäsite-(La) and the ‘hydroxylbastnäsite-(Sm)’ phase do not conform to this pattern, possibly due to the unique characteristics of rare earth elements. Future studies on the behaviour of rare earth elements in the deep Earth environment through high-pressure crystal structure analysis, determination of partition coefficients, and first-principles calculations would offer insights into the complex processes within the Earth’s interior. Our high-pressure experiments on the synthesized crystal of Sm(CO3)OH demonstrate no phase change at pressures ranging from ambient to 20.6 GPa at room temperature. Additionally, high-temperature and high-pressure experiments reveal that the Sm(CO3)OH crystal remains stable under conditions of 473 K and 5.9 GPa. Based on these findings and the thermal gradient in subduction zones (∼973 K to 1273 K at depths of 80–540 km, as compiled by Li et al., Reference Li, Li and Li2023), we hypothesize that Sm(CO3)OH may remain structurally stable within a pressure range of 3 to 20.6 GPa and a temperature of ∼1000 K. However, this extrapolation requires further validation through high-temperature experiments or thermodynamic modelling. ‘Hydroxylbastnäsite-(Sm)’ may partially dehydrate at elevated temperatures, releasing water into the mantle wedge, while retaining REEs and carbon in stable forms, thereby acting as a conveyor of REEs, carbon and water (-OH) from shallow depths (<80 km) to the deep mantle during plate subduction. This potential role highlights its significance in subduction-related geochemical cycling and warrants further investigation.
Supplementary material
The supplementary material for this article can be found at https://doi.org/10.1180/mgm.2025.10189.
Acknowledgements
This work is supported financially by the National Natural Science Foundation of China (91962101, 41603063, 41802044 and 4160030283), Beijing Synchrotron Radiation Facility (2017-BEPC-PT-000851), Baotou Iron and Steel Group Co., Ltd. (BGKY-ZH-2021-Z-017), and Deep Earth Probe and Mineral Resources Exploration-National Science and Technology Major Project (2025ZD1009202, 2025ZD1004902). We thank Lei, Li for the facilities and assistance provided by the High-Pressure Science and Technology Laboratory at Sichuan University, China. We are grateful to the researchers from the CAS Key Laboratory of High-Temperature and High-Pressure of Earth’s interior, Institute of Geochemistry Chinese Academy of Sciences for their assistance in the sample synthesis experiments.
Competing interests
The authors declare none.