Introduction
Precise evaluation of plant disease incidence, severity and negative effects on yield quality and quantity is relevant for precision crop production. For planning targeted plant protection activities in field or greenhouse production and to forecast temporal and spatial disease spread it is of importance to enable an accurate and timely assessment of plant disease occurrence and spread. Traditional estimation methods for the detection and identification of plant diseases are visual detection, microscopic, molecular, serological and microbiological methods (Bock et al., Reference Bock, Poole, Parker and Gottwald2010). However, we are living in a technology characterized century and there is an increasing amount of optical sensors, which perform non-invasively, are available. These sensors can support plant disease detection and identification in different fields of application. Especially precision agriculture and plant phenotyping for resistance breeding benefit from this movement. The application of hyperspectral imaging sensors on different scales, from investigating plant tissue on laboratory scale over the single plant scale in greenhouses or climate chambers to the canopy scale in field applications comes with numerous advantages compared to classical visual monitoring or analytical methods. Unlike e.g. molecular biologic analysis methods, the process of hyperspectral imaging is non-invasive, thereby enabling researchers and breeders to perform time series measurements of the sample plants. This leads to a reduction of required samples and makes long term experiments more efficient. Furthermore, hyperspectral imaging is an objective method in contrast to manual rating and can be set up as automated measurement system, significantly reducing the workload compared to manual rating (Mahlein Reference Mahlein2016; Virlet et al., Reference Virlet, Sabermanesh, Sadeghi-Tehran and Hawkesford2016; Walter et al., Reference Walter, Liebisch and Hund2015). By this, economic and ecological costs in agricultural production can be reduced.
Diseases cause alterations in plant physiology, tissue colour and leaf shape, transpiration rate, crop canopy morphology and density and as a complex result of these manifold interactions, variation in the optical properties of plants. Researchers applied hyperspectral imaging to the detection of plant diseases on different scales and in different pathosystems (reviewed in: Mahlein Reference Mahlein2016; Sankaran et al., Reference Sankaran, Mishra, Ehsani and Davis2010; West et al., 2003). To name just some: Bravo et al. (Reference Bravo, Moshou, West, McCartney and Ramon2003) used in-field spectral images for an early detection of yellow rust infected wheat, Hillnhütter et al. (Reference Hillnhütter, Mahlein, Sikora and Oerke2011) successfully discriminated symptoms caused by the nematode Heterodera schachtii and the soil borne fungus Rhizoctonia solani in sugar beet fields. Delalieux et al. (Reference Delalieux, van Aardt, Keulemans and Coppin2007) investigated Venturia inaequalis on apple plants by hyperspectral non-imaging techniques. Several researchers developed disease specific vegetation indices for efficient data analysis (Ashourloo et al., Reference Ashourloo, Mobasheri and Huete2014; Mahlein et al., Reference Mahlein, Rumpf, Welke, Dehne, Plümer, Steiner and Oerke2013; Oerke et al., Reference Oerke, Herzog and Töpfer2016). Advanced data mining techniques enabled the definition of cardinal points during pathogenesis of foliar barley diseases in (Wahabzada et al., Reference Wahabzada, Mahlein, Bauckhage, Steiner, Oerke and Kersting2015a, Reference Wahabzada, Mahlein, Bauckhage, Steiner, Oerke and Kersting2016). Kuska et al. (Reference Kuska, Wahabzada, Leucker, Dehne, Kersting, Oerke, Steiner and Mahlein2015) were able to characterize resistance reactions of barley to powdery mildew using a hyperspectral microscopic approach. With a similar technique, Leucker et al. (Reference Leucker, Wahabzada, Kersting, Peter, Beyer, Steiner, Mahlein and Oerke2016) established a link among QTLs and spectral signatures of sugar beet genotypes, with different levels of resistance to Cercospora beticola, the causal agent of Cercospora leaf spot. Apan et al. (Reference Apan, Held, Phinn and Markley2004) were able to detect sugarcane orange rust on EO-1 Hyperion hyperspectral imaging data and Huang et al. (Reference Huang, Lamb, Niu, Zhang, Liu and Wang2007) found a good reliability and accuracy in detecting yellow rust in wheat by ground based spectral measurements and airborne hyperspectral imaging.
The present article is supposed to give examples and impression of applying hyperspectral imaging of plant disease detection and resistance screening on different scales.
Material and Methods
Plant and pathogen systems
Investigations were performed in different plant-pathogen systems. Near-isogenic barley (Hordeum vulgare) lines cv. Ingrid wild type (WT) and Pallas with mlo3 and Mla1 resistance were used for investigations on the microscopic scale. Barley plants were cultivated according to Kuska et al. (Reference Kuska, Wahabzada, Leucker, Dehne, Kersting, Oerke, Steiner and Mahlein2015) and were investigated in a specific in vivo phyto-agar system. These plants were inoculated with the powdery mildew pathogen Blumeria graminis f.sp. hordei (Bgh), isolate K1.
Barley cultivars with differing susceptibility to powdery mildew infestation were cultivated in a mini-plot system. In this case, measurements were performed on the canopy scale. The cultivars used in this experiments were: Gesine, Grace, Tocada, Milford, Irina and Eileen. Inoculation took place with an unspecified field isolate of Blumeria graminis f.sp. hordei.
Sugar beet plants, diseased with the foliar diseases Cercospora leaf spot, sugar beet rust and powdery mildew were investigated on different scales. For cultivation please refer to Mahlein et al. (Reference Mahlein, Steiner, Hillnhütter, Dehne and Oerke2012).
Sensor setup and hyperspectral image acquisition
A hyperspectral microscope system has been established to assess spectral changes on the leaf and cellular level (Kuska et al., Reference Kuska, Wahabzada, Leucker, Dehne, Kersting, Oerke, Steiner and Mahlein2015; Leucker et al., Reference Leucker, Wahabzada, Kersting, Peter, Beyer, Steiner, Mahlein and Oerke2016). This setup consist of a hyperspectral linescanner (spectral camera PFD V10E, Specim, Oulu, Finland) in the visible (400–700 nm) and near infrared (700–1000 nm) range, mounted on a foreoptic (Z6 APO, Leica, Wetzlar, Germany) with a magnification up to 7.3x. Symptom development and early resistance reactions of barley and sugar beet were measured in time series imaging.
Measurements on the plant scale were performed with a hyperspectral linescanner (spectral camera Imspector V10, Specim, Oulu, Finland) in the visible (400–700 nm) and near infrared (700–1000 nm) range, and with a SWIR-camera (Specim, Oulu, Finland) in the shortwave infrared (1000–2500 nm). The spatial plane was covered, using a linear stage (Mahlein et al., Reference Mahlein, Steiner, Hillnhütter, Dehne and Oerke2012; Behmann et al., Reference Behmann, Mahlein, Paulus, Kuhlmann, Oerke and Plümer2016). In addition to hyperspectral measurements, 3D-information from plants were assessed using a 3D laser scanner (Behmann et al., Reference Behmann, Mahlein, Paulus, Kuhlmann, Oerke and Plümer2016; Paulus et al., 2013). In this study, a Perceptron laser triangulation scanner (Perceptron Scan Works V5, Perceptron Inc., Plymouth MI, USA) was used. By coupling with a measuring arm (Romer Infinite 2.0 in 2.8 m version) it provides an occlusion-free option for close-up imaging of plants with a point reproducibility better than 0.1 mm. It was chosen due to its high resolution and accuracy and has been successfully applied for 3D imaging of various plants.
For measurements on the canopy scale, a high-throughput-scanner, installed in a greenhouse environment was established. In this system, a hyperspectral linescanner (spectral camera Imspector V10, Specim, Oulu, Finland), combined with a mirror-scanner was applied. Illumination was realized by six halogen-bulbs.
Data processing and analysis
Changes in spectral reflectance were extracted, analysed and classified manually and via data mining methods, respectively. Calculation of reflectance, relative to a white reference and the dark current was performed using the software ENVI 5.1+IDL 8.3 (ITT Visual Information Solutions, Boulder, USA). After normalization the Savitzky-Golay filter (Savitzky & Golay, 1964) was applied to smooth hyperspectral images. These pre-processed images were used for further analysis using Python, Matlab or ENVI 5.1+IDL 8.3.
Automated data mining approach
Following the method of Wahabzada et al. (Reference Wahabzada, Mahlein, Bauckhage, Steiner, Oerke and Kersting2015a), a data driven approach for an automated analysis of hyperspectral data was used. Simplex Volume Maximization (SiVM) is a recent, fast and interpretable factorization technique that represents the data (hyperspectral images and signatures) in terms of only a few extreme components (signatures). Furthermore, K-means clustering as an unsupervised and data driven approach was applied on the data (Wahabzada et al., Reference Wahabzada, Paulus, Kersting and Mahlein2015b; Leucker et al., Reference Leucker, Wahabzada, Kersting, Peter, Beyer, Steiner, Mahlein and Oerke2016). To contribute to different illumination situations in the canopy scenes of barley, the spectral angle mapper (SAM) was chosen for data analysis. SAM calculates the spectral similarity of spectra and reference spectra using the spectral angle between the two spectra in an n-dimensional space, dependent on the number of spectral bands. With the presented data analysis methods, all pixels of the hyperspectral images were considered.
Results
Automated resistance screening on the microscopic scale
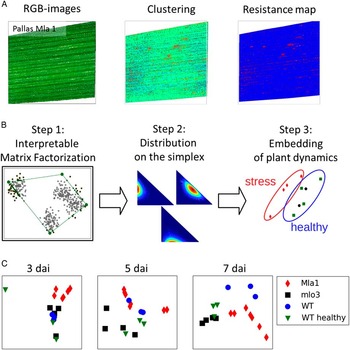
The automated assessment of spectral reflectance among different genotypes during the experimental period from microscopic data were in accordance to the manually assessed spectral signatures and visual assessed processes during pathogenesis (data not shown). Significant changes among different genotypes and over time were assessd and low standard deviation of +−1.3 in the VIS and 14.3 in the NIR indicate, that especially the VIS is relevant for differentiation among resistant and susceptible genotypes. A map system of Bgh resistance was established based on automatically assessed reflectance spectra (Fig. 1A). The resistance maps accentuated the location of Bgh diseased leaf tissue over time. This mapping process allows the visual observation of host-pathogen interaction and, if desired, a rapid visual identification of relevant pixels. Hypersensitive responses and papillae based resistance could be separated from healthy and diseased individuals in the following using matrix factorization (Fig. 1B). The accuracy for the detection of HR was >80%, which is satisfying due to the aspect, that these hypersensitive responses are only detectable by destructive analysis, Embedding the spectral extremes emphasises differences among plant genotypes (Fig. 1C).
Hyperspectral phenotyping of disease resistance and monitoring of pathogenesis on the microscopic scale. (A) Example of hyperspectral tissue screening of barley, cv. Pallas Mla1 and assessment of resistance spectra by k-means clustering. (B) Based on this data setup, an embedding of spectral dynamics is presented. (C) This approach enables the monitoring and differentiation of different plant genotypes and plant-pathogen interaction types.

Assessment of plant diseases on the plant level
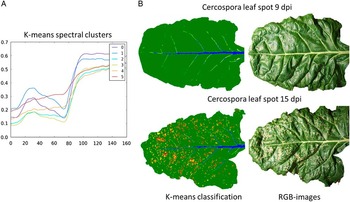
Spectral signatures of seven cluster means, assessed by k-means clustering are given in Fig. 2A. For more details to the methodology applied, please refer to Wahabzada et al. (Reference Wahabzada, Paulus, Kersting and Mahlein2015b) and Leucker et al. Reference Leucker, Wahabzada, Kersting, Peter, Beyer, Steiner, Mahlein and Oerke2016. Each cluster was assigned to one colour and the clustering results were visualised by pseudo-colour images (Fig. 2B). Typical spectral clusters of healthy tissue (green), leaf veins (blue) and Cercospora leaf spots (from yellow to red) could be assessed automatically, without human intervention. The accuracy of this approach was assessed by establishing a trainings data set and manual annotation of diseased spot. Subsequent post-classification by a confusion matrix resulted in an accuracy of 94%. By counting pixel, assigned to diseased cluster, a quantification of the disease severity is possible.
Clustering of hyperspectral signatures of sugar beet leaves, diseased with Cercospora leaf spot on the leaf scale. (A) Seven characteristic clusters for healthy and diseased parts and for leaf veins were evaluated and (B) plotted on hyperspectral images.

Hyperspectral 3D models – case study
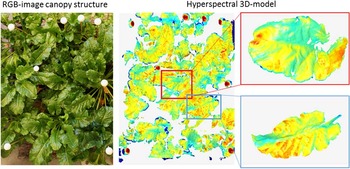
Fusion of hyperspectral imaging and 3D laser scanning data provided hyperspectral 3D models according to Behmann et al. (Reference Behmann, Mahlein, Paulus, Kuhlmann, Oerke and Plümer2016). The generation og hyperspectral 3D plant models consist of the following steps: 1. Measurement of hyperspectral images, 2. Calibration of the hyperspectral camera to a reference object, 3. Measurement of 3D architecture of plants 4. Mapping and combining spectral and spatial information to a unique coordinate system. Therefore the corresponding parameters of the 3D ray for each pixel of the hyperspectral images have been calculated, based on these information, the observed surface point of the plant could be assessed. Our results indicate, that 60% of the spectral information depends on the plants geometry. For more insights into the methodology, please refer to Behmann et al. (Reference Behmann, Mahlein, Paulus, Kuhlmann, Oerke and Plümer2016). The application of hyperspectral 3D models has been investigated in a case study of sugar beet plants and canopy, inoculated with Cercospora leaf spot. With this approach we could demonstrate, that spectral signals are affected by both, the geometric sensor configuration and the plant geometry (Fig. 3). Based on the presented hyperspectral 3D models, normalisation and calibrations routines can be applied to increase the data quality and resulting classification results (Roscher et al., Reference Roscher, Behmann, Mahlein, Dupuis, Kuhlmann and Plümer2016).
Hyperspectral 3D-plant canopy model of sugar beet plants, allows to consider the variable distance to the light source and the sensor within the plant canopy and plant parameters, such as leaf inclination.

Automated disease detection in plant canopies by hyperspectral imaging
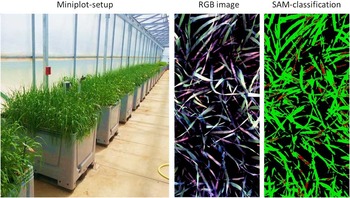
Investigations of barley cultivars on the canopy scale resulted in a multi-dimensional and multi-temporal data set. The erectophile architecture of barley plants result in multiple sensor to object distances, shadowing and angular effects on the hyperspectral data (Figure 4).
Measuring setup for the detection of plant diseases on the canopy scale and classification of powdery mildew diseased pixels of barley by spectral angle mapper classification (SAM).

Because the analysed spectra are transferred as vectors, variable illuminations due to the surface structure of the barley canopy were attenuated (darker pixel will plot along the same vector, but closer to the origin). With this approach a detection of disease symptoms (red pixels, Fig. 4) and an evaluation of the susceptibility of different cultivars was realized with an accuracy of 82%. We believe that this result can be improved by further considering the plants architecture. Here the distance between the sensor, the light source and the object plays a crucial role. Leave, within deeper areas of the canopy exhibit a lower reflectance intensity, decreased by the factor 2, therefore, the selection of spectral endmembers is crucial to obtain reliable results. Thus we propose a portioning of the data set into two parts, one part with pixels from lower leaves, and one part with pixels, belonging to upper parts of the canopy. Specific endmemeber for each region will increase the classification result in future. As an alternative we propose data analysis by Matrix Factorization and Simplex Volume Factorisation (SiVM). By this one may overcame the problem of heterogeneous illumination within complex canopies.
Discussion
It has been shown that hyperspectral imaging can be give new insights into plant data on different scales, from the tissue level to the canopy level. This offers several new applications for plant phenotyping or precision agriculture. Nevertheless, the scalability between hyperspectral close range-, greenhouse-, field- and remote imaging has to be investigated in more detail in future research. From the technical side, a calibration of camera systems and different kind of measuring setups is essential (Behmann et al., Reference Behmann, Mahlein, Paulus, Kuhlmann, Oerke and Plümer2015).
Furthermore, the 3D structure of the object of interest influences the information in hyperspectral data. Thus, optical sensing benefits from combined hyperspectral and 3D measuring approaches (Behmann et al., Reference Behmann, Mahlein, Paulus, Kuhlmann, Oerke and Plümer2016; Roscher et al., Reference Roscher, Behmann, Mahlein, Dupuis, Kuhlmann and Plümer2016; Wahabzada et al., Reference Wahabzada, Paulus, Kersting and Mahlein2015b).
Another important factor, influencing the information content of hyperspectral images, is the spatial resolution and the amount of mixed pixels. This parameter strongly depends on the distance between the sensor and the object, thus airborne or space-borne, far-range systems have lower spatial resolution compared to near-range or microscopic systems. Sensors with a spatial resolution of about 1 meter are hardly suitable for the detection of single symptoms or diseased leaves and plants; here proximal sensor platforms are preferable (Oerke et al., Reference Oerke, Mahlein and Steiner2014). The spatial resolution has a strong influence on the detection of plant diseases or plant-pathogen interactions (Mahlein et al., Reference Mahlein, Steiner, Hillnhütter, Dehne and Oerke2012). Increasing the distance between sensor and plant is challenging for the specificity and sensitivity. Nevertheless, identified characteristic hyperspectral signatures seems to be transferable on different scales. This enables a new approach for basic research in the lab and in the greenhouse to analyse the plant phenotype and genotype under different conditions and transferring this knowledge to remote sensing methods. Future research also has to consider improved sensor platforms and vehicles for field and high-throughput applications more intensively (Polder et al., 2014; Sankaran et al., Reference Sankaran, Mishra, Ehsani and Davis2010; Virlet et al., Reference Virlet, Sabermanesh, Sadeghi-Tehran and Hawkesford2016; Walter et al., Reference Walter, Liebisch and Hund2015). It is expected, that new developments in the field of robotics will speed up this process.
Conclusion
There are multiple opportunities and technical solutions for an automated, objective and reproducible assessment of plant diseases and resistance relation by hyperspectral methods. As presented in this work, many of these technologies are still in a developmental phase. The time frame for a standardized invention into agricultural practice in precision agriculture or plant phenotyping can only be roughly estimated. Especially in field applications the impact of environmental factors, the plant architecture and the measuring setup has to be considered carefully.
Acknowledgements
Funding support was provided by the German Federal Ministry of Education and Research (BMBF) within the scope of the competitive grants program “Networks of excellence in agricultural and nutrition research - CROP.SENSe.net” (Funding code: 0315529), junior research group “Hyperspectral phenotyping of resistance reactions of barley” and by the Daimler and Benz foundation.