Implications
Intensive pig units are often poorly lit, noisy environments in which atmospheric ammonia accumulates. Here, we report the results of an experiment designed to test whether commercially relevant levels of elevated ammonia, low light and high noise are stressful to domestic pigs. Our findings suggested that, within current legal limits, there should be little concern about these physical conditions in terms of performance. However, there was evidence that chronic exposure to 20 ppm ammonia during the rearing period represented a significant stressor to growing pigs, potentially compromising their welfare. This has implications for both policy makers and farmers.
Introduction
Commercially farmed animals are frequently housed in conditions that impose environmental stressors. This is particularly the case for intensively farmed animals kept in closed systems such as indoor housed pigs. More than 75% of the UK pig herd are housed indoors (defra, 2003) in conditions differing markedly from those experienced by the progenitor. Research over the past three decades has sought to identify specific aspects of this environment that may compromise their health, growth and/or well-being. Physical environmental stressors include atmospheric pollutants such as ammonia, loud mechanical noise and low ambient light.
Of these three potential stressors, ammonia has received the most attention partly due to its role as a respiratory irritant and also because it is commonly found in high concentrations in commercial piggeries and is a cause of environmental pollution (Drummond et al., Reference Drummond, Curtis, Simon and Norton1980; Groot Koerkamp et al., Reference Groot Koerkamp, Metz, Uenk, Phillips, Holden, Sneath, Short, White, Hartung, Seedorf, Schröder, Linkert, Pedersen, Takai, Johnsen and Wathes1998). Although pigs are known to actively avoid ammoniated environments (Jones et al., Reference Jones, Burgess, Webster and Wathes1996; Smith et al., Reference Smith, Wathes and Baldwin1996) and some studies have found a deleterious effect of high atmospheric ammonia on production parameters such as growth and food conversion efficiency (Stombaugh et al., Reference Stombaugh, Teague and Roller1969; Drummond et al., Reference Drummond, Curtis, Simon and Norton1980), many studies have examined higher ammonia concentrations than are typical of modern pig units (Groot Koerkamp et al., Reference Groot Koerkamp, Metz, Uenk, Phillips, Holden, Sneath, Short, White, Hartung, Seedorf, Schröder, Linkert, Pedersen, Takai, Johnsen and Wathes1998; Seedorf and Hartung, Reference Seedorf and Hartung1999). Indeed, a recent large study that investigated the impact of housing weaner pigs in more commercially relevant ammonia concentrations (0.6, 10.0, 18.8 or 37.0 ppm) for five and a half weeks actually found no direct impact of ammonia on either growth or food conversion efficiency (Wathes et al., Reference Wathes, Demmers, Teer, White, Taylor, Bland, Jones, Armstrong, Gresham, Hartung, Chennells and Done2004), and nor were there any effects on respiratory health (Done et al., Reference Done, Chennells, Gresham, Williamson, Hunt, Taylor, Bland, Jones, Armstrong, White, Demmers, Teer and Wathes2005). However, exposure of pigs of around 4 weeks of age to either 12 h or 19 days of 35 ppm ammonia has been shown to result in significantly elevated serum cortisol, which suggests that this concentration of ammonia may cause some level of physiological stress (von Borell et al., Reference von Borell, Özpinar, Eslinger, Schnitz, AZhao and Mitloehner2007). Therefore, the question of whether ammonia, within the range of concentrations weaner or growing pigs are likely to experience on commercial farms, constitutes a stressor is yet to be unequivocally answered.
High background noise is commonplace in many commercial pig units, particularly in those with mechanical ventilation, and sound pressure levels of more than 70 dB (A) have been measured in such units (Algers et al., Reference Algers, Ekesbo and Strömberg1978; Talling et al., Reference Talling, Lines, Wathes and Waran1998). The European Council recommends that constant noise as loud as 85 dB (A) should be avoided in pig buildings (Council Directive 2001/93/EC). Pigs are known to show an initial response to loud noise (80 to 97 dB (Lin)) in the form of an increase in heart rate and active behaviour followed by apparent habituation in short-term tests (Talling et al., Reference Talling, Waran, Wathes and Lines1996). Longer term studies investigating the effect of intermittent loud noise on pigs observed elevated plasma cortisol and ACTH concentrations in response to this stimulation that attenuated over time, as well as altered sensitivity of the hypothalamic–pituitary–adrenal (HPA) axis and reduced growth (Otten et al., Reference Otten, Kanitz, Puppe, Tuchscherer, Brüssow, Nürnberg and Stabenow2004; Kanitz et al., Reference Kanitz, Otten and Tuchscherer2005). However, the consequences of chronic exposure to continuous high noise, which are likely to be experienced by pigs reared in mechanically ventilated systems, have not yet been explicitly examined.
Relatively little is known about the effect of housing pigs under conditions of low ambient light. Current European legislation states that pigs must be kept at a minimum light intensity of 40 lux for 8 h/day (Council Directive 2001/93/EC), and although this level of illumination is not aversive to pigs (Taylor et al., Reference Taylor, Prescott, Perry, Potter, Sueur and Wathes2006), their commercial performance in this environment relative to more illuminated conditions has not been studied. The pineal gland represents a link between the endocrine system of animals and ambient light (Reiter, Reference Reiter1991), and in humans, light intensity during the photoperiod is known to be associated with a number of psychological and physical health parameters (Piccoli et al., Reference Piccoli, Parazzoli, Zaniboni, Demartini and Fraschini1991; Partonen and Lonnqvist, Reference Partonen and Lonnqvist2000; Golden et al., Reference Golden, Gaynes, Ekstrom, Hamer, Jacobsen, Suppes, Wisner and Nemeroff2005). Therefore, although little is known about the influence of low light (LL) intensity on growing pigs, it is possible that the dim environment in which many are reared has a deleterious impact on their well-being.
No research to date has investigated the combined effects of high ammonia, constant noise and low illumination. This represents a significant gap in our knowledge as these conditions are likely to be experienced simultaneously in a typical pig production system. The aim of this study was to address this deficit by testing whether commercially relevant concentrations of ammonia, high noise (HN) and low light influence the behaviour, physiology and growth of growing pigs, and if so, whether their effects are additive or multiplicative. This was approached using a fully factorial arrangement of treatments and examining a suite of variables that are either directly or indirectly associated with physiological stress. Measures of HPA activity were taken, which included salivary cortisol and adrenal morphometry as well as a test of the reactivity of the HPA axis, as chronic stress can alter the magnitude of HPA response to subsequent acute stressors (Janssens et al., Reference Janssens, Helmond and Wiegant1994 and Reference Janssens, Helmond, Loyens, Schouten and Wiegant1995; Harris et al., Reference Harris, Gu, Mitchell, Endale, Russo and Ryan2004). Activation of the HPA axis is associated with a generalised response to perceived stressors (Selye, Reference Selye1936; von Borell, Reference von Borell2000), and although the interpretation of such measures requires caution, it remains a standard approach to quantifying stress in farm animals (Mormede et al., Reference Mormede, Andanson, Auperin, Beerda, Guemene, Malnikvist, Manteca, Manteuffel, Prunet, van Reenen, Richard and Veissier2007). To strengthen the interpretation of HPA measures when assessing the impact of the treatment conditions on the pigs’ physiology, several other measurements were taken. Production parameters of weight gain, food conversion efficiency and back fat were recorded as a strong link between chronic stress and poor growth performance is frequently observed (e.g. Hyun et al., Reference Hyun, Ellis, Riskowski and Johnson1998; Sutherland et al., Reference Sutherland, Niekamp, Rodriguez-Zas and Salak-Johnson2006; Foury et al., Reference Foury, Geverink, Gil, Gispert, Hortós, Font i Furnols, Carrion, Blott, Plastow and Mormède2007). One of the key causal mechanisms of this relationship is thought to be the general catabolic influence of high circulating cortisol on certain muscle types and fat cells (Sapolsky et al., Reference Sapolsky, Romero and Munck2000; Yoshioka et al., Reference Yoshioka, Imaeda, Ohtani and Hayashi2005). Overall health indicators were also assessed, as chronic stress is known to have a generally suppressive effect on the immune system (Monjan and Collector, Reference Monjan and Collector1977; Jasnow et al., Reference Jasnow, Drazen, Huhman, Nelson and Demas2001; Kanitz et al., Reference Kanitz, Tuchscherer, Puppe, Tuchscherer and Stabenow2004). Again, this association is mediated, at least in part, by glucocorticoids (Chrousos, Reference Chrousos1995). Finally, play behaviour was recorded as it is a high-energy activity that is frequently reduced under stress (Muller-Schwarze et al., Reference Muller-Schwarze, Stagge and Muller-Schwarze1982; Siviy and Panksepp, Reference Siviy and Panksepp1985; Siviy and Atrens, Reference Siviy and Atrens1992). Play is also thought to be an intrinsically rewarding activity and has been suggested as a potential indicator of positive emotion in animals (Vanderschuren et al., Reference Vanderschuren, Niesink and Ree1997; Boissy et al., Reference Boissy, Manteuffel, Jensen, Moe, Spruijt, Keeling, Winckler, Forkman, Dimitrov, Langbein, Bakken, Veissier and Aubert2007). Therefore, the inclusion of play observations in this study was intended to provide an insight into whether the pigs perceived the treatment conditions as stressful. This is an important facet to this study as measures of physiological stress are not necessarily on a linear continuum with welfare (Veissier and Boissy, Reference Veissier and Boissy2007).
This study was conducted in parallel with a study on the same individuals that investigated the impact of environmental stressors on the social behaviour of pigs (Parker, Reference Parker, O'Connor, McLeman, Demmers, Lowe, Owen, Davey, Wathes and Abeyesingheet al., 2010).
Material and methods
Subjects, housing and husbandry
Two batches (N batch = 112, N total = 224) of 4-week-old hybrid gilts (50% White synthetic Pietrain – 25% white Duroc – 12.5% Landrace – 12.5% Large White; PIC, Carlisle, Cumbria, UK) were obtained at weaning from a commercial indoor pig farm. All pigs had been tail docked as part of normal commercial practice. The first batch was obtained in May 2008 and the second in September 2008; pigs were kept for 15 weeks until they reached slaughter weight (batch one 80.4 ± 0.6 kg and batch two 81.9 ± 0.7 kg). Before transportation, each pig was ear-tagged with a herd number and unique identification code. Pigs were individually weighed on arrival, and then allocated to eight groups of 14 pigs, each housed within identical 19.6 m2 rooms with access to electrolyte solution (Pigilyte, Norbrook, UK) in cube drinkers. The groups consisted of randomly selected pigs (from up to five piglets from each of up to 33 sows) with the proviso that littermates were not allocated to the same group. The pigs were also spray-marked on arrival and weekly thereafter to allow identification from video footage. The rooms were bedded with straw and soiled bedding was removed and replenished with clean straw daily. The pigs had ad libitum access to water and dry feed (A1 creep, Primary Classic, Delta wean 12, 35, 50; ABN). The environmental temperature was kept within the recommended levels for pigs housed on straw (defra, 2007), commencing at 28°C on day 1 and gradually falling to an average of 19.6 ± 0.05°C for batch one and 18.5 ± 0.06°C for batch two. The stocking density of 14 pigs in each experimental room allowed 1.4 m2 of space per pig, complying with defra regulations (2007) that specify that pigs must have at least 0.15 m2 of unobstructed floor area when their average weight is 20 kg or less (as the pigs were at the start of the experiment) and 0.55 m2 if their average weight is >50 kg, but ⩽85 kg (as the pigs were at the end of the experimental period). Rooms were ventilated artificially at a minimum rate of six air changes per hour and illuminated by fluorescent lighting from 0730 to 1930 h, inclusive of 30 min dawn and dusk periods. The dawn/dusk periods involved percentage increases/reductions from the light intensity during the photoperiod ensuring that the treatment conditions were not disrupted. A variety of loose and hanging materials (ropes, chains and drinker-pipe) were provided for rooting and chewing in each room. This work was regulated under the United Kingdom Animals (Scientific Procedures) Act (1986).
Experimental design
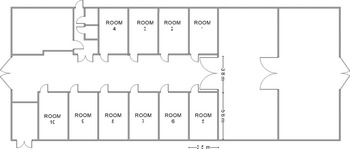
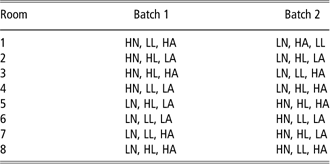
Each room (rooms 1 to 8, Figure 1) was allocated to one of eight experimental treatments in a 23 fully factorial design and maintained under a combination of the following experimental conditions (Table 1):
Building layout comprising rooms one to eight of animal accommodation. Each room was 19.6 m2.

Treatment allocation across rooms/batches

HN = high noise; LL = low light; HA = high ammonia; HL = high light; LA = low ammonia; LN = low noise.
1. Low or elevated concentrations of atmospheric ammonia (nominally<5 ppm v. 20 ppm, 24 h atmospheric)
2. Low or high mechanical noise (nominally 60 dB(A) v. 80 dB(A) Leq24h equivalent fan noise)
3. Low or high light (HL) intensity (nominally 40 v. 200 lux 12 h)
Treatment conditions were chosen in line with current European legislation in the case of noise and light (Council Directive 2001/93/EC), and in the case of ammonia to reflect commercially relevant concentrations as there is currently no legislation regarding maximum atmospheric ammonia in pig housing (Groot Koerkamp et al., Reference Groot Koerkamp, Metz, Uenk, Phillips, Holden, Sneath, Short, White, Hartung, Seedorf, Schröder, Linkert, Pedersen, Takai, Johnsen and Wathes1998). However, the current occupational exposure standard for ammonia sets a limit of 8 h of exposure to 25 ppm ammonia in any 24-h period limit (UK Health and Safety Executive, 2001).
Ammonia
In the high ammonia concentration (HA) rooms, ammonia gas was supplied to the air inlets of each room to impose approximately 20 ppm of atmospheric ammonia averaged over a 24-h period. Dosage via electronic mass flow controllers was manipulated using a feedback loop that adjusted the dosage rate based on the measured ventilation rate and the measured ammonia concentration (NOx chemiluminescence analyser (Thermo Scientific, Waltham, USA), combined with a stainless steel ammonia convertor, (Mattheus Milieu Techniek, Wageningen, The Netherlands)), thus allowing for the natural emission of gaseous ammonia from faeces and urine, and variation in ventilation rate. Control concentrations of ⩽5 ppm of ammonia were maintained through sufficient ventilation in the low ammonia (LA) rooms. Daily checks were conducted in the LA and HA rooms using a calibrated hand-held ammonia monitor over the entire experimental period (Pac III, Dräger Safety Inc., Pennsylvania, USA). From these measurements, ammonia concentrations of 18.0 ±0.4 ppm and 19.0 ± 0.3 ppm were recorded in the HA rooms and 3.2 ± 0.1 ppm and 3.7 ± 0.1 ppm in the LA rooms in batches one and two, respectively.
Noise
For the HN rooms, a pink noise generator (custom build at the Royal Veterinary College) was used to recreate fan noise; its frequency distribution was shaped by a graphic equaliser (ART, model HD215, Utah, USA) to approximate the spectrum of the ventilation system (in the facility) running at 100% capacity. This signal was fed to audio amplifiers (model RMX850, QSC, California, USA) and then to loudspeakers (Electrovoice, model SX80, Minnesota, USA) and subwoofers (Electrovoice, model SB122, Minnesota, USA) located on the ceiling of each of the HN treatment rooms. Dummy loudspeakers and subwoofers constructed from high-density foam were fixed in the same positions in the low noise (LN) rooms to control for any effects on air circulation. The sound pressure level (SPL) in each room was modulated separately via a control system (Formula Sound, model AVC2-D, London, UK) to maintain an SPL of around 80 dB(A) such that variations in ventilation rate and ambient noise did not cause the SPL to exceed this target. The sounds levels in the LN rooms were determined by the ventilation system. Noise surveys were conducted using a calibrated soundmeter (Cirrus CR:831B Noise Meter, Cirrus Research plc., North Yorkshire, UK) in each room shortly before the arrival of the pigs and for batch one the average SPL was 53.8 ± 3.3 dB(A) in the LN rooms and 77.7 ± 0.4 dB(A) in the HN rooms. In batch two, the average SPL was of 53.0 ± 0.7 dB(A) in the LN rooms and 80.7 ± 0.4 dB(A) in the HN rooms. With occupied rooms, actual SPLs were likely to have fluctuated slightly due to the noise created by the pigs.
Light intensity
The fluorescent light intensity in the rooms was calibrated with a light meter at nine equidistant points in the room (Testo 545, Testo Ltd, Alton, UK) to provide nominally 40 lux at 0.5 m from the floor in low light (LL) treatment rooms and 200 lux in the HL treatment rooms. Spot-checks of the light intensity at 0.5 m from the floor in the centre of each room were conducted five times a week throughout the trial using the same light meter. The mean light intensities for batch one were 41.54 ± 0.92 lux in the LL rooms and 172.04 ± 6.26 lux in the HL rooms. In batch two, the mean light intensity was 37.70 ± 1.31 lux in the LL rooms and 152.91 ± 5.83 lux in the HL rooms.
In each batch, treatment conditions were randomly allocated to rooms with the restriction that all HN rooms had to be on the same side of the building to minimise sound leakage between HN and LN rooms. Exposure to the environmental stressors began at the start of the experiment, immediately on arrival of the pigs, and continued to its conclusion 15 weeks later. The pigs were then transported to a commercial abattoir for slaughter at the end of the experiment and removal of various tissues.
Saliva sampling and cortisol measurement
Seven individuals from each room were randomly selected as focal pigs for measuring the concentration of salivary cortisol. Since cortisol is only found in its active (unbound) form in saliva, it has been suggested that salivary cortisol may be of greater biological significance than total blood measures (Cook et al., Reference Cook, Schaefer, Lepage and Morgan Jones1996). Furthermore, salivary cortisol has been shown to be highly correlated with serum-free cortisol as well as total plasma cortisol in many species including pigs (Greenwood and Shutt, Reference Greenwood and Shutt1992; Cook et al., Reference Cook, Schaefer, Lepage and Morgan Jones1996; Bushong et al., Reference Bushong, Friend and Knabe2000). Saliva samples were taken from these pigs in each room between 1400 and 1530 h on a single day in weeks 3, 8 and 14 after mixing. This afternoon sampling time was chosen as it is a period in the normal circadian rhythm of cortisol when variations between individuals attributable to differences in sampling time should be relatively low (Ruis et al., Reference Ruis, Te Brake, Engel, Ekkel, Buist, Blokhuis and Koolhaas1997; de Jong et al., Reference de Jong, Prelle, van de Burgwal, Lambooij, Korte, Blokhuis and Koolhaas2000). Pigs were ‘gentled’, as a group, for 10 min/day, for the 1st week following arrival to facilitate the saliva sampling procedure and to ameliorate handling effects on stress. Weeks 3, 8 and 14 after mixing were chosen to represent the start, middle and end of the experimental period (insufficient saliva was obtained from the pigs in the first 2 weeks of the trial for analysis). For each sampling session, the order in which the samples were collected was randomised across rooms to avoid variations attributable to the circadian rhythm of cortisol being misinterpreted as stable room differences (Ekkel et al., Reference Ekkel, Dieleman, Schouten, Portela, Cornelissen, Tielen and Halberg1996; Ruis et al., Reference Ruis, Te Brake, Engel, Ekkel, Buist, Blokhuis and Koolhaas1997). Saliva was collected by allowing the pigs to chew on cotton swabs until thoroughly moistened (<2 min). Swabs were then placed inside 10-ml Universal test tubes and stored on ice during the collection session. Directly after collection the swabs were centrifuged for 15 min at 2500 r.p.m. (4°C) to remove the saliva, which was then poured into a 1.5 ml Eppendorf tube and frozen at −20°C until analysis.
Concentrations of cortisol were measured in the saliva samples using a modified solid phase radioimmunoassay (Coat-a-Count Cortisol TKCO, Diagnostics Products Corporation, Los Angeles, CA, USA). Samples were thawed before being centrifuged for 10 min at 2500 r.p.m. (4°C) and the supernatant transferred to a new tube. Duplicate samples of 200 μl were pipetted into antibody-coated tubes along with 1000 μl of radioactive tracer. After a 3-h period of incubation at room temperature, the supernatant was poured off and the pellet counted in a gamma counter. The minimum detectable cortisol concentration was 1 ng/ml and the inter- and intra-assay coefficients of variation were 8.2% and 2.7%, respectively.
Stress reactivity trial
All focal pigs were involved in this procedure, which was designed to test the responsiveness of the pigs’ HPA axis to a standard stressor (social isolation). Social isolation has been shown to lead to elevated salivary cortisol in previous studies on growing pigs (de Jong et al., Reference de Jong, Ekkel, Van de Burgwal, Lambooij, Korte, Ruis, Koolhaas and Blokhuis1998; Ruis et al., Reference Ruis, te Brake, Engel, Buist, Blokhuis and Koolhaas2001; Sorrells et al., Reference Sorrells, Eicher, Scott, Harris, Pajor, Lay and Richert2006). In week 10 after mixing (the start of the experiment), pigs were individually removed from their home pen and relocated to a 1.75 m × 1.75 m pen in a separate empty room for 15 min. The order and day on which this procedure was conducted were randomised within and across rooms. Saliva samples were taken (as above) from each pig at three separate time points: 5 min before removal from their home pen (−5 min); immediately after the end of the isolation period (15 min); and 30 min after return to their home pen (45 min). These time intervals were chosen to reflect the time course of the effect of social isolation on salivary cortisol previously shown in growing pigs (de Jong et al., Reference de Jong, Ekkel, Van de Burgwal, Lambooij, Korte, Ruis, Koolhaas and Blokhuis1998). Salivary cortisol was measured from these samples as described above. The inter- and intra-assay coefficients of variation were 7.2% and 2.2%, respectively, for the assays performed on the saliva from this trial.
Adrenal morphometry
Adrenal glands were collected from all pigs at the abattoir after slaughter. Following evisceration, each adrenal gland was cut away from the surrounding fat before being weighed and the left adrenal gland fixed in buffered formalin. The average weight of the two adrenal glands was expressed as a percentage of each pig’s total body weight (BW). A mid-portion section of the left adrenal gland from each focal pig was embedded in paraffin wax and a rotary microtome (Leica Jung, model 2035, Milton Keynes, UK) was used to cut a 4 μm transversal slice that was then stained with eosin and haematoxylin to enable the adrenal cortex and medulla to be clearly distinguished by eye. Each slice was then mounted on a glass slide and a high-resolution digital photo taken of the sample. The total area of the adrenal slice as well as the area represented by the adrenal cortex was calculated from enlarged versions of these images using an image-processing program (ImageJ 1.41). The percentage of the adrenal slice made up of the adrenal cortex was calculated from these measurements.
Growth, feed intake and health scores
Growth parameters were monitored by manually weighing all the pigs once a week using calibrated scales (Pharmweigh Junior, Bury St. Edmunds, UK). Feed consumption was estimated weekly by weighing back the feed remaining in the troughs. This enabled weekly group feed conversion ratios (FCR) to be calculated for each room by dividing the total weight gain for a room by the total feed consumed in that room. The depth of fat in mm over the head of the last rib, that is, P2 was measured for each pig at slaughter.
Once a week, pigs were scored individually for the presence or absence of the following general health indicators: nasal and/or ocular discharge, respiratory difficulty (such as coughing or laboured breathing), diarrhoea and lameness. Recording of the aforementioned health indicators was conducted sequentially on each pig by an observer who stood in the room for roughly 10 min (any coughs made by the pigs in the room were recorded during this time regardless of whether that specific individual was being observed at the time). Most of the pigs had periods of both rest and activity during the 10-min observation period. Mean health scores per week were calculated by dividing the total health scores for each room in each week over the experimental period by the number of weeks over which the health scores were collected.
Play behaviour
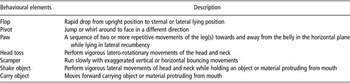
An overhead CCTV camera system (Milestone XProtect Remote Client, Milestone Systems, Ripley, UK) was used to record the behaviour of pigs in each room for a 30-min period (1530 to 1600 h) using continuous sampling across the whole group once in weeks 3, 8 and 14 after mixing. Behavioural recordings were made on days when the pigs were undisturbed by procedures such as weighing, health scoring, saliva sampling, etc. The occurrence of locomotor play was identified from these recordings using ‘play markers’, which are behavioural sequences associated with play (Newberry et al., Reference Newberry, Wood-Gush and Hall1988). Social play was not recorded as it is inherently confounded by social factors (Palagi and Paoli, Reference Palagi and Paoli2007; Cordoni, Reference Cordoni2009), whereas locomotor play is more likely to reflect an individual’s welfare status. A bout of play was defined as a period of behaviour involving one or more of the elements described in Table 2. A bout ceased when no play markers were seen for 5 s or more. The duration of play bouts performed by pigs in each room was recorded for each session from which the percentage of each observational period that the pigs were engaged in play was calculated.
Ethogram of play markers following Newberry et al. (Reference Newberry, Wood-Gush and Hall1988)

Statistical analyses
All data were analysed using general or generalised linear mixed models (GLMM) in SAS version 9.2 (SAS Institute, Cary, NC, USA) with normal, binomial and log error distributions as appropriate. GLMMs partition variance in a response variable attributable to both fixed and random factors. Fixed effects are generally experimentally determined levels of a given factor where interest lies in estimating the mean of each level, whereas random effects are factors where the interest lies in quantifying variations among them as opposed to between specific levels of each (Littell et al., Reference Littell, Milliken, Stroup, Wolfinger and Schabenberger2006; Bolker et al., Reference Bolker, Brooks, Clark, Geange, Poulsen, Stevens and White2009). GLMM are designed to analyse non-normal data by assuming errors from the exponential family. The basic model included ammonia, noise and light as fixed factors along with all two- and three-way interactions. Batch was also entered as a fixed factor as there were only two batches. Room and room interacting with batch were entered as random factors to account for the non-independence of pigs within rooms and rooms across batches. The significance of fixed effects was estimated using Wald type adjusted F statistics and the effect with the highest P-value was sequentially dropped until only significant terms remained in the model. Degrees of freedom (d.f.) were calculated using the Kenward–Roger method (Kenward and Roger, Reference Kenward and Roger1997), which is appropriate for unbalanced data with multiple random effects. Where significant interactions between treatments were detected, the differences between specific treatment combinations were examined using least squares means (LSM) output from the GLMM.
Weekly salivary cortisol concentrations were analysed using the above model with week as an additional fixed factor to test for differences in cortisol concentrations over the experimental period. Furthermore, pig identities nested within room and batch were added to the existing random effects structure to take into account the non-independence of repeated measures on the same subjects. The outcome of the stress responsiveness trial was analysed with salivary cortisol as the response variable and the time at which the sample was taken (i.e. −5, 15 and 45 min) as an additional fixed factor in the basic model. Pig identity nested within room and batch was again specified as the random effects structure to control for repeated measures on the same individual. Adrenal gland weight was analysed using the basic model described above with adrenal gland weight as a proportion of total BW as the response variable. In examining treatment effects on the size of the adrenal cortex, the basic model was used with the proportion of the adrenal slice represented by the adrenal cortex as the response variable. The relationship between the size of the adrenal cortex and salivary cortisol was tested using the basic model with the proportional size of the adrenal cortex specified as a covariate and cortisol as the response variable.
To test whether there were any effects of the treatment conditions on the overall weight and growth trajectory of the pigs, the weight of all the pigs in every week was entered as the response variable with week as a covariate and a random effects structure of pig identity nested within room and batch again to account for repeated measures on the same individuals. To test for treatment differences in food conversion efficiency, the group FCR of pigs in each room across every week was entered as the response variable and week was added as a covariate. The P2 back-fat thickness of the pigs was analysed using the basic model with P2 as the response variable. The health scores were analysed using the basic model with health indicator (i.e. nasal/ocular discharge, respiratory difficulty, diarrhoea and lameness) added as an extra fixed factor to test whether there were differences in the scores recorded for each indicator.
For analysing play behaviour, the mean duration of play bouts observed in the rooms in all 3 weeks recorded was entered as the response variable with week as an additional fixed factor in the basic model to test for differences in play behaviour over the experimental period. All means were calculated from raw data and reported with standard errors.
Results
Salivary cortisol
There was a trend for pigs in batch one to have slightly higher concentrations of salivary cortisol than pigs in batch two (batch one 3.48 ± 0.23 ng/ml, batch two 2.71 ± 0.16 ng/ml: F 1,13 =3.86, P = 0.07). After controlling for batch differences, pigs exposed to ammonia at ∼20 ppm had significantly lower cortisol concentrations than pigs in rooms with minimal ammonia (HA 2.95 ± 0.12 ng/ml, LA 3.84 ± 0.18 ng/ml; ammonia: F 1,13 = 8.96, P = 0.01). However, there was a trend for this effect to depend on light intensity (light*ammonia: F 2,137 = 3.56, P = 0.06), with the effects of ammonia being more pronounced when pigs were kept at lower light intensity (LL LA 4.01 ± 0.26 ng/ml, LL HA 2.65 ± 0.12 ng/ml; LSM: P < 0.01) in comparison with HL intensity (HL LA 3.68 ±0.24 ng/ml, HL HA 3.27 ± 0.19 ng/ml; LSM: P = 0.35). Overall, the pigs had lower concentrations of salivary cortisol in week 3 compared with weeks 8 and 14 (week 3: 1.93 ±0.18 ng/ml, week 8: 3.71 ± 0.28 ng/ml and week 14: 3.87 ± 0.20 ng/ml: F 2,283 = 28.93, P < 0.01). However, there were no differences in the effects of any of the treatment conditions on salivary cortisol depending on the week the samples were collected (ammonia*week: F 2,279 = 0.63, P = 0.53, noise*week: F 2,289 = 2.05, P = 0.13, light*week: F 2,281 = 1.43, P = 0.14). There were no other significant effects of the experimental treatments on salivary cortisol concentrations.
Stress responsiveness trial
The pigs had slightly elevated salivary cortisol concentrations at 15 min, but the greatest increase in cortisol was observed after the pigs were returned to their home pen (−5 min 3.01 ± 0.20 ng/ml, 15 min 3.41 ± 0.27 ng/ml and 45 min 4.06 ± 0.37 ng/ml: F 2,307 = 2.99, P = 0.05). However, there was no observable effect of the environmental conditions in which the pigs were housed on their response to social isolation.
Adrenal morphometry
On average, the adrenal glands of the pigs represented 2.57 ± 0.03% of their BW. There was no significant effect of any of the experimental conditions on the weight of adrenal glands. Pigs exposed to ammonia had a trend for proportionally larger adrenal cortices than those kept at LA (LA 75.7 ± 1.4%, HA 77.4 ± 0.8%; ammonia: F 1,38 = 3.39, P = 0.07). Pigs kept under LL intensity had a trend for smaller adrenal cortices than those kept in brighter light (LL 74.9 ± 0.8%, HL 78.2 ± 1.2%; light: F 1,8 = 4.29, P = 0.07). There was no significant effect of noise or any interactions between the experimental conditions on the proportion of the adrenal slice represented by the adrenal cortex. Overall, pigs with larger adrenal cortices tended to have lower salivary cortisol concentrations (slope = −0.03 ± 0.02, F 1,48 =3.77, P = 0.06).
Growth, feed intake and health scores
The mean weight of the pigs at the start and end of the experimental period was 7.8 ± 0.1 kg and 80.4 ± 0.6 kg in batch one and 7.3 ± 0.1 kg and 81.9 ± 0.7 kg in batch two. Overall, there was a significant difference between batches in the mean weight of the pigs over the course of the experiment (batch one 36.0 ± 0.2 kg, batch two 39.3 ± 0.2 kg: F 1,7 = 217.24, P < 0.01). However, after controlling for batch differences, there were no significant effects of any of the test conditions on the mean weight or growth trajectories of the pigs. Similarly, there was no evidence that differences in ammonia, light or noise influenced FCR or P2 thickness. However, FCR and P2 were significantly different between batches; the pigs in batch one were more efficient at converting their food to BW and had thicker P2s than the pigs in batch two (batch one FCR = 1.73 ± 0.03 kg of food/kg of weight gain, batch two FCR = 2.00 ± 0.01 kg of food/kg of weight gain: F 1,163 = 26.01, P < 0.01, batch one P2 = 10.06 ± 0.15 mm, batch two P2 = 7.48 ± 0.15: F 1,7 = 150.93, P < 0.01).
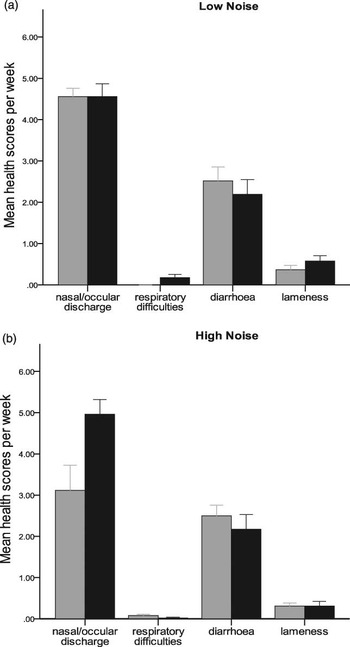
There was a significant interaction between health indicator, ammonia and noise on the health scores of pigs (Figures 2a and b; health*ammonia*noise: F 3,36 = 4.08, P < 0.01). This was most notably characterised by the observation that pigs exposed to HN and LA concurrently had significantly lower scores for nasal/ocular discharge than pigs in the HN and HA rooms (LSM: P < 0.01). However, at the lower noise level, no difference was observed between the nasal/ocular discharge scores of pigs in ammoniated or non-ammoniated rooms (LSM: P = 0.99). Therefore, it appeared that the combined effects of HN and LA decreased the prevalence of nasal and/or ocular discharge. There was a significant interaction between all three treatment conditions on the overall health scores (ammonia*noise*light: F 1,2 = 111.18, P < 0.01). This is a complex interaction that shows that ammonia, noise and light combine to determine overall health score, but further experimental work is required to untangle the cause of these effects. There were no other significant effects of treatments on the health scores of pigs.
Mean health scores (+s.e.) for pigs in low (a) and high (b) noise rooms that were exposed to either <5 ppm (grey bars) or 20 ppm (black bars) of atmospheric ammonia. n rooms = 4 per treatment combination.

Play behaviour
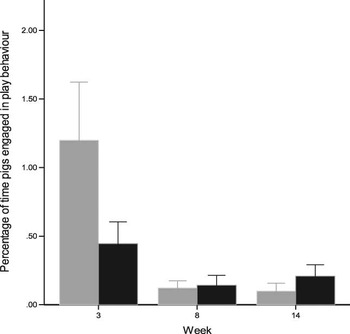
Overall, the pigs spent more time engaged in play in week 3 (0.82 ± 0.24% of time observed) than in week 8 (0.13 ±0.04%) or week 14 (0.15 ± 0.05%). There was a significant interaction between week and ammonia on the duration of play (Figure 3; week*ammonia: F 2, 29 = 3.71, P = 0.04). This interaction was characterised by the observation that in week 3 the pigs exposed to ∼20 ppm of ammonia spent less time playing than pigs in the non-ammoniated rooms (LSM: P = 0.03), whereas there was no difference in the time invested in play behaviour between pigs in these treatments in either week 8 (LS means: P = 0.74) or week 14 (LS means: P = 0.31). There were no significant effects of any of the other factors tested on the amount of play behaviour observed.
Mean percentage of time (+s.e.) pigs engaged in play during behavioural observation in rooms with low ammonia (grey bars) or high ammonia (black bars). n rooms = 8 per treatment group.

Discussion
This experiment tested the individual and combined effects of atmospheric ammonia, light intensity and mechanical noise on the HPA axis, production and play behaviour of pigs throughout their growth period of 15 weeks. To our knowledge, this is the only experiment in which the physiological, production and behavioural responses of any farm animal to these environmental stressors have been concurrently measured over such a long period. The timescale of this experiment is of value as it reflects the period over which pigs are likely to experience these conditions in a typical commercial environment. Of the stressors tested, ammonia exposure over 15 weeks had the most pronounced effect. Pigs exposed to ∼20 ppm of ammonia had lower salivary cortisol, slightly larger adrenal cortices and spent less time playing, particularly during the start of the experiment, than controls.
Taken together, these measures of the HPA axis are suggestive of an early response to atmospheric ammonia, as a sustained period of HPA axis activation can lead to cortical hypertrophy and hyperplasia as well as downregulation of cortisol production through negative feedback (Clark et al., Reference Clark, Cowan and Pfeiffer2006; Ulrich-Lai et al., Reference Ulrich-Lai, Figueiredo, Ostrander, Choi, Engeland and Herman2006; Miller et al., Reference Miller, Chen and Zhou2007). This is corroborated by the finding that the larger the pigs’ adrenal cortices were, the lower their salivary cortisol levels tended to be. Sutherland et al. (Reference Sutherland, Niekamp, Rodriguez-Zas and Salak-Johnson2006) found that 7-week-old pigs exposed to multiple concurrent stressors (mixing, crowding and heat stress of 33 ± 5°C) for 14 days had significantly lower plasma cortisol concentrations when measured at both 7 and 14 days after the onset of these conditions. Lower salivary cortisol levels are often observed under conditions of chronic stress and can be attributed to the dynamics of the HPA response; cortisol levels are elevated shortly after the axis is activated, but eventually a counter-regulatory response can lead to circulating cortisol concentrations below that of pre-stress levels (Miller et al., Reference Miller, Chen and Zhou2007). It would have been interesting to confirm this explanation by measuring salivary cortisol at the very start of the experimental period. However, it was not possible in this experiment to collect sufficient saliva from the pigs when they were so young. In our study of social behaviour in the same experiment (Parker et al., submitted), it was found that while activity overall did not differ across treatments, a greater proportion of the social interactions between pigs exposed to ammonia were agonistic in the 1st week of the experiment compared to control animals. This difference was not observed in subsequent weeks, supporting the suggestion that the pigs initially responded to ammonia as a stressor, but that this effect ameliorated over time.
The crude test of stress responsiveness did not provide any evidence that the reactivity of the HPA axis of the pigs was affected by being housed under conditions of high ammonia. However, stress-related alterations in the responsiveness of the HPA axis cannot be fully ruled out as differences in key aspects of the HPA response can occur without necessarily altering overall cortisol production, for example, cortisol concentration in response to a stressor could be the same in pigs that produced more or less ACTH if they had different adrenocortical sensitivity to circulating ACTH (Janssens et al., Reference Janssens, Helmond, Loyens, Schouten and Wiegant1995). There was no evidence from any of the production measures that ammonia had an impact on the commercial performance of these pigs. Therefore, although the HPA axis of pigs may have been initially activated in response to ammonia, there was little evidence of a longer term biological cost of this response, implying that the pigs successfully habituated to these environmental conditions.
Korte et al. (Reference Korte, Olivier and Koolhaas2007) proposed a concept of animal welfare based around allostasis, that is, stability through change, which considered an animal’s ability to successfully adapt to their surroundings an important indicator of their well-being. By this definition, the finding that the pigs showed some HPA axis activation in response to high concentrations of ammonia would not be considered as evidence of compromised welfare. In fact, it may be argued that they coped well with this challenge as they were not pushed beyond the limits of allostasis. However, an animal’s welfare state is likely to be determined by more than their ability to physiologically adapt, and therefore it is important to consider other evidence. The pigs were less playful in the ammoniated rooms at the start of the experimental period, but exhibited similar levels of play to the control pigs in weeks 8 and 14. However, overall levels of play were much lower in weeks 8 and 14 than week 3 generally. This suggests that play may be a useful behavioural measure of stress of young pigs, but may become less sensitive as the pigs get older and play less (Hötzel et al., Reference Hötzel, Lopez, de Oliveira and Guidoni2009). The negative effect of ammonia on play at the start of the experiment is in line with the finding that differences in the aggressive behaviour of the pigs in the HA and LA rooms were most pronounced at the start of the experiment (Parker et al., submitted).
Our findings are in contrast to those of several previous studies that found ammonia to have a detrimental effect on the physiological status of pigs, both in terms of growth and the HPA axis (Stombaugh et al., Reference Stombaugh, Teague and Roller1969; Drummond et al., Reference Drummond, Curtis, Simon and Norton1980; von Borell et al., Reference von Borell, Özpinar, Eslinger, Schnitz, AZhao and Mitloehner2007). However, as previously mentioned, these studies tested the effects of much higher concentrations of ammonia (e.g. 35 to 150 ppm) than most growing pigs would typically encounter and the duration of exposure was shorter than tested here. In fact, other experiments that investigated the effects of more commercially realistic concentrations of ammonia (∼20 ppm) have generally found little or no observable effect on the growth, health or general stress physiology of pigs (Gustin et al., Reference Gustin, Urbain, Prouvost and Ansay1994; Wathes et al., Reference Wathes, Demmers, Teer, White, Taylor, Bland, Jones, Armstrong, Gresham, Hartung, Chennells and Done2004; Done et al., Reference Done, Chennells, Gresham, Williamson, Hunt, Taylor, Bland, Jones, Armstrong, White, Demmers, Teer and Wathes2005).
There was a trend for light intensity to influence ammonia response: the pigs in the rooms with HL did not appear to have lower salivary cortisol in the HA rooms as compared to the LA rooms. Therefore, it seems that brighter light ameliorated this aspect of the pigs’ HPA response to ammonia. Parker et al. (submitted) found that the pigs kept in LL intensity exhibited more reciprocal aggression (i.e. aggressive response to an aggressive act) in ammoniated environments compared with controls. This suggests less social tolerance within groups housed in ammoniated, LL conditions. However, it is not clear whether this resulted directly from environmental stress or whether the environment influenced social stress, for example, through interference with the transmission of social cues, which was expressed in this context (see Parker et al., for further discussion). Therefore, LL intensity appeared to influence the effects of ammonia on aspects of both behaviour and physiology, which could have important implications for pig husbandry. There was also a trend for pigs housed in bright light to have larger adrenal cortices than controls. As there was no evidence from the other stress indicators to suggest that pigs in the HL rooms found these conditions challenging, this may reflect non-stress related differences in the physiology of pigs housed under high or LL intensity.
There was an interaction between the effects of ammonia and noise on the (crude) measures of health; individuals in rooms with HN and LA had a lower incidence of nasal/ocular discharge than any of the other pigs. As the pigs in rooms with LN and/or HA had similar scores for nasal/ocular discharge, it may be that both ammonia and some aspect of the pigs’ behaviour, which is performed more under low noise, can lead to nasal/ocular discharge. If any such behaviour was reduced in the HN rooms, this could explain why the pigs in non-ammoniated rooms with HN developed less nasal/ocular discharge. Although Parker et al. did not observe any difference in overall activity of the pigs, a qualitative difference in behaviour, such as less vigorous rooting under high noise, could have led to the observed interaction between the influence of ammonia and noise on the occurrence of nasal/ocular discharge. Overall, there was no evidence that continuous exposure to a noise level of ∼80 dB (A) alone adversely impacted upon the pigs. It may be that the pigs quickly habituated to the HN treatment. Therefore, while intermittent loud noise is known to cause stress to growing pigs (Otten et al., Reference Otten, Kanitz, Puppe, Tuchscherer, Brüssow, Nürnberg and Stabenow2004; Kanitz et al., Reference Kanitz, Otten and Tuchscherer2005), continuous exposure to mechanical noise within the limits of EU regulations does not appear to represent a significant stressor.
There was a significant difference between the two batches of pigs in terms of their commercial performance; the pigs in batch two gained more weight overall, but had lower food conversion efficiency and smaller P2s than the pigs in batch one. It is hard to say exactly where these differences arose from as these pigs represented a different cohort of animals, albeit from the same source and genetic stock. After controlling for batch differences, none of the treatment conditions tested had a measurable effect on any of the production parameters measured. This is perhaps unsurprising given that commercial pig breeds have been selected to perform well in environments typical of intensive husbandry.
Play was included in the current experiment as it is thought to have a generally inverse relationship with stress (Muller-Schwarze et al., Reference Muller-Schwarze, Stagge and Muller-Schwarze1982; Siviy and Panksepp, Reference Siviy and Panksepp1985; Siviy and Atrens, Reference Siviy and Atrens1992). It has been proposed that play indicates that the basic needs of the animal are met and its performance is intrinsically rewarding activity (Vanderschuren et al., Reference Vanderschuren, Niesink and Ree1997; Boissy et al., Reference Boissy, Manteuffel, Jensen, Moe, Spruijt, Keeling, Winckler, Forkman, Dimitrov, Langbein, Bakken, Veissier and Aubert2007). Therefore, play could be viewed as a behavioural indicator of stress in this context. Ammonia had the most notable effect on play behaviour in this study with the pigs in the ammoniated rooms investing less time in play at the start of the trial. However, no difference in this behaviour was observed later in the study when the overall levels of play were low. As previously mentioned, this indicates that play may be most useful as a stress indicator when pigs are young and tend to play more (Hötzel et al., Reference Hötzel, Lopez, de Oliveira and Guidoni2009).
In conclusion, there was evidence from this experiment that continuous exposure to ∼20 ppm of ammonia causes some degree of physiological challenge to growing pigs and that this may have a detrimental impact on positive behavioural experiences. Given a free choice, pigs actively avoid ammonia concentrations as low as 10 ppm (Jones et al., Reference Jones, Burgess, Webster and Wathes1996). Furthermore, HN and LL intensity appeared to exacerbate some of the negative effects of ammonia. However, the overall effects of ammonia, LL and HN were not as pronounced as expected from previous smaller scale studies. Although there was no evidence of high ammonia, LL and HN having an effect on any of the production parameters tested, this does not necessarily indicate that pigs were unchallenged by these conditions as production levels are poor indicators of pig welfare.
Within current legal limits, the physical stressors tested here had no discernible effects on production performance. However, there was evidence that 20 ppm atmospheric ammonia may have an adverse influence on the well-being of growing pigs. Moreover, chronic exposure to ammonia and dim light compromised the social behaviour of the pigs in this study (Parker et al., submitted). It is important to note that in this study all other aspects of the pigs’ husbandry, such as environmental temperature and nutrition, were exemplary. Therefore, it is possible that greater effects of the conditions tested could occur if other aspects of the pigs’ environment are sub-optimal.
Acknowledgements
This work was funded by BBSRC. We would like to thank Professor D. C. Wathes and Dr Z. Cheng for their advice on laboratory techniques, as well as numerous members of the Centre for Animal Welfare, RVC for assistance with tissue collection at the abattoir. We are also grateful to staff at the RVC Biological Services Unit for animal husbandry as well as PIC and their associated farms for their help with preparing for this study.