INTRODUCTION
The delineation of site-specific management zones can play an important role in addressing the spatial variability effects by defining homogenous sub-field areas within an entire field. Defining the sub-field areas is difficult due to complex interactions between many factors such as climate, topography and soil properties (Buttafuoco et al. Reference Buttafuoco, Castrignano, Colecchia and Ricca2010; Moral et al. Reference Moral, Terron and Rebollo2011). In some cases, interaction between these factors induces spatial variability and affects crop yield (Bakhsh et al. Reference Bakhsh, Jaynes, Colvin and Kanwar2000; Mzuku et al. Reference Mzuku, Khosla, Reich, Inman, Smith and Macdonald2005; Bakhsh & Kanwar Reference Bakhsh and Kanwar2008). Several studies have reported variations in crop yield as a result of spatial variability effects within a field (Jaynes & Colvin Reference Jaynes and Colvin1997; Mulla & Schepers Reference Mulla, Schepers, Pierce and Sadler1997; Piotrowska et al. Reference Piotrowska, Dlugosz, Namysłowska-Wilczyńska and Zamorski2011). Although spatial variability is a natural phenomenon, efforts are under way to manage such factors by studying spatial relationships among landscape attributes and with yield patterns. Many researchers have also reported that spatial variation can be controlled and overcome by delineating site-specific management zones, each with similar crop response and nutrient potential. The zoning strategy can avoid the problems of over-application of inputs in areas where they are not needed and under-application where they are needed (Cahn et al. Reference Cahn, Hummel and Brouer1994; Ferguson et al. Reference Ferguson, Hergert, Schepers, Gotway, Cahoon and Peterson2002; Li et al. Reference Li, Pan and Ma2007a, Reference Li, Shi, Li and Lib).
A number of studies have been conducted to delineate sub-areas within fields for site-specific application of inputs using soil and landscape attributes (Fleming et al. Reference Fleming, Heermann and Westfall2004; Orteqa & Santibanez Reference Orteqa and Santibanez2007; Jiang et al. Reference Jiang, Liu, Liu, Li, Wang, Yang and Hu2012). Fleming et al. (Reference Fleming, Heermann and Westfall2004) utilized a farmer's experience in combination with aerial photos to define areas of similar soil properties. Soil zones based on topography have also been used for developing management zones (Franzen et al. Reference Franzen, Halvorson, Hoffman, Robert, Rust and Larson2000). Some researchers have used elevation and other topographic attributes, i.e. spatial data, to delineate management zones (Schepers et al. Reference Schepers, Shanahan, Liebig, Schepers, Johnson and Luchiari2004; Kitchen et al. Reference Kitchen, Sudduth, Myers, Drummond and Hong2005; Orteqa & Santibanez Reference Orteqa and Santibanez2007; Jiang et al. Reference Jiang, Liu, Liu, Li, Wang, Yang and Hu2012). Abdul et al. (Reference Abdul, Kah, Tee and Osumanu2007) found that management zones based on soil nitrogen provided useful information for site-specific application of nitrogen fertilizer. Soil electrical conductivity (EC) has also been used to delineate management zones and to investigate yield variability within management zones (Bansod et al. Reference Bansod, Pandey and Rajesh2012).
In the past decade, many researchers have used different methods to delineate semi homogenous zones within fields. The cluster analysis procedure in site-specific crop management (SSCM) application has been used to identify sub-areas within a field, which have homogenous soil and landscape properties (Fraisse et al. Reference Fraisse, Sudduth and Kitchen2001). Kitchen et al. (Reference Kitchen, Sudduth, Drummond and Franzen1998) compared traditional soil survey maps and map overlay approaches to delineate management zones based on top-soil depth and elevation. Wang et al. (Reference Wang, Liu, Hu, Wang and Liu2009) used the values of principal components of six soil properties to identify management zones. Many studies have shown the use of unsupervised clustering algorithms in geographic information systems (GIS) for grouping similar areas in a field (Abdul et al. Reference Abdul, Kah, Tee and Osumanu2007; Li et al. Reference Li, Pan and Ma2007a, Reference Li, Shi, Li and Lib; Zhao et al. Reference Zhao, Xue, Yang, Huang and Zhang2012; Jiang et al. Reference Jiang, Liu, Liu, Li, Wang, Yang and Hu2012).
One very common approach is the use of Management Zone Analyst (MZA V0·1) software to delineate management zones for site-specific applications of inputs (Fridgen et al. Reference Fridgen, Kitchen, Sudduth, Drummond, Wiebold and Fraisse2004; Jiang et al. Reference Jiang, Fu and Wang2011). The MZA software provides a systematic procedure for delineating management zones and provides options to determine how many management zones are suitable for a given field. It also has the ability to test and evaluate the results based on yield data (Fridgen et al. Reference Fridgen, Kitchen, Sudduth, Drummond, Wiebold and Fraisse2004). Similarly, the artificial neural network (ANN) approach can also be used to find the most influential parameters affecting wheat yield, which can be used as input variables in MZA software for delineating management zones for precision agriculture. Keeping in view the research work referred to above, no study has been conducted so far to identify the parameters affecting wheat yield using an ANN approach and their use as input to MZA software for delineating and evaluating management zones.
MATERIALS AND METHODS
Study area
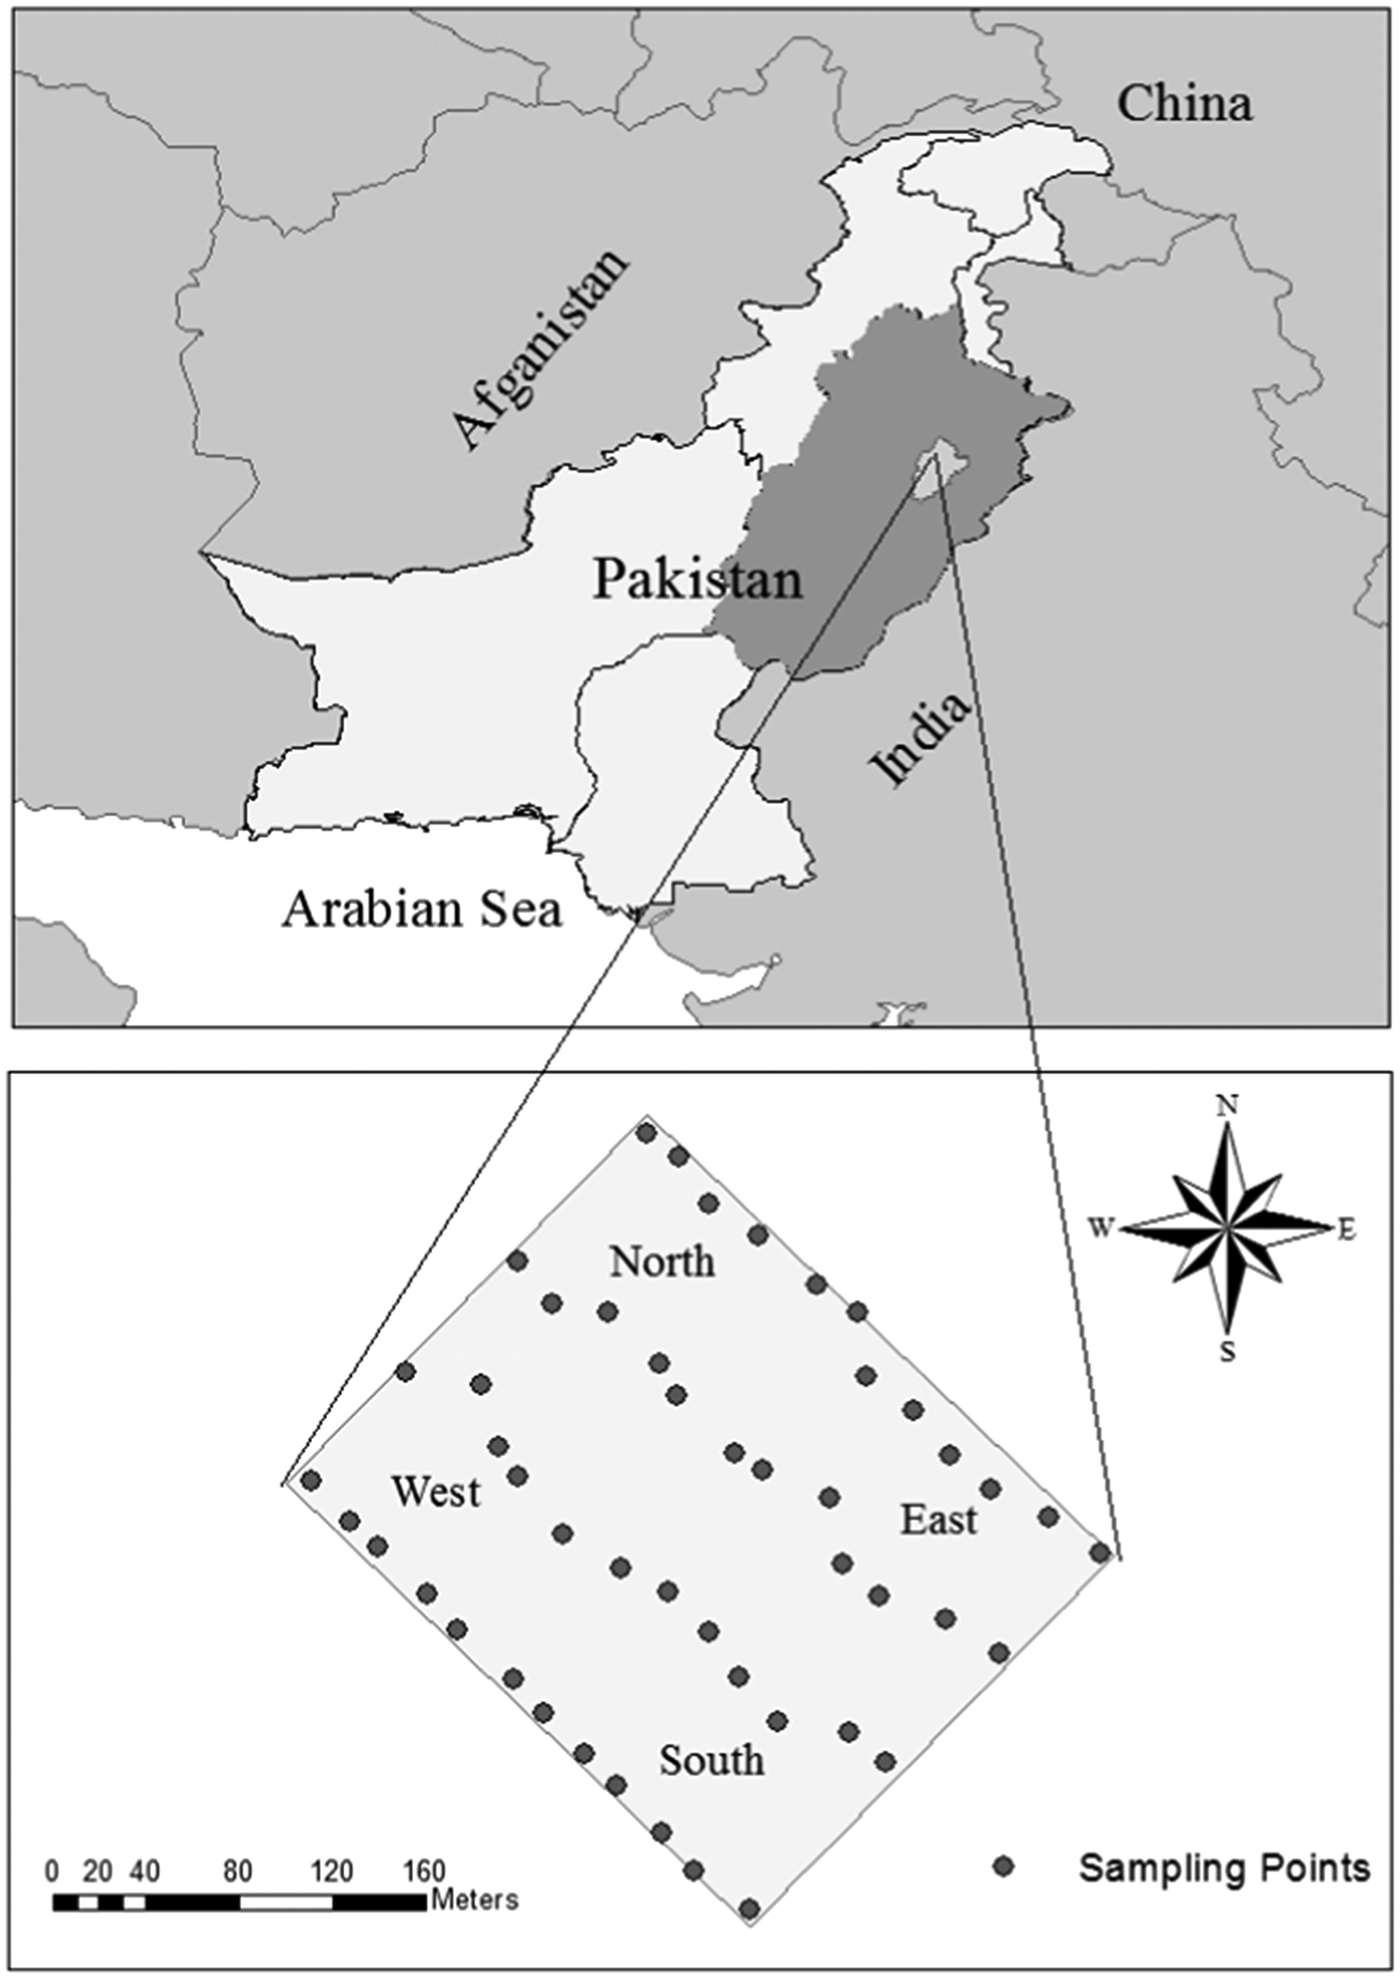
Field experiments were conducted at the Postgraduate Agricultural Research Station (PARS) of the University of Agriculture, Faisalabad, Pakistan, during the wheat growing seasons of 2008/09, 2009/10 and 2010/11 (Fig. 1). The field has been traditionally under wheat cultivation (single crop per year) over many years and the study area is a part of the Indus Plain (73° 02′ E, 31° 23′ N, 185·9 m a.s.l.). It consists of alluvial deposits brought by the Indus River and its tributaries, originating in the Himalayas and the soils are predominantly medium to moderately coarse. Temperatures in the study area range from maximum daily summer temperatures of c. 48°C and winter minimum daily temperature of c. 4·8°C. The average normal precipitation at the study area is c. 386 mm (Ministry of Food, Agriculture and Livestock 2010).
Location of the study area.

Figure 1 shows the location of sampling points in an 8-ha experimental field. The elevation survey of the field was conducted at 48 points, following a regular grid of 24 × 67 m in size using a Sokkia C330 Optical Surveying Dumpy Level (Sokkia TopconCo., Ltd., Tokyo, Japan). The 48 soil samples were collected from the top 300 mm of soil from regular grids of 24 × 67 m in size using an Iwan-Type, T-Handled auger prior to the sowing of wheat. The soil samples were sent to the Soil Salinity and Water Testing Laboratory, Ayub Agricultural Research Institute, Faisalabad, for determining % sand, % silt, % clay, soil EC, pH, soil nitrogen (N) and soil phosphorus (P) contents. Based on textural analysis, the soil of the study area fell into five classes, i.e. clay loam, clayey, sandy clay loam, sandy loam and silty clay loam.
Management practices and yield data
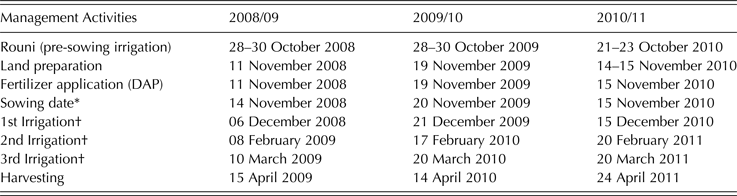
Wheat was grown in the field during the 2008/09, 2009/10 and 2010/11 growing seasons. A disc plough and a tine cultivator were used for primary and secondary tillage operations, respectively. A conventional seed drill was used for sowing wheat in rows spaced at 150 mm. Weeds were controlled using herbicides: crop management activities are provided in Table 1.
Schedule of management activities performed during the study period

* Seed of wheat, AS-2002 variety, was applied at the rate of 125 kg/ha at row to row spacing of 150 mm.
† Urea fertilizer treatments as given below were applied just prior to irrigation on the same day.
A Randomized Complete Block Design (RCBD) was used for the experiment. The field was divided into four blocks, each containing 12 experimental plots: all treatments were completely randomized within each block. The size of each experimental plot was 24 × 67 m. Different urea fertilizer treatments were designed based on the dose recommended by the Punjab Agriculture Department, Pakistan (120 kg urea/ha) to determine the level of urea fertilizer applications for maximizing wheat grain yield. The fertilizer treatments varied from year to year depending upon the response of the treatments. The fertilizer treatments applied were: T1 = 173, T2 = 123, T3 = 74 kg of urea/ha in single application with 1st irrigation and T4 = control, no urea fertilizer during the growing season of 2008/09. For growing season 2009/10, the four treatments T1 to T4 of 2008/09 were repeated, with additional treatments of T5 = 173, T6 = 123, T7 = 99, T8 = 296, T9 = 247, T10 = 198 kg urea/ha in three equal split applications with 1st, 2nd and 3rd irrigations, T11 = Humic Acid at 2·47 litre/ha and (T12) = Humic Acid at 4·94 litre/ha with 1st irrigation. Similarly, the four treatments T1 to T4 of 2008/09 and 2009/10 were repeated for growing season 2010/11 with additional treatments of T5 = variable rate of urea fertilizer application and T6 = 247 kg urea/ha in three split applications with 1st, 2nd and 3rd irrigations.
At maturity, wheat was harvested manually and yield samples collected from three 1-m2 areas per plot, along with their position data using a Global Positioning System receiver (Garmin, GPS60). An average of the three harvested samples was considered as the mean yield of each experimental plot. Therefore, a total of 48 yield samples were collected in each year. The yield samples were threshed manually and wheat grain per unit area determined (Farid et al. Reference Farid, Bakhsh, Ahmad, Ahmad and Farooq2013). The measured grain yield data was used to evaluate the delineated site-specific management zones.
Artificial neural network approach
An ANN approach was used to determine the important parameters for delineating management zones within the field. The nine parameters (soil EC, pH, soil nitrogen, soil phosphorus, % by volume of sand, silt and clay, elevation and applied urea fertilizer) were subjected to ANN as input variables with 3 years’ of grain yield data as output variable. From the 148 data points of 3 years’ data, 124 were randomly selected for training and the remaining 20 data points used for ANN model evaluation (Saltan & Terzi Reference Saltan and Terzi2005). The number of neurons per input layer (nine), number of hidden layers (three), number of neurons per hidden layer (three), number of neurons per output layer (one), learning rate (0·8), momentum rate (0·3), maximum epoch (200) and stopping error (0·01) were determined by varying different combinations of network parameters (Ji et al. Reference Ji, Sun, Yang and Wan2007, Farooq Reference Farooq2010). The performance of the ANN model was checked using randomly selected datasets of 20 values, which showed a mean absolute error of 9·48%.
Cross validation k-fold techniques (i.e. the data were equally divided into k equal parts) were used to determine the most influential parameters affecting wheat grain yield. Subsequently, k iterations of training and validation were performed such that different numbers of data points were used for validation in each iteration, while the remaining k−1 was used for learning. The data were 10% (k = 10) cross-validated including nine input parameters. Thereafter, the mean absolute error was determined for each individual parameter. The mean absolute errors were compared with original mean absolute error (9·48%) to determine the influence level of each parameter. The ANN technique for identifying the most important parameters has been used by many other researchers (Haddad et al. Reference Haddad, Hagel, Mdeiwayeh, Natowitz, Wada, Xiao, David, Freslier and Aichelin1997; Noble & Tribou Reference Noble and Tribou2007; Farooq Reference Farooq2010; Lashin & Din Reference Lashin and Din2013). During ANN analysis, the soil and landscape attributes of % sand, % clay, elevation, soil nitrogen and soil EC were selected for delineating management zones based on their order of influence and spatial distribution in the field.
Removal of fertilizer treatment effects
The present study aimed to establish cause and effect relationships between landscape attributes and crop yield and to delineate management zones. Although fertilizer treatments were applied, their effects were significant at P ≤ 0·05, which might have suppressed the inherent spatial variability potential of the soil for wheat yield. Similarly, during ANN analysis, fertilizer treatment also influenced wheat grain yield. Since the objective was to delineate site-specific management zones for precision farming practices to overcome spatial variability effects on wheat grain yield, it was therefore necessary to remove the treatment effects because of their highly significant effects on wheat grain yield in each of the 3 years. Therefore, wheat grain yield data for all 3 years was normalized on a treatment basis to remove the effects of fertilizer treatments. An approach proposed by Jaynes & Hunsaker (Reference Jaynes and Hunsaker1989) was used for normalizing the yield data. Many researchers have also used the same approach for data normalization and to remove treatment effects (Colvin et al. Reference Colvin, Jaynes, Karlen, Laird and Ambuel1997; Jaynes et al. Reference Jaynes, Colvin and Kaspar2005; Bakhsh et al. Reference Bakhsh, Kanwar and Malone2007; Farid et al. Reference Farid, Bakhsh, Ahmad, Ahmad and Farooq2013). The normalized grain yield data were used for subsequent analysis, to prepare GIS data layers for spatial analysis and to delineate site-specific management zones using MZA software.
Management Zone Analyst software
The MZA software has options to calculate descriptive statistics and to delineate site-specific management zones using the fuzzy-c mean unsupervised classification algorithm. The performance of the cluster analysis was evaluated to determine the optimum number of clusters. The MZA program works with comma-delimited American Standard Code for Information Interchange (ASCII) text files to maximize its ability to be used with other software. This type of text file can be exported easily from database, graphics, spreadsheet or GIS software and any type of quantitative data can be used in MZA software. The analysis performed using MZA software can be tested with as many as 20 variables and 36 000 observations. Sources of data can include soil chemical and physical properties, soil fertility, crop yield data and remotely sensed data (Fridgen et al. Reference Fridgen, Kitchen, Sudduth, Drummond, Wiebold and Fraisse2004).
Delineation of site-specific management zones
The MZA software V1·0 was used to identify naturally occurring clusters. The MZA software can determine spatial variability to categorize soil and landscape attribute data into homogenous groups and to determine the appropriate number of management zones within the field (Fridgen et al. Reference Fridgen, Kitchen, Sudduth, Drummond, Wiebold and Fraisse2004). In the present study, % sand, % clay, elevation, soil nitrogen and soil EC were used as input variables to MZA software because during ANN analysis, these variables were found to be most influential for wheat grain yield variability. The Mahalanobis distance method was used to measure similarities of the multivariate clusters because the method has been recommended by other researchers for soil and landscape attribute data (Odeh et al. Reference Odeh, McBratney and Chittleborough1992; Fridgen et al. Reference Fridgen, Kitchen, Sudduth, Drummond, Wiebold and Fraisse2004). The settings used during analysis were as follows: fuzziness exponent = 1·3, maximum number of iterations = 300, convergence criterions = 0·0001, minimum number of zones = 2 and maximum number of zones = 6. Using values of input variables (% sand, % clay, elevation, soil nitrogen and soil EC) and the coordinate's data, the MZA software determined the appropriate number of management zones within a scheme as well as assigning data points to the management zones of that scheme.
The results of the clustering process were exported from the MZA software and saved into a new text file as an output. The output file was similar to the input file, with appended columns of delineated management zone schemes from three to six within the field. The output file was imported into the mapping program (ArcGIS v9·3). Management zone schemes were prepared for three, four, five and six management zones using the cluster data generated by the MZA software. The ArcGIS Spatial Analyst Tool was used to delineate the management zone schemes. A spatial interpolation technique of ordinary kriging was used to generalize point data. The kriging interpolation technique assumed that distance and direction between samples reflected a point's spatial correlation and can be used to explain variation in the surface. A similar approach has been recommended and used by different researchers (Tran & Nguyen Reference Tran and Nguyen2008; Bakhsh et al. Reference Bakhsh, Kanwar and Malone2007). Tran & Nguyen (Reference Tran and Nguyen2008) compared several interpolation techniques and recommended the kriging technique for flat areas. Using ordinary kriging, the best fit spherical model was selected based on the model fitness to the data and the generalized data layer was converted to polygon coverage. Using a manual classification technique, polygon data layers were classified into three, four, five and six management zone schemes based on boundaries defined using the MZA software during cluster analysis. Similarly, % sand, % clay, elevation, soil nitrogen and soil EC coverage for the whole field were prepared with ArcGIS v9·3, using an ordinary kriging interpolation technique to check the status of soil and landscape attributes within the management zones of each scheme.
Determining optimum management zone scheme
The optimum management zone scheme was determined and evaluated using fuzziness performance index (FPI) and normalized classification entropy (NCE). Different researchers have used FPI and NCE provided by MZA software to determine the optimum management zone scheme and to evaluate performance of the scheme (Odeh et al. Reference Odeh, McBratney and Chittleborough1992; Lark & Stafford Reference Lark and Stafford1997; Boydell & McBratney Reference Boydell, McBratney and Stafford1999; Fraisse et al. Reference Fraisse, Sudduth and Kitchen2001; Fridgen et al. Reference Fridgen, Kitchen, Sudduth, Drummond, Wiebold and Fraisse2004). The two performance indices were exported in graphical form from MZA software to decide the number of clusters to be used for delineating management zone schemes within the field (Fraisse et al. Reference Fraisse, Sudduth and Kitchen2001; Fridgen et al. Reference Fridgen, Kitchen, Sudduth, Drummond, Wiebold and Fraisse2004).
Grain yield analysis for management zone scheme
After identifying an appropriate management zone scheme, the 3 years (2008/09 to 2010/11) of normalized grain yield data was used to evaluate overall cluster performance. The average of grain yield data was also calculated for each management zone to compare grain yield variability among the management zones.
RESULTS
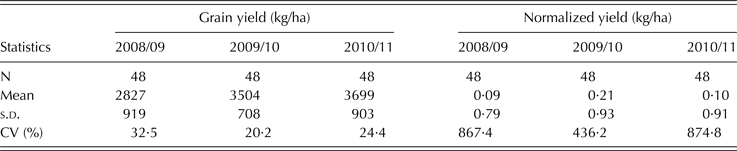
Table 2 shows the means, standard deviation (S.D.) and coefficient of variation (CV) for grain yield and normalized grain yield data collected during the 2008/09, 2009/10 and 2010/11 growing seasons. The CV of grain yield ranged from 20% in 2009/10 to 32·5% in 2008/09, showing temporal variability in wheat grain yield data over the years. Mean wheat grain yield increased in each successive year (Table 2).
Descriptive statistics for raw and normalized grain yield data
N, number of observations; s.d., standard Deviation; CV, coefficient of variation.
Table 3 shows descriptive statistics for soil physical and chemical properties. The CV values for % sand, % clay, soil EC and soil nitrogen were found to be >24%. The smallest CV, 0·09%, was found for elevation, and the highest CV (56·74%) was observed for soil EC, indicating large spatial variability effects.
% Sand, % clay, elevation, soil nitrogen and soil EC within the management zones
SV, semi-variance; CV, coefficient of variation; EC, electrical conductivity.
* Values among the entire field.
Geographic information systems data layers analysis
Figures 2(a)–(e) shows data layers of five soil and landscape attributes, i.e. % sand, % clay, elevation, soil EC and soil nitrogen, which were used as input data for the MZA software because ANN analysis identified these as the most influential attributes affecting wheat yield. The lower values of soil EC, lower soil nitrogen and higher % sand contents were observed in the northern part of the field. The lower soil EC and lower soil nitrogen contents in that part of the field were associated with high infiltration rate and high % sand content. The higher soil EC, higher elevation and medium soil nitrogen contents were found in the eastern part of the field with lower % sand content. The higher soil nitrogen, lower elevation, lower soil EC and medium % sand content were found in the western part of the field. Similarly, the data layer of % clay content showed that higher % clay content in the eastern part of the field were correlated with higher soil EC. The analysis indicated that the five soil and landscape attributes can be used for delineating management zones within a field.
Maps of landscape attributes used as input to MZA software. (a) % sand, (b) elevation, (c) % clay, (d) soil nitrogen and (e) soil EC (colour version available online).
Management zone scheme analysis
Management zone schemes ranging from three to six zones were developed for the study area using MZA software. The soil and landscape attributes of % sand, % clay, elevation, soil nitrogen and soil EC were identified by ANN as being most influential on wheat grain yield, which were used as input variables to MZA software. The delineated management zone schemes (Figs 3–6) were compared with data layers of % sand, % clay, elevation, soil nitrogen and soil EC (Figs 2(a)–(e)). Figure 3 shows the results obtained when the experimental field was classified into a three management zone scheme. The comparison between data layers of soil and landscape attributes (Figs 2(a)–(e)) and the three management zone scheme (Fig. 3) indicated that the three management zone classification scheme roughly followed the soil nitrogen pattern. Management Zone 1 consisted of relatively higher soil nitrogen content in the south-eastern part of the field. Relatively higher and medium soil nitrogen content was found in Management Zone 2 in the south-western part of the field. Management Zone 3 included lower and medium soil nitrogen content and was the only zone to follow the soil EC, % clay and % sand pattern. Lower soil EC, lower % clay and higher % sand content were found in Management Zone 3 in the northern part of the field. The analysis indicated that a three management zone classification scheme was suitable based on soil nitrogen pattern only, while not being closely aligned to the other four soil and landscape attributes for the study area.
Three management zones scheme based on landscape attributes of % sand, % clay, elevation, soil nitrogen and soil EC (colour version available online).
Four management zones scheme based on landscape attributes of % sand, % clay, elevation, soil nitrogen and soil EC (colour version available online).
Five management zones scheme based on landscape attributes of % sand, % clay, elevation, soil nitrogen and soil EC (colour version available online).
Six management zones scheme based on landscape attributes of % sand, % clay, elevation, soil nitrogen and soil EC (colour version available online).
Figure 4 shows the results obtained for classification of the field into a four management zone scheme, using the same soil and landscape attributes as input variables to MZA software. The resulting map of the four management zone scheme followed patterns of the soil and landscape attributes in the field (Figs 2(a)–(e) and 4). Management Zone 1 in the northern part of the field showed higher % sand content of 54%, lower % clay of 27%, lower soil EC of 0·454 dS/m, lower soil nitrogen content of 0·220 g/kg and elevation in the medium range of 185·24–185·48 m. Management Zone 2, in the southern part of the field, showed lower soil EC of 0·427 dS/m, higher soil nitrogen content of 0·295 g/kg, elevation in the medium range of 185·24–185·48 m and 47–52% sand content. Management Zone 3, in the eastern part of the field, showed a relatively higher elevation of 185·80 m, higher soil EC of 0·848 dS/m, soil nitrogen content of 0·309 g/kg, and higher % clay of 35% and lower % sand of 37% content. Similarly, Management Zone 4 in the western part of the field had relatively lower elevation of 185·00 m, higher soil nitrogen content of 0·340 g/kg, lower soil EC of 0·584 dS/m and medium range of 43–52% sand content (Table 3). The analysis indicated that a four management zone scheme closely followed the spatial distribution of the soil and landscape attributes.
Figure 5 shows the five management zone scheme. The comparison between GIS coverage from Figs 2(a)–(e) and the five management zone scheme (Fig. 5) indicated that Management Zone 1 consisted of a very small area and did not show any trend with the landscape attributes used, while some part of Management Zone 2 in the eastern part of the field followed the higher soil EC values, lower % sand content and higher elevation pattern. Management Zone 3 did not follow the pattern of landscape attributes, while Management Zones 4 and 5 seemed to follow the soil EC, soil nitrogen, elevation and % sand patterns (Figs 2(a)–(e) and 5). Therefore, the five management zone scheme was not suitable for the experimental field because the management zones did not follow spatial pattern of the soil and landscape attributes.
Figure 6 shows the six management zone classification scheme using the same five soil and landscape attributes, which indicated an irregular pattern of the parameters within each management zone. The spatial resemblance between landscape attributes (Figs 2(a)–(e)) and the six management zone scheme (Fig. 6) showed that this scheme was not appropriate for the experimental field. The analysis also showed that the four management zone scheme was more suitable for the experimental field used, because the management zones followed the spatial pattern of the attributes identified by ANN.
Verification of management zones scheme
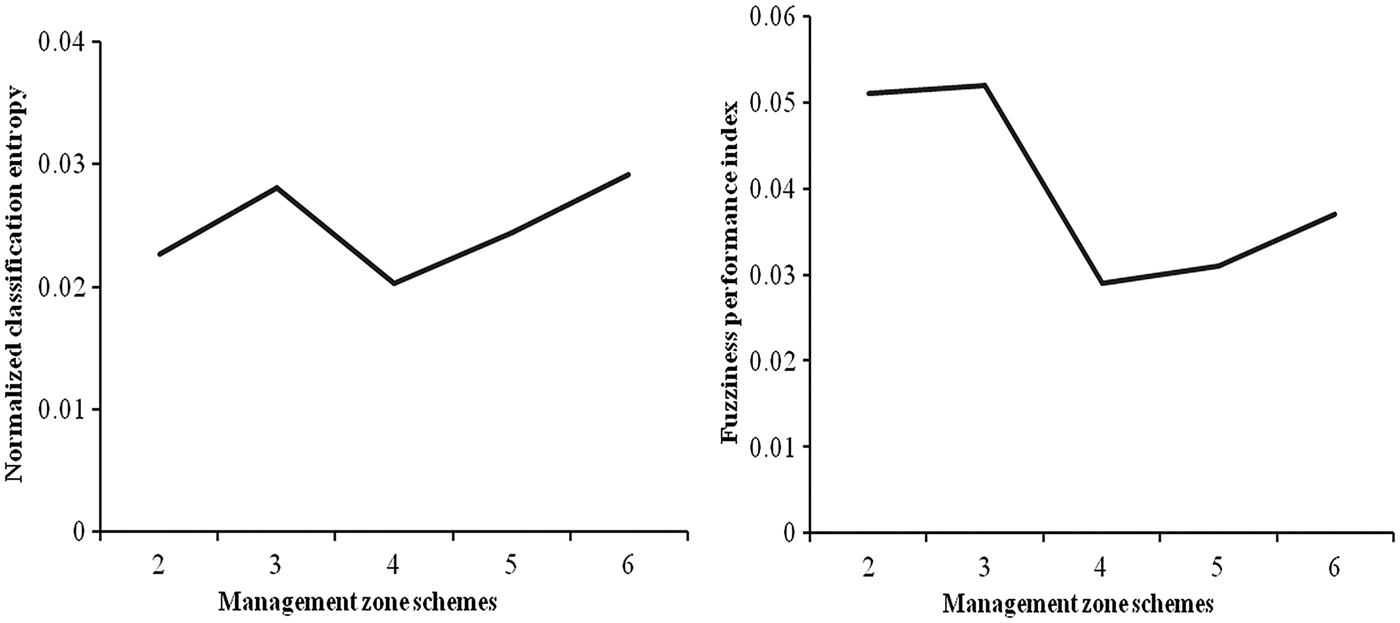
Figure 7 shows the graphical relationship of FPI and NCE against the management zone schemes. The FPI showed poor segregation for the three management zone scheme and also large amounts of membership sharing. The NCE showed much disorganization of the data for three management zone scheme. Both performance indices (FPI and NCE) attained a minimum value for the four management zone scheme (Fig. 7). The FPI remained relatively unchanged up to the five management zone classification scheme, but increased with an increase in the number of management zones above five, also showing increases in membership sharing (Fig. 7). The NCE values also increased with increasing numbers of management zones above four, confirming the appropriateness of the four management zone scheme.
FPI and NCE as determined by MZA software based on landscape attributes of % sand, % clay, elevation, soil nitrogen and soil EC.
Evaluation of management zones
Table 3 shows the mean, CV and semi-variance (SV) values of % sand, % clay, elevation, soil nitrogen and soil EC for each management zone to estimate spatial variability within four management zones scheme. The CV values of the soil and landscape attributes decreased for the four delineated management zone scheme when compared with CV values for the entire field (Table 3). The CV values of soil EC decreased from 56·74% for the entire field to 17·77% within the four management zone scheme. Similarly, CV values of elevation and soil nitrogen also decreased from 0·094 m and 24·25% to 0·022 m and 18·21%, respectively. However, the CV value for % sand was more in Management Zone 3 and CV value for % clay was higher in Management Zone 1 than that of the entire field.
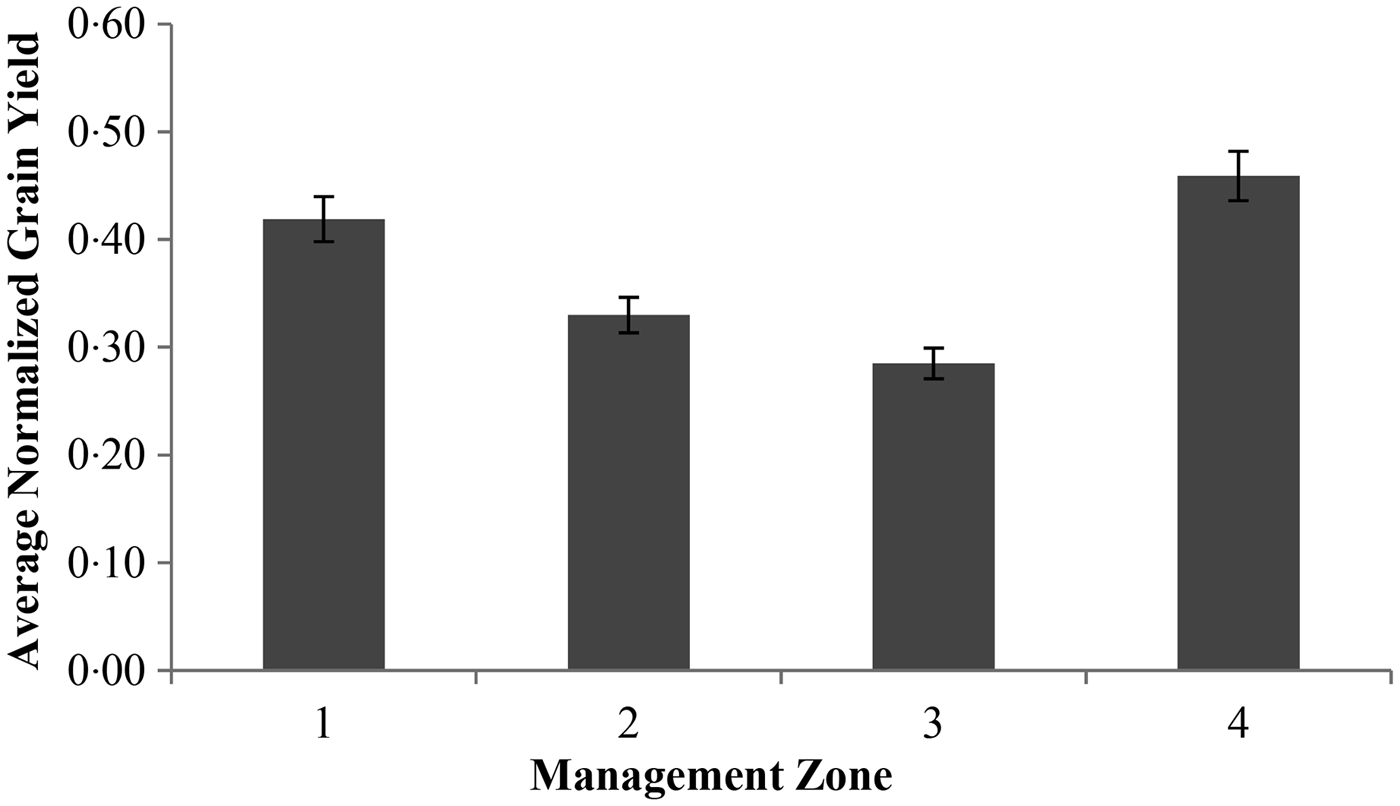
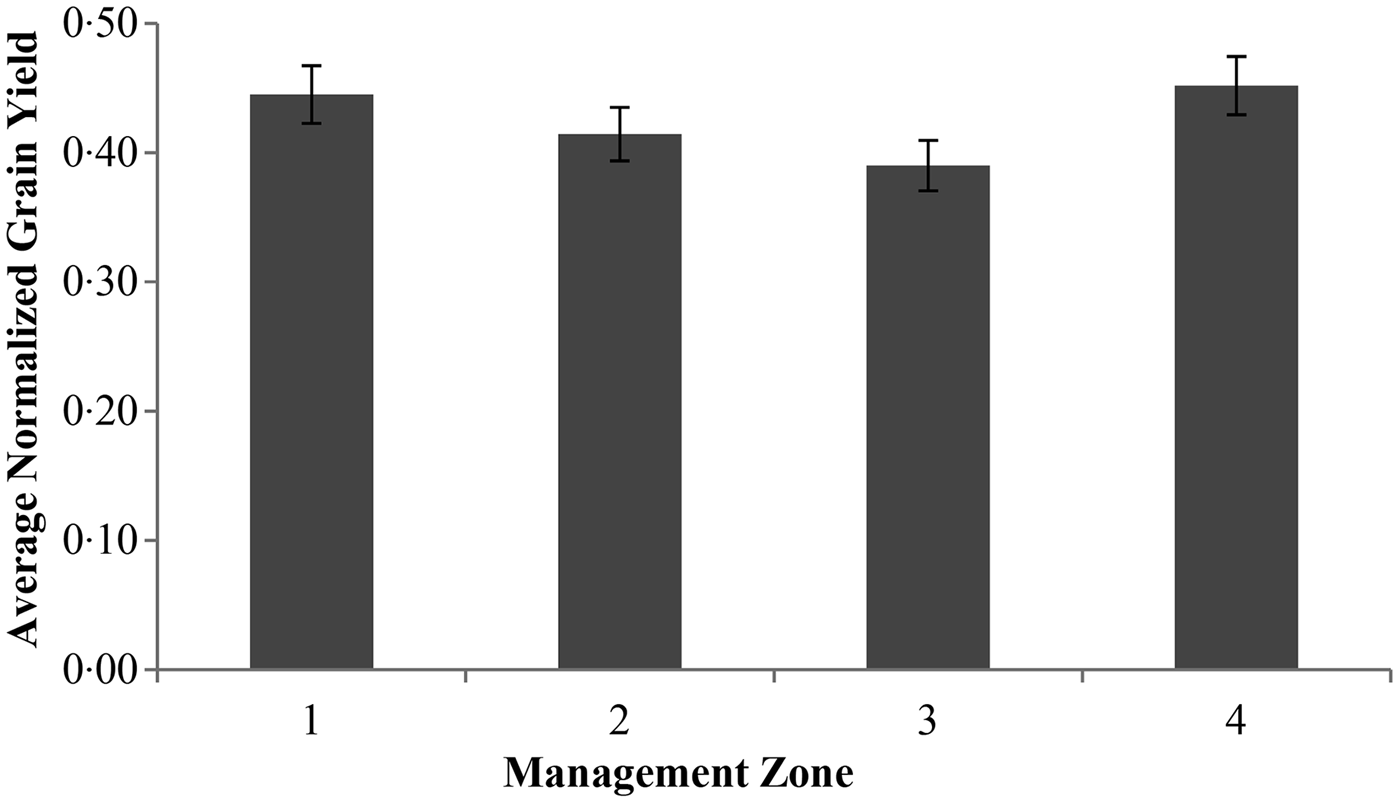
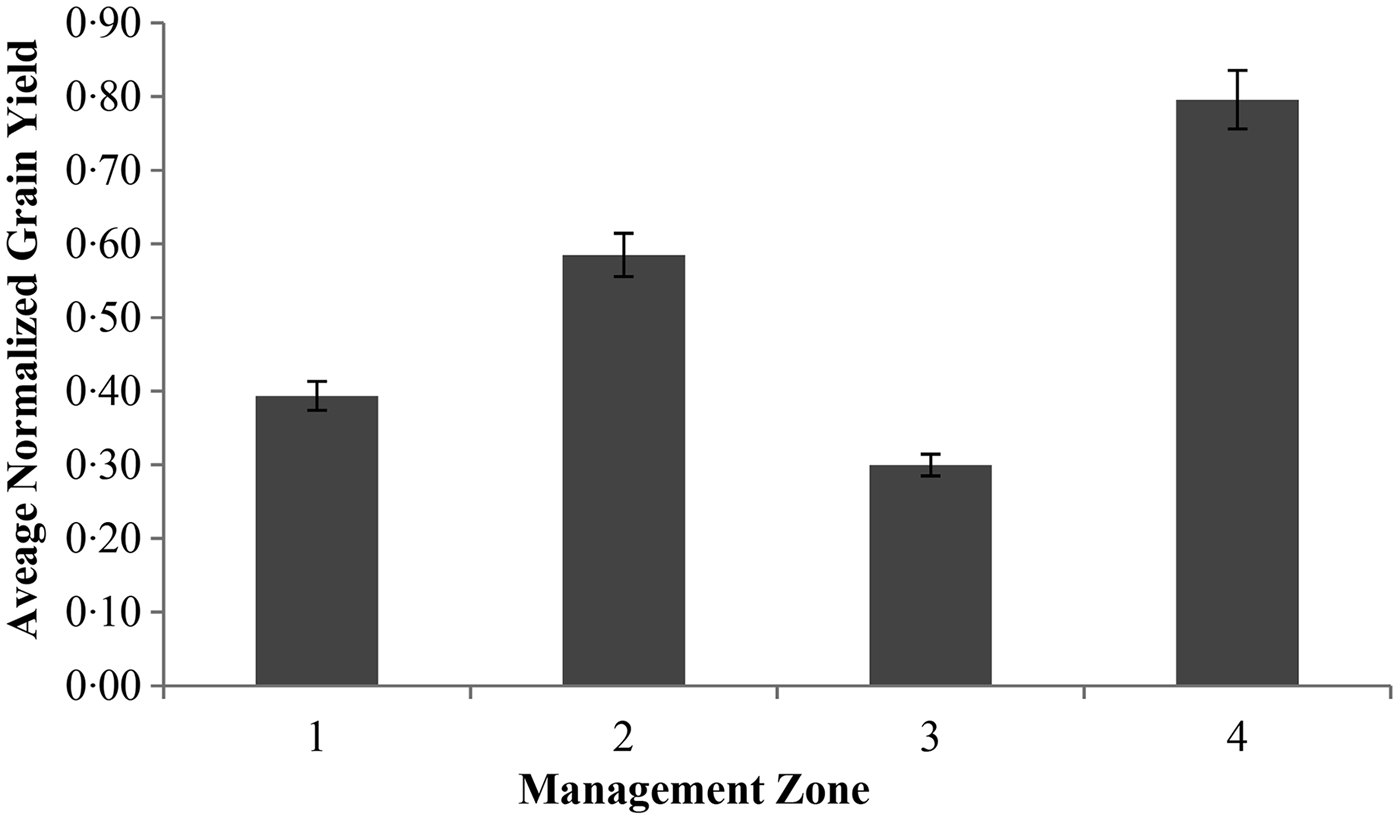
Figure 8 shows the average normalized grain yield within the four management zone scheme for growing season 2008/09. Management Zone 4 produced the highest average grain yield of 0·46 kg/ha, which was 36% more than that of Management Zone 3. The higher grain yield in Management Zone 4 was due to lower elevation, low soil EC and higher soil nitrogen content in this zone, in the western part of the field. Management Zone 1 also produced 30 and 21% higher grain yields when compared with those of Management Zone 2 and Management Zone 3, respectively, during 2008/09. Management Zone 2 produced higher grain yields of 0·33 kg/ha compared with that of 0·29 kg/ha for Management Zone 3 in the southern part of the field (Fig. 8), which may be associated with higher soil nitrogen content and rainfall throughout the growing season. The average normalized grain yield for the 2009/10 growing season was very similar in each of the management zones. Similarly to the 2008/09 growing season, Management Zone 4 produced 14% higher grain yields of 0·45 kg/ha than that of Management Zone 3 during 2009/10. Management Zone 1 and Management Zone 2 produced 12 and 6% more grain yield than Management Zone 3, respectively, during 2009/10, which seemed to be affected by the soil and landscape attributes (Fig. 9). Figure 10 shows the average normalized grain yield trend within the four management zone scheme for the 2010/11 growing season. Management Zone 4 produced the highest grain yields (57% more than Management Zone 3), similar to the other two growing seasons of 2008/09 and 2009/10. Management Zone 3 produced minimum grain yield of 0·30 kg/ha in the southern part of the field, having higher elevation and soil EC. The evaluation of the four management zone scheme based on normalized wheat grain yield indicated the appropriateness and usefulness of the scheme.
Average normalized grain yields of four management zones scheme for the 2008/9 growing season.
Average normalized grain yields of four management zones scheme for the 2009/10 growing season.
Average normalized grain yields of four management zones scheme for the 2010/11growing season.
DISCUSSION
The experiments were conducted to delineate site-specific management zones for precision agriculture using soil and landscape attributes. The ANN model was used to determine the most important soil and landscape attributes for delineating management zones. During ANN analysis, soil and landscape attributes of % sand, % clay, elevation, soil nitrogen and soil EC were selected for delineating management zones based on their order of influence and spatial distribution in the field. It was observed that the CV and SV values of ANN-identified attributes were higher within the entire field than that of the delineated four management zone scheme. The higher CV values of the parameters were associated with spatial variability effects (Cemek et al. Reference Cemek, Guler, Kilic, Demir and Arslan2007; Gokalp et al. Reference Gokalp, Basaran, Uzun and Serin2010). The data layer analysis of the soil and landscape attributes also indicated the spatial variability effects.
Using the ANN-identified soil and landscape attributes, the experimental field was divided into three, four, five and six management zone schemes using MZA software V0·1 and ArcGIS V9·3. The analysis showed that division of the experimental field into four management zones seemed to be the most appropriate scheme because the four management zones showed spatial patterns for grain yield that were similar to the spatial distribution of soil and landscape attributes of % sand, % clay, elevation, soil nitrogen and soil EC (Bianchini & Mallarino Reference Bianchini and Mallarino2002; Ferguson et al. Reference Ferguson, Hergert, Schepers, Gotway, Cahoon and Peterson2002; Li et al. Reference Li, Pan and Ma2007a, Reference Li, Shi, Li and Lib). Moreover, analysis based on FPI and NCE showed that the four management zone scheme was appropriate/optimum for the experimental field because both the indices attained minimum values with this scheme (Fraisse et al. Reference Fraisse, Sudduth and Kitchen2001; Fridgen et al. Reference Fridgen, Kitchen, Sudduth, Drummond, Wiebold and Fraisse2004; Chiericati et al. Reference Chiericati, Morari, Sartori, Ortize, Perry, Vellidis and Stafford2007).
The descriptive statistics indicated that the four management zone scheme delineation process decreased the CV values of clustering variables within the management zones. The SV values also decreased within the four management zone scheme when compared with SV values of the entire field. The lower values of CV and SV within the management zones showed a relative decrease of spatial variability effects. Jiang et al. (Reference Jiang, Liu, Liu, Li, Wang, Yang and Hu2012) reported that CV values of landscape attributes decreased within the management zone scheme when compared to that of the entire field. The results suggested that soil and landscape attributes such as % sand, % clay, elevation, soil nitrogen and soil EC were effective to delineate the potential management zone scheme within the field. Many researchers have reported that soil EC, elevation, soil texture and soil nitrogen were useful soil and landscape attributes for delineating management zones. However, correlations among soil EC, elevation and soil nitrogen as well as the basis for their use to delineate management zones have been reported to vary among fields and regions (Schepers et al. Reference Schepers, Shanahan, Liebig, Schepers, Johnson and Luchiari2004; Kitchen et al. Reference Kitchen, Sudduth, Myers, Drummond and Hong2005; Orteqa & Santibanez Reference Orteqa and Santibanez2007; Jiang et al. Reference Jiang, Liu, Liu, Li, Wang, Yang and Hu2012).
Analysis of 3 years of normalized grain yield data within the four management zone scheme showed that Management Zone 4 consistently produced higher grain yields, which may be due to lower elevation, lower soil EC and higher soil nitrogen content. On the other hand, Management Zone 3 consistently produced lower grain yield during all three growing seasons, i.e. 2008/09, 2009/10 and 2010/11. Management Zone 3 consisted of higher elevation and higher soil EC in the eastern part of the field and it produced lower grain yields of 0·29 kg/ha, which was associated with lower soil moisture availability due to higher elevation in that management zone (Bakhsh et al. Reference Bakhsh, Jaynes, Colvin and Kanwar2000). Grain yields in Management Zones 1 and 2 were variable over the years, which may be associated with variability in rainfall during the growing seasons. Management Zones 1 and 2 had relatively higher % sand content, so the rainfall during the growing season induced a spatial relationship with moisture availability in sandy loam soil. A similar grain yield trend was observed across the management zones for growing seasons of 2008/09 and 2009/10 while a different grain yield trend was observed during 2010/11. The variability in wheat grain yield may be due to variation in soil properties and their response to rainfall received during the growing seasons (Fraisse et al. Reference Fraisse, Sudduth and Kitchen2001; Dinners et al. Reference Dinners, Karlen, Jaynes, Kaspar, Hatfield, Colvin and Cambardella2002; Chiericati et al. Reference Chiericati, Morari, Sartori, Ortize, Perry, Vellidis and Stafford2007; Jiang et al. Reference Jiang, Liu, Liu, Li, Wang, Yang and Hu2012).
The analysis also showed differences between management zones in the average normalized grain yield over the growing seasons, showing the effects of landscape attributes and suitability/appropriateness of the delineated four management zone scheme within the field. The results suggested that the four delineated management zone scheme can be helpful for site-specific application of inputs in precision agricultural practices. The results also indicated that the techniques developed based on ANN and MZA analysis using soil and landscape attributes of % sand, % clay, elevation, soil nitrogen and soil EC should be used to delineate management zones for site-specific application of inputs which need field verification.
The authors wish to express their sincere thanks to Pakistan Science Foundation (Project No. PSF/Res/P-AU/Engg.53) for providing financial assistance and the University of Agriculture, Faisalabad, Pakistan, for their cooperation and assistance, to facilitate the field experimental work at the Postgraduate Agricultural Research Station.