Introduction
With increasing emphasis on the development of magnetic particles for imaging and assay applications, new instrumentation must be developed to help us understand their properties under various biologically relevant conditions: suspended in solution, lodged in tissue, or trapped in living cells. Important characteristics include particle size distribution, magnetic moment distribution, Brownian translation and rotation, dynamic translation or accumulation into a given volume, agglomeration, chaining dynamics, and in general the influence of a particle on its surroundings and vice versa. Each of these phenomena can be used as the basis to measure bio activity or as a magnetic imaging contrast agent or possibly as both.
Measurements performed ex situ (often on dried powders) may not be particularly relevant, especially if the magnetic properties of the particle are a function of the local biological environment. In addition, measurements of large numbers of particles probe the ensemble average of the sample and not the properties of the individual particles as they may interact with their local surroundings. Thus, it is important to develop new instrumentation to measure the physical characteristics of individual particles in situ (i.e., in environments similar to the in vivo or in vitro conditions where they might be used for medical applications or biological research).
Several approaches for quantitative measurements of the microscopic magnetic properties of individual particles have been taken recently. For example, optical methods, aided by the availability of high-resolution imaging systems with particle tracking software, can be used to measure particle motion in microfluidic chambers. Reference van Ommering, Nieuwenhuis, van Ijzendoorn, Koopmans and Prins1,Reference van Ommering2 Optical methods are limited by the dynamic depth of field of the microscope and are challenging for smaller particles due to the diffraction limit. In addition, they are difficult to implement noninvasively in vivo. In situ magnetic susceptibility measurements of single particles are also possible with micro-coil detectors or microfabricated thin-film sensors. Reference Wang and Li3 The particle must be in very close proximity to the detector (less than a micrometer in some cases) to ensure strong magnetic coupling. In addition, magnetic susceptibility measurements of individual particles can be difficult, especially at low frequencies (f) where Johnson noise, 1/f noise, and spurious electromagnetic interference obscure the magnetic induction signal coming from a single particle.
In this article, we aim to briefly discuss some novel measurement techniques sensitive enough to characterize individual magnetic particles, the physical basis of the measurements, and some of the future impacts on the development of new types of magnetic bioagents. These methods have some advantages over the optical and AC susceptibility approaches discussed previously in that they are not limited by optical diffraction, do not require close proximity to a magnetic detector, and are not limited by the inherent electromagnetic noise of magnetic inductive detectors at low frequencies. The first method is based on proton nuclear magnetic resonance (NMR) of a magnetic bead in water in a microcapillary probe; the second method makes use of high-resolution magnetic resonance imaging (MRI) of water surrounding a particle; and the third method is based on AC susceptometry with a mechanical cantilever detector that combines the concepts behind magnetic particle imaging (MPI) Reference Gleich and Weizenecker4 with probe microscopy. In addition, there is the potential to extend these single particle measurements to in vivo imaging/assay modalities. This is certainly the case for high-field MRI-based in vivo measurements that can remotely probe the microscopic details of these interactions by measuring the shift in the NMR proton resonance of water molecules as they diffuse near a single magnetic particle. Reference Shapiro, Skrtic, Sharer, Hill, Dunbar and Koretsky5
Proton NMR of water near a single magnetic particle
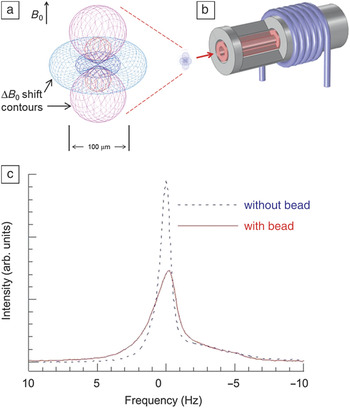
The magnetic properties of a single particle can be determined by performing NMR spectroscopy of the water surrounding it with a micro-coil probe (see Figure 1 ). Reference Nakashima, Boss, Russek and Moreland6 The protons in water molecules near the particle precess at a rate given by the Larmor condition 2πf 0 = γB 0, where γ is the gyromagnetic constant for the proton, and B 0 is the applied field. Locally, the proton NMR spectral line width is broadened by the presence of a magnetic particle. The dipole field from a particle dephases the precession of protons because it generates significant shifts in the magnetic field ΔB 0 hundreds of micrometers away from the particle, depending on its magnetic moment, as shown in Figure 1. The details of the line shape as the particle moves through the radio frequency (RF) coil (also shown in Figure 1) can be used to quantitatively determine the moment of the particle. Water molecules farther away from the particle are not affected, but their signal remains as a large background in the NMR spectrum. To detect the influence of a single particle, the background signal can be reduced by reducing the sample volume to a few nanoliters in a microcapillary probe. In addition, by optimizing the RF detector coil geometry and minimizing spurious susceptibility artifacts in the microcapillary probe, it is possible to detect a single particle with conventional pulsed NMR spectrometer electronics with a signal-to-noise ratio (SNR) that is greater than 20.
Proton nuclear magnetic resonance (NMR) spectroscopy of a magnetic particle suspended in water in a microcapillary probe. The protons in water molecules near a magnetic particle precess at a rate given by the Larmor condition 2πf 0 = γB 0, where γ is the gyromagnetic constant for the proton, and B 0 is the applied field. Locally, the proton NMR spectral line width is broadened by the presence of a magnetic particle. (a) The calculated ΔB 0 shift near a magnetic particle is shown for a 1 µm magnetic polystyrene sphere having a magnetic moment m = 2.3 × 10⁻¹⁴ A·m2 in a 7 T uniform magnetic field. Contour surfaces show a ΔB 0 of ±23 nT and ±2.3 nT, corresponding to shifts of 1 Hz and 0.1 Hz, respectively, in the proton Larmor frequency f 0 = 300 MHz. Red surfaces indicate a positive magnetic field, and blue lines indicate a negative magnetic field. (b) A micro-coil NMR probe. Note that the particle itself is invisible at the scale of the coil. By design, the coil dimensions match the effective extent of the ΔB 0 shift, thus maximizing the signal-to-noise ratio of the probe. The micro-coil was wound on a “coil capillary” with an inner, removable, “sample capillary.” The radio frequency coil and tuning/matching capacitors were immersed in a perfluorinated carbon susceptibility-matching fluid to minimize the susceptibility differences of the materials comprising the probe. (c) NMR spectra of deionized water with (red) and without (blue) the presence of a single magnetic bead. Several coil configurations were developed. The best results were obtained with a four-turn micro-coil—the spectral width of pure water alone is 1.0 Hz, increasing to 2.2 Hz with the presence of a bead, with a substantial reduction in peak height as well. Reference Nakashima, Boss, Russek and Moreland6

The NMR line shape depends on (1) the RF excitation field as a function of position in the coil, (2) the distribution of the field B 0 near the particle, and (3) other dephasing effects that include the diffusion of water protons in the non-uniform dipole field of the particle. To a first approximation, microscale modeling of (1) and (2) combined with the knowledge of the precise position of the particle within the detector coil can be used to estimate its magnetic moment. However, (3) has a significant effect on the measurement, and as of yet, diffusion effects have not been sufficiently modeled to enable more quantitative single particle measurements. Water diffusion has been considered for ensembles of particles at high concentrations where the diffusion lengths and particle spacings are comparable to the range of the particle’s dipole field. Reference Brown7–Reference Fratila and Velders12 These simulations do not fully apply to a single isolated particle, however, and further modeling will be required in order to make the method more quantitative.
NMR micro-coil measurements on smaller magnetic particles (below 100 nm) would need to be performed at higher fields in order to achieve a satisfactory SNR. In addition, individual measurements on smaller particles would require highly integrated microfabricated probes constructed with materials and dimensional control at the micrometer level. However, we expect, at these small scales, susceptibility mismatches between the components of the probe will ultimately lead to non-uniform B 0 fields that will limit the practical reductions in probe size required for better SNR. It is important to note that the noise limitations discussed here apply to single shot NMR measurements of particles as they move through the RF micro-coil. Significant gains in SNR can be obtained by averaging multiple spectra of protons near stationary particles.
High-resolution MRI of water near a magnetic particle
Another approach to magnetic particle characterization is through MRI. Although its spectral resolution and SNR cannot match those of tailor-made NMR micro-coil systems, Reference Nakashima, Boss, Russek and Moreland6,Reference Olson, Peck, Webb, Magin and Sweedler13 its added spatial imaging and localization capabilities afford complementary measurement alternatives. Most obviously, imaging increases throughput, allowing multiple particles to be imaged and characterized simultaneously for improved ensemble profiles and statistics. But it can also provide more information-rich options for single particle measurements. With a broad array of MR imaging pulse sequences available, many distinct imaging options exist; we limit the discussion below to a few examples.
MRI has been frequently used for measuring magnetic fields and the susceptibilities of materials over the years. Reference Weisskoff and Kiihne14–Reference Li16 Different local material susceptibilities lead to different local magnetic field strengths, which can result in image distortions and variation in signal intensity. Reference Lüdeke, Röschmann and Tischler17–Reference Bakker, Bhagwandien, Moerland and Ramos20 For structures surrounded by slowly varying spatial magnetic field gradients, MR phase imaging can provide direct visualization of the surrounding field profile. Reference Weisskoff and Kiihne14,Reference Ericsson, Hemmingsson, Jung and Sperber18,Reference Posse and Aue19
While such techniques have often been considered for macroscopic spatial regions and spatially extended ensembles of particles, much less work exists on individual micro- or nanoscale-sized magnetic particles. Contemporary high-field MRI voxel volumes are still several orders of magnitude larger than a typical magnetic microparticle dimension that might be used for cell labeling and tracking. Provided the particle has a sufficient magnetic moment, however, its surrounding field can appreciably perturb the resonant Larmor precession frequency of water molecules out to a distance equal to several voxels in size (or several hundred times the particle size). Reference Zabow, Dodd, Shapiro, Moreland and Koretsky21 The degree to which the resonance is perturbed is directly related to the local field magnitude, allowing magnetic moments of particles to be calculated.
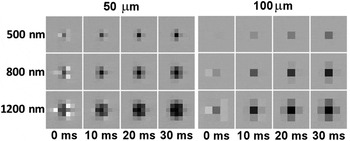
In MRI, spatial localization is most often frequency encoded through the application of controlled magnetic field gradients that add the necessary spatial variation to the water proton precession rates. The field of the particle locally adds to these gradient fields, modifying resonant frequencies and yielding an apparent redistribution in the location of water spins during image reconstruction. The geometry and scale of the resulting image distortion can be analytically determined Reference Zabow, Dodd, Shapiro, Moreland and Koretsky21 and, provided its extent exceeds a single voxel, used to calculate the magnetic moment of the particle. In addition to image distortion, water protons near the particle are continually dephasing due to the different local field strengths encountered within the field gradient of the particle. (This, of course, is the same transverse dephasing that reduces spin coherence times and hence broadens the water MR line in the NMR measurements described previously.) The total amount of transverse dephasing is directly proportional to the product of the magnetic moment of a single particle and the time allowed for the dephasing to accrue. Imaging with large echo times therefore produces considerable dephased signal loss and a hypointense (dark) image region in the vicinity of the particle. The size and intensity of such hypointense signal regions can again be used to infer the magnetic moment of particles. Maximum echo times are often limited in vivo by competing endogenous dephasing, constraining the usefulness of this technique to particles with a higher magnetic moment (typically micrometer-sized or above). But, in purer water environments, longer echo times could be used to amplify the effect, making imaging of smaller particles likely. Figure 2 provides examples of calculated image distortions and dephasings for various particle magnetic moments and image echo times.
Simulated, noise-free, high-resolution, gradient-echo magnetic resonance images (MRI) of magnetic particles. Images were calculated at isotropic spatial resolutions of 50 µm (left) and 100 µm (right), which indicate the respective imaging pixel sizes. Simulations assume a left-to-right readout gradient and an in-plane vertically directed MRI field. Particle diameters, shown on the left, assume spherical particles composed of pure iron. Image echo times are displayed underneath. These calculations show that it is important to use high moment magnetic particles for better image contrast. It is also important to maximize spatial resolution and image echo time. Reference Zabow, Dodd, Shapiro, Moreland and Koretsky21

Minimum detectable particle sizes are difficult to accurately quantify since detection depends on many factors that vary substantially from one scanner to another, including imaging protocol, coil size, construction and filling factor, field homogeneity and strength, imaging medium (i.e., water, in vivo), and imaging resolution. As a rough estimate, however, minimum sizes for particles with high magnetic moments made from pure iron, for instance, are likely on the order of a micrometer for state-of-the-art, high-field, clinical, in vivo imaging and a couple of hundred nanometers for high-field research scanners. Custom magnetic resonance microscopy setups, however, could likely push the particle size limit to below 100 nm.
Magnetic particle imaging with a probe microscope
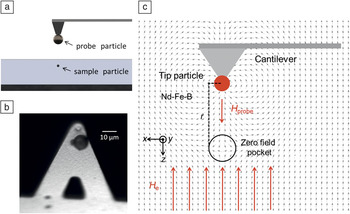
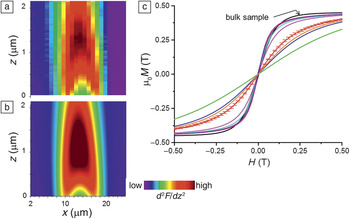
The concepts behind magnetic particle imaging (MPI) Reference Gleich and Weizenecker4 can be adapted to atomic force microscopy (AFM) by attaching a permanently magnetized probe particle to the tip of an AFM cantilever. We refer to this technique as magnetic particle force microscopy (MPFM). Reference Alldredge and Moreland22 A uniform opposing field combined with the probe particle dipole field generates a “zero field pocket” that can be scanned through the sample by moving the probe particle over the surface of the sample (x-y scans as a function of probe tip height), as shown in Figure 3 . An additional AC field is generated in the sample by vibrating the cantilever at half its resonance frequency, and the response of the sample to the drive field is detected at the cantilever resonance frequency in a manner similar to MPI. Thus, direct coupling to the drive field is filtered out of the detection signal. By imaging the cantilever response at different heights above the sample, magnetic moment versus field (m-H) curves of individual particles can be determined. Figure 4 (a–b) shows the experimental data and the theoretical fit to the cantilever response based on the “best fit” m-H curve of a single Mn0.68Zn0.32Fe2O4 particle about 1 µm in diameter, respectively. Figure 4c shows the fitted m-H curves for different isolated particles compared to a curve for a bulk sample. The difference is due to the spread in demagnetization factors of each particle due to variations in their shape and orientation within the sample. Computer modeling of the data not only uniquely determines the magnetic response of individual particles, but also their 3D position with super resolution much smaller than the diameter of the particle.
(a) The experimental setup consists of a magnetic “probe” particle attached to the end of a standard atomic force microscope (AFM) cantilever suspended above another “sample” particle embedded in a matrix. (b) The probe particle is a NdFeB sphere about 10 µm in diameter glued to a silicon nitride AFM cantilever. (c) The probe particle is magnetized in the direction perpendicular to the base of the cantilever (–z direction), providing a field H probe. The cantilever is then placed in an opposing external field H e that is in the +z direction. The interaction of these two fields creates a zero field pocket that is spatially translated through a sample particle that has a magnetic moment m(H). The cantilever is driven with a piezo at its first sub-harmonic f c/2, where f c is its resonance frequency with an amplitude of 20 nm to generate an additional AC magnetic field in the sample. The second harmonic force signal d 2 F/dz Reference van Ommering2 is detected at f c. The narrow mechanical quality factor (Q) of the cantilever serves as a band-pass filter isolating the drive signal from the detected signal. Reference Alldredge and Moreland22

(a) Experimental and (b) best-fit theoretical two-dimensional magnetic particle force microscopy (MPFM) image slices of the cantilever second harmonic force signal d 2 F/dz Reference van Ommering2 along the z–x direction (see Figure 3 for axis orientation). The test sample in this case consists of soft ferromagnetic Mn0.68Zn0.32Fe2O4 particles that have been milled to 1–2 µm in size and embedded in epoxy at varying depths. The three-dimensional data are reduced to a 2D slice by extracting a section through the center of the particle assuming cylindrical symmetry. Theoretical d 2 F/dz Reference van Ommering2 images are generated by iterating the best fit for the magnetic moment versus applied field (m-H) curve for the particle based on a general Langevin form. (c) The magnetization in Tesla units (note µ0 is the permeability of free space) versus applied field (µ0 M-H) curve for the bulk sample (black curve) and the m-H curves for multiple particles measured at H e = 0.31 T. The m-H curves for the individual particles are scaled to the µ0 M-H curve of the bulk sample for comparison. Error bars are included on one of the curves to show the quality of the fit based on the experimental data. Data sets were taken on seven different individual particles. A distribution of the demagnetization factors and thus different m-H curves for each particle is expected, given a variety of particle shapes and orientations in an irregular powder sample. Reference Alldredge and Moreland22

The development of large-scale computational code is required for interpreting the signal from MPFM. Reference Alldredge and Moreland22 In order to extract the m-H curve of a particle from a series of MPFM images, the local magnetic field must be modeled and combined with the complex susceptibility of the particle. There is also the problem of ill-defined derivatives of the fitting function and local minima in the fits. Since computational power is readily available, we can overcome these issues by fitting the large-scale simulation to the data using a grid of starting parameters. This leads to an accurate parameterization of the system and allows the m-H curve and the 3D position of the particle to be uniquely determined.
MPFM should be easily extended to magnetic particles a few nanometers in size by using smaller probe tips and scanning closer to the sample surface. The ultimate sensitivity for MPFM is limited by the thermal mechanical noise and the mechanical Q of the cantilever.
Summary
We described three novel approaches for characterizing magnetic particles as they might be used for in vivo magnetic bioassay and imaging applications sensitive enough to characterize individual particles and complexes. We focused on conventional nuclear magnetic resonance (NMR) spectroscopy with a micro-coil probe, high-field magnetic resonance imaging (MRI), and the newly developed magnetic particle force microscopy (MPFM) imaging technique as methods for measuring localized changes in the susceptibility of fluids or tissue within the body due to the presence of magnetic markers. NMR and MRI can be used to indirectly measure the magnetic properties of an individual particle using nearby water protons as microscopic “field sensors.” On the other hand, MPI directly measures the magnetic fluctuations of a particle in response to an AC field.
Practically speaking, it will be difficult to improve the sensitivity of the RF coil detector-based MR techniques described here to the point that particles with diameters much less than 100 nm can be characterized. However, from an applications viewpoint, these techniques will still be useful. Examples include real time monitoring of cell uptake of magnetic particles, Reference Robert, Pamme, Conjeaud, Gazeau, Iles and Wilhelm23 bio-endogenous production of magnetic particles or magnetic proteins, or significant changes of particle size or magnetic moment caused by local biochemistry. Single particle measurements will also be useful for microscopic quality control assurance to determine agglomeration or degradation rates of particles as a function of storage time.
In contrast, we believe that MPFM can be extended to the nanoscopic level relatively easily in light of the current state of cantilever detector technology. It has promise for magnetic imaging and assay applications at subcellular levels if one can develop specific magnetic dyes for staining cell organelles. In addition, MPFM could be used to extend AC susceptometry to measure the binding rates of molecules to a single magnetic particle in solution. The susceptibility cutoff frequency for Brownian rotation of the particle is determined by the hydrodynamic radius of a particle and the local viscosity of the fluid surrounding it. Reference Fannin, Scaife and Charles24–Reference Song, Henry, Jacobs and Francis28 If the particle is biofunctionalized for a given analyte, it becomes a remote reporter as molecules bind to the surface and the particle diameter changes. In the future, such assays targeted at specific compounds, such as glucose or cancer-specific proteins, Reference Weizmann, Patolsky, Katz and Willner29 could be developed using MPI or MPFM to measure local binding rates in vitro at the cellular level and potentially in vivo in animal models.