INTRODUCTION
The aetiology of depression in community samples has been intensively investigated in twin studies that can broadly distinguish genetic from environmental factors. The existing literature suggests that the key vulnerability factors are neuroticism, family history of depression and early abuse/neglect or trauma, whereas the precipitating factor is often an adverse life event. Working with these variables, depressive episodes are moderately well predicted at the 12-month follow-up (Kendler et al. Reference Kendler, Kessler, Neale, Heath and Eaves1993, Reference Kendler, Gardner and Prescott2002, Reference Kendler, Kuhn and Prescott2004, Reference Kendler, Gardner and Prescott2006).
While these findings are robust, the approach is essentially observational and thus insufficient to indicate the mechanisms whereby clinical depression emerges in high-risk individuals. The present study therefore set out to determine the cognitive and neurophysiological mechanisms of neuroticism, whereby adversity may lead to depression.
Cognitive theories of depression emphasize the role of negative biases in information processing in the aetiology and maintenance of the disorder (Beck et al. Reference Beck, Rush, Shaw and Emery1979). Biases on the interpretation and memory for emotional information have been reported. For example, in facial expression recognition tasks, depressed patients show reduced recognition of positive expressions and/or increased perception of negative expressions (Gur et al. Reference Gur, Erwin, Gur, Zwil, Heimberg and Kraemer1992; Bouhuys et al. Reference Bouhuys, Geerts and Gordijn1999; Surguladze et al. Reference Surguladze, Young, Senior, Brebion, Travis and Philips2004), that is a bias away from positive towards negative. Negative perceptual and memory biases have also been found in healthy volunteers following negative mood induction (Teasdale & Russell, Reference Teasdale and Russell1983; Bouhuys et al. Reference Bouhuys, Bloem and Groothuis1995). Although attentional biases are less consistently found in depression, dot-probe tasks have revealed increased attention to negative stimuli in dysphoric patients and healthy volunteers undergoing a negative mood induction when longer stimulus durations are used (Bradley et al. Reference Bradley, Mogg and Lee1997).
Although the state of severe depression is evidently associated with cognitive abnormalities, there are fewer comparable studies conducted in recovered patients. In general, global impairments of executive function resolve following recovery (Peselow et al. Reference Peselow, Corwin, Fieve, Rotrosen and Cooper1991; Austin et al. Reference Austin, Mitchell and Goodwin2001), but certain residual emotional biases remain and may provide the mediating mechanisms in subsequent relapse. Thus, facial expression recognition was found to be negatively biased in recovered depressed patients (Bouhuys et al. Reference Bouhuys, Geerts and Gordijn1999; Bhagwagar et al. Reference Bhagwagar, Cowen, Goodwin and Harmer2004; Hayward et al. Reference Hayward, Goodwin, Cowen and Harmer2005) and this was associated with subsequent relapse (Bouhuys et al. Reference Bouhuys, Geerts and Gordijn1999).
In parallel with the cognitive findings are reports of dysfunction of the hypothalamic–pituitary–adrenal (HPA) system in depression. HPA dysfunction can be indicated by an elevated cortisol response to awakening, as demonstrated in both acutely depressed (Pruessner et al. Reference Pruessner, Wolf, Hellhammer, Buske-Kirschbaum, von Auer, Jobst, Kaspers and Kirschbaum1997) and recovered patients (Bhagwagar et al. Reference Bhagwagar, Hafizi and Cowen2003). Longitudinal studies have provided evidence that cortisol level predicts subsequent depression onset in adult women (Harris et al. Reference Harris, Borsanyi, Messari, Stanford, Cleary, Shiers, Brown and Herbert2000) and adolescents (Goodyer et al. Reference Goodyer, Herbert, Tamplin and Altham2000). Elevated cortisol levels may also contribute to the learning and memory impairments reported in depression (Young et al. Reference Young, Sahakian and Robbins1999).
Thus, measurable cognitive and HPA abnormality may be present in recovery from depression, but we cannot rule out a scar effect, so called because the residual biases and elevated cortisol may be a consequence of depression, rather than implying occurrence before the onset of the first episode. The present study therefore recruited young euthymic college students with high versus low scores for neuroticism (N), and without a history of depression. We hypothesized that high-N volunteers would display affective processing biases favouring negative versus positive information. These biases might also be accompanied by elevated morning cortisol levels, but global impairments of executive function were unlikely before a depressive episode.
METHOD
Volunteers and design
The study was approved by the local ethics committee. Seventy-two healthy college students with high or low N scores (see below) gave written informed consent to the study, and received payment for their participation. The Structured Clinical Interview for DSM-IV was used to screen for axis I disorders and seven volunteers were excluded from the study because of current or previous depression or anxiety disorders.
N scores for screening were derived from the 12-item neuroticism scale of the shortened Eysenck Personality Questionnaire (EPQ; Eysenck et al. Reference Eysenck, Eysenck and Barrett1985). Thirty-three (22 women) were in the high-N group (H: mean score=9·58, range=8–12) and 32 (18 women) in low-N group (L: mean score=1·25, range=0–3). The two groups were matched for age (18·82±0·98 v. 19·06±0·88), gender, verbal IQ (40·12±2·80 v. 38·16±5·54) and spatial IQ (26·19±11·37 v. 22·43±9·37) assessed with the National Adult Reading Test (NART; Nelson, Reference Nelson1982) and the Wechsler Adult Intelligence Scale – Revised (WAIS-R; Wechsler, Reference Wechsler1981).
Characterization of state and trait variables
To assess mood, personality, family background and life experience, participants were interviewed with the Hamilton Depression Rating Scale (HAMD; Hamilton, Reference Hamilton1967) and filled in the following questionnaires: the State-Trait Anxiety Inventory (STAI; Spielberger et al. Reference Spielberger, Gorsuch and Lushene1970), Beck Depression Inventory (BDI; Beck et al. Reference Beck, Ward, Mendelson, Mock and Erbaugh1961), Befindlichkeits Scale of Mood and Energy (Bf-S; von Zerssen et al. Reference von Zerssen, Strian, Schwarz and Pichot1974), Fear of Negative Evaluation Scale (FNE; Watson & Friend, Reference Watson and Friend1969), Buss–Durkee Hostility Inventory (Buss & Durkee, Reference Buss and Durkee1957), Social Adaptation Self-Evaluation Scale (SASS; Bosc et al. Reference Bosc, Dubini and Polin1997), Dysfunctional Attitude Scale (DAS; Weissmann, Reference Weissmann1979, factors taken from Cane et al. Reference Cane, Olinger, Gotlib and Kuiper1986), ruminative items of the Response Styles Questionnaire (modified by Treynor et al. Reference Treynor, Gonzalez and Nolen-Hosksema2003), EPQ (Eysenck & Eysenck, Reference Eysenck and Eysenck1975), Parental Bonding Inventory (PBI; Parker et al. Reference Parker, Tupling and Brown1979), stressful life events (adopted from Goodyer et al. Reference Goodyer, Herbert, Tamplin, Secher and Pearson1997), and family history of psychiatric disorders. Two participants did not complete all the questionnaires.
Emotional categorization
Main task: personality characteristics categorization
Sixty personality characteristics chosen to be extremely desirable (e.g. honest) or undesirable (e.g. rude) (Anderson, Reference Anderson1968, matched on word length, frequency and meaningfulness) were presented on a computer screen for 500 ms. Participants were asked to categorize these traits as likeable or dislikeable by pressing the labelled key on the keyboard. To encourage self-referent judgement, participants were asked to imagine whether they would be pleased or displeased if they overheard someone describing them in this way.
Control task: animal attributes categorization
A similar task was carried out as a control, using 60 attribute words (30 per valence). This time participants were asked to classify each attribute as an ‘advantage’ (e.g. strong) or ‘disadvantage’ (e.g. weak) for a predatory animal. In both tasks classifications and reaction times for the correct identifications were recorded.
Emotional memory
A surprise memory task comprising recall and recognition (60 target words plus 60 distracters) was conducted 15 min after completing each of the categorization tasks. The number of correctly and incorrectly recalled words was counted. Recognition data were analysed using signal detection theory (Green & Swets, Reference Green and Swets1966; Grier, Reference Grier1971) to derive a measure of accuracy corrected for subjects' response tendency. The proportion of correctly recognized words (y) and the proportion of falsely recognized words (x) were entered into the following equations to give the sensitivity measure d′ and the response bias β: d′=0·5+[(y−x)(1+y−x)/4y(1−x)]; β=[y(1−y)−x(1−x)]/[y(1−y)+x(1−x)]. This allowed an assessment of accuracy (hits) unconfounded by the response criterion used by the volunteer.
Facial expression recognition
Stimuli and procedure
Pictures of faces representing six basic emotions (happiness, surprise, sadness, fear, anger, and disgust) were taken from the Pictures of Affect Series (Ekman & Friesen, Reference Ekman and Friesen1976). These were morphed between each full emotion (100%) and neutral (0%) in 10% steps (Young et al. Reference Young, Rowland, Calder, Etcoff, Seth and Perrett1997): four examples were given per intensity per emotion. Each face was also presented in a neutral expression, giving a total of 250 stimuli. Each stimulus flashed up on a computer screen for 500 ms followed by a blank screen. Participants were asked to recognize the emotion by pressing the appropriate key. Accuracy and reaction times for correct choices and misclassifications were recorded. Accuracy was defined by the threshold, that is the intensity level at which the participant gave three or more (i.e. ⩾75%) correct responses across three consecutive intensity levels.
Dot-probe task
Stimuli and procedure
The emotional stimuli included 60 social threatening negative words and 60 positive words, each of which was paired with a matched neutral word. Another 60 neutral–neutral word pairs were given as fillers. Preceded by a fixation cross (500 ms), a word pair was presented on the screen with one word above another. In the unmasked condition the word pair was presented for 500 ms, whereas in the masked condition the word pair appeared for 14 ms followed by the display (186 ms) of a mask. After that, a probe (one or two stars) appeared in the position of either preceding word, and participants were asked to indicate the number of stars. These 360 trials were presented in three blocks in random order. Reaction time and accuracy were recorded. Attentional vigilance scores were calculated for each participant by subtracting the mean score of ‘congruent trials’ (where the probe and emotional words appeared in the same position) from that of the ‘incongruent trials’ (where they appeared in opposite positions).
Emotion-potentiated startle (EPS)
Stimuli
Sixty-three pictures of three categories (pleasant, unpleasant, neutral) were taken from the International Affective Picture System (gender-specified, Larson et al. Reference Larson, Ruffalo, Nietert and Davidson2000). Each picture was presented for 13 s (mean inter-trial interval=13 s) on a computer screen. The pictures were presented in three blocks in a fixed order so that no two of the same category would appear successively.
Procedure and recording
The eye-blink component of the startle response was recorded from the orbicularis oculi using electromyography (EMG startle response system, San Diego Instruments, Inc., San Diego, CA, USA). Acoustic probes were 50-ms, 95-dB bursts of white noise with a nearly instantaneous rise time (generated through the noise generator and amplifier of the EMG startle response system) and were delivered binaurally through headphones at 1·5, 4·5 or 7·5 s following picture onset. To minimize expectation, startle probes were skipped from two trials per valence per block, and three probes were given within the inter-trial interval. A practice session presenting nine neutral pictures and startle probes was used in the beginning to habituate participants to the startle probes.
EMG signals were filtered (low cut-off: 0·5 Hz; high cut-off: 100 Hz) and rectified. Eye-blink reflex magnitudes in μV were calculated by subtracting the amount of integrated EMG at reflex onset from the first peak amplitude of integrated EMG between 20 and 120 ms following probe onset. Trials with no traceable eye-blink reflex were assigned a magnitude of zero and included in the analysis. Eye-blink reflexes with an excessively noisy baseline (within 20 ms after the probe) were rejected. Four participants (two from each group) were excluded from the analysis because they displayed fewer than 25% blink responses. Magnitude and latency of the eye-blink reflex were recorded.
Subjective rating
After the recording, participants were asked to review the pictures and rate the valence and arousal levels of each picture on a 1–10 scale (from negative to positive, low arousal to high arousal).
Global executive functions
As global cognitive impairments (e.g. Austin et al. Reference Austin, Mitchell and Goodwin2001; Elliot et al. Reference Elliott, Sahakian, McKay, Herrod, Robins and Paykel1996) and over-general autobiographical memory (for a recent review, see Williams et al. Reference Williams and Yiend2004) were widely demonstrated in depression, we included the following tasks to examine whether neuroticism has an effect on memory, learning and problem solving.
Auditory Verbal Learning Test (AVLT)
The AVLT (Rey, Reference Rey1964) was used to assess learning and memory. In the immediate recall phase, participants were read aloud a 15-item word list and asked to recall as many words as possible. This procedure was repeated five times. A distracter list was then presented to create a short delay, after which free recall of the first list was measured. Fifteen minutes later, participants were tested again with a free recall and recognition test (15 target words plus 35 distracters).
Tower of London (TOL)
In this task two sets of three coloured balls were presented on a touch-sensitive computer screen, with each set being arranged like snooker balls hanging in three pockets. Participants were asked to rearrange the balls in one set to match the other set under certain rules. The minimum number of moves (2, 3, 4 or 5) required for each trial was indicated. Participants were instructed to work out the whole solution in mind before making the first move. In addition, two control blocks were used to measure the time for actual movement. In these, the balls were constantly moved by the computer in one set and participants were asked to copy this movement on the other set. Task performance was assessed by three variables: number of problems solved with minimum moves, average number of moves, and thinking time. Thinking time was computed by subtracting the reaction time of the control trials from that of the main trials.
Autobiographical Memory Test (AMT)
In the AMT (Williams & Broadbent, Reference Williams and Broadbent1986), participants were presented with 18 cue words (nine positive and nine negative), each at a time, and asked to recall a memory of a specific event that the cue word reminded them of. Instructions defined a specific event as any event that took place on a particular day at a particular place and no more recent than a week ago, and that participants should not recall the same event for more than one cue word. Each word was shown on a card and read aloud by the experimenter. If a participant did not respond after 30 s, the next word would be presented. A practice trial with a neutral word (‘chicken’) was used in the beginning to check that the participant understood the instructions. Latency (duration between the presentation of a cue word and the start of the recall) and number of specific responses were recorded.
Awakening salivary cortisol
At the end of the experiment, participants were given instructions to collect five salivary samples at home in the following morning: the first sample was taken immediately upon waking (Time 1), and subsequent samples were taken at 15-min intervals for the next hour (Times 2, 3, 4 and 5 respectively). Participants were not allowed to eat or drink during the test and not to consume alcohol the night before. Nine subjects (seven from H) failed to return their samples. Cortisol was measured with an in-house double-antibody radioimmunoassay. Cortisol levels of the five samples (M1, M2, M3, M4, M5) were entered into the following formula to compute the area under the curve (Pruessner et al. Reference Pruessner, Kirschbaum, Meinlschmid and Hellhammer2003): [(M2+M1)+(M3+M2)+(M4+M3)+(M5+M4)]×15/2.
Statistics
Independent-samples t tests were used to reveal group differences in psychological characteristics, AVLT (delayed recognition), and TOL (number of trials solved in minimum moves) and salivary cortisol. Other data were analysed by using two-way (facial expression recognition, EPS, AMT, AVLT, TOL) or three-way (emotional categorization, emotional memory, dot probe) analyses of variance (ANOVAs), with between-Ss variable as group (H, L) and within-Ss variable(s) as emotion, trial and/or task conditions. Individual ANOVAs and t tests were run to clarify significant interactions.
RESULTS
Psychological characteristics
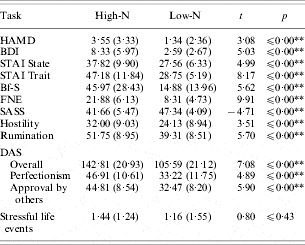
Using the full EPQ scale, the two groups were confirmed to have significant difference in neuroticism scores (17·91±2·84 v. 5·72±3·27, p<0·01). Although none of the volunteers had ever met criteria for DSM-IV depression, and mean scores on clinical symptom scales did not exceed usual levels for remission, H participants showed a significantly higher level of depressive mood, anxiety and hostility than L. They also reported more rumination, dysfunctional attitudes, parental over-protectiveness, and lower social adaptation. By contrast, the two groups did not differ in family history of psychiatric disorder, parental care, and stressful life experience (all p>0·10) (Table 1).
Psychological characteristics of the two groups

N, Neuroticism; HAMD, Hamilton Depression Rating Scale; BDI, Beck Depression Inventory; STAI, State-Trait Anxiety Inventory; Bf-S, Befindlichkeits Scale of Mood and Energy; FNE, Fear of Negative Evaluation Scale; SASS, Social Adaptation Self-evaluation Scale; DAS, Dysfunctional Attitude Scale.
Values represent means (±standard deviations).
Asterisks represent significance of group comparisons: ** p⩽0·01.
Emotional categorization
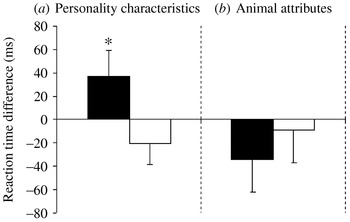
There was a significant group×task×emotion interaction [F(1, 63)=4·73, p=0·03] for reaction time in the self-referent versus animal categorization tasks. Sensitivity analyses showed a significant group×emotion interaction in the emotional categorization [Fig. 1(a): F(1, 63)=3·88, p=0·05] but not in the control task [Fig. 1(b): F(1, 63)=0·51, p=0·48]. H volunteers were quicker at classifying negative versus positive personality characteristics than L. Furthermore, within the H group, the reaction time for positive items was significantly correlated with N scores [r(33)=0·37, p=0·04], so reaction time for positive items increased with neuroticism.
Emotional categorization of self-referent personality characteristics (a) and animal attributes (b). Values represent mean difference scores of reaction time to identify positive minus negative words±standard error of the mean. Asterisks represent statistical significance of group comparisons (* p<0·05). ■, High-N; □, Low-N.

For accuracy data there was neither a group difference [F(1, 63)=0·45, p=0·51] nor a group×emotion×task interaction [F(1, 63)=0·51, p=0·48] but both groups achieved more than 90% accuracy in both categorization tasks, implying a potential ceiling effect.
Emotional memory
Recall
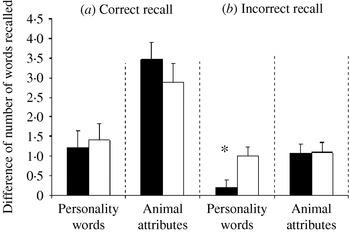
The two groups performed similarly in terms of correct recall [Fig. 2(a): group: F(1, 63)=0·47, p=0·50; task×emotion×group: F(1, 63)=0·87, p=0·35]. However, H volunteers produced fewer positive memory intrusions than L [Fig. 2(b): group×emotion: F(1, 63)=7·54, p=0·01] for self-referent information, but not in the control task [group×emotion: F(1, 63)=0·01, p=0·92].
Emotional memory: (a) correct recall; (b) incorrect recall, of personality characteristics and animal attribute words. Values represent mean difference scores of number of words recalled for positive minus negative words ±standard error of the mean. Asterisks represent statistical significance of group comparisons (* p<0·05). ■, High-N; □, Low-N.

Recognition
The two groups had similar accuracy (d′) [group: F(1, 63)=0·07, p=0·79; task×emotion×group: F(1, 63)=3·09, p=0·09] and response bias (β) [group F(1, 63)=0·03, p=0·87; task×emotion×group F(1, 63)=0·50, p=0·48].
Facial expression recognition
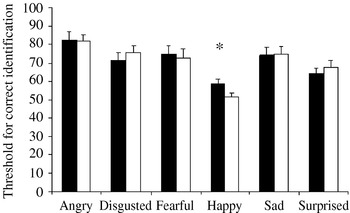
There were no main effects on accuracy, reaction time or misclassifications in this task (all p values >0·10). However, differences in recognition of each emotion were further explored using independent t tests, given a strong a priori hypothesis for individual emotions. This revealed a significant group difference for accuracy of happy faces [Fig. 3: t(63)=2·05, p=0·04] but not in any other emotions (all p values >0·40). Specifically, H had a higher threshold in identifying happy faces than did L; that is, they needed higher intensity levels to be able to correctly identify happy facial expressions.
Threshold of facial expression recognition in high-N (■) and low-N (□) volunteers. Values represent mean threshold levels (±standard error of the mean) required to correctly identify each emotion at a level of >75%. Asterisks represent statistical significance of group difference (* p<0·05).

Dot-probe task
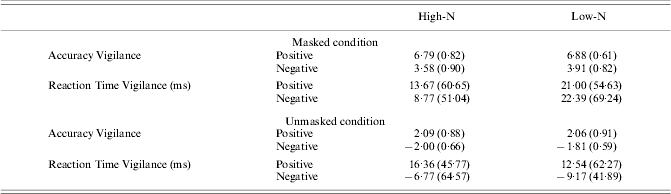
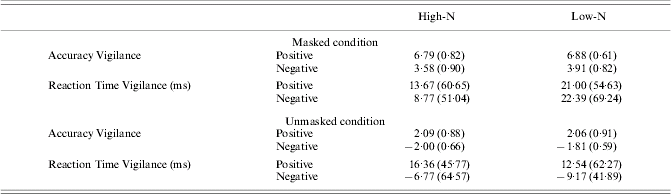
There were no significant effects on the vigilance scores of reaction time [group: F(1, 63)=0·22, p=0·64; group×emotion×mask: F(1, 63)=0·03, p=0·87] or accuracy [group: F(1, 63)=1·92, p=0·17; group×emotion×mask: F(1, 63)=0·01, p=0·95]. This was also true when only the unmasked trials were considered: for reaction time [group: F(1, 63)=0·10, p=0·76, emotion×group: F(1, 63)=0·01, p=0·94] and for accuracy [group: F(1, 63)=0·49, p=0·49; emotion×group: F(1, 63)=0·49, p=0·49] (see Table 2, available online).
Attentional bias as measured by dot-probe task under masked and unmasked conditions. Values represent means±standard deviations
EPS
Eye-blink magnitude
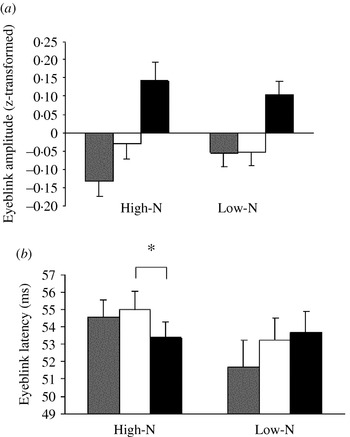
The z-transformed data revealed the expected potentiation effect in both groups [Fig. 4(a): overall effect of emotion: F(2, 118)=10·17, p=0·001], with volunteers showing a greater response to unpleasant than neutral or pleasant pictures. However, this was not affected by neuroticism [group: F(1, 59)=0·86, p=0·40; emotion×group: F(2, 118)=0·85, p=0·43]. Examination of raw startle amplitudes showed a similar pattern [emotion: F(2, 118)=7·19, p=0·001; group: F(1, 59)=1·33, p=0·25; emotion×group: F(2, 118)=0·36, p=0·70]. The average amplitudes were similar between H and L [mean=1416·20 v. 1674·83; t(59)=−1·15, p=0·25].
(a) Amplitude of startle response (Z scores) and (b) average latency of startle response while viewing the three types of pictures. Values represent means±standard error of the mean. Asterisks represent statistical significance of comparisons between startle responses during pleasant and unpleasant pictures within each group (* p<0·05). , Neutral; □, pleasant; ■, unpleasant.

Eye-blink latency
There was a significant group×emotion interaction [Fig. 4(b): F(2, 116)=3·08, p=0·05], but post-hoc comparisons failed to reveal group difference within each emotional category (all p>0·10). As shown by paired-samples t tests, the interaction was mostly driven by H responding more slowly to pleasant than unpleasant pictures [t(29)=2·04, p=0·05].
Subjective ratings
There was no group difference in terms of rating for valence [group: F(1, 58)=0·12, p=0·73; emotion×group: F(2, 116)=1·10, p=0·34] or arousal [group: F(1, 58)=0·43, p=0·52; emotion×group: F(2, 116)=1·14, p=0·32].
Non-emotional cognitive functions
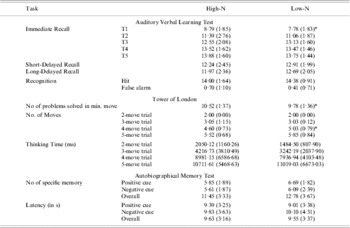
In these tests, high-N subjects showed modest trends to improved performance compared with low-N (see Table 3, available online). In the AVLT immediate recall there was a significant group×trial interaction [F(4, 253)=3·27, p=0·01], with subsequent t tests suggesting that H outperformed L only in the first trial [t(63)=2·21, p=0·03]. For the short- versus long-delayed recalls there was no group difference [F(1, 63)=0·02, p=0·89] or interaction [F(1, 63)=1·77, p=0·19], nor was there any group difference on long-delayed recognition [hits: t(63)=−1·14, p=0·26; false alarms: t(63)=1·26, p=0·21]. In the TOL there was a significant group effect [F(1, 63)=5·75, p=0·02] and a group×trial interaction [F(3, 189)=3·32, p=0·02] in the number of moves required to solve the problem. Subsequent t tests found that H was better than L in the four-move problems [t(63)=−2·29, p=0·03]. H also solved more problems in a minimum number of moves than did L [t(63)=2·16, p=0·03]. However, among H volunteers, this measure was negatively correlated with N score [r(33)=−0·35, p=0·05], suggesting that the higher a participant scored in neuroticism the fewer problems s/he managed to solve in a minimum number of moves. There were no effects in terms of thinking times [group: F(1, 63)=0·55, p=0·46; interaction: F(3, 189)=0·48, p=0·70]. When the perfectionism score from the DAS was included as a covariate in these analyses, the differences were lost [AVLT Immediate Recall group×trial: F(4, 244)=1·33, p=0·26; TOL Number of Moves group effect: F(1, 61)=3·08, p=0·08; group×trial F(3, 183)=2·21, p=0·09].
Memory and executive functions

Values represent means±standard deviations. Asterisks represent significance of group difference, * p<0·05.
In the AMT, there were no effects on latency [group: F(1, 63)=0·01, p=0·95; group×emotion: F(1, 63)=0·65, p=0·42] or number of specific memories produced [group: F(1, 63)=2·20, p=0·14; interaction: F(1, 63)=0·65, p=0·42] (see Table 3, available online).
Awakening salivary cortisol
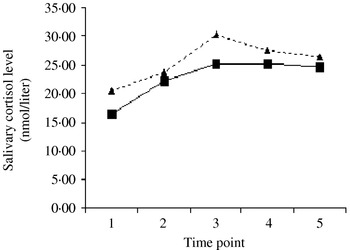
The mean time of awakening did not differ between H and L participants (0838 v. 0813 h). The area under the curve of cortisol responses revealed no group difference (1375·80±552·23 v. 1568·22±593·85, p=0·23) (see Fig. 5, available online).
Salivary cortisol level within the first hour of waking. ■, High-N; ▲, Low-N.

DISCUSSION
Our results show that biases in information processing are present in high-N students who are at risk of depression but have not been depressed. Decreased positive or increased negative processing was seen across a number of tasks including emotional categorization and memory, facial expression recognition and EPS, in the absence of global memory or executive deficits. However, there was no evidence for effects of neuroticism on attentional bias (measured with the dot-probe task), over-general autobiographical memory, or elevated morning cortisol levels.
As noted in the introduction, it has often been suggested that negative biases may be a trait vulnerability marker for depression. However, by eliminating subjects with previous depression, our results establish a direct association between cognitive abnormality and vulnerability to depression without the contamination of a scar effect.
Although the relationship between neuroticism and cognitive processing has been researched for decades (e.g. Lishman, Reference Lishman1974; Lloyd & Lishman, Reference Lloyd and Lishman1975; Martin et al. Reference Martin, Ward and Clark1983), these studies were mostly performed on non-selective samples with which correlations were examined between N and response (e.g. speed of memory recall). In contrast to this approach, our study selected participants from the extreme range of N (high versus low) and thus directly illustrated the influence of high neuroticism on emotional processing.
In the emotional categorization and memory tasks, H volunteers were faster to classify dislikeable self-referent personality characteristics and produced fewer positive memory intrusions. This bias away from the positive was similarly revealed in the perception of social information, as measured by the facial expression recognition task. H volunteers had a higher threshold for identifying happy faces than the control volunteers. A reduction in positive facial perception echoes previous experimental findings in depressed patients (Murphy et al. Reference Murphy, Sahakian, Rubinsztein, Michael, Rogers, Robbins and Paykel1999; Suslow et al. Reference Suslow, Junghanns and Arolt2001) and healthy volunteers undergoing a negative mood induction (Bouhuys et al. Reference Bouhuys, Bloem and Groothuis1995). By contrast, recovered patients also tend to show an increased perception of negative expression such as fear, disgust and sadness (Bouhuys et al. Reference Bouhuys, Geerts and Gordijn1999; Bhagwagar et al. Reference Bhagwagar, Cowen, Goodwin and Harmer2004; Hayward et al. Reference Hayward, Goodwin, Cowen and Harmer2005). This suggests the hypothesis that risk for depression is largely manifest as reduced positive processing of emotional information, which is accompanied by increased negative processing only after the actual experience of depression.
EPS was used to give a physiological measure of reactivity to emotional information. Our sample, regardless of group membership, exhibited the expected EPS pattern with enhanced eye-blink during the presentation of aversive pictures relative to neutral or pleasant pictures, which is widely demonstrated in laboratory work (e.g. Bradley et al. Reference Bradley, Cuthbert and Lang1990; Cook et al. Reference Cook, Hawk, Davis and Stevenson1991). The two groups gave similar pleasantness ratings for the pictures. Unexpectedly, while amplitude was unaffected, there was an effect of neuroticism on blink latency. H volunteers showed a significant delay in their reflexive response to pleasant pictures. A reduced physiological reactivity to positive stimuli in the absence of differential subjective rating implies that neuroticism involves biases in mechanisms that are highly automatic and thus not influenced by self-report. The current result is compatible with the theory that low activity in appetitive emotional systems is the core deficit in depression (Fowles, Reference Fowles1988; Depue & Iacono, Reference Depue and Iacono1989; Clark & Watson, Reference Clark and Watson1991), although latency variables are infrequently reported for the EPS task.
The negative findings in this study may indicate domains in which deficits are simply not associated with depression vulnerability or, instead, may arise solely from the experience of depression. Thus, the dot-probe task provides evidence that attentional biases play no role in neuroticism and, as noted in the introduction, attentional biases have never been reliably shown in depression either. By contrast, the negative results in autobiographical memory are notable because an over-general memory deficit has been robustly found across clinical samples. Among the few that examined over-general memory before depression (e.g. Mackinger et al. Reference Mackinger, Loschin and Leibetseder2000a, Reference Mackinger, Pachinger, Leibetseder and Fartacekb; von Minnen et al. Reference von Minnen, Wessel, Verhaak and Smeenk2005), the results were confounded to some extent by prior trauma experiences and/or unclear history of depression. A recent study (Gibbs & Rude, Reference Gibbs and Rude2004) found that over-general memory interacts with stressful life events in predicting subsequent depression symptoms in randomly selected students, but the experience of depression was not defined. We propose that over-general memory does not contribute to the vulnerability to depression shown by high-N subjects.
Our negative findings for awakening cortisol in high-N students contrast with the hyperactivity of the HPA axis reported previously in a substantially older sample (Portella et al. Reference Portella, Harmer, Flint, Cowen and Goodwin2005) and in an older subgroup of high-N subjects (Zobel et al. Reference Zobel, Barkpw, Schulze-Rauschenbach, von Widdern, Metten, Pfeiffer, Schnell, Wagner and Maier2004). Our data are comparable with those obtained in the high-N subjects of a similar age range (Zobel et al. Reference Zobel, Barkpw, Schulze-Rauschenbach, von Widdern, Metten, Pfeiffer, Schnell, Wagner and Maier2004). Therefore, it is possible that dysfunction of the HPA axis occurs with increasing age in vulnerable individuals, possibly as an interaction between risk and exposure to toxic life events. Alternatively, it cannot be ruled out from our data set that elevated cortisol responses may only be seen in a subpopulation of high neurotic subjects who will eventually develop depression. Longitudinal studies are required to test this hypothesis.
As anticipated, results from AVLT and TOL revealed no global cognitive impairment by neuroticism. These are consistent with the hypothesis that cognitive deficits are largely confined to periods of illness in depression rather than as a more general trait (Peselow et al. Reference Peselow, Corwin, Fieve, Rotrosen and Cooper1991; Austin et al. Reference Austin, Mitchell and Goodwin2001). There was a tendency for H volunteers to perform better in these tasks, which appeared to be related to their enhanced drive or perfectionism. This enhanced cognitive function makes the specific reduction in positive processing also found in this group more noteworthy.
The current study has a number of limitations. Although high neuroticism is a robust risk factor for depression, the relatively low prevalence rates of depression imply that only a small proportion of the high-N population will go on to develop depression, thereby potentially diluting any effects that we may have seen. While this could account for the lack of effect in terms of cortisol responses and autobiographical memory performance, it could not account for the negative biases that were seen in the group as a whole. Longitudinal studies are required to assess the predictive power of negative biases for subsequent depression in a sample adequately powered for the detection of infrequent events. Finally, in the current study the experimenters were not blind to group membership. Although this is unlikely to have an influence on the results because responses were collected automatically by computer and task instructions were standardized across participants, future studies may want to assess negative bias using a blinded design to confirm these findings.
Conclusion
There has been an ongoing controversy whether biased cognition is a state or trait marker for depression. Negative cognitive biases in healthy volunteers after a depressive mood induction give partial support for the ‘state hypothesis’ (Mathews & Bradley, Reference Mathews and Bradley1983; Sutton et al. Reference Sutton, Teasdale and Broadbent1988). However, neuroticism in individuals without a history of depression was associated with reduced positive processing in our study, thus strongly suggesting that cognitive biases represent a trait vulnerability marker for depression. Furthermore, the processes that were found to be affected by neuroticism overlap with the processes that are affected by antidepressant drug treatment in healthy volunteers (Harmer et al. Reference Harmer, Hill, Taylor, Cowen and Goodwin2003, Reference Harmer, Shelley, Cowen and Goodwin2004). This overlap validates the earlier suggestion that antidepressants act on the key cognitive components of emotional processing related to the acquisition and maintenance of mood disorders. In the future, longitudinal studies are required to investigate whether, and to what extent, such cognitive vulnerability predicts subsequent depression. If so, this could pave the way for further studies evaluating the efficacy of early interventions targeting the dysfunctional cognitive styles of the high-risk population.
ACKNOWLEDGEMENTS
This work was supported by the Medical Research Council.
NOTE
Supplementary information accompanies this paper on the Journal's website (http://journals.cambridge.org).
DECLARATION OF INTEREST
Catherine Harmer has acted as a consultant for Lundbeck, Merck Sharp & Dohme, and P1Vital. Guy Goodwin has received grants from Sanofi-Aventis, and Servier; honoraria from AstraZeneca, BMS, Eisai, Lundbeck, Sanofi-Aventis, and Servier; held paid positions with the University of Oxford, and Oxfordshire & Buckinghamshire NHS Mental Healthcare Trust and been on advisory boards of AstraZeneca, BMS, Lilly, Lundbeck, P1Vital, Sanofi-Aventis, Servier, and Wyeth.