Introduction
Davida Teller (Reference Teller1984), in her paper entitled “Linking Propositions”, noted that visual scientists are interested in explaining how we see on the basis of the observable properties of neurons, noting that this is a difficult task because both seeing and neurophysiology are each such complex topics and because of thorny logical and philosophical problems that arise when trying to link these vastly different domains. To make progress, despite all this complexity, Teller and Pugh (Reference Teller, Pugh, Mollon and Sharpe1983) suggested the following view: visual processing involves a series of deterministic mappings of the visual world onto different specific neural substrates, for example, photons from the world map onto quantum catches in the photoreceptors, noting that at some stage, the neural outputs are mapped onto subjective experience. Teller and Pugh identified the neural population within which this mapping to perception occurs as the “bridge locus.” Linking propositions, in the context of bridge loci, are ones that specify that a certain mapping or mapping principle occurs between neural activity and perception within the population comprising the bridge locus. Much of the work of visual science was thus seen as comprising the formulation and testing of linking hypotheses.
Since the mid 1980s, much effort has been devoted to “finding” bridge loci using the tools of neuroimaging in humans and single-unit physiology in alert behaving nonhuman primate preparations. Moreover, since that time, because it has become increasingly possible to study the detailed relationship between physiological activity and perception, the balance of theorization has shifted in this direction from where it was in the 1980s when most of the effort was spent on inferring the physiological from the psychophysical. In the spirit of the enterprise of linking propositions and bridge loci, it is informative to revisit this question in light of progress in our ability to spatially localize the sources of the human visual evoked potential (VEP).
Links between the VEP and perception: the analogy and identity propositions of Teller (Reference Teller1984)
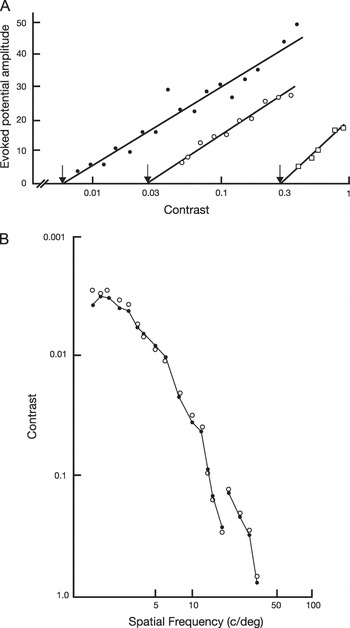
Fergus Campbell, Lamberto Maffei, and Janos Kulikowski were among the first to relate VEP activity to perception in their pioneering studies of the human contrast response function (Campbell & Maffei, Reference Campbell and Maffei1970; Campbell & Kulikowski, Reference Campbell and Kulikowski1972). They presented observers with flickering gratings that varied in contrast from well below their perceptual threshold to well above it. They found that VEP amplitude grew systematically as a function of contrast and that measurable responses were first detectable in the VEP at around the same contrast levels that were reported as being visible by the observers (see Fig. 1). By regressing the VEP amplitude versus log contrast function to zero amplitude, they obtained an objective measure of contrast threshold that tracked psychophysical thresholds for different spatial frequencies and field sizes (Campbell & Maffei, Reference Campbell and Maffei1970). The close tracking of the VEP and psychophysical thresholds over parametric variations of the stimulus linked the two via what Teller (Reference Teller1984) referred to as the “analogy” linking proposition—if it walks like a duck and quacks like a duck, it must be a duck, so to speak.
(A) Steady-state VEP amplitude is a linear function of log contrast. Regression lines intercept the x-axis at a contrast level that is close to the observer’s psychophysical threshold (arrows). Data are from three different spatial frequencies (3.5 c/deg, filled circles; 9 c/deg, open circles, and 18 c/deg, open squares). (B) Contrast sensitivity as a function spatial frequency. Open circles plot psychophysical threshold, filled circles VEP thresholds estimated by extrapolation of the contrast response function to zero amplitude. Redrawn from Campbell and Maffei (Reference Campbell and Maffei1970).

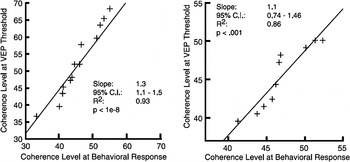
A more recent example of this the analogy proposition comes from our study of face-related evoked potentials (Ales et al., 2012b). In that study, we alternated intact face images with images that shared the same spatial frequency power spectrum. Evoked responses in this paradigm are larger after an alternation between a scrambled to an intact image than vice versa. By systematically varying the degree of Fourier phase scrambling of the intact image, we were able to derive a threshold for detecting the face structure in much the same way that Campbell and co-workers derived thresholds for contrast. Face detection thresholds varied considerably for different face exemplars and for different participants. Importantly, psychophysical and VEP thresholds covaried—an example of the analogy hypothesis—where a common source of variability in the underlying neural response presumably coupled the behavioral and physiological thresholds for the different images and observers (see Fig. 2).
Covariation of steady-state VEP thresholds for detection a face in phase-scrambled noise and simultaneously measured perceptual thresholds. The left panel plots thresholds of 15 different face exemplars that varied in their intrinsic detectability. Each datum point plots the averages over 10 observers. The right panel plots thresholds of the 10 observers averaged over 15 face exemplars. In both cases, the variability in neural and behavioral thresholds is correlated. From Ales et al. (Reference Ales, Farzin, Rossion and Norcia2012b).

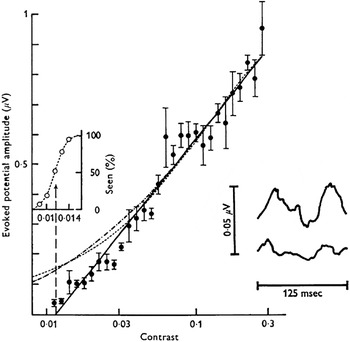
Teller’s identity proposition is illustrated by another paper by Fergus Campbell, who, working with Janos Kulikowski, measured frequency-of-seeing curves along with the evoked potential as stimulus contrast was varied (Campbell & Kulikowski, Reference Campbell and Kulikowski1972). To measure frequency-of-seeing curves, Campbell and Kulikowski took advantage of the fact that the visibility of their lowest contrast patterns waxed and waned over a 20-s observation period. To track this percept, the observers were given a switch that they used to indicate whether the pattern was visible or invisible. The proportion of time that the stimulus was reported to be visible was then recorded as the frequency of seeing. The same switch was used to separately average evoked responses to several very low contrast stimuli into accumulated sums that registered the response to stimuli that were seen and separate sums from the same contrast levels that were not seen (see Fig. 3, inset). VEP amplitude was clearly larger for stimuli that were seen than for those that were not. Campbell and Kulikowski’s analysis of the VEP was, I believe, the first example of what later became know as “choice probability” a measure that has been widely used in nonhuman primate models to asses whether a visual area encode perceptually relevant information.
Steady-state VEP amplitude as a function of contrast (filled symbols) plotted along with frequency of seeing curves (open symbols in the inset on the left). The waveforms in the right inset are for time epochs during which the stimulus was reported to be visible (top) versus invisible (bottom). VEP amplitude is higher for visible stimuli. Redrawn from Campbell and Kulikowski (Reference Campbell and Kulikowski1972).

This form of linkage conforms to Teller’s identity proposition. The identity proposition states that identical physiological states give rise to identical psychological states. In the case of Campbell and Kulikowski’s experiment, large VEPs gave rise to frequent reports of seeing and small amplitude VEPs to infrequent reports. For an identical stimulus, this dissociation was quite clear (see Fig. 3). This result strongly linked the VEP signal to perception—one could, in effect, predict whether the observer would report the stimulus as seen based on the amplitude of the evoked response.
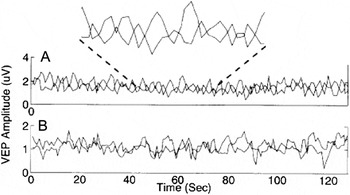
Another compelling test of the identity proposition comes from VEP experiments on binocular rivalry. When the two eyes are presented with stimuli that cannot be fused into a single binocular percept, perception alternates stochastically between the discordant images. By modulating the stimuli presented to each eye at different temporal frequencies, it is possible to track the amplitude of the response generated by each image in real time using spectrum analysis. Using this method, Brown and Norcia (Reference Brown and Norcia1997) showed that the moment-to-moment fluctuations in the VEP amplitude from a given image tracked the perceptual report of visibility of that image (see Fig. 4). Moreover, the amplitudes generated by the stimuli presented to the two eyes were negatively correlated—when one eye’s image was perceptually dominant, its response amplitude was maximal and the other eye’s response was minimal. The timing distribution of the alternation of voltages corresponded directly to the timing of the alternations of the percept (see also Zhang et al., Reference Zhang, Jamison, Engel, He and He2011).
(A) VEP amplitudes recording during presentation of rivalrous frequency-tagged stimuli. The amplitude from each eye is represented by a separate time series. The inset shows a magnified portion of the record where it can be seen that the voltage trace alternates in amplitude. (B) VEP amplitudes recording during the presentation of fusable frequency-tagged stimuli. The magnitude of the two eye-tagged responses are uncorrelated. Redrawn from Brown and Norcia (Reference Brown and Norcia1997).

The mutual exclusivity proposition
The rivalry case nicely illustrates another type of linking proposition proposed in Teller (Reference Teller1984)—the mutual exclusivity proposition. This proposition states that mutually exclusive sensory states lead to mutually exclusive neural responses and vice versa. In the rivalry case, both images are not seen simultaneously and correspondingly both eye–voltage responses are not simultaneously at their maximum or minimum level. Perceptually ambiguous stimuli are particularly useful probes of the relationship between neural activity and perception because the same stimulus leads to different perceptual interpretations and corresponding differences in neural activity. Other examples from the VEP literature include a linkage between the percept of shape from shading and VEP response waveform (Hou et al., Reference Hou, Pettet, Vildavski and Norcia2006), alternations of the Necker cube (Kornmeier & Bach, Reference Kornmeier and Bach2012) and ambiguous motion (Aissani et al., Reference Aissani, Cottereau, Dumas, Paradis and Lorenceau2011).
The similarity proposition
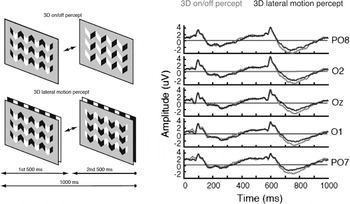
Another family of linking propositions—the similarity propositions—comprise arguments of the form “similar states of the sensory system lead to similar sensations” (Teller, Reference Teller1984). To demonstrate this in the VEP entails showing that evoked responses that are equivalent for different stimuli in fact lead to similar sensations. This linkage can be demonstrated nicely in the context of another ambiguous stimulus paradigm—one in which the stimulus has multiple states that are either seen to be similar or different (Hou et al., Reference Hou, Pettet and Norcia2004). The paradigm, which involves the interpretation of shape and shading cues, is illustrated in Fig. 5. By shifting the relative alignment of a black and white bar pattern (the “shading”) with respect to a grey aperture (the “shape”), one can create the percept of a flat surface or one that appears to be corrugated in depth (see panel in Fig. 5 labeled 3D on/off percept). Alternating these two images at 1 Hz leads to the successive appearance and disappearance of an apparent 3D structure. The response to the transition form the flat, “2D” image to the image seen as 3D leads to a deep negative VEP that peaks around 250 ms after the transition. The depth of this negativity is larger after the transition from the 2D interpretation to the 3D interpretation than vice versa (compare peaks at ∼250 ms to ∼750 ms). After prolonged viewing of the display, another perceptual interpretation of the same physical stimulus emerges. In this interpretation, the bar pattern appears to be located behind what appears to be a serrated opening in a grey field. Importantly, the percept is of symmetric left–right motion instead of the appearance and disappearance of depth structure. The perceptual interpretation thus shifts from being highly asymmetric to being symmetric, and the evoked response displays a corresponding change from being highly asymmetric to being more symmetric. This can be seen as the more similar amplitudes of the broad negative peaks after at ∼250 and 750 ms when the percept is of 3D lateral motion.
Ambiguous shape-from-shading stimulus and corresponding responses illustrating the similarity proposition. The left panel shows the two perceptual interpretations of the same two physical states of the stimulus. In one interpretation, the percept shifts from a planar 2D interpretation to a 3D interpretation. In the other, the percept is always of a 3D display in which symmetric lateral motion of a bar pattern behind seen through a set of openings in the grey field. The VEP during the changing 2D/3D interpretation is more asymmetric than it is when the percept is of two translationally equivalent shifts of a constant 3D structure. Redrawn from Hou et al., (Reference Hou, Pettet, Vildavski and Norcia2006).

Identifying bridge loci with the VEP
As noted in the Introduction, there has been great progress in the last 25 years in our ability to localize the sources of VEP activity (see Michel et al., Reference Michel, Brandies, Gianotti and Wackerman2009). It is thus much more feasible to ask questions about bridge loci using the VEP than it was at the time the notion was first proposed. These new methods employ high-density electroencephalography (EEG) recording arrays with detailed individually specific geometric and electrical models of the conductivity of the head. Based on these “head models,” inverse solutions are calculated to localize activity to its cortical source. By using fMRI to map individual visual areas, it is then possible to attribute the activity to either retinotopic or functionally defined visual areas (Appelbaum et al., Reference Appelbaum, Wade, Vildavski, Pettet and Norcia2006).
Using these methods, we recently identified bridge loci for fine shape discrimination by combining high-density EEG recordings and a novel response-locked analysis of the evoked response (Ales et al., 2012a). As noted in Teller (Reference Teller1984), visual processing proceeds hierarchically from visual structures close to the photon catch in the retina that are likely to lie well before the bridge locus, through intermediate levels of processing, up to the bridge locus. Additional processing that supports the generation of an overt behavioral response must occur beyond the bridge. Along this progression, the representations thus shift from ones that are primarily devoted to encoding the stimulus to those that are involved in implementing decisions to respond according to the rules imposed by the experimenter (see DiCarlo & Maunsell, Reference DiCarlo and Maunsell2005).
By working backward from the time of the behavioral response instead of forward from the stimulus presentation, we isolated activity that was predictive of the timing of the behavioral choice. An identity hypothesis for this analysis can be stated as “evoked activity that is directly predictive of the timing of the behavioral response rather than the timing of the stimulus presentation is sufficient to define a bridge locus.” Using this analysis, we found that activity in V1 and V4 regions-of-interest did not predict the timing of the behavioral response, consistent with these areas lying before the bridge locus for this task. The Lateral Occipital Compex, an area previously associated with shape and object processing (Kourtzi & Kanwisher, Reference Kourtzi and Kanwisher2000; Denys et al., Reference Denys, Vanduffel, Fize, Nelissen, Peuskens, Van Essen and Orban2004), was the earliest occipital visual area to contain response-locked activity. Activity in the Lateral Occipital Compex began approximately 300 ms before the button press. The response-locked evoked activity continued forward for another 300 ms. As time progressed from the initial response-locked activity in the Lateral Occipital Comples to the time of the response itself, activity became apparent in motor cortex, which lies beyond the bridge locus.
The response-locked average selects out activity that is more associated with the timing of the response than the timing of the stimulus. The response-locked average provides us with a directly measurable neural property that is also very similar to a linking criterion introduced in Davida’s chapter “Locus Questions in Visual Science” (Teller, Reference Teller and Harris1980)—the “Looking more like the response” criterion. The question Davida posed was “what is the neural level at which the response looks more like the perceptual report than the stimulus?” The example presented in “locus” was that of the perception of yellow can be created by multiple different combinations of mid- and long-wave lights. Here the stimuli are all different, but the response—it looks yellow—is the same. Teller argued that we could agree that the perceptually relevant locus for yellow was the point at which the neural response no longer differed for the different stimuli. In the response-locked analysis, it is the timing of the electrical activity that looks more like that of the response than the stimulus.
At around the same time that response-locked activity was first emerging in the LOC, activity was also present in anterior temporal and frontal areas. Parietal cortex began responding later—around 50 ms before the button press. In the language of linking hypotheses and bridge loci, these results are interesting because they indicate that there is not a single bridge locus that maps neural responses to perception rather there are concurrent bridge loci whose distribution shifts over time. This suggests that the concept of a bridge locus needs to be further developed into one in which the quality or nature of the bridging may vary over time as the representation shifts from encoding to decision to motor planning and finally response generation. This more nuanced view of bridge loci, combined with the new tools available in both human and animal models, will move the field forward in explaining how we see based on the observable properties of neurons.
Acknowledgments
Supported by EY015779 and EY06579 from the National Eye Institute, NIH.