I. INTRODUCTION
Since Yeh Reference Yeh, Chen, Lin, Gan, Chin, Shun, Tsau and Chang1 and Cantor Reference Cantor, Chang, Knight and Vincent2 independently reported their research on high-entropy alloys (HEAs) or equimolar multicomponent alloys in 2004, HEAs have attracted considerable interest from the scientific community, both in terms of developing a fundamental scientific understanding and potential technological applications. Reference Zhang, Zuo, Tang, Gao, Dahmen, Liaw and Lu3–Reference Miracle and Senkov5 However, to date, a variety of important questions still remain: In particular, what factors govern the formation of single-phase solid solution HEAs? What are the total number of possible single-phase equimolar HEA alloys with the face-centered cubic (FCC), body-centered cubic (BCC), and hexagonal close-packed (HCP) structures, respectively? For each crystal structure type, what is the maximum number of components that a single-phase HEA can possibly dissolve at high temperatures? How can the thermodynamic properties of single-phase HEAs be accurately predicted, given the assumed disordered atomic structures? What other entropy sources are possible, given the fact that the definition of HEAs by Yeh is based on the ideal configurational entropy? How can the elastic properties of single-phase HEAs be reliably calculated and how do they compare with their pure components?
Empirical thermo-physical parameters, Reference Zhang, Zhou, Lin, Chen and Liaw6–Reference Guo18 CALPHAD modeling, Reference Gao, Carney, Doğan, Jablonksi, Hawk and Alman19–Reference Zhang, Gao, Zhang, Yang and Guo29 phase diagram inspection, Reference Gao and Alman25,Reference Gao, Gao, Yeh, Liaw and Zhang30 ab initio molecular dynamics simulations, Reference Zhang, Zuo, Tang, Gao, Dahmen, Liaw and Lu3,Reference Gao and Alman25,Reference Gao, Gao, Yeh, Liaw and Zhang30,Reference Gao, Zhang, Guo, Qiao and Hawk31 hybrid Monte Carlo/molecular dynamic simulations (MC/MD), Reference Widom, Huhn, Maiti and Steurer32,Reference Widom, Gao, Yeh, Liaw and Zhang33 and first-principles density functional theory (DFT) calculations Reference Zhang, Zuo, Tang, Gao, Dahmen, Liaw and Lu3,Reference Gao, Gao, Yeh, Liaw and Zhang30,Reference Widom, Gao, Yeh, Liaw and Zhang33–Reference Ma, Grabowski, Kormann, Neugebauer and Raabe37 have all been used to predict the formation of single-phase HEAs. Gao Reference Gao, Gao, Yeh, Liaw and Zhang30 first evaluated the strengths and weaknesses among these methodologies, and concluded that rationally combining these techniques will likely speed up identification of new single-phase HEA compositions. It was also suggested at the time that hundreds of quaternary and higher-order equimolar compositions in the Dy–Er–Gd–Ho–Lu–Sc–Sm–Tb–Tm–Y, Ba–Ca–Eu–Sr–Yb, and Mo–Nb–Re–Ta–Ti–V–W systems may exist. Reference Gao, Gao, Yeh, Liaw and Zhang30 This work continues that investigation of those new single-phase HEAs that were mainly predicted by Bei, Reference Bei38 Troparevsky, Reference Troparevsky, Morris, Kent, Lupini and Stocks14 Senkov, Reference Senkov, Miller, Miracle and Woodward39 and Gao Reference Gao, Gao, Yeh, Liaw and Zhang30 and also reports the possible existence of new potential septenary, octonary, and ennead BCC refractory HEAs. The thermodynamic mixing properties of FCC CoCrFeNi, BCC MoNbTaW, and HCP CoOsReRu are reviewed using CALPHAD, DFT, and MC/MD methods. The calculated elastic properties of single-phase HEAs with the FCC and BCC structures based on DFT calculations are then compared with the average values estimated from the rule of mixtures (ROM).
II. COMPUTATIONAL METHODOLOGIES AND DETAILS
A. DFT total energy calculations
The DFT calculations at zero temperature were performed using the VASP (Vienna Ab Initio Simulation Package, Vienna, Austria), Reference Kresse and Hafner40,Reference Kresse and Furthmüller41 a plane-wave pseudo-potential software package. Projector augmented-wave potentials Reference Blochl42 were used as supplied with VASP and the Perdew–Burke–Ernzerhof Reference Perdew, Burke and Ernzerhof43 gradient approximation for the exchange-correlation functional. The semi-core 3p/4p/5p electrons of Cr, Fe, Mn, Mo, Nb, Ni, Os, Re, Ru, Ta, and W are explicitly treated as valence. The special quasi-random structure (SQS) method Reference Wei, Ferreira, Bernard and Zunger44,Reference Zunger, Wei, Ferreira and Bernard45 was used to mimic the disordered atomic structures for equimolar HEAs as previously reported by Gao et al. Reference Gao, Niu, Jiang, Irving, Gao, Yeh, Liaw and Zhang36 The cell size of the SQS models used in this work is: 64 atoms for quaternary HEAs, and 125, 125, and 160 atoms for quinary FCC, BCC, and HCP HEAs, respectively. For alloys that contain magnetic elements Co, Cr, Fe, Mn or Ni, collinear spin polarization (i.e., using ferromagnetic and anti-ferromagnetic spin configurations as initial input) were considered. The Brillouin-zone integrations were performed, using the Monkhorst–Pack k-point meshes. Reference Monkhorst and Pack46 The energy convergence with respect to k-points mesh is about 1–2 meV/atom. The plane-wave energy cutoff was held constant at 500 eV, 264 eV, and 322 eV for CoCrFeNi, MoNbTaW, and CoOsReRu, respectively. All SQS models first underwent a volumetric relaxation only (i.e., fixing the lattice shape and ionic positions), followed by full relaxation under zero pressure until the energy convergence reached 1 meV/atom. For simplicity, the zero-point energy was neglected in this study. The enthalpy of formation was calculated by subtracting the composition–weighted total energies of the constituent elements in their ground state from the total energy of the alloy.
Lattice phonon calculations were done using the harmonic approximation. The vibrational entropy (S vib) is calculated by:
 $${S^{{\rm{vib}}}}\left( {V,T} \right) = 3{k_{\rm{B}}}\int_0^\infty {{n^{{\rm{vib}}}}<$$><$$>\left[ {\left( {{f_{{\rm{BE}}}} + 1} \right)\ln \left( {{f_{{\rm{BE}}}} + 1} \right) - {f_{{\rm{BE}}}}\ln {f_{{\rm{BE}}}}} \right]{\rm{d}}\varepsilon \quad ,}$$
where n vib is the phonon DOS and f BE is the Bose–Einstein distribution function.
Electronic excitation across the Fermi level by migrating electrons from the valance band to the conduction band gives rise to electronic entropy (S elec), which can be determined by:
 $${S^{{\rm{elec}}}}\left( {V,T} \right) = - 2{k_{\rm{B}}}\int_{ - \infty }^\infty {{n^{{\rm{elec}}}}<$$><$$>\left[ {{f_{{\rm{FD}}}}\ln {f_{{\rm{FD}}}} + \left( {1 - {f_{{\rm{FD}}}}} \right)\ln \left( {1 - {f_{{\rm{FD}}}}} \right)} \right]} {\rm{d}}\varepsilon \quad ,$$
where n elec is the electron DOS and f FD is Fermi–Dirac distribution function.
B. MC/MD hybrid simulations
The hybrid MC/MD method proposed by Widom et al. Reference Widom, Huhn, Maiti and Steurer32,Reference Widom, Gao, Yeh, Liaw and Zhang33 was used to calculate the configurational entropy. Supercells of 108, 128, and 96 atoms were used for FCC CoCrFeNi, BCC MoNbTaW, and HCP CoOsReRu, respectively. The simulations were done by alternating the molecular dynamics at each temperature with MC swaps, each performed from first principles using VASP. The canonical ensemble (i.e., constant amount of substance, volume, and temperature) was adopted for the FCC and BCC structures and the isothermal-isobaric ensemble (i.e., constant amount of substance, pressure and temperature) for the HCP structure. A minimum of 1000 MC steps with MD time steps of 10 or 20 fs were carried out for these three alloys, resulting in a total MD simulation time of greater than 10 ps. More details on the procedures used are provided elsewhere. Reference Widom, Huhn, Maiti and Steurer32,Reference Widom, Gao, Yeh, Liaw and Zhang33,Reference Huhn and Widom47,Reference Gao, Zhang, Gao, Zhang, Ouyang, Widom and Hawk48 The reduction in configurational entropy due to a short-range chemical order can be calculated using the pairwise truncation of the Kikuchi cluster variation method Reference Ackermann, Inden and Kikuchi49 :
 $$I = \sum\limits_{i,\,j = 1}^N {{y_{ij}}\ln \left( {{{{y_{ij}}} \mathord{\left/ {\vphantom {{{y_{ij}}} {{c_i}{c_j}}}} \right. \kern-\nulldelimiterspace} {{c_i}{c_j}}}} \right)} \quad ,$$
where y ij is the near neighbor correlations and c i and c j are the mole fractions of elements i and j, respectively.
C. CALPHAD modeling
The CALPHAD calculations were carried out using a TCNI8 thermodynamic database supplied by ThermoCalc™ (Solna, Sweden). Reference Sundman, Jansson and Andersson50 For equilibrium calculations, all phases are restored. To calculate the entropy of mixing of the FCC and BCC phases, the ordered L12 and B2 phases were rejected. The TCNI8 database covers the complete constituent binaries and limited ternaries. Reference Sundman, Jansson and Andersson50 Recent research Reference Zhang, Zhang, Chen and Cao24–Reference Zhang, Gao, Gao, Yeh, Liaw and Zhang28 details the database development and applications of the CALPHAD modeling for HEAs.
III. STRUCTURES AND FORMATION
A. Re-examining those predicted single-phase compositions Reference Troparevsky, Morris, Kent, Lupini and Stocks14,Reference Gao, Gao, Yeh, Liaw and Zhang30,Reference Bei38,Reference Senkov, Miller, Miracle and Woodward39
The new single-phase HEAs that were collected in Ref. Reference Gao, Gao, Yeh, Liaw and Zhang30 were mainly predicted by Bei, Reference Bei38 Troparevsky, Reference Troparevsky, Morris, Kent, Lupini and Stocks14 Senkov, Reference Senkov, Miller, Miracle and Woodward39 and Gao. Reference Gao, Gao, Yeh, Liaw and Zhang30 Note that Troparevsky Reference Troparevsky, Morris, Kent, Lupini and Stocks14 did not specify the crystal structures of their predicted single-phase HEAs. The thermodynamic properties of most of these compositions are unknown and whether they would truly form a single-phase solid solution in the as-cast condition awaits experimental verification. To begin, those reassessed empirical rules Reference Gao, Zhang, Gao, Zhang, Ouyang, Widom and Hawk48 will be applied to these alloys.
The equations to calculate the empirical parameters are provided in the section of the Supplementary Material. The widely used parameters include the ideal configurational entropy
 $\left( {S_{{\rm{ideal}}}^{{\rm{conf}}}} \right)$
, enthalpy of mixing in the liquid phase
 $\left( {\Delta H_{{\rm{mix}}}^{{\rm{liq}}}} \right)$
,
Reference Zhang, Zhou, Lin, Chen and Liaw6
atomic size difference (δ),
Reference Zhang, Zhou, Lin, Chen and Liaw6
the Ω-parameter,
Reference Zhang, Lu, Ma, Liaw, Tang, Cheng and Gao7
average valence electron concentration
 $\left( {\overline {{\rm{VEC}}} } \right)$
,
Reference Guo, Ng, Lu and Liu8
electronegativity difference (Δχ),
Reference Fang, Xiao, Xia, Li and Dong9
the ϕ-parameter,
Reference Ye, Wang, Lu, Liu and Yang10
elastic residual strain root mean square (εR.M.S., or
 $\sqrt {\left\langle {{\varepsilon ^2}} \right\rangle }$
),
Reference Ye, Liu and Yang11
the atomic size-related α2-parameter,
Reference Wang, Qiu, Yang and Liu12
intrinsic elastic strain energy (E
2/E
0),
Reference Wang, Qiu, Yang and Liu12
the Φ-parameter,
Reference King, Middleburgh, McGregor and Cortie13
the η-parameter,
Reference Troparevsky, Morris, Kent, Lupini and Stocks14,Reference Gao, Zhang, Gao, Zhang, Ouyang, Widom and Hawk48
and the
 $\kappa _1^{{\rm{cr}}}$
parameter.
Reference Senkov and Miracle15
Very recently Gao et al.
Reference Gao, Zhang, Gao, Zhang, Ouyang, Widom and Hawk48
assessed the most-up-to-date reported HEAs (single-phase, multiphase, and amorphous) and re-evaluated the effectiveness of those empirical rules. In general, the rules are useful since they are able to separate single-phase compositions from all amorphous compositions and many multiphase compositions. However, the threshold values are sensitive to the experimental data assessed, the atomic radii used, and whether or not two FCC or two BCC phases are counted as single-phase HEAs. They
Reference Gao, Zhang, Gao, Zhang, Ouyang, Widom and Hawk48
found that the probably necessary requirements needed to form single-phase solid solutions are: −16.25 kJ/mol ≤
 $\Delta H_{{\rm{mix}}}^{{\rm{liq}}}$
≤ +5 kJ/mol, δ ≤ 6%, Ω ≥ 1, η ≥ 0.19, ϕ ≥ 7.0, εR.M.S. ≤ 0.061, and E
2/E
0 ≤ 13.6 × 10⁻⁴. However, these are not sufficient conditions since many multiphase compositions also satisfy these criteria.
The select empirical parameters of those predicted single-phase HEA compositions
Reference Gao, Gao, Yeh, Liaw and Zhang30
are shown in Fig. 1, and all parameters evaluated in this work are summarized in Table SI (Supplementary Material). Clearly, the vast majority of the predicted compositions satisfy those reevaluated criteria by Gao et al.
Reference Gao, Zhang, Gao, Zhang, Ouyang, Widom and Hawk48
The calculated Δχ values using the Pauling electronegativity are less than 0.36. Many compositions do not satisfy the
 $\Delta {H_{{\rm{IM}}}}/\Delta H_{{\rm{mix}}}^{{\rm{liq}}} \lt \kappa _1^{{\rm{cr}}}$
criterion.
Reference Senkov and Miracle15
Those compositions recommended by Troparevsky et al.
Reference Troparevsky, Morris, Kent, Lupini and Stocks14
have a
 $\overline {{\rm{VEC}}}$
greater than 7.43, suggesting that most of them either prefer the FCC or HCP structure as the main phase in their microstructures [Fig. 1(e)]. The average bulk and shear moduli were estimated using the ROM:
 $$\bar P = \sum\limits_i {{c_i}{P_i}} \quad ,$$
where P
i
refers to the properties of the ith element [lattice parameter (a), elastic constants (C
ij
), bulk modulus (B), and shear modulus (G)], and
 $\bar P$
refers to the corresponding average value for the alloy. The result is shown in Fig. 1(f). The HEAs that comprise of alkali earth and/or rare earth elements are very soft since their shear and bulk moduli are very small, while other HEAs that contain high-melting transition metals have a significantly higher shear and bulk moduli.
Calculated empirical parameters for those predicted single-phase HEA compositions
Reference Troparevsky, Morris, Kent, Lupini and Stocks14,Reference Gao, Gao, Yeh, Liaw and Zhang30,Reference Senkov, Miller, Miracle and Woodward39
: (a)
 $\Delta H_{{\rm{mix}}}^{{\rm{liq}}}$
versus δ, (b) η-parameter versus ϕ-parameter, (c) Ω-parameter versus Δχ, (d)
 $\Delta {H_{{\rm{IM}}}}/\Delta H_{{\rm{mix}}}^{{\rm{liq}}}$
versus
 $\kappa _1^{{\rm{cr}}}$
, (e)
 $\overline {{\rm{VEC}}}$
versus
 $\Delta S_{{\rm{ideal}}}^{{\rm{conf}}}$
, and (f)
 $\bar B$
versus
 $\bar G$
. The marked threshold values are obtained from the work by Gao et al.
Reference Gao, Zhang, Gao, Zhang, Ouyang, Widom and Hawk48

B. CALPHAD predictions: new septenary, octonary, and ennead BCC HEAs
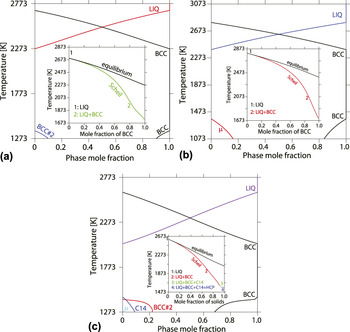
Figure 2 shows the calculated equilibrium phase mole fraction as a function of temperature for septenary CrMoNbTaTiVW, octonary CrMoNbReTaTiVW, and ennead CrFeMoNbReRuTaVW, using the TCNI8 database. Reference Sundman, Jansson and Andersson50 The insets are the nonequilibrium solidification using the Scheil–Gulliver models, Reference Gulliver51,Reference Scheil52 which assume equilibrium mixing in the liquid state and no diffusion in the solid state. Both the equilibrium and Scheil simulations predict the formation of a single BCC solid solution in CrMoNbTaTiVW and CrMoNbReTaTiVW, while formation of C14 and HCP phases in very small fractions toward the end of the Scheil solidification is predicted for CrFeMoNbReRuTaVW.
Calculated equilibrium phase mole fraction as a function of temperature for (a) CrMoNbTaTiVW, (b) CrMoNbReTaTiVW, and (c) CrFeMoNbReRuTaVW, using the TCNI8 database. The insets are the corresponding Scheil simulations.

It has been proposed Reference Gao, Gao, Yeh, Liaw and Zhang30 that a stable single-phase solid solution in as-cast state is promoted when there is a wide temperature range (T rd) between the solidus temperature (T sol) and decomposition temperature (T dec):
 $${T_{{\rm{rd}}}} = \left( {{T_{{\rm{sol}}}} - {T_{{\rm{dec}}}}} \right)/{T_{{\rm{sol}}}} \ge 0.3\quad .$$
The calculated T rd parameters from the equilibrium thermodynamic calculation are 0.40, 0.43, and 0.29 for CrMoNbTaTiVW, CrMoNbReTaTiVW, and CrFeMoNbReRuTaVW, respectively. Both the Scheil simulations and the calculated T rd values suggest that CrFeMoNbReRuTaVW may be on the verge of forming a single BCC phase in the as-cast condition.
IV. ENTROPY OF MIXING AND ENTROPY SOURCES
A. Entropy of mixing calculated from CALPHAD
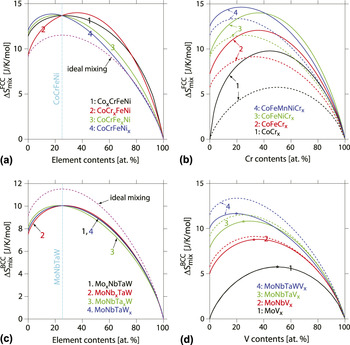
The compositional dependences of the entropy of mixing for the FCC phase in the Co–Cr–Fe–Mn–Ni system and the BCC phase in the Mo–Nb–Ta–V–W system at T = 1273 K are illustrated in Fig. 3 using the CALPHAD method. The ideal configurational entropies are also shown as a reference in dashed lines. Due to the presence of a short-range order, or segregation, and the contribution from the lattice phonon vibration, or magnetic contribution, the total entropy of mixing
 $\left( {\Delta S_{{\rm{mix}}}^\varphi } \right)$
for HEAs may not always follow ideal mixing and can cause positive or negative deviation from
 $- R\sum\limits_i {{c_i}\ln {c_i}}$
(i.e., excess entropy). The excess entropy
 $\left( {^{{\rm{ex}}}S_{{\rm{mix}}}^\varphi } \right)$
of a solution phase (φ) is calculated by subtracting the ideal configurational entropy from the total entropy of the alloy
 $\left( {\Delta S_{{\rm{mix}}}^\varphi } \right)$
Reference Zhang, Gao, Gao, Yeh, Liaw and Zhang28
:
 $$^{{\rm{ex}}}S_{{\rm{mix}}}^\varphi = \Delta S_{{\rm{mix}}}^\varphi + R\sum\limits_i {{c_i}\ln {c_i}} \quad .$$
Calculated total entropy of mixing at T = 1273 K using the TCNI8 database for: (a) the FCC phase in the Co–Cr–Fe–Ni system; (b) the FCC phase in the CoCr x , CoFeCr x , CoFeNiCr x , and CoFeMnNiCr x systems; (c) the BCC phase in the Mo–Nb–Ta–W system; and (d) the BCC phase in the MoV x , MoNbV x , MoNbTaV x , and MoNbTaWV x systems. The star symbols in (b) and (d) mark the equimolar compositions. The dashed curves represent the ideal mixing.

The FCC phase in the Co–Cr–Fe–Mn–Ni system [Figs. 3(a) and 3(b)] exhibits a positive deviation from the ideal mixing and thus positive excess entropy for equal and near-equimolar compositions. The maximum excess entropy becomes smaller with increasing the number of components [Fig. 3(b)]. The compositions with the highest
 $\Delta S_{{\rm{mix}}}^{{\rm{FCC}}}$
also do not necessarily occur at the equimolar compositions. In contrast, the BCC phase in the Mo–Nb–Ta–V–W system [Figs. 3(c) and 3(d)] shows a negative deviation from the ideal mixing, and thus the negative excess entropy at equal and near-equimolar compositions except that the Mo–V binary shows an ideal mixing behavior [Fig. 3(d)]. At equimolar compositions, the calculated entropy of mixing for both FCC and BCC phases increases with increasing the number of components, suggesting the dominance of configurational entropy over other entropy sources at T = 1273 K. However, the contrasting behavior in the excess entropy between FCC and BCC structures indicates that the other entropy sources such as the vibrational entropy of mixing may also be important, as revealed from DFT calculations (see Sec. IV.B).
B. DFT calculations: enthalpy of formation and entropy sources
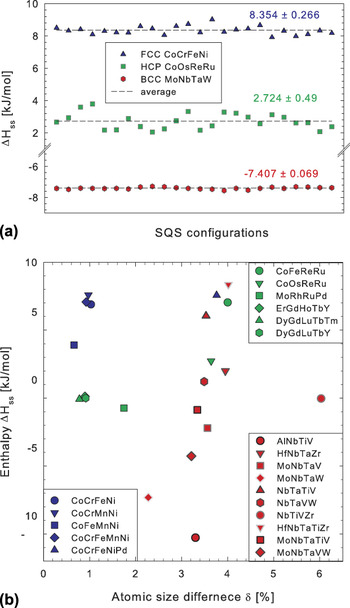
In general, SQS models tend to maximize random distributions of atoms in the lattice, but the permutation in the atomic position between elements may alter the local atomic environment and accordingly the fluctuation in the energy. The total number of atomic configurations for an HEA SQS model that result from atomic permutation scales up almost exponentially with increasing the number of equimolar components, and it is 24 for an equimolar quaternary HEA (4! = 24) and 120 for an equimolar quinary HEA (5! = 120). To examine the effect of element permutation on the enthalpy of formation (ΔH SS), DFT calculations were carried out on all 24 configurations of FCC CoCrFeNi, BCC MoNbTaW, and HCP CoOsReRu, and the results are shown in Fig. 4(a). The averaged ΔH SS are 8.354 ± 0.266 kJ/mol, −7.407 ± 0.069 kJ/mol, and 2.724 ± 0.49 kJ/mol for CoCrFeNi, MoNbTaW, and CoOsReRu, respectively. Relatively speaking, CoOsReRu is a bit more sensitive to the atomic configuration than the other two structures, presumably due to the anisotropy of the HCP structure compared to the cubic structure. Other factors that may also contribute to the sensitivity with respect to the atomic configuration in SQS models are electronegativity, magnetism, and atomic size of the constituent elements. It can be assumed that this sensitivity may decrease with increasing the SQS cell size which, however, may increase the computing time substantially.
(a) Enthalpy of formation (ΔH SS) versus SQS configurations for FCC CoCrFeNi, BCC MoNbTaW, and HCP CoOsReRu. (b) DFT-calculated enthalpy of formation versus atomic size difference for various single-phase HEAs with the FCC, BCC, and HCP structures at zero temperature.

The calculated ΔH SS for widely studied single-phase HEAs are shown in Fig. 4(b). Note that only one randomly chosen atomic configuration of the SQS model was used in the calculations (except CoCrFeNi, MoNbTaW, and CoOsReRu whose averaged ΔH SS was used), so a small fluctuation in ΔH SS is expected upon atomic permutation tests. For FCC and HCP HEAs, the calculated ΔH SS is positive or close to zero. BCC AlNbTiV has the most negative ΔH SS at −10.3 kJ/mol, followed by BCC MoNbTaW. Addition of HCP metals such as Hf, Ti, and Zr to BCC refectory metals causes a near-zero, or even positive, ΔH SS.
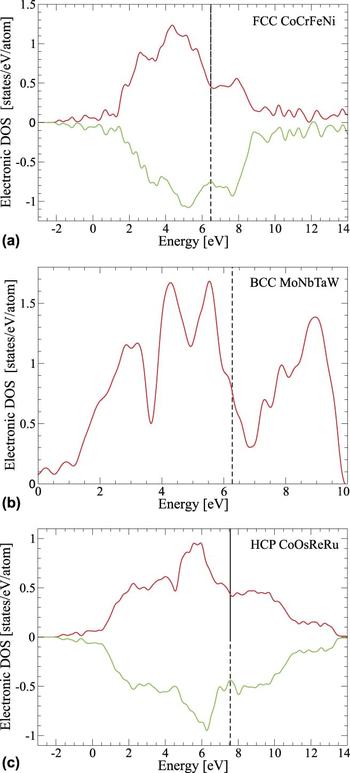
The electronic DOS for FCC CoCrFeNi, BCC MoNbTaW, and HCP CoOsReRu is shown in Fig. 5. Integration of the difference between spin-up and spin-down electronic DOS gives rise to the magnetic moment, which is 0.62 ± 0.03 μB/atom for CoCrFeNi and 0.11 ± 0.02 μB/atom for CoOsReRu (here μB = Bohr magneton), averaged from total 24 atomic configurations. A clear pseudo-gap exists only for MoNbTaW, and the Fermi level sits on the left edge to the gap. Existence of a deep pseudo-gap of an alloy usually suggests thermodynamic stability, and this is consistent with the negative ΔH SS of −7.407 kJ/mol for BCC MoNbTaW. Conversely, the Fermi levels of CoCrFeNi and CoOsReRu sit on (relatively speaking) a plateau with a low DOS.
DFT-calculated electronic DOS for (a) FCC CoCrFeNi, (b) BCC MoNbTaW, and (c) HCP CoOsReRu. The vertical dashed lines mark the Fermi level.

The entropy sources of a solid solution phase may comprise contributions from the lattice vibration (S vib), configuration (S conf), electronic excitation (S elec), and magnetic spin fluctuations (S mag):
 $${S^{{\rm{total}}}} = {S^{{\rm{vib}}}} + {S^{{\rm{conf}}}} + {S^{{\rm{elec}}}} + {S^{{\rm{mag}}}}\quad .$$
Since the critical magnetic ordering temperatures for FCC CoCrFeNi and CoCrFeMnNi are well below room temperature, Reference Lucas, Mauger, Munoz, Xiao, Sheets, Semiatin, Horwath and Turgut53,Reference Lucas, Belyea, Bauer, Bryant, Michel, Turgut, Leontsev, Horwath, Semiatin, McHenry and Miller54 it is sensible to assume that their magnetic entropy term should be temperature independent and thus can be ignored at T ≥ 293 K for simplicity. The HCP CoOsReRu HEA was first suggested by Gao and Alman, Reference Gao and Alman25 and there are no experiments reported yet.
Figure 6(a) presents the phonon DOS of FCC CoCrFeNi, BCC MoNbTaW, and HCP CoOsReRu. Excellent agreement in the phonon DOS for CoCrFeNi with the experiment Reference Lucas, Mauger, Munoz, Xiao, Sheets, Semiatin, Horwath and Turgut53 is evident. At low energies (less than 10 meV), the phonon DOS is comparable for CoCrFeNi and CoOsReRu, but both are smaller than MoNbTaW. In contrast, the calculated vibrational heat capacity [C V, see Fig. 6(b)] is very similar for all three alloys, although it is slightly larger for CoOsReRu and MoNbTaW than that for CoCrFeNi at T ≤ 400 K. At higher temperatures, the vibrational C V approaches the theoretical limit 3R.
(a) DFT-calculated vibrational DOS using the harmonic approximation. The experimental data for FCC CoCrFeNi was measured by Lucas et al.
Reference Lucas, Mauger, Munoz, Xiao, Sheets, Semiatin, Horwath and Turgut53
(b) DFT-calculated vibrational heat capacity at a constant volume. (c) DFT- and MC/MD-predicted entropies of mixing from lattice configurations (S
conf), phonon vibrations
 $\left( {\Delta S_{{\rm{mix}}}^{{\rm{vib}}}} \right)$
, and electron excitations
 $\left( {\Delta S_{{\rm{mix}}}^{{\rm{elec}}}} \right)$
. (d) Total entropy of mixing based on (c).

Alloy entropies of mixing (ΔS mix) are calculated by subtracting the composition–weighted total entropies of the constituent elements from the entropy of the alloy for total entropy, vibrational entropy, and electronic entropy, respectively. DFT-calculated total vibrational and electronic entropies for FCC CoCrFeNi, BCC MoNbTaW, and HCP CoOsReRu were reported elsewhere. Reference Gao, Niu, Jiang, Irving, Gao, Yeh, Liaw and Zhang36,Reference Gao, Zhang, Gao, Zhang, Ouyang, Widom and Hawk48 The vibrational entropies of pure elements of FCC Co, BCC Cr, antiferromagnetic FCC Fe, and FCC Ni were used for calculating the ΔS mix of CoCrFeNi. FCC Cr was discarded because of the presence of 64 imaginary vibrational modes (out of a total of 324 modes) and its elastic instability.
The calculated ΔS
mix from various entropy sources for these HEAs are shown in Fig. 6(c). The calculated entropies of mixing for these three HEAs in descending order are: S
conf ≫
 $\left| {\Delta S_{{\rm{mix}}}^{{\rm{vib}}}} \right|$
≫
 $\left| {\Delta S_{{\rm{mix}}}^{{\rm{elec}}}} \right|$
. At a temperature close to the solidus temperatures, the calculated S
conf is fairly close to their ideal value (R ln 4) and start to decrease very gradually until the temperature reaches 1100 K. At lower temperatures, S
conf decreases rapidly, signaling the development of chemical short-range order in the alloys. Note that S
conf at room temperature is much lower for MoNbTaW than for the others due to the tendency in forming the ordered BCC (i.e., B2) as revealed by Widom et al.
Reference Widom, Huhn, Maiti and Steurer32,Reference Huhn and Widom47
The vibrational entropies of mixing (ΔS
vib) approach constant values at temperatures above the Debye temperature (i.e., T ≥ ∼400 K), namely, +2.8 J/K/mol, −3.6 J/K/mol, and −0.4 J/K/mol for CoCrFeNi, MoNbTaW, and CoOsReRu, respectively. This is because the heat capacities approach their classical limit at 3R. In contrast, the calculated
 $\Delta S_{{\rm{mix}}}^{{\rm{elec}}}$
values are close to zero. The sum of all entropy sources shows that the total entropy of the mixing in descending order for these alloys is: CoCrFeNi > CoOsReRu > MoNbTaW [Fig. 6(d)].
V. ELASTIC PROPERTIES
Single-crystal elastic constants (C ij ) are derived by performing six finite distortions of the lattice as implemented in VASP Reference Le Page and Saxe55,Reference Gao, Suzuki, Schweiger, Doğan, Hawk and Widom56 through the basic elastic stress–strain relationship:
 $${\sigma _i} = \sum\limits_{j = 1}^6 {{C_{ij}}{\varepsilon _j}} \quad ,$$
where σ i , ε j , and C ij , are the elastic stress, strain, and tensor in the Voigt notation, respectively. Since the local chemical environment in an SQS lattice may not be perfectly random or isotropic for HEAs, an averaging scheme proposed by Gao et al. Reference Gao, Suzuki, Schweiger, Doğan, Hawk and Widom56 to obtain single-crystal C 11, C 12, and C 44 for cubic structures was adopted in this work:
 $${C_{11}} = {{{C_{11}} + {C_{22}} + {C_{33}}} \over 3}\quad ,$$
 $${C_{12}} = {{{C_{12}} + {C_{23}} + {C_{13}}} \over 3}\quad ,$$
 $${C_{44}} = {{{C_{44}} + {C_{55}} + {C_{66}}} \over 3}\quad .$$
The polycrystalline bulk modulus is determined by:
 $$B = {1 \over 3}\left( {{C_{11}} + 2{C_{22}}} \right)\quad .$$
The polycrystalline shear modulus (G) is estimated as the simple average of G V and G R, which is given by:
 $$\eqalign{ {G_{\rm{V}}} = {{\left( {{C_{11}} - {C_{12}} + 3{C_{44}}} \right)} \over 5}\quad , \cr {G_{\rm{R}}} = {{5\left( {{C_{11}} - {C_{12}}} \right){C_{44}}} \over {4{C_{44}} + 3\left( {{C_{11}} - {C_{12}}} \right)}}\quad . \cr}$$
The poisson’s ratio (ν) of the alloy can be derived from the bulk modulus (B) and the shear modulus (G) of the alloy:
 $$\nu = {{3B - 2G} \over {2\left( {3B + G} \right)}}\quad .$$
The average Poisson’s ratio
 $\left( {\bar \nu } \right)$
of the alloy was estimated by:
 $$\bar \nu = {{3\bar B - 2\bar G} \over {2\left( {3\bar B + \bar G} \right)}}\quad ,$$
where
 $\bar B$
and
 $\bar G$
are the average bulk modulus and shear modulus of the alloy estimated using the ROM.
The necessary and sufficient conditions for cubic crystals to be mechanically stable are proposed by Born and Huang Reference Born and Huang57 :
 $${C_{11}} - {C_{12}} > 0;\;{C_{11}} + 2{C_{12}} > 0;\;{C_{44}} > 0\quad .$$
Consequently, the Poisson’s ratio of a mechanical stable crystal should be: −1 < ν < 0.5. However, Feng and Widom Reference Feng and Widom58 showed that elements Hf, Ti, and Zr in the BCC structure are mechanically unstable since their DFT calculations predict C 12 > C 11. For consistency in the comparison, the lattice parameters and elastic properties of BCC Hf, Ti, and Zr calculated by Feng and Widom, Reference Feng and Widom58 Tian et al., Reference Tian, Wang, Harris, Irving, Zhao and Vitos59 and Ge et al. Reference Ge, Tian and Wang60 were used to calculate the average properties of BCC HEAs (see Table SII in Supplementary Material). Similarly, the present DFT work predicts the elastic constants of FCC Cr to be: C 11 = 26 GPa, C 12 = 348 GPa, C 44 = −87 GPa, resulting in unphysical values of G = −112 GPa and ν = 0.78. In contrast, the calculated elastic properties of BCC Cr in the antiferromagnetic state are: C 11 = 434 GPa, C 12 = 59 GPa, C 44 = 96 GPa, B = 184 GPa, G = 126 GPa, ν = 0.22, and they satisfy the stability criteria set by Eq. (14). Therefore, the mechanically stable BCC Cr is used instead to calculate the average properties of FCC CoCrFeNi and FCC CoCrFeMnNi in the present work (see Table SIII in Supplementary Material).
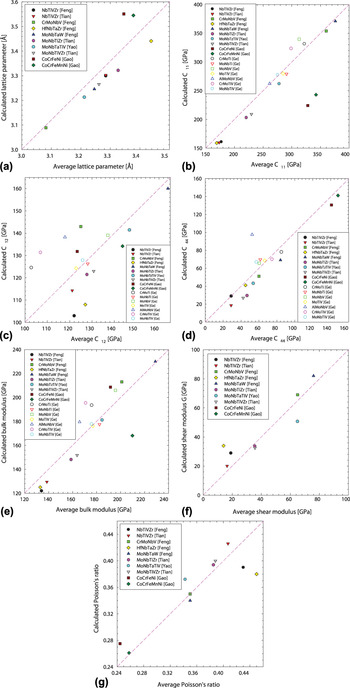
The lattice parameters and elastic properties of select equimolar HEAs that were computationally studied by Gao et al., Reference Gao, Niu, Jiang, Irving, Gao, Yeh, Liaw and Zhang36 Feng and Widom, Reference Feng and Widom58 Tian et al., Reference Tian, Wang, Harris, Irving, Zhao and Vitos59 and Ge et al., Reference Ge, Tian and Wang60 were assessed in this work. Four ternary BCC, eight quaternary BCC, two quinary BCC, one quaternary FCC, and one quinary FCC equimolar alloys were studied. The elastic properties of single-phase HEAs were previously reviewed by Gao et al. Reference Gao, Niu, Jiang, Irving, Gao, Yeh, Liaw and Zhang36 and Tian et al. Reference Tian, Wang, Irving, Vitos, Gao, Yeh, Liaw and Zhang35,Reference Tian, Varga, Shen and Vitos61 The data are provided in Table SIV (Supplementary Material), and the comparison in the lattice parameters and elastic properties between DFT calculations and the ROM is shown in Fig. 7. For BCC HEAs, DFT calculations slightly underestimated the lattice parameter compared with the averaged values [Fig. 7(a)]. For FCC CoCrFeNi and CoCrFeMnNi, DFT calculations overestimated the lattice parameters compared with the averaged values presumably because the lattice parameter of BCC Cr with two atoms in the unit cell, which is significantly smaller than that of FCC Cr (see Table SIII), was used for the ROM. Excellent agreement in C 11 between calculations and averages is observed except for the FCC HEAs [Fig. 7(b)] probably because the property of BCC Cr was used. The C 12 values scatter much more widely than those of C 11 or C 44 [Figs. 7(b)–7(d)]. The distribution of B, G, and ν is close to the equality lines with a minor scatter [Figs. 7(e)–7(g)].
Comparison between DFT calculations and the ROM in: (a) lattice parameter (a), (b–d) single-crystal elastic constants (C 11, C 12, and C 44), (e) polycrystalline bulk modulus (B), (f) polycrystalline shear modulus (G), and (g) polycrystalline Poisson’s ratio (ν). The data shown are taken from the work by Gao et al., Reference Gao, Niu, Jiang, Irving, Gao, Yeh, Liaw and Zhang36 Feng and Widom, Reference Feng and Widom58 Tian et al., Reference Tian, Wang, Harris, Irving, Zhao and Vitos59 and Ge et al. Reference Ge, Tian and Wang60

VI. DISCUSSION
Predicting the formation of single-phase HEA compositions has been an intense research topic Reference Zhang, Zuo, Tang, Gao, Dahmen, Liaw and Lu3,Reference Zhang, Zhou, Lin, Chen and Liaw6–Reference Gao, Niu, Jiang, Irving, Gao, Yeh, Liaw and Zhang36,Reference Wang, Guo and Liu62 and yet the total number of single-phase HEAs confirmed by experiments is still very limited. Reference Gao, Gao, Yeh, Liaw and Zhang30,Reference Gao, Zhang, Gao, Zhang, Ouyang, Widom and Hawk48 Single-phase HEAs with the total number of principal elements greater than five are very scarce, including senary compositions (HfNbTaTiVZr, Reference Gao, Zhang, Yang and Guo21 MoNbTaTiVW, Reference Zhang, Gao, Zhang, Yang and Guo29 CrMoNbTaVW, Reference Zhang, Gao, Zhang, Yang and Guo29 and MoNbReTaVW Reference Bei38 ) and septenary compositions (MoNbReTaTiVW, Reference Bei38 CrMoNbReTaVW, Reference Zhang, Mu, Gao, Meng and Guo63 and CuIrNiPdPtRh Reference Sohn, Liu, Liu, Gong, Prades-Rodel, Blatter, Scanley, Broadbridge and Schroers64 ). Strictly speaking, formation of single-phase HEAs is the direct consequence of multiphase competition as a function of temperature and composition toward minimizing the total Gibbs free energy of the system, and thus the CALPHAD method is the ideal tool for tackling phase stability in multicomponent systems such as HEAs. However, most commercial databases are intended for compositions that are enriched in the principal element, and thus simple extrapolation to the compositional center of a phase diagram may produce inaccurate or even wrong predictions. Other databases that are dedicated to HEAs may not cover all constituent binaries and ternaries in their entire composition and temperature ranges. Other roadblocks to developing a reliable database include lack of sufficient experimental data and/or the lack of physically meaningful descriptions for those hypothetical phases such as endmembers and antiphases. Reference Zhang, Gao, Gao, Yeh, Liaw and Zhang28,Reference Gao, Zhang, Gao, Zhang, Ouyang, Widom and Hawk48
Gao et al. Reference Gao, Zhang, Gao, Zhang, Ouyang, Widom and Hawk48 also analyzed the weakness of those empirical parameters, which included the underlying hypotheses, oversimplified treatment of the entropy of mixing for the solution phase, and the oversimplified treatment of the enthalpy of intermetallic phases. However, if the CALPHAD databases are not available or do not cover all the binaries and ternaries, phase diagram inspection or employing available empirical thermo-physical parameters become especially important in the quick selection of promising elements that are most likely to promote the formation of solid solution phases as opposed to intermetallic phases. Gao Reference Gao, Gao, Yeh, Liaw and Zhang30 first summarized that those experimentally confirmed single-phase HEAs exhibit either an isomorphous solid solution (e.g., the Nb–Mo–Ta–W and Hf–Nb–Ta–Ti–Zr systems) or quite large terminal solubilities (e.g., Co–Fe–Mn–Ni system) in their constituent binaries and ternaries. Gao Reference Gao, Gao, Yeh, Liaw and Zhang30 further highlighted three types of solid solutions in a phase diagram that are important for HEA formation: (i) Isomorphous solid solution (e.g., the FCC phase in the Co–Ni binary and the HCP phase in the Re–Ru binary), (ii) extended terminal solid solubility (e.g., the BCC and HCP phases in the Cr–Ru binary), and (iii) intermediate solid solution (e.g., the HCP phase in the Cr–Rh binary).
Good agreement in predicting the entropy of mixing between DFT calculations and CALPHAD was obtained in the present study. More importantly, DFT calculations illuminated the entropy sources of HEAs and revealed that the positive vibrational entropy of mixing in FCC CoCrFeNi mainly contributes to its positive excess entropy. Alternatively, the negative vibrational entropy of mixing in BCC MoNbTaW mainly contributes to its negative excess entropy. The sign of the vibrational entropy of mixing [Fig. 5(c)] for FCC CoCrFeNi and BCC MoNbTaW seems to coincide with the sign of their enthalpies of formation [Fig. 4(b)]. The presence of a strong short-range order in BCC MoNbTaW Reference Widom, Huhn, Maiti and Steurer32,Reference Widom, Gao, Yeh, Liaw and Zhang33 causes a larger negative enthalpy of formation, decreases the average atomic volume, and, hence, promotes an increase in the phonon vibrational frequency. Conversely, a larger positive enthalpy of formation in FCC CoCrFeNi may enlarge the overall bond length and, hence, increase the average atomic volume, while potentially decreasing the phonon vibrational frequency. The enthalpy of formation of HCP CoOsReRu is close to zero, and this suggests a negligible bond formation in the alloy, which may have little impact on the phonon vibrational frequency. Indeed, the calculated vibrational entropy of mixing is zero for HCP CoOsReRu.
At T > 400 K, the calculated vibrational entropy of mixing is +2.8, −3.6, and −0.3 J/K/mol for FCC CoCrFeNi, BCC MoNbTaW, and HCP CoOsReRu, respectively. Calculated entropies of mixing for these three HEAs in descending order are: S
conf ≫
 $\left| {\Delta S_{{\rm{mix}}}^{{\rm{vib}}}} \right|$
≫
 $\left| {\Delta S_{{\rm{mix}}}^{{\rm{elec}}}} \right|$
. Although the calculated configurational entropies approach the theoretical limit at high temperatures close to their melting points, developing a short-range order can cause a sharp decrease in the configurational entropy at low temperatures. As a result, the total entropy of mixing of an HEA depends on the configurational entropy as well as the vibrational entropy of mixing and is more sensitive to temperature at intermediate and low temperatures. The total entropies of mixing (i.e.,
 $\Delta S_{{\rm{mix}}}^{{\rm{vib}}}$
+
 $\Delta S_{{\rm{mix}}}^{{\rm{elec}}}$
+ S
conf) were observed to trend in the following manner: CoCrFeNi > CoOsReRu > MoNbTaW at T ≥ 300 K.
The solid solution stabilization by phonon vibration was also reported by Fultz et al.
Reference Fultz, Anthony, Robertson, Nicklow, Spooner and Mostoller65
who measured
 $\Delta S_{{\rm{mix}}}^{{\rm{vib}}}$
to be +1.17, +1.67, and +1.78 J/K/mol for disordered BCC solid solution alloys Fe70Cr30, Fe53Cr47, and Fe30Cr70, respectively. However, it is generally not obvious whether a chemical disordering causes a positive or negative vibrational entropy of mixing or whether a disordered alloy will exhibit a greater vibrational entropy than its ordered form. The vibrational entropy of mixing of an alloy may depend on the crystal structure, bonding, and enthalpy of the alloy, as well as the molar volumes and structures of the constituent elements.
Reference Fultz66
For example, Munoz et al.
Reference Munoz, Lucas, Delaire, Winterrose, Mauger, Li, Sheets, Stone, Abernathy, Xiao, Chow and Fultz67
found that the chemical ordering in the B2 structure increases the vibrational entropy by 1.83 J/K/mol, compared to the disordered B2 FeV alloy.
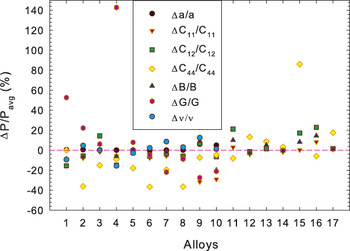
Elastic properties (such as elastic constants and bulk/shear moduli) of a solid solution primarily depend on the interatomic interactions among constituent elements. Intuitively speaking, electron hybridization may result in a strong attractive interaction, and accordingly, a shortened bond length, and a negative enthalpy of formation (ΔH SS). Conversely, repulsive interaction may result in a positive enthalpy of formation. However, for BCC MoNbTaW that has an ΔH SS of −7.4 kJ/mol, its lattice parameter, elastic constants, and average bulk and shear moduli agree well with the averages estimated from ROM. To further examine the distribution of the calculated properties (a, C 11, C 12, C 44, B, G, and ν) with respect to the averaged values from ROM, the change in the properties in percentage is shown in Fig. 8. The maximum ranges in ΔP/P avg are: 0.6% for a except 6.1% for CoCrFeNi and 4.9% for CoCrFeMnNi, 32% for C 11, 23% for C 12, 86% for C 44, 20% for B, 28% for G except extreme cases (143% for HfNbTaZr, and 53% for NbTiVZr), and 16% for ν. To make a meaningful comparison with respect to the averaged values, the properties of the pure elements are in the same crystal structure as the alloy should be used. However, certain elements are mechanically unstable in certain structures, such as FCC Cr and BCC Hf/Ti/Zr, and thus, it is controversial whether it is appropriate to use their properties, although seemingly unphysical, to calculate averaged properties via the ROM.
Distribution in the change of calculated properties (a, C 11, C 12, C 44, B, G, and ν) with respect to the averaged properties. The alloy number is provided in the Table SIV Supplementary Material.

VII. CONCLUSIONS
This work evaluated the empirical thermo-physical parameters for hundreds of single-phase HEAs that were predicted using empirical parameters, CALPHAD, and phase diagram inspections. New septenary, octonary, and ennead BCC refractory HEAs were suggested. Entropy of mixing for three quaternary HEAs were modeled using CALPHAD, DFT, and MC/MD methods. The elastic properties of HEAs were evaluated. The following conclusions were reached:
-
(1) The vast majority of those predicted single-phase HEAs Reference Gao, Gao, Yeh, Liaw and Zhang30 satisfy the reevaluated empirical rules by Gao et al. Reference Gao, Zhang, Gao, Zhang, Ouyang, Widom and Hawk48 except the
 $\Delta {H_{{\rm{IM}}}}/\Delta H_{{\rm{mix}}}^{{\rm{liq}}} \lt \kappa _1^{{\rm{cr}}}$
criterion.
Reference Senkov and Miracle15
However, whether they form a single-phase solid solution awaits future experiment examination.
-
(2) Calculated
$\overline {{\rm{VEC}}}$
values hypothesize that the majority of the alloys suggested by Troparevsky et al.
Reference Troparevsky, Morris, Kent, Lupini and Stocks14
may have the FCC or HCP structures as the main phase in the microstructure. -
(3) Equilibrium calculations, Sheil simulations, and T rd parameters using the TCNI8 database suggest that septenary CrMoNbTaTiVW and octonary CrMoNbReTaTiVW likely form BCC HEAs while ennead CrFeMoNbReRuTaVW may be on the border between the single-phase and multiphase.
-
(4) The TCNI8 database predicts a total entropy of mixing of 13.7 J/K/mol for FCC CoCrFeNi and 10.4 J/K/mol for BCC MoNbTaW at T = 1273 K, which corresponds to an excess entropy of +2.2 and −1.2 J/K/mol, respectively.
-
(5) DFT-calculated averaged enthalpy of formation for FCC CoCrFeNi, BCC MoNbTaW, and HCP CoOsReRu is 8.354 ± 0.266 kJ/mol, −7.407 ± 0.069 kJ/mol, and 2.724 ± 0.49 kJ/mol, respectively, resulting from 24 atomic configurations due to permutation between elements.
-
(6) The DFT-calculated enthalpy of formation of twenty-one single-phase solid solution HEAs are: −10.3 kJ/mol < ΔH SS < +8.4 kJ/mol.
-
(7) Calculated configurational entropies (S conf) for CoCrFeNi, MoNbTaW, and CoOsReRu alloys were fairly equivalent to their ideal value (R ln 4) at temperatures close to their solidus temperatures. However, S conf at room temperature is much lower for MoNbTaW than the others due to the tendency in forming the ordered BCC (i.e., B2) as revealed by Widom et al. Reference Widom, Huhn, Maiti and Steurer32,Reference Huhn and Widom47
-
(8) DFT-calculated phonon DOS for FCC CoCrFeNi is in excellent agreement with the experiment by Lucas et al. Reference Lucas, Mauger, Munoz, Xiao, Sheets, Semiatin, Horwath and Turgut53 At T > 400 K, the calculated vibrational entropy of the mixing is +2.8, −3.6, and −0.3 J/K/mol for FCC CoCrFeNi, BCC MoNbTaW, and HCP CoOsReRu, respectively. Calculated entropies of mixing for these three HEAs in descending order are: S conf ≫
$\left| {\Delta S_{{\rm{mix}}}^{{\rm{vib}}}} \right|$
≫
$\left| {\Delta S_{{\rm{mix}}}^{{\rm{elec}}}} \right|$
. -
(9) The DFT calculations illuminate the entropy sources of HEAs and reveal that the positive vibrational entropy of mixing in FCC CoCrFeNi mainly contributes to its positive excess entropy while the negative vibrational entropy of mixing in BCC MoNbTaW mainly contributes to its negative excess entropy.
-
(10) The total entropies of mixing (i.e.,
$\Delta S_{{\rm{mix}}}^{{\rm{vib}}}$
+
$\Delta S_{{\rm{mix}}}^{{\rm{elec}}}$
+ S
conf) were observed to trend in the following manner: CoCrFeNi > CoOsReRu > MoNbTaW. -
(11) The maximum ranges in the properties with respect to the averaged values estimated from the ROM (i.e., ΔP/P avg) are: 0.6% for the lattice parameter a except 6.1% for CoCrFeNi and 4.9% for CoCrFeMnNi, 32% for C 11, 23% for C 12, 86% for C 44, 20% for the bulk modulus B, 28% for the shear modulus G except for the extreme cases (143% for HfNbTaZr and 53% for NbTiVZr), and 16% for the Poisson’s ratio ν.
-
(12) The uncertainties in the elastic properties for certain elements that are mechanically unstable in certain crystal structures (e.g., FCC Cr, BCC Hf/Ti/Zr) may lead to biased results when estimating the average properties using the ROM (e.g., using FCC Cr versus BCC Cr, using BCC Hf/Ti/Zr versus HCP Hf/Ti/Zr).



DISCLAIMER
The computational modeling work presented in the article is a project that was funded by the Department of Energy, National Energy Technology Laboratory, an agency of the United States Government, through a support contract with AECOM. Neither the United States Government nor any agency thereof, nor any of their employees, nor AECOM, nor any of their employees, make any warranty, expressed or implied, or assumes any legal liability or responsibility for the accuracy, completeness, or usefulness of any information, apparatus, product, or process disclosed or represents that its use would not infringe privately owned rights. Reference herein to any specific commercial product, process, or service by trade name, trademark, manufacturer, or otherwise, does not necessarily constitute or imply its endorsement, recommendation or favoring by the United States Government or any agency thereof. The views and opinions of authors expressed herein do not necessarily state or reflect those of the United States Government or any agency thereof.
Supplementary Material
To view supplementary material for this article, please visit https://doi.org/10.1557/jmr.2017.366.
ACKNOWLEDGMENTS
This work was carried out in support of the Cross-Cutting Technologies Program at the National Energy Technology Laboratory (NETL), managed by Robert Romanosky (Technology Manager). The Research was executed through NETL’s Research and Innovation Center’s Innovative Process Technologies (IPT) Field Work Proposal. Research performed by AECOM Staff was conducted under the RES contract DE-FE-0004000. L.Z. Ouyang acknowledges support by DE-FE-0011549 and DE-NA0002630. Work at Carnegie Mellon was supported under grant DE-SC0014506.