





1 Introduction
Currently, the power scaling of high-power fiber lasers based on large-core fibers is largely constrained by the transverse mode instability (TMI) effect[ Reference Dong, Ballato and Kolis 1 – Reference Eidam, Hanf, Seise, Andersen, Gabler, Wirth, Schreiber, Limpert and Tünnermann 4 ]. TMI refers to a phenomenon where dynamic energy coupling occurs in gain fibers between the fundamental mode (FM) and higher-order modes (HOMs) originating from the thermo-optical effect[ Reference Eidam, Wirth, Jauregui, Stutzki, Jansen, Otto, Schmidt, Schreiber, Limpert and Tünnermann 5 , Reference Smith and Smith 6 ]. Bending the gain fiber would significantly change the loss of HOMs[ Reference Tao, Su, Ma, Wang and Zhou 7 – Reference Schermer and Cole 10 ], and subsequently tailoring the interference features between transverse modes has often served as a direct and effective method to suppress TMI. Tight bending is often considered to benefit TMI suppression through increasing the bending loss of all HOMs. The interference occurred between FM and HOM noise is therefore suppressed[ Reference Beier, Möller, Nold, Sattler, Kuhn, Hupel, Hein, Haarlammert, Schreiber, Eberhardt and Tünnermann 11 ].
Previous studies have shown the feasibility of this approach. Beier et al. [ Reference Beier, Möller, Sattler, Nold, Liem, Hupel, Kuhn, Hein, Haarlammert, Schreiber, Eberhardt and Tünnermann 12 ] enhanced the TMI threshold from 800 W to 2.2 kW by reducing the bending diameter of a commercial 20/400 μm Yb-doped fiber (YDF) from 60 to 14 cm while maintaining single-mode output. Su et al. [ Reference Su, Tao, Wang, Zhang, Ma, Zhou and Xu 13 ] increased the TMI threshold of a single-mode fiber amplifier from 850 W to over 2.43 kW by decreasing the coil diameter of a 20/400 μm fiber. Dong[ Reference Dong 14 ] and Tao et al. [ Reference Tao, Su, Ma, Wang and Zhou 15 ] also shared the same viewpoint through theoretical simulations on the relationship between fiber coiling and TMI. Their work specifically demonstrated that tight bending can significantly improve the TMI threshold for 20/400 and 25/400 μm fibers. Specifically, tight bending is mostly applied to YDFs with relatively small core diameters (e.g., 20 or 25 μm) or, more generally, to fibers with a small normalized frequency V only supporting few guided modes, where bending can induce sufficiently high HOM loss.
For larger-core fibers (≥30 μm), however, the higher V value indicates more guided modes, even if tightening the bend still allows the existence of HOMs[ Reference Huang, Kong, Leng, Zhou, Guo and Cheng 16 ]. Achieving a substantial TMI threshold increase in such fibers would require impractically small bend diameters, typically at the cost of efficiency and severe mode-field distortion[ Reference Nicholson, Fini, Yablon, Westbrook, Feder and Headley 17 ]. Therefore, tight bending may not apply to these fibers for high TMI thresholds. Loose bending, instead, is another completely different method for TMI suppression in such large-core fibers. Increasing the bending radius to reduce HOM loss enhances the gain competition between HOMs, thereby suppressing the interference between FM and HOM noise[ Reference Wen, Wang, Shi, Yang, Xi, Zhang and Wang 18 ]. This approach may become a more viable route for large-core fibers, albeit with degraded beam quality. Researchers from the University of Jena[ Reference Haarlammert, Sattler, Liem, Strecker, Nold, Schreiber, Eberhardt, Tünnermann, Ludewigt and Jung 19 ] first observed in 2015 the rising TMI thresholds while increasing the bending diameters. Zhang et al. [ Reference Zhang, Xu, Xing, Hou, Chen, Li, Dai, Li, Wang and Liao 20 ] elevated the TMI threshold for a 33/400 μm YDF under laser diode (LD) pumping through increasing the bending diameter from 11 to 60 cm, while the laser output state degenerated from single mode to multi-mode. Li et al. [ Reference Li, Li, Wu, Xiao, Leng, Huang, Pan and Zhou 21 ] demonstrated TMI threshold enhancement from 3.5 to 8.3 kW in a backward tandem-pumped fiber laser using a 30/250 μm conventional YDF with bending diameter enlargement, where the M 2 factor degraded from 1.5 to M 2 = 1.8. Yale University[ Reference Chen, Wisal, Eliezer, Stone and Cao 22 ], through numerical simulations, further showed that for fibers supporting more than five modes, the TMI threshold rises nearly linearly with mode count. Multi-mode fiber lasers increase the TMI threshold by exciting multiple modes to distribute power among various modes and thereby weaken the intensity of inter-mode interference[ Reference Chen, Wisal, Eliezer, Stone and Cao 22 , Reference Wisal, Chen, Cao and Stone 23 ], which shares a similar principle with TMI suppression through increased bending. Large-core fibers with a core numerical aperture (NA) ~ 0.06 typically support several modes and the bending losses of the FM and HOMs are relatively close, which generally limits TMI suppression to the second approach, making it challenging to improve the TMI threshold while maintaining beam quality[ Reference Li, Li, Wu, Xiao, Leng, Huang, Pan and Zhou 21 ].
In contrast, both suppression methods might be effective for low-NA fibers[ Reference Cui, Wang, Li, Liu, Pan, Xiao, Chen, Yan, Yang, Ma, Wang and Chen 24 , Reference Wen, Wang, Xi, Zhang, Huang, Yang, Yan, Yang, Shi, Pan, Wang, Wang and Xu 25 ]. The difference in the effective refractive index between the FM and HOMs of low-NA YDFs is enlarged, causing a larger difference in their bending losses[ Reference Tao, Ma, Wang, Zhou and Liu 26 ]. At small bend diameters, the HOM loss is relatively high, similar to the loss behavior of small-core fibers (e.g., 20 μm), enabling TMI suppression via tight bending[ Reference Beier, Möller, Nold, Sattler, Kuhn, Hupel, Hein, Haarlammert, Schreiber, Eberhardt and Tünnermann 11 ]. At larger bend diameters, the HOM loss characteristic resembles that of conventional large-core fibers, allowing TMI suppression via strong inter-mode gain competition. Compared to conventional fibers, low-NA fibers can more readily maintain good beam quality while utilizing the loose coiling owing to the small V value[ Reference Chen, Ye, Huang, Yang, Wu, Yan, Pan, Wang, Wang and Zhou 27 ]. However, it remains unclear which route has more potential and is effective for TMI suppression in low-NA fibers. A systematic comparison of the TMI threshold improvement achieved by the two approaches remains lacking.
This study systematically explores the evolution of the TMI thresholds under two approaches in both conventional fibers and low-NA fibers through numerical analysis, demonstrating completely different effects on the two kinds of fibers. Building on the analysis, the TMI threshold and beam quality at various bending diameters using a large-core, ultralow-NA YDF in a backward tandem-pumped configuration are investigated. The experimental results coincide with simulation analysis, achieving 8-kW output with M 2 ~ 1.33 through optimization of the bend diameter.
2 Numerical analysis
2.1 Fundamentals
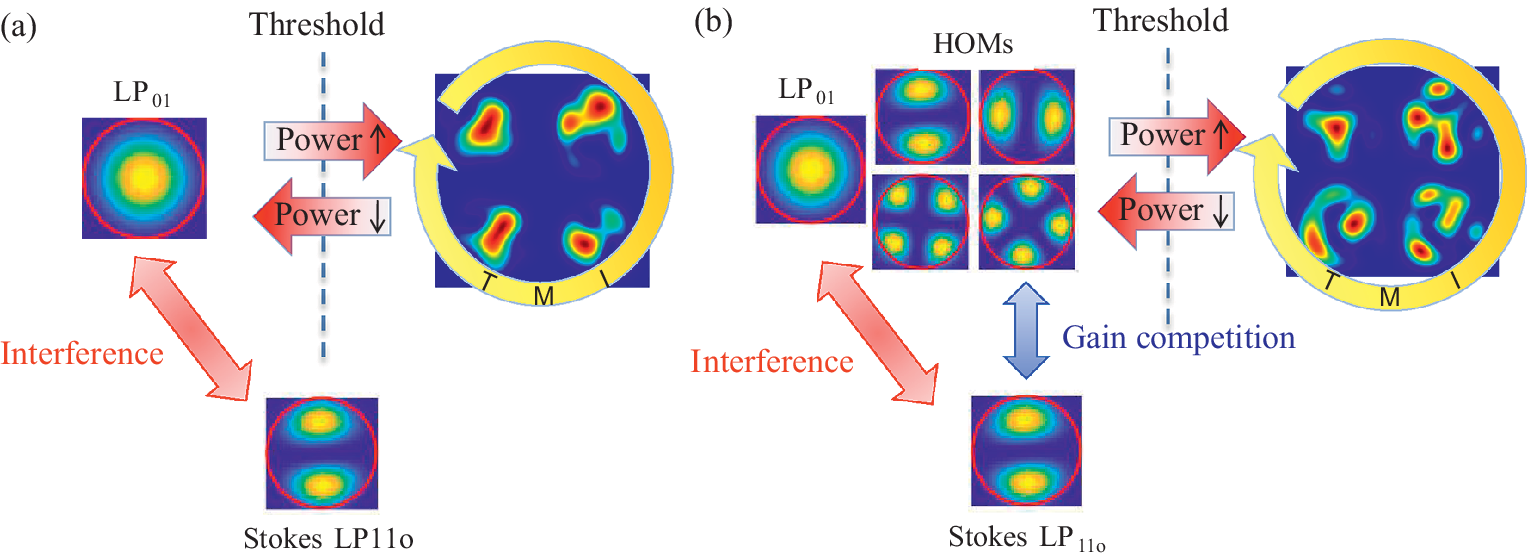
It is necessary to clarify the mechanisms and applicable conditions of the two bending methods for suppressing TMI. Conventional TMI theory[ Reference Jauregui, Eidam, Otto, Stutzki, Jansen, Limpert and Tünnermann 28 ] primarily focuses on single-mode operation (for example, fibers with small core diameters or low V value), generally assuming that the signal light in the fiber is an ideal FM. When the power exceeds the threshold, the FM dramatically interferes with the Stokes LP11 mode originating from quantum noise, leading to TMI[ Reference Jauregui, Eidam, Otto, Stutzki, Jansen, Limpert and Tünnermann 28 ], as illustrated in Figure 1(a). The traditional method of increasing the TMI threshold by tight bending works essentially by raising the bending loss of all HOMs, which directly suppresses the amplification of the Stokes LP11 mode, thereby inhibiting the interference between the FM and the Stokes LP11 mode and making TMI less likely to occur[ Reference Lei, Qi, Liu, Yang, Zheng and Zhou 29 ]. For multi-mode fibers (with larger core diameter and higher V value), however, the signal light usually contains multiple modes, as shown in Figure 1(b). The HOMs from the signal light are incoherent with the FM and have a relatively high proportion compared with the Stokes LP11 mode[ Reference Chu, Tao, Li, Lin, Wang, Guo, Wang, Jing and Tang 30 ]. These HOMs compete with the Stokes LP11 mode and thereby reduce the gain of the Stokes LP11 mode. Therefore, loose bending aims to intensify the gain competition between the HOMs and Stokes LP11 mode through decreasing the HOM loss. In this scenario, more pump power is required to satisfy the dynamic coupling condition of TMI, which achieves the improvement of the TMI threshold[ Reference Li, Huang, Wu, Wang and Zhou 31 ]. Nevertheless, it should be noted that the TMI enhancement is obtained at a cost of beam quality degradation due to the amplification of HOMs. From the mechanisms of the two suppression methods, the key difference lies in the mode state of the laser. The tight bending method is suitable for lasers operating in a single-mode output state, while the loose bending method is more appropriate for lasers operating in a few-mode or even multi-mode output state.
TMI evolution: (a) single-mode regime; (b) multi-mode regime.

Figure 1. Long description
Panel a shows the single-mode regime. On the left is a circular intensity profile labeled L P sub 01 with a central yellow peak. A red double-headed arrow labeled Interference connects this to a lower profile labeled Stokes L P sub 11o. A vertical dashed blue line labeled Threshold separates the left side from the right. Two horizontal arrows cross this line. The top arrow points right toward an increase in power, leading to a circular profile labeled T M I containing four distinct intensity lobes. A yellow curved arrow wraps around this profile. The bottom arrow points left toward a decrease in power.
Panel b shows the multi-mode regime. It mirrors the structure of panel a but adds a cluster of four H O M s (Higher Order Modes) intensity profiles above the interference path. A blue double-headed arrow indicates Gain competition between these H O M s and the Stokes L P sub 11o profile. The T M I profile on the right of panel b shows a more complex, fragmented intensity distribution compared to panel a, indicating the multi-mode influence.
The LP11o mode exhibits the smallest bending loss among all HOMs. According to Ref. [Reference Li, Li, Wu, Xiao, Leng, Huang, Pan and Zhou21], when the loss of the LP11o mode exceeds 0.5 dB/m, the laser is considered to be in single-mode output state. When its loss is below 0.5 dB/m, the laser operates in a few-mode state. Referring to the above, the loss behavior of a fiber can be divided into a low-loss region and a high-loss region. When its loss exceeds 0.5 dB/m, the fiber is considered to be in the high-loss region, and a larger HOM loss contributes to a higher TMI threshold. When the LP11o mode loss is below 0.5 dB/m, the fiber is in the low-loss region; here, a smaller HOM loss strengthens gain competition, thereby raising the TMI threshold. Furthermore, according to Refs. [Reference Chen, Wisal, Eliezer, Stone and Cao22,Reference Wisal, Chen, Cao and Stone23], when suppressing Stokes HOMs via inter-mode gain competition, a larger number of supported HOMs weaken the inter-mode interaction strength, making TMI less likely to occur. Hence, in the low-loss region, a lower HOM loss and more modes supported would result in a higher TMI threshold. Based on the above conclusions, detailed comparative analysis is conducted.
2.2 Characteristics of TMI thresholds for conventional YDF and low-NA YDF
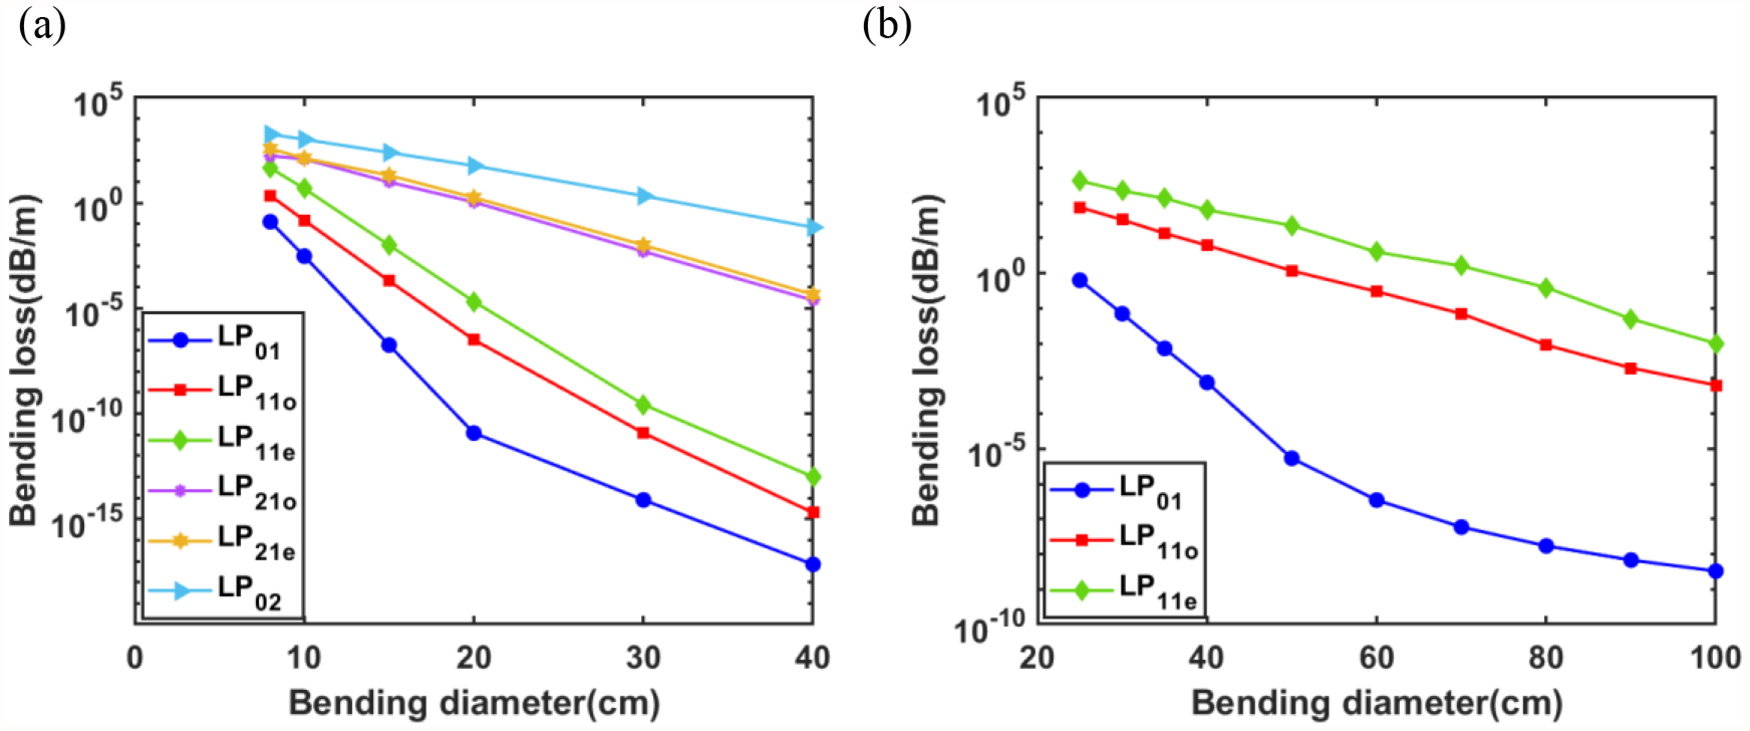
Firstly, the bending loss and TMI threshold variations with respect to bending diameters between conventional fibers and low-NA fibers are compared. Previous experimental and theoretical studies conducted on a conventional fiber with a core/cladding diameter of 30/250 μm and a core NA of 0.06 provided a reliable practical reference[ Reference Li, Wu, Xiao, Chen, Leng, Huang, Pan and Zhou 32 , Reference Wu, Li, An, Li, Chen, Xiao, Huang, Yang, Yan, Leng, Pan and Zhou 33 ]. Therefore, a 30/250μm YDF with NA ~ 0.06 is selected as the reference in this analysis. This fiber supports five modes: LP01, LP11, LP21, LP02 and LP31. To highlight the comparison, a low-NA fiber with the same core/cladding diameter but a reduced core NA of 0.04 is used, which supports only two modes: LP01 and LP11. Based on the above fiber parameters, the bending losses of the various modes under different bending diameters were calculated using finite element simulation, as shown in Figure 2. Since the loss of the LP31 mode exceeds 50 dB/m across the entire bending range examined – significantly higher than that of other HOMs – its influence on the mode evolution characteristics within the fiber is considered negligible. Therefore, only the bending-loss variations of the first four modes (LP01, LP11, LP21, LP02) are considered in the analysis. Furthermore, to ensure proper FM transmission, it is generally required that the bending loss of the FM remains below 0.1 dB/m[ Reference Li, Chen, Liu, Gray, Wang, Walton and Zenteno 34 ], which defines the minimum allowable bend radius.
Bending loss of different modes versus bending diameters of (a) 30/250 μm, NA ~ 0.06 YDF and (b) 30/250 μm, NA ~ 0.04 YDF.

Figure 2. Long description
The figure consists of two panels, a and b, both plotting Bending loss in decibels per meter on a logarithmic Y-axis against Bending diameter in centimeters on a linear X-axis.
Panel a describes a 30 forward slash 250 micrometer fiber with N A approximately 0.06. The X-axis ranges from 0 to 40 centimeters. Six modes are plotted, all showing a logarithmic decrease in loss as bending diameter increases. From lowest to highest loss at 40 centimeters, the modes are:
* L P sub 0 1 (blue circles): Decreases sharply from 10 super -1 to 10 super -17.
* L P sub 1 1 o (red squares): Decreases from 10 super 0 to 10 super -15.
* L P sub 1 1 e (green diamonds): Decreases from 10 super 2 to 10 super -13.
* L P sub 2 1 o (purple diamonds): Decreases from 10 super 3 to 10 super -4.
* L P sub 2 1 e (yellow stars): Decreases from 10 super 3 to 10 super -4, overlapping with L P sub 2 1 o.
* L P sub 0 2 (light blue triangles): Highest loss, decreasing from 10 super 4 to 10 super -1.
Panel b describes a 30 forward slash 250 micrometer fiber with N A approximately 0.04. The X-axis ranges from 20 to 100 centimeters. Three modes are plotted:
* L P sub 0 1 (blue circles): Decreases from 10 super 0 at 25 centimeters to 10 super -9 at 100 centimeters.
* L P sub 1 1 o (red squares): Decreases from 10 super 2 to 10 super -3.
* L P sub 1 1 e (green diamonds): Decreases from 10 super 3 to 10 super -2.
Figure 2 depicts the bending loss versus bending diameter for the conventional fiber and the low-NA fiber, respectively. For the conventional fiber, the bending losses of the LP01 mode and LP11 mode remain relatively close. In the high-loss region, the difference between the losses of LP01 and LP11o is only about one order of magnitude. In the low-loss region, both LP01 and LP11 exhibit bending losses below 10–10 dB/m, and LP21 and LP02 also remain well-guided. In contrast, for the low-NA fiber, the loss gap between LP01 and LP11 modes is consistently large. At a bending diameter of 30 cm belonging to the high-loss region where the FM loss is 0.07 dB/m, the bending loss of LP11o reaches 33 dB/m – a difference of nearly three orders of magnitude. In the low-loss region, the losses of the LP11o and LP11e modes fall below 10–2 dB/m, whereas their loss values are considerably higher than those of the HOMs in the conventional fiber at similar FM loss levels, indicating that HOM loss in low-NA fibers cannot reach the extremely low values attainable in conventional fibers. Based on the analysis above, under high-loss conditions, low-NA fibers exhibit greater HOM bending loss, which likely facilitates superior TMI suppression compared to conventional fibers. Conversely, in low-loss conditions, conventional fibers achieve lower HOM loss and support more modes than low-NA fibers. Increasing the bending diameter to enhance TMI suppression might be more effective for conventional fibers than for low-NA fibers.
According to the preceding analysis, the TMI thresholds of the conventional fiber and the low-NA fiber are further calculated under various bend diameters. Using a modified stimulated thermal Rayleigh scattering (STRS) model[ Reference Li, Huang, Wu, Pan and Zhou 35 ] that takes into account transverse mode gain competition, the TMI thresholds were investigated in a backward tandem-pumped configuration. When the power of the Stokes LP11o mode increased to 5% of the total output power of all transverse modes, the output power at this point is defined as the TMI threshold power. Compared with forward pumping, backward pumping leads to more pronounced trends in TMI threshold variation[ Reference Dong 14 ]. To simplify the calculation, we assume that the seed only contains LP01 and LP11o modes, with initial seed powers of 90 and 10 W, respectively. This assumption is reasonable for high beam quality seeds in the experiment. Other simulation parameters are listed in Table 1.
The main parameters in the simulation.

Table 1. Long description
The table is divided into two parallel sections, each containing columns for Parameter, Description, and Value.
Left Section Parameters:
* D sub core (mu m): Core diameter is 30.
* N (m super -3): Doping concentration of Y b 3 plus is 5.8 times 10 super 25.
* P sub seed (W): Seed power is 100.
* lambda sub s (nm): Signal wavelength is 1080.
* sigma sub as (m super 2): Absorption cross-section of the signal laser is 2.35 e -27.
* sigma sub es (m super 2): Emission cross-section of the signal laser is 2.72 e -25.
Right Section Parameters:
* D sub clad (mu m): Cladding diameter is 250.
* L sub Y D F (m): Y D F length is 40.
* tau (mu s): Excited state lifetime is 901.
* lambda sub p (nm): Pump wavelength is 1018.
* sigma sub ap (m super 2): Absorption cross-section of the pump laser is 8.19 e -26.
* sigma sub ep (m super 2): Emission cross-section of the pump laser is 6.28 e -25.
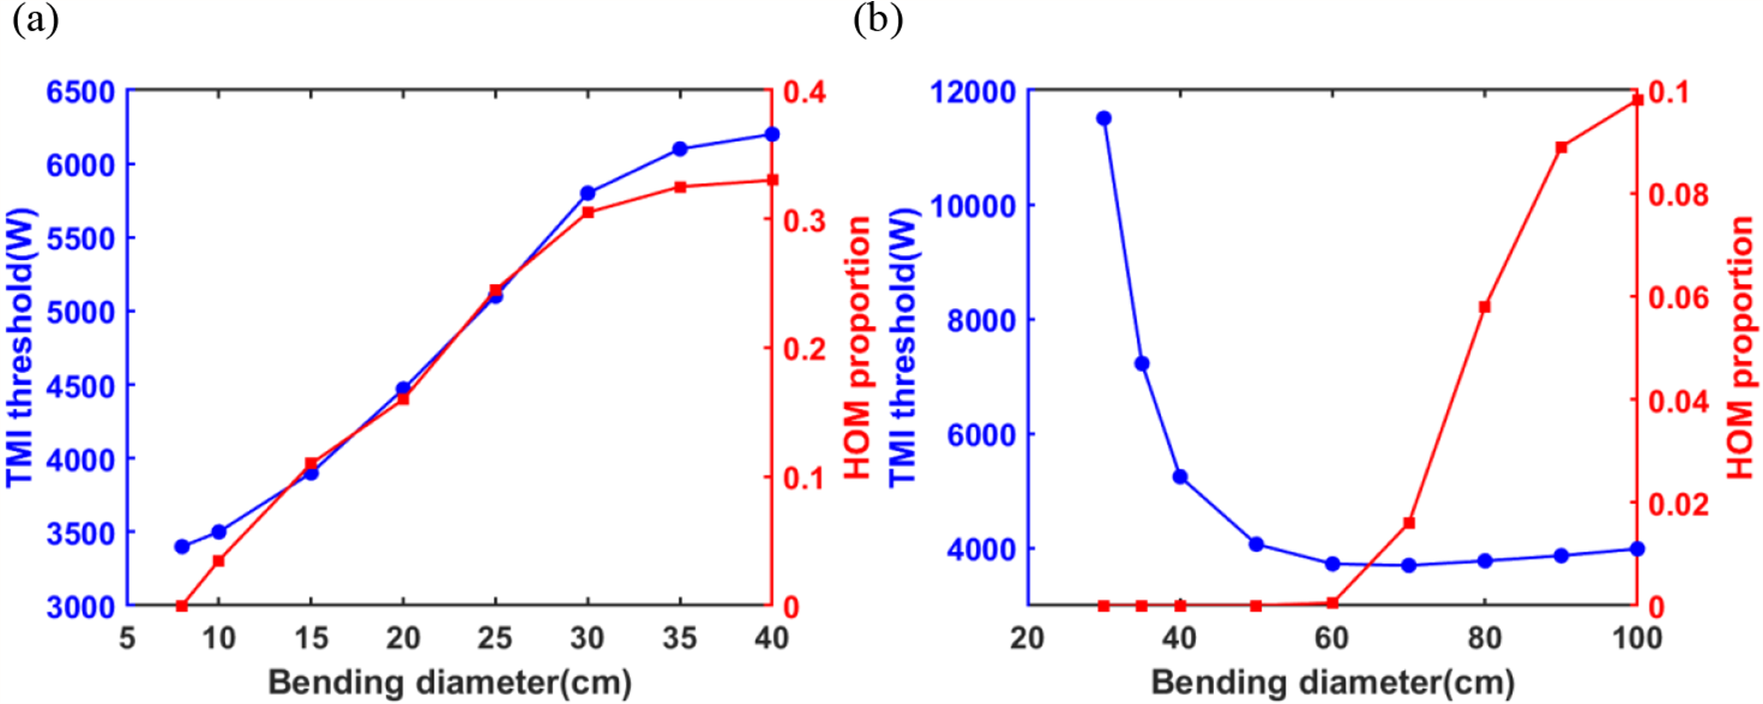
The calculated TMI thresholds and the corresponding HOM proportion versus bending diameter for the two fibers are shown in Figure 3. For the conventional fiber, the TMI threshold generally increases as the bending diameter increases. However, for the low-NA fiber, the TMI threshold first decreases rapidly and then increases slowly with increasing bending diameter. The behavior of the conventional fiber agrees with the mechanism that, under low-loss conditions, stronger gain competition among HOMs suppresses the growth of Stokes HOMs, thereby raising the TMI threshold. As the HOM loss becomes sufficiently low, the TMI threshold increases markedly from about 3 to 6 kW, but the HOM proportion becomes higher meanwhile. In the high-loss region (bending diameter < 10 cm), although the loss of LP11o reaches more than 2 dB/m, the FM loss is also as high as 0.12 dB/m, causing a rapid drop in laser system efficiency. Consequently, the TMI threshold does not show a clear rise with further bending reduction. Thus, for the 30/250 μm conventional YDF with NA = 0.06, constrained by its bending-loss characteristics, it cannot simultaneously maintain low FM loss and high LP11o loss. As a result, it cannot effectively exploit the high-loss mechanism for TMI suppression and instead relies on the enhanced HOM gain competition to increase the TMI threshold. The non-monotonic TMI response of the low-NA fiber with bending indicates that both mechanisms could be employed for TMI suppression, but the effect is completely different (Figure 3(b)). Notably, the threshold in the high-loss region is substantially higher than in the low-loss region. At small bend diameters, high HOM loss can be achieved while maintaining acceptably low FM loss, enabling effective TMI suppression via the high-loss mechanism. At large bends, the HOM loss cannot reach the very low levels seen in the conventional fiber, and the total number of supported modes remains limited to only two HOMs (LP11o and LP11e). Although the HOM proportion increases, it is still small (<0.1). The resulting gain competition among these modes is therefore limited, making it difficult to achieve obvious TMI threshold enhancements as large as those possible in the conventional fiber. Therefore, for low-NA fibers supporting few modes, the high-loss mechanism is more readily employed, providing effective TMI suppression and enabling high-threshold operation under effective single-mode conditions.
The TMI thresholds and the corresponding HOM proportion as a function of bending diameters in the backward tandem-pumped amplifiers employing (a) 30/250 μm, NA ~ 0.06 YDF and (b) 30/250 μm, NA ~ 0.04 YDF.

Figure 3. Long description
The image consists of two panels, a and b.
Panel a describes a 30 forward slash 250 mu m, N A approximately 0.06 Y D F. The x-axis is Bending diameter in centimeters, ranging from 5 to 40. The left y-axis in blue is T M I threshold in Watts, ranging from 3000 to 6500. The right y-axis in red is H O M proportion, ranging from 0 to 0.4. Both the blue line with circular markers and the red line with square markers show a similar upward trend. As bending diameter increases from 8 to 40 centimeters, the T M I threshold rises from approximately 3400 to 6200 Watts, and the H O M proportion rises from 0 to approximately 0.33.
Panel b describes a 30 forward slash 250 mu m, N A approximately 0.04 Y D F. The x-axis is Bending diameter in centimeters, ranging from 20 to 100. The left y-axis in blue is T M I threshold in Watts, ranging from 4000 to 12000. The right y-axis in red is H O M proportion, ranging from 0 to 0.1. The blue line with circular markers shows a sharp asymptotic decrease from 11500 Watts at a 30 centimeter diameter, leveling off at approximately 4000 Watts from 60 to 100 centimeters. The red line with square markers remains at 0 until a 60 centimeter diameter, then increases sharply to 0.1 at a 100 centimeter diameter.
2.3 TMI performance for low-NA YDFs with high bending loss
Based on the preceding analysis, it can be concluded that for large-core low-NA fibers supporting only a few modes, suppressing TMI via tight bending generally yields better performance than relying on gain competition under low-loss conditions. However, under tight bending, the TMI threshold does not increase indefinitely with further reduction in bending diameter. Therefore, the variation of the TMI threshold with bending in the high-loss region was further analyzed to explore whether an optimal loss range exists for low-NA fibers – in which the TMI threshold consistently remains highest under the corresponding bending condition.
For a low-NA YDF with the given parameters, the relationship between FM and HOM losses is deterministic. As illustrated in Figure 2(b), increasing HOM loss inevitably raises FM loss. An increase in FM loss not only reduces laser transmission and amplification efficiency but also results in reduction of the TMI threshold. Hence, when employing the high-loss mechanism to suppress TMI, achieving high HOM loss must be balanced against the impact of FM loss. According to the modified STRS model[ Reference Dong 36 ], the coupled equations for the FM and the HOM can be expressed as follows:


where the subscripts 1 and 2 denote the FM and HOM, respectively. For a low-NA fiber supporting only a few modes under high-loss conditions, the bending loss of the LP11e mode is significantly larger than that of the LP11o mode. Since the nonlinear coupling gain is strongest between LP01 and LP11o, the dynamic mode coupling leading to TMI first occurs between these two modes[ Reference Smith and Smith 37 ]. Therefore, the HOM here refers specifically to the LP11o mode. Here, P represents the signal power, g the pump gain, α the bending loss and χ the nonlinear coupling coefficient.
The power of the LP11o mode in the output laser can be expressed as follows:

Assuming that the variations in pump gain and bending loss along the fiber length are relatively small[ Reference Li, Huang, Wu, Wang and Zhou 31 ], Equation (3) can be rewritten as follows:

where η is the power ratio between the LP11o mode and the LP01 mode.
Typically, the output power is much larger than the seed power, the HOM loss is significantly greater than the FM loss and the gains of the FM and HOMs are comparable[ Reference Huang, Kong, Leng, Zhou, Guo and Cheng 16 ]. Under these conditions, Equation (4) can be approximated as follows:

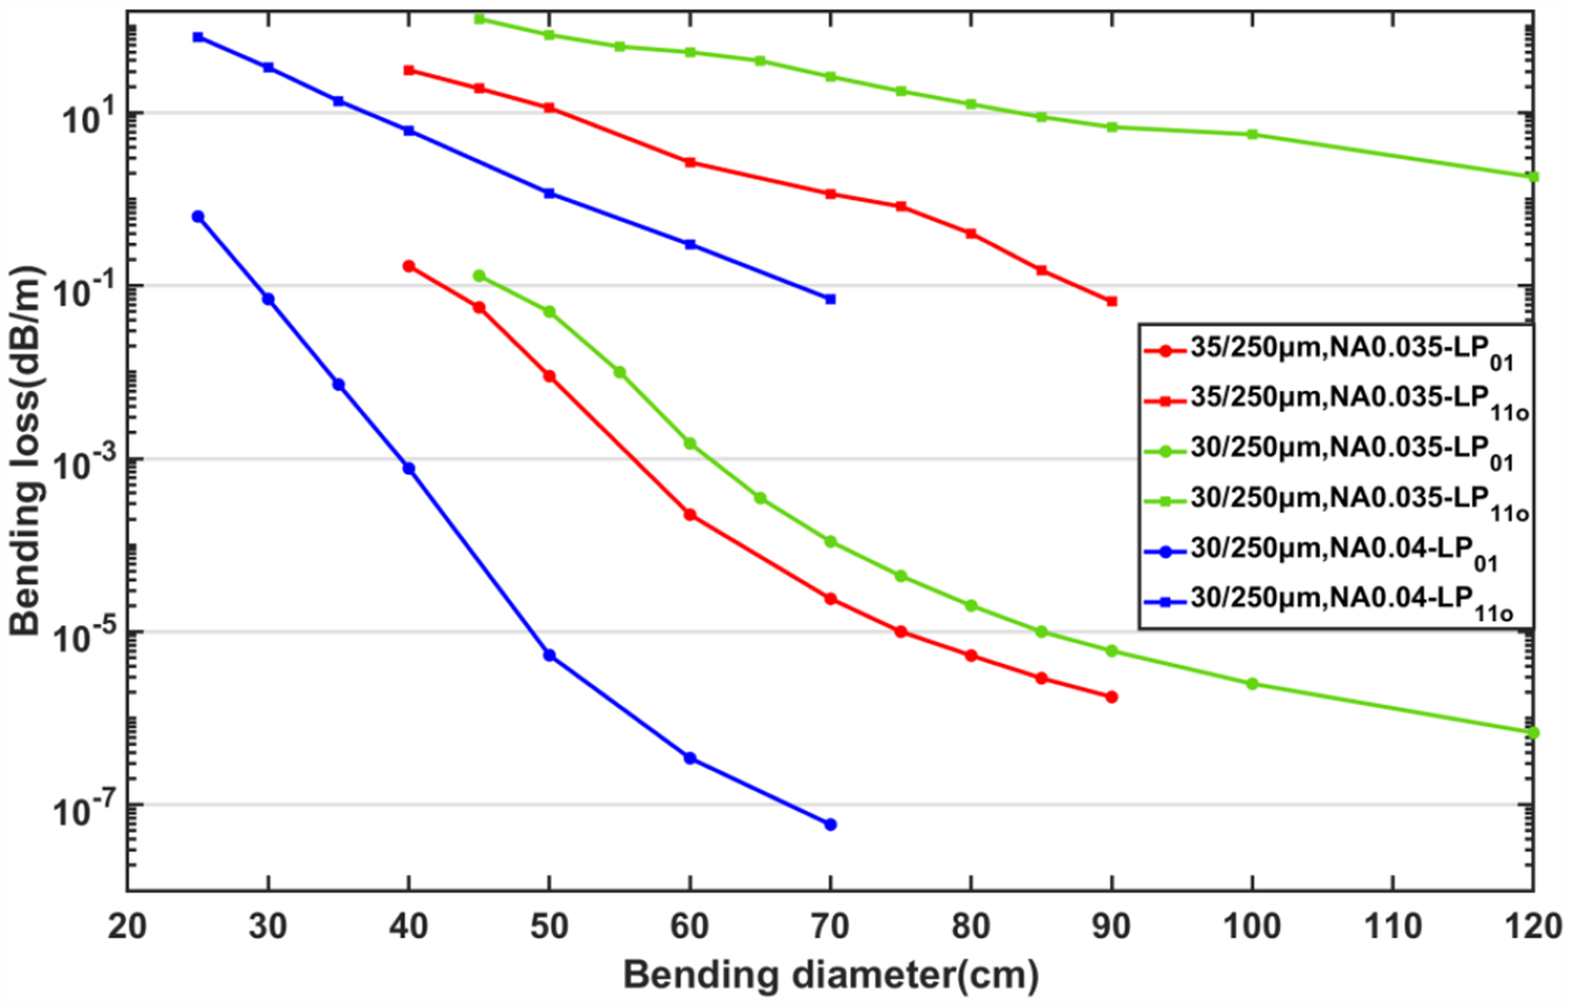
From the formula, the effects of FM loss and HOM loss on the TMI threshold are opposite. Consequently, for a given set of FM and HOM loss values with a deterministic relationship, there must exist an optimal combination that maximizes the TMI threshold. This optimum does not simply correspond to the bending range that yields the highest HOM loss while satisfying effective single-mode (ESM) operation[ Reference Li, Chen, Liu, Gray, Wang, Walton and Zenteno 34 ]. In other words, for a low-NA fiber with specified parameters, there exists a bending-loss interval that delivers the maximum TMI threshold. Based on the derivation above, we compare and analyze three large-core low-NA fibers with different parameters but similar V values (V < 4), all supporting two modes. The fiber parameters are as follows: 30/250 μm, NA ~ 0.04; 30/250 μm, NA ~ 0.035; and 35/250 μm, NA ~ 0.035. Firstly, the bending losses of the FM and the HOM are obtained via finite element simulation, as shown in Figure 4. Since the TMI threshold variations are only focused in the high-loss regime, the bending range considered is restricted to cases where the loss of the LP11o mode exceeds 0.5 dB/m, with an upper limit set by an FM loss of 10–1 dB/m. Within this bending range, the dependence of the TMI threshold on bending is examined for three low-NA fibers. To further evaluate the impact of FM loss on laser output, the optical-to-optical (O-O) conversion efficiency under different bending conditions is calculated, as presented in Figure 5.
Bending loss of LP01 and LP11o modes from 30/250 μm, NA ~ 0.04; 30/250 μm, NA ~ 0.035; 35/250 μm, NA ~ 0.035 YDFs.

Figure 4. Long description
A line graph with a linear X-axis labeled Bending diameter (cm) ranging from 20 to 120 and a logarithmic Y-axis labeled Bending loss (d B / m) ranging from 10 super -7 to 10 super 1.
The data consists of six curves representing three fiber types, each with two modes: L P sub 0 1 (circles) and L P sub 1 1 o (squares). All curves show a downward trend where bending loss decreases as bending diameter increases.
* The top-most curve (light green squares) represents 30 / 250 micrometers, N A 0.035, L P sub 1 1 o, starting at 10 super 2 at 45 cm and ending near 10 super 0 at 120 cm.
* Below it, the red square curve (35 / 250 micrometers, N A 0.035, L P sub 1 1 o) starts at 10 super 1.5 at 40 cm and ends near 10 super -1 at 90 cm.
* The blue square curve (30 / 250 micrometers, N A 0.04, L P sub 1 1 o) starts at 10 super 2 at 25 cm and ends near 10 super -1 at 70 cm.
* The light green circle curve (30 / 250 micrometers, N A 0.035, L P sub 0 1) starts at 10 super -1 at 45 cm and decreases to 10 super -6 at 120 cm.
* The red circle curve (35 / 250 micrometers, N A 0.035, L P sub 0 1) starts at 10 super -1 at 40 cm and decreases to 10 super -6 at 90 cm.
* The bottom-most curve (blue circles) represents 30 / 250 micrometers, N A 0.04, L P sub 0 1, starting at 10 super -0.5 at 25 cm and reaching the lowest recorded loss of 10 super -7.2 at 70 cm.
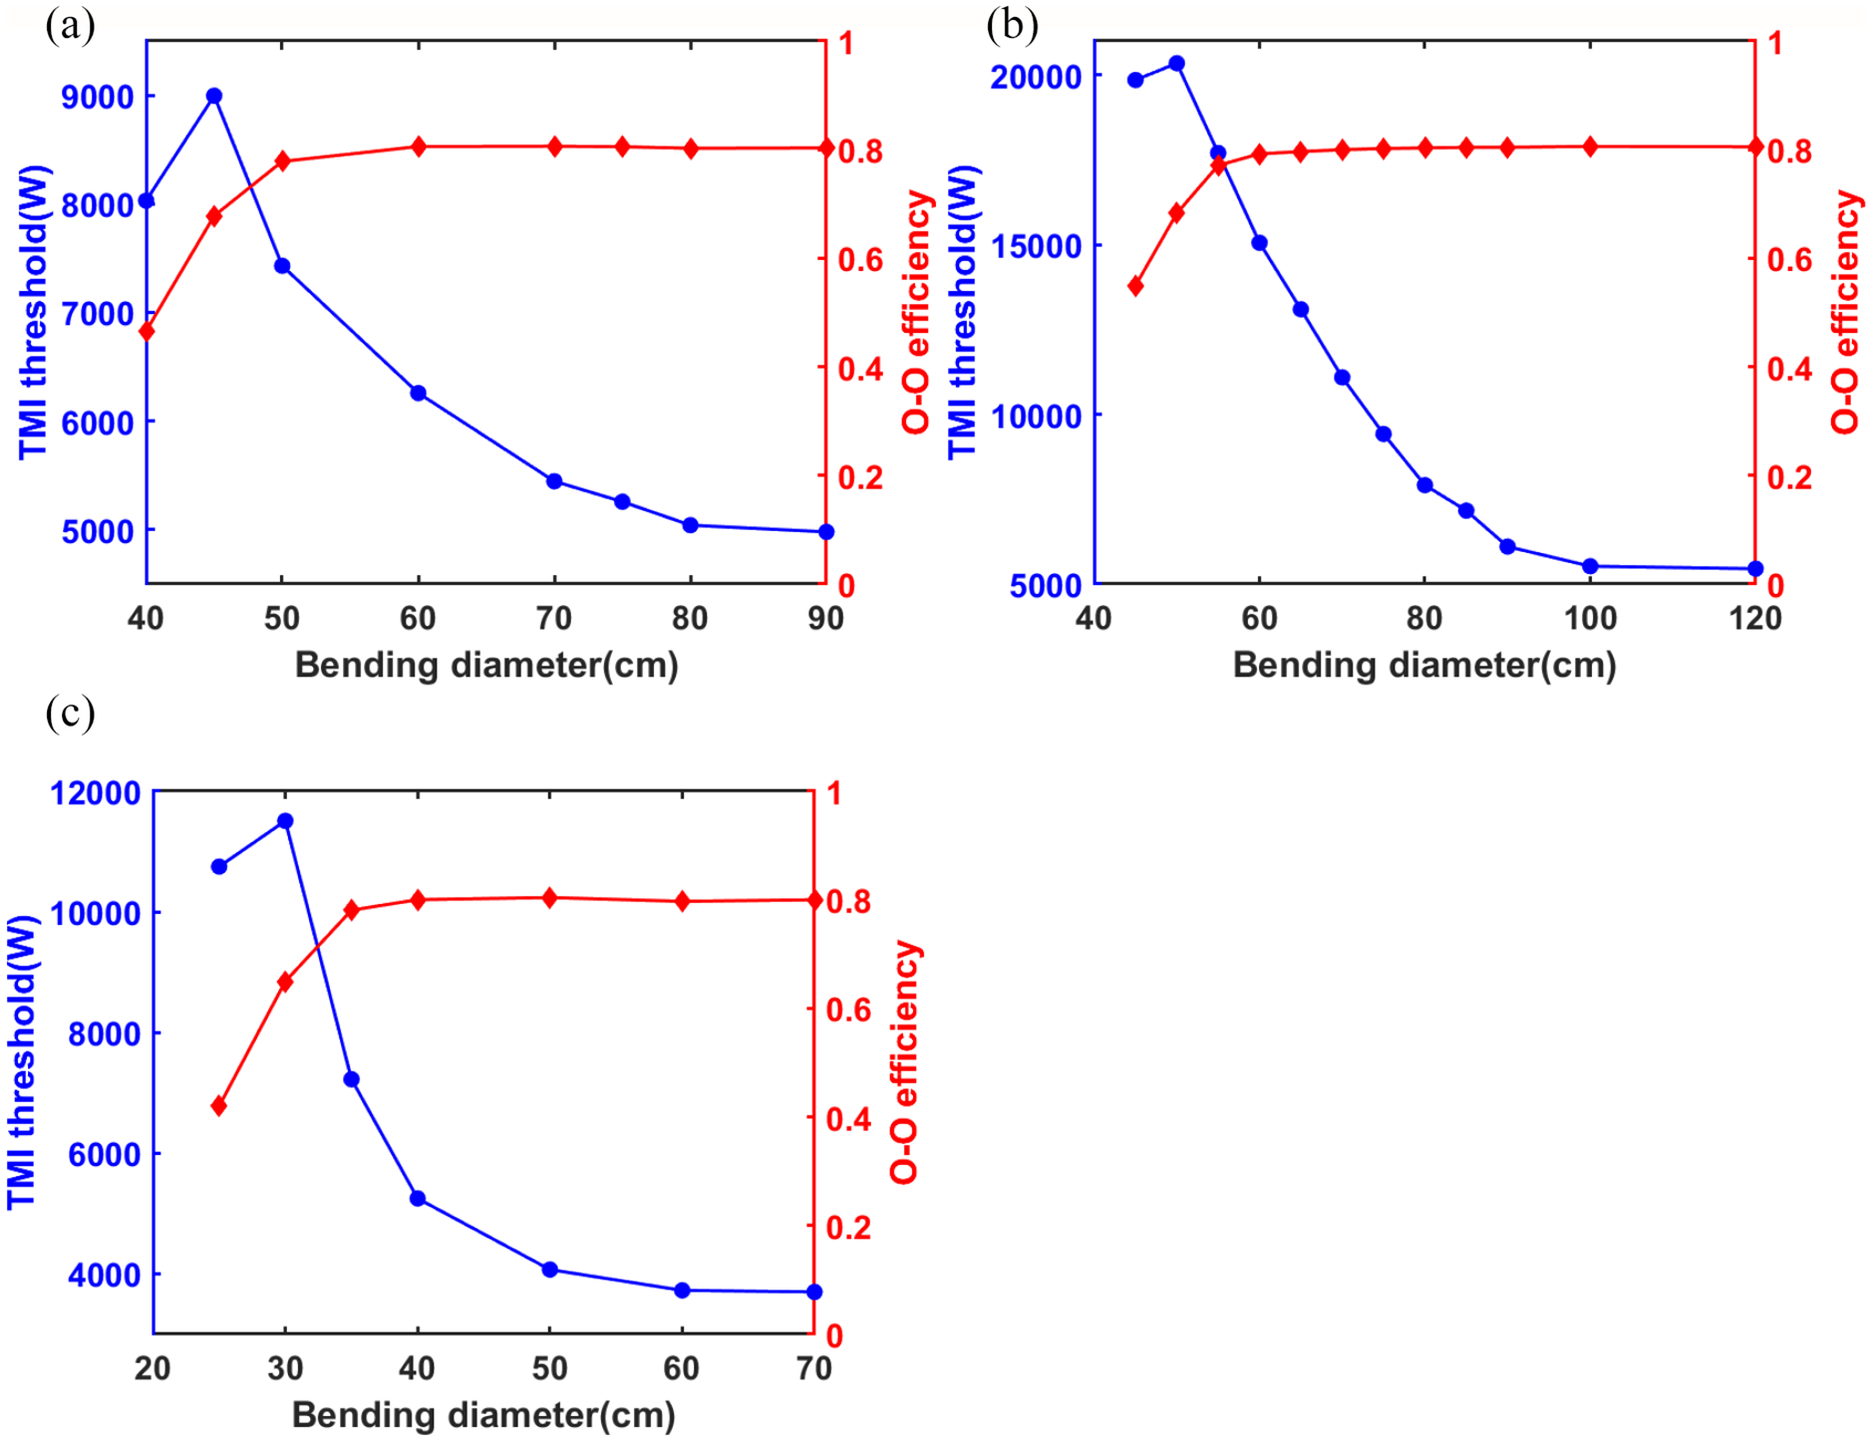
TMI thresholds and optical-to-optical efficiency as a function of bending diameters in the backward tandem-pumped amplifiers employing (a) 35/250 μm, NA ~ 0.035 YDF, (b) 30/250 μm, NA ~ 0.035 YDF and (c) 30/25 μm, NA ~ 0.04 YDF.

Figure 5. Long description
A multi-panel figure with three line graphs labeled a, b, and c. Each graph shares a common structure: the x-axis is Bending diameter in centimeters, the left y-axis is T M I threshold in Watts (blue), and the right y-axis is O-O efficiency (red).
* Panel a: For a 35/250 micrometer fiber, the x-axis ranges from 40 to 90. The blue T M I threshold curve peaks at 9000 Watts at a diameter of 45 centimeters before decaying to 5000 Watts. The red O-O efficiency curve rises from 0.45 and plateaus at approximately 0.8 beyond 60 centimeters.
* Panel b: For a 30/250 micrometer fiber, the x-axis ranges from 40 to 120. The blue curve peaks at over 20000 Watts at 50 centimeters, then drops sharply to a baseline of 5000 Watts by 100 centimeters. The red curve rises from 0.55 and stabilizes at 0.8 after 60 centimeters.
* Panel c: For a 30/25 micrometer fiber, the x-axis ranges from 20 to 70. The blue curve peaks at 11500 Watts at 30 centimeters, then falls to 4000 Watts. The red curve starts at 0.4 and reaches a plateau of 0.8 at 40 centimeters.
Overall, as the bending diameter decreases, the TMI threshold of all three fibers first increases and then decreases. The O-O efficiency remains nearly constant initially but then drops rapidly, with the turning point generally occurring around the maximum TMI threshold. Correlating the bending loss with the TMI threshold variation, the 35/250 μm fiber with NA = 0.035 reaches its highest TMI threshold at a bend diameter of 45 cm. At this point, the FM loss is 0.056 dB/m, the LP11o loss is 19 dB/m and the efficiency declines from 78% to 67%. Further tightening the bend increases the FM loss to 0.17 dB/m, causing the TMI threshold to drop and the efficiency to fall to 47%. For the 30/250 μm fiber with NA = 0.035, the peak TMI threshold occurs at a bend diameter of 50 cm, where the FM loss is 0.05 dB/m and the LP11o loss is 79 dB/m. The efficiency decreases from 77% to 68%. Further bending increases the FM loss to 0.13 dB/m, leading to a drop in both TMI threshold and efficiency to 54%. The 30/250 μm fiber with NA = 0.04 achieves its maximum TMI threshold at a bend diameter of 30 cm, corresponding to an FM loss of 0.06 dB/m and an LP11o loss of 33 dB/m. The efficiency drops from 78% to 65%. With further bending, the FM loss reaches 0.6 dB/m, which reduces the TMI threshold and lowers efficiency to 42%. In summary, all three fibers achieve their maximum TMI threshold when the FM loss is around 0.05 dB/m, but the corresponding efficiency in each case is below 70%. When the FM loss reaches 0.1 dB/m, the increase in HOM loss can no longer compensate for the TMI threshold reduction caused by excessive FM loss, and the efficiency falls below 50%. Considering practical experimental conditions, laser efficiency is typically required to remain above 70%. Lower efficiency can significantly compromise the safety of fiber components such as the cladding light stripper (CLS). Therefore, by synthesizing the relationships among bending loss, efficiency and TMI threshold, the optimal bending range for TMI suppression in low-NA fibers corresponds to an FM loss between approximately 0.01 and 0.05 dB/m, with values near 0.01 dB/m being particularly favorable. In terms of physical bend diameter, this corresponds to the following: 45–50 cm for the 35/250 μm, NA 0.035 fiber; 50–60 cm for the 30/250 μm, NA 0.035 fiber; 30–35 cm for the 30/250 μm, NA 0.04 fiber. These findings, derived from theoretical simulations, might offer practical guidance for the application of low-NA fibers.
3 Experiments
3.1 Experimental setup
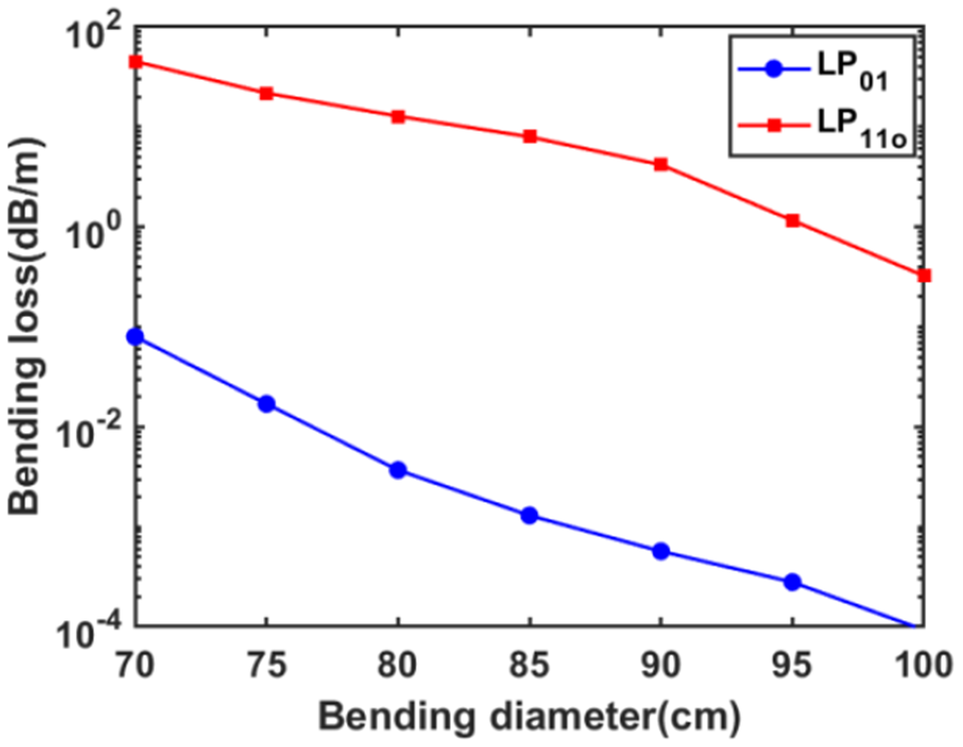
Based on the theoretical simulations, we proceeded with experimental research. The optimal bending range for suppressing TMI in low-NA fiber amplifiers is investigated adopting a backward tandem-pumped configuration. It should be noted, however, that stimulated Raman scattering (SRS) also constitutes a major factor limiting power scaling in high-power tandem-pumped fiber lasers. Consequently, we selected and fabricated a low-NA fiber with a target parameter of 35/250 μm and NA of 0.035. Compared to the other two low-NA fibers considered earlier, this design offers a larger effective mode area and hence a higher SRS threshold[ Reference Jain, Jung, Barua, Alam and Sahu 38 ]. The low-NA fiber preform is fabricated using modified chemical vapor deposition (MCVD) in conjunction with a solution doping technique, whose cladding is polished into an octagonal shape to enhance the cladding pump light absorption of the fiber. The core NA is finally found to be approximately 0.032. It is calculated that the V is 3.26 at 1080 nm, and thus two eigenmodes are supported in the core. The mode area of the FM is about 810 μm2. In addition, the absorption coefficient is measured as approximately 0.35 dB/m at 1018 nm. For sufficient pump absorption, the length of the YDF is selected as 40 m. The bending losses of the LP01 mode and the LP11o mode were calculated, as plotted in Figure 6.
Bending loss of LP01 and LP11o modes versus bending diameter calculated from the actual refractive index profile.

Figure 6. Long description
The line graph plots Bending diameter in centimeters on the horizontal X-axis against Bending loss in d B forward slash m on a logarithmic vertical Y-axis. The X-axis ranges from 70 to 100 in increments of 5. The Y-axis uses powers of 10, ranging from 10 super minus 4 to 10 super 2.
A legend in the top right corner identifies two data series:
* L P sub 0 1 represented by a blue line with circular markers.
* L P sub 1 1 o represented by a red line with square markers.
Data trends:
* The L P sub 1 1 o mode starts at approximately 50 d B forward slash m at a 70 centimeter diameter and follows a downward asymptotic curve to just below 10 super 0 at 100 centimeters.
* The L P sub 0 1 mode starts significantly lower, at approximately 10 super minus 1 d B forward slash m at 70 centimeters, and decreases linearly on the log scale to reach 10 super minus 4 d B forward slash m at 100 centimeters.
* Throughout the entire range, the L P sub 1 1 o mode maintains a higher bending loss than the L P sub 0 1 mode by several orders of magnitude.
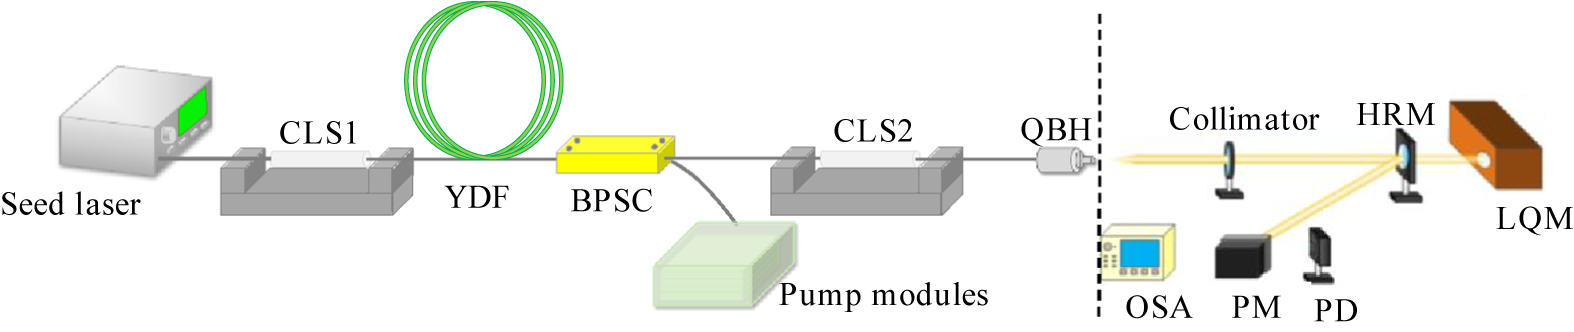
A schematic diagram of the counter tandem-pumped all-fiber laser amplifier setup used for the following experiments is depicted in Figure 7. The experimental setup employs a master oscillator power amplification (MOPA) structure. A fiber laser oscillator operating at approximately 1080 nm is used as the seed laser of the amplifier. It can provide a near-single-mode signal light with 150 W output. Three 1018 nm fiber laser modules are utilized as pump sources of the amplifier, providing about 10 kW pump power. The pump lasers are injected into the gain fiber through a (6 + 1) × 1 backward pump/signal combiner (BPSC). The pump ports of the BPSC are 135/155 μm, 0.22 NA multi-mode fibers consistent with the pigtail fibers from the 1018 nm modules. Due to the lack of matched passive fiber for low-NA YDF, the input and output ports of the BPSC employ 40/250 μm fibers with core NA ~ 0.065, which could reduce the insertion loss as much as possible. A CLS (CLS1) with the pigtail fiber of 30/250 μm is spliced in the front end of the gain fiber to remove the residual pump light. Another CLS, CLS2, is inserted after the BPSC to get rid of the unwanted cladding light. Finally, the fiber amplifier is output through a quartz block holder (QBH). The core and inner cladding diameters of CLS2 as well as the QBH’s pigtail fiber are 40/250 μm. The output laser is collimated by a collimator (CO) and then divided into two beams via a highly reflective mirror (HRM) with more than 99.99% reflectivity. The low-power transmitted beam goes into the laser quality monitor (LQM) for beam quality measurement. An optical spectrum analyzer (OSA) and a photodetector (PD) are utilized to monitor the spectra and power fluctuations. The high-power reflected beam is collected by the power meter (PM).
Schematic diagram of the backward tandem-pumped amplifier.

Figure 7. Long description
The diagram is divided into two sections by a vertical dashed line.
On the left side, the optical path begins at a Seed Laser box. A fiber line connects to C L S 1, which is a cylindrical component on a gray mount. This is followed by a coiled green fiber labeled Y D F. The path continues to a yellow rectangular component labeled B P S C. Below the B P S C, a separate green block labeled Pump modules is connected via a curved fiber line. The main path then proceeds through C L S 2, another cylindrical component on a gray mount, and ends at a Q B H connector at the dashed line.
On the right side of the dashed line, the light beam exits the Q B H and passes through a Collimator. The beam then hits an H R M, which reflects a portion of the light downward toward a P M and a P D. The main beam continues through the H R M into a large orange block labeled L Q M. An O S A device with a blue screen is positioned at the bottom left of this measurement section.
Based on the bending loss of the low-NA fiber, the comparative experiments of gain fiber with different bending diameters are conducted. Limited by the available water-cooled plate, the YDF is coiled on a spiral water-cooled plate instead of a cylindrical one for heat dissipation. To evaluate the influence of bending diameters on laser performances, several comparative experiments are conducted with different bending diameters of YDF. To be noted, the signal light is injected into the gain fiber from the position where the bending diameter is small, and the pump light is input from the large bending ports constantly.
3.2 Laser performance with large bending diameter of 95–99 cm
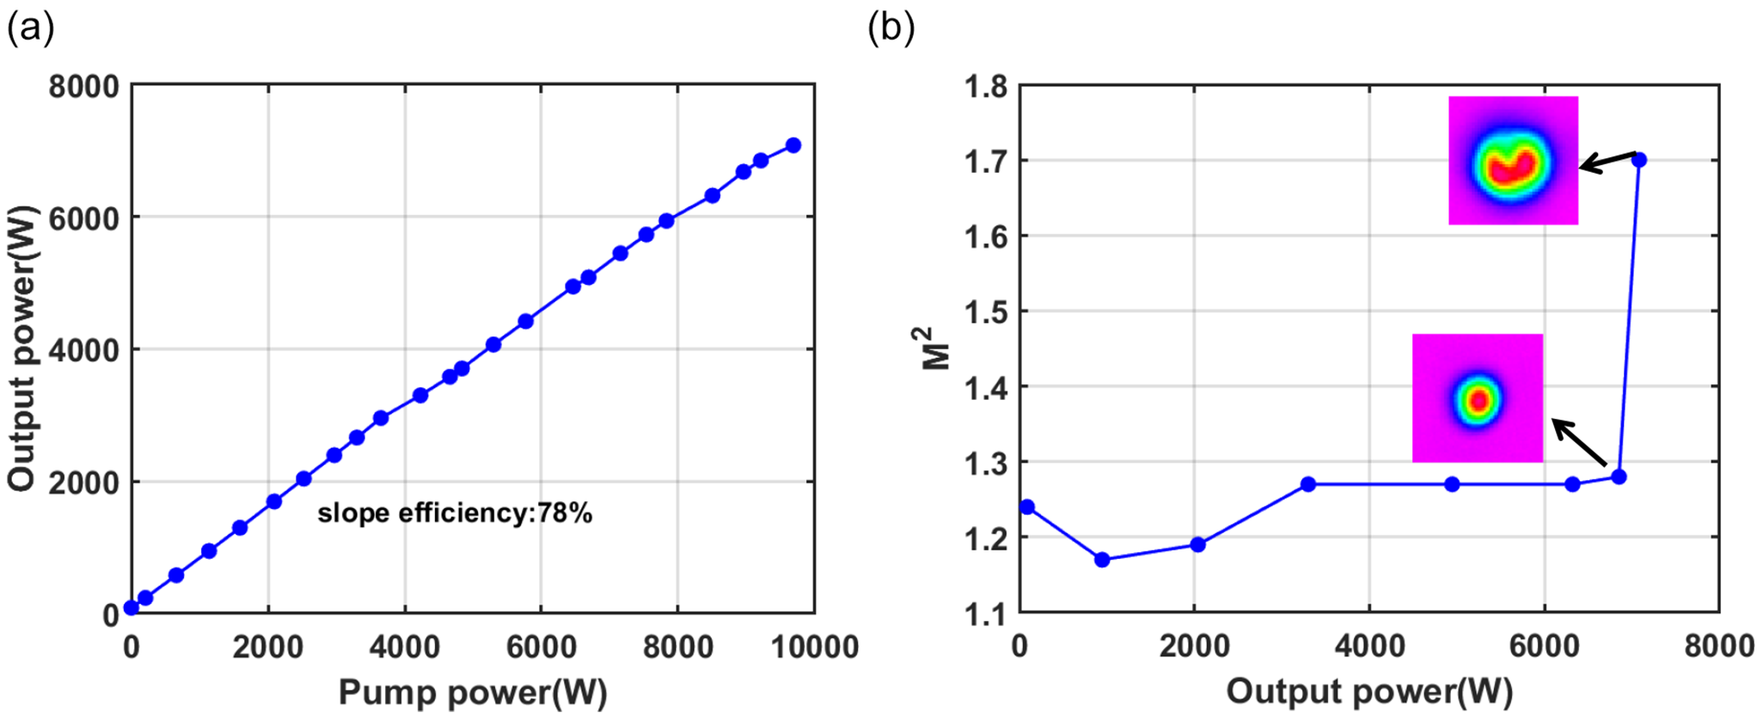
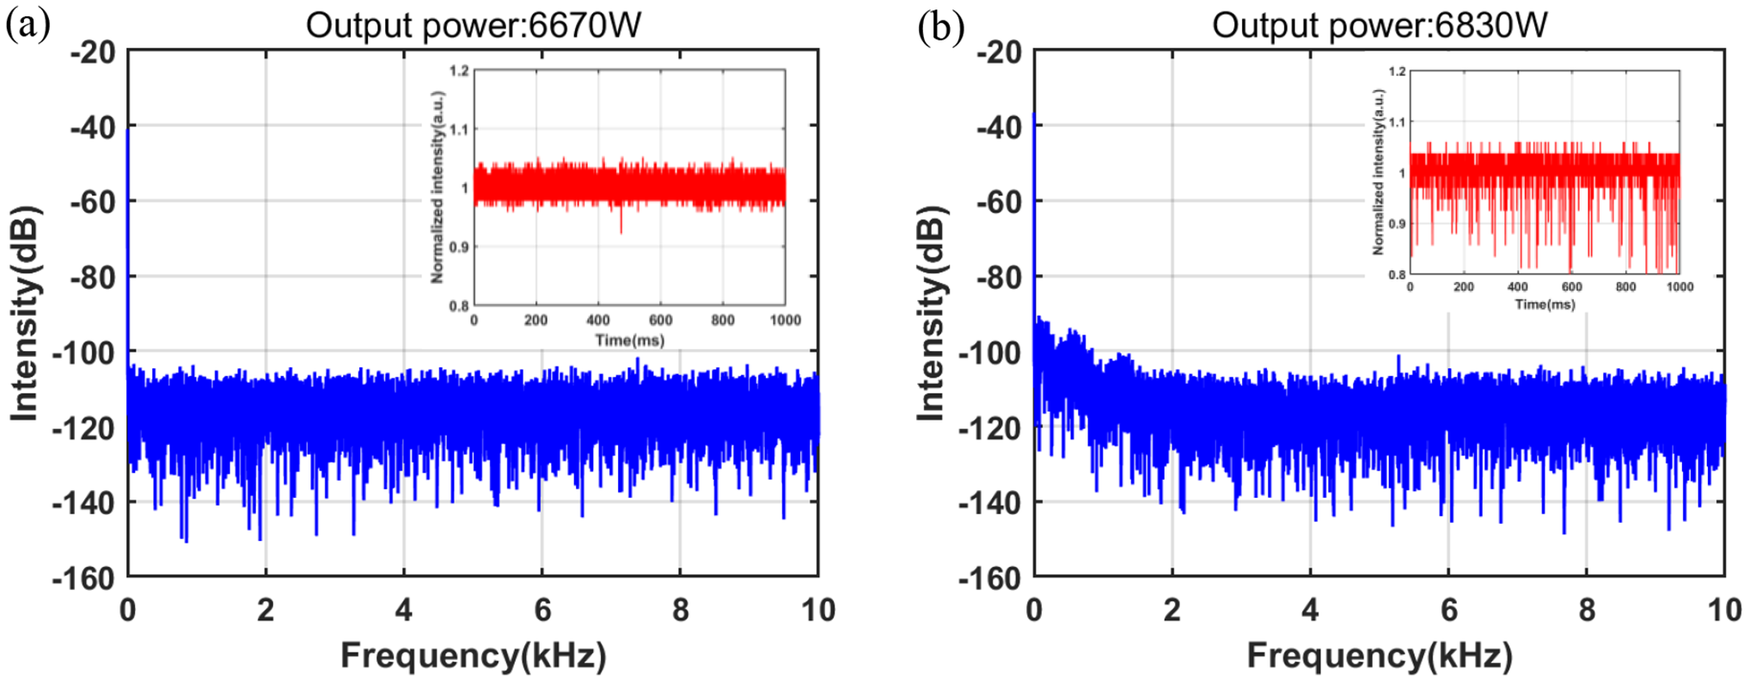
Firstly, the amplifier with the YDF bending diameter of 95–99 cm is investigated. The performance of the MOPA laser is shown in Figures 8 and 9. The laser output power increases almost linearly with the pump power, exhibiting a slope efficiency of 78%, as depicted in Figure 9(a). At the maximum pump power of 9684 W, the output power reaches 7080 W. Figure 8 shows the time trace and corresponding Fourier spectra monitored by a PD near the TMI threshold. At the operation of 6850 W, the temporal signal of the output laser is stable and no sign of frequency peaks appears in the frequency domain. However, at 7080 W, obvious temporal intensity fluctuations emerge and there are feature frequency components in the range of 0–5 kHz, indicating the onset of TMI. The evolution of laser beam quality M 2 also indicates the appearance of the TMI effect, depicted in Figure 9(b). The beam quality degrades with the rising output power. Before the onset of TMI, the M 2 factors slowly grow from 1.17 at 950 W to 1.28 at 6850 W. Increasing the laser power to 7080 W, the M 2 factor is measured to be 1.7.
The temporal signal of the PD (inset) and its corresponding Fourier transform results near the TMI threshold: (a) at 6850 W; (b) at 7080 W.

Figure 8. Long description
A two-panel spectral analysis.
Panel a, labeled Output power 6850 W. The main graph plots Intensity in d B on the y-axis from -160 to -20 with a baseline at -110 d B, against Frequency in k H z on the x-axis from 0 to 10. The blue signal shows a flat noise floor with a sharp peak at 0 k H z. An inset graph shows Normalized intensity in arbitrary units versus Time in m s from 0 to 200. The red temporal signal is stable, centered at 1.0 with minimal fluctuations between 0.95 and 1.05.
Panel b, labeled Output power 7980 W. The main graph uses the same axes. The blue spectral signal shows increased noise and instability, with the noise floor rising toward -100 d B between 0 and 4 k H z. The inset temporal signal in red shows significantly higher instability, with frequent downward spikes reaching as low as 0.85 normalized intensity.
Laser output properties of the gain fiber bending at 95–99 cm. (a) Output power versus pump power. (b) Beam quality under different powers.

Figure 9. Long description
The figure consists of two panels labeled a and b.
Panel a is a line graph with the x-axis labeled Pump power W ranging from 0 to 10000 and the y-axis labeled Output power W ranging from 0 to 8000. A series of blue circular data points connected by a blue line shows a linear increase. The line starts at the origin and reaches approximately 7000 W output at 10000 W pump power. Text centered below the line states slope efficiency 78 percent.
Panel b is a line graph with the x-axis labeled Output power W ranging from 0 to 8000 and the y-axis labeled M super 2 ranging from 1.1 to 1.8. The data points show M super 2 values fluctuating between 1.15 and 1.3 as output power increases from 0 to 7000 W. At approximately 7000 W, the M super 2 value sharply increases to 1.7. Two inset images show heat maps of the beam profile. The first inset, pointed to by an arrow from the 6800 W data point, shows a concentrated circular red core. The second inset, pointed to by an arrow from the 7000 W data point, shows a distorted, horseshoe-shaped red core.
3.3 Laser performance with moderate bending diameter of 85–89.5 cm
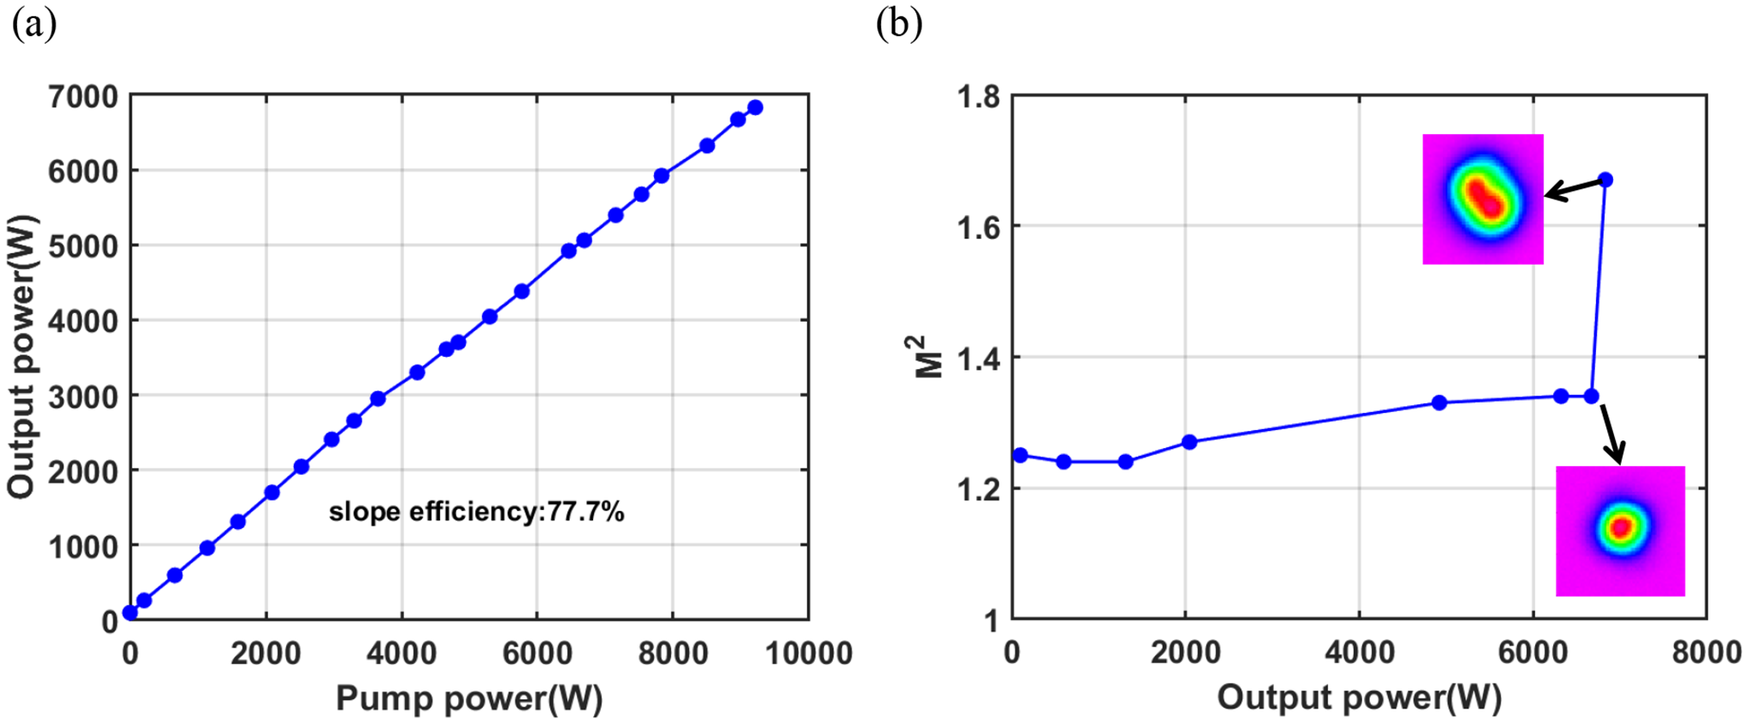
Subsequently, the bending diameter of low-NA YDF is decreased to 85–89.5 cm from the input and output ends. Figures 10 and 11 plot the output characteristics of the laser amplifier. The output power grows linearly with a stable slope efficiency of 77.7%, as shown in Figure 11(a). Compared with the large coiling, the slope efficiency remains nearly unchanged, indicating the difference of bending loss of the FM is small. Figure 10 shows the time trace and the corresponding Fourier spectra near the TMI threshold. The TMI threshold declines from 7080 W for large coiling of 95–99 cm to 6830 W for moderate coiling of 85–89.4 cm, which conforms to the abnormal TMI effect. Figure 11(b) shows the M 2 evolution at different output powers. Thanks to the small V value and few guided modes supported, the M 2 factors are maintained near 1.3, although the beam quality degrades with the rising output power. At 6670 W, the M 2 factor is 1.34 and experiences a sharp increase to 1.67 at 6830 W.
The temporal signal of the PD (inset) and its corresponding Fourier transform results: (a) at 6670 W; (b) at 6830 W.

Figure 10. Long description
Two panels labeled a and b.
Panel a is titled Output power 6670 W. The main graph plots Intensity in d B on the y-axis from -160 to -20 and Frequency in k H z on the x-axis from 0 to 10. A blue signal shows a sharp peak at 0 k H z reaching -40 d B, followed by a dense noise floor fluctuating between -100 and -140 d B. An inset graph shows Normalized intensity in a.u. on the y-axis from 0.8 to 1.2 against Time in m s from 0 to 1000. The red signal in the inset is a stable, narrow band centered at 1.0.
Panel b is titled Output power 6830 W. The main graph uses the same axes as panel a. The blue signal shows a similar peak at 0 k H z, but the noise floor is slightly higher and more turbulent between 0 and 2 k H z before settling between -100 and -140 d B. The inset graph shows Normalized intensity against Time. The red signal in this inset is significantly more unstable than in panel a, with frequent downward spikes reaching as low as 0.8.
Laser output properties of the gain fiber bending at 85–89.4 cm. (a) Output power versus pump power. (b) Beam quality under different powers.

Figure 11. Long description
Panel a is a line graph with the x-axis labeled Pump power (W) from 0 to 10000 and the y-axis labeled Output power (W) from 0 to 7000. A series of blue circular data points connected by a line shows a linear increase from the origin to approximately 9200 W pump power and 6800 W output power. Text in the lower right quadrant states slope efficiency 77.7%.
Panel b is a line graph with the x-axis labeled Output power (W) from 0 to 8000 and the y-axis labeled M super 2 from 1 to 1.8. The data points show a relatively flat trend starting at 1.25, slightly dipping, then gradually rising to 1.35 at 6800 W. At this point, the line sharply increases to nearly 1.7. Two inset images show beam profiles. The lower inset, connected to the 1.35 data point, shows a circular, symmetric Gaussian-like beam profile. The upper inset, connected to the highest data point, shows an elongated, elliptical beam profile.
3.4 Laser performance with small bending diameter
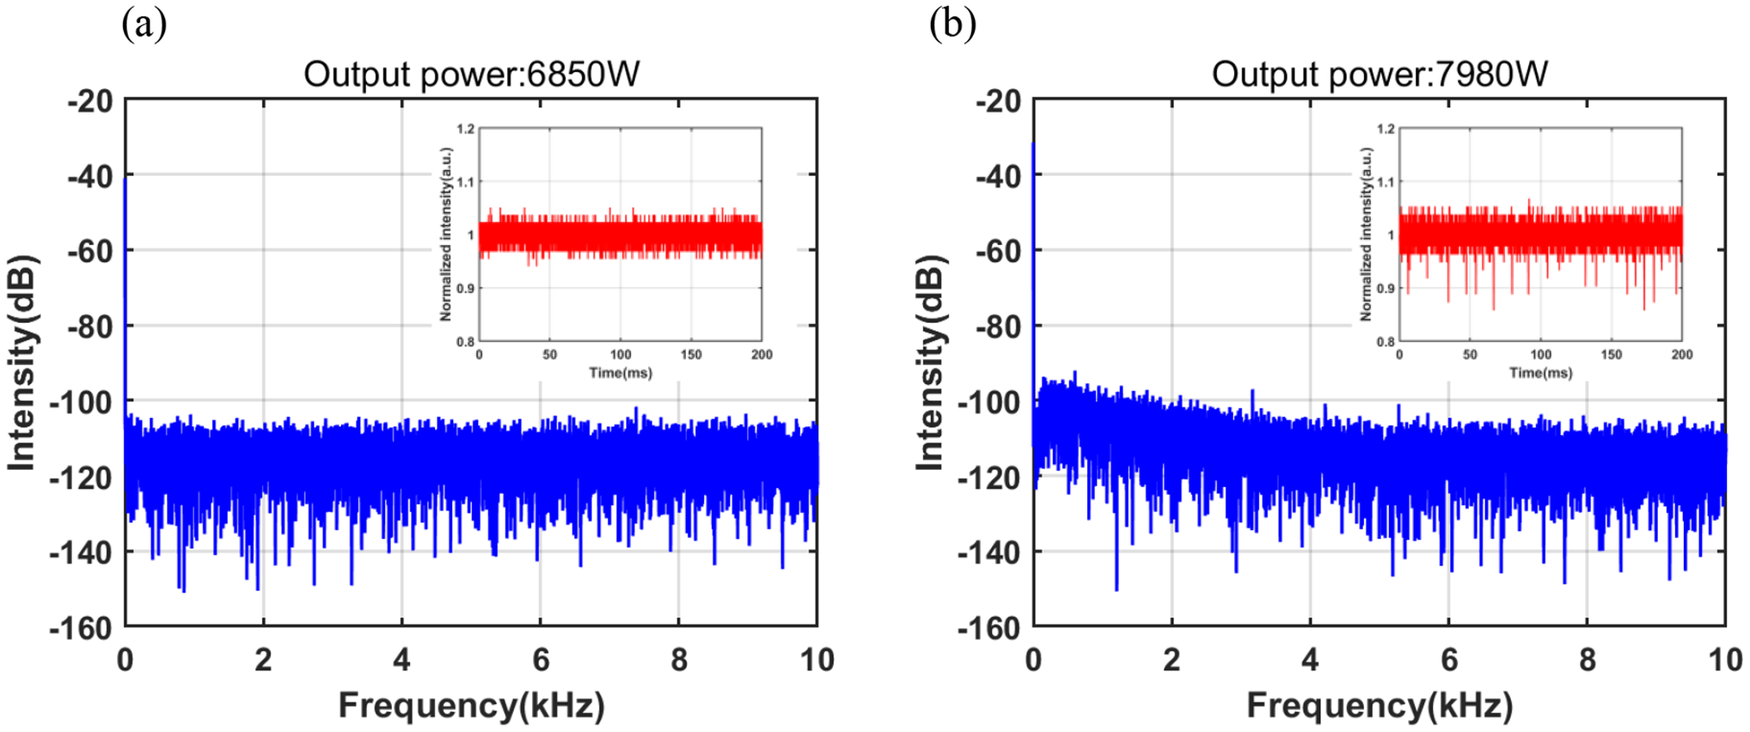
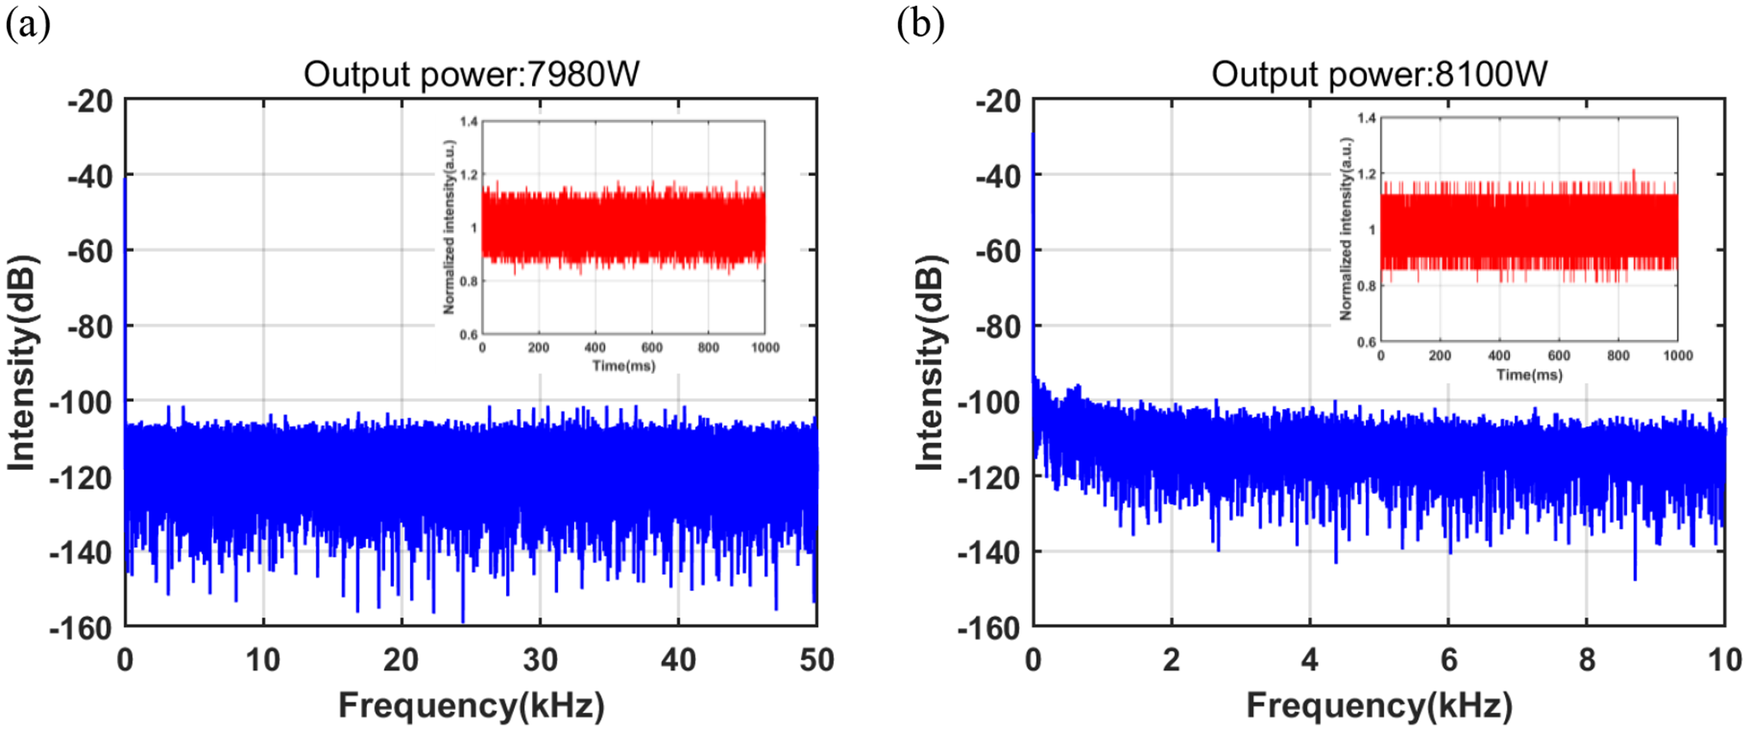
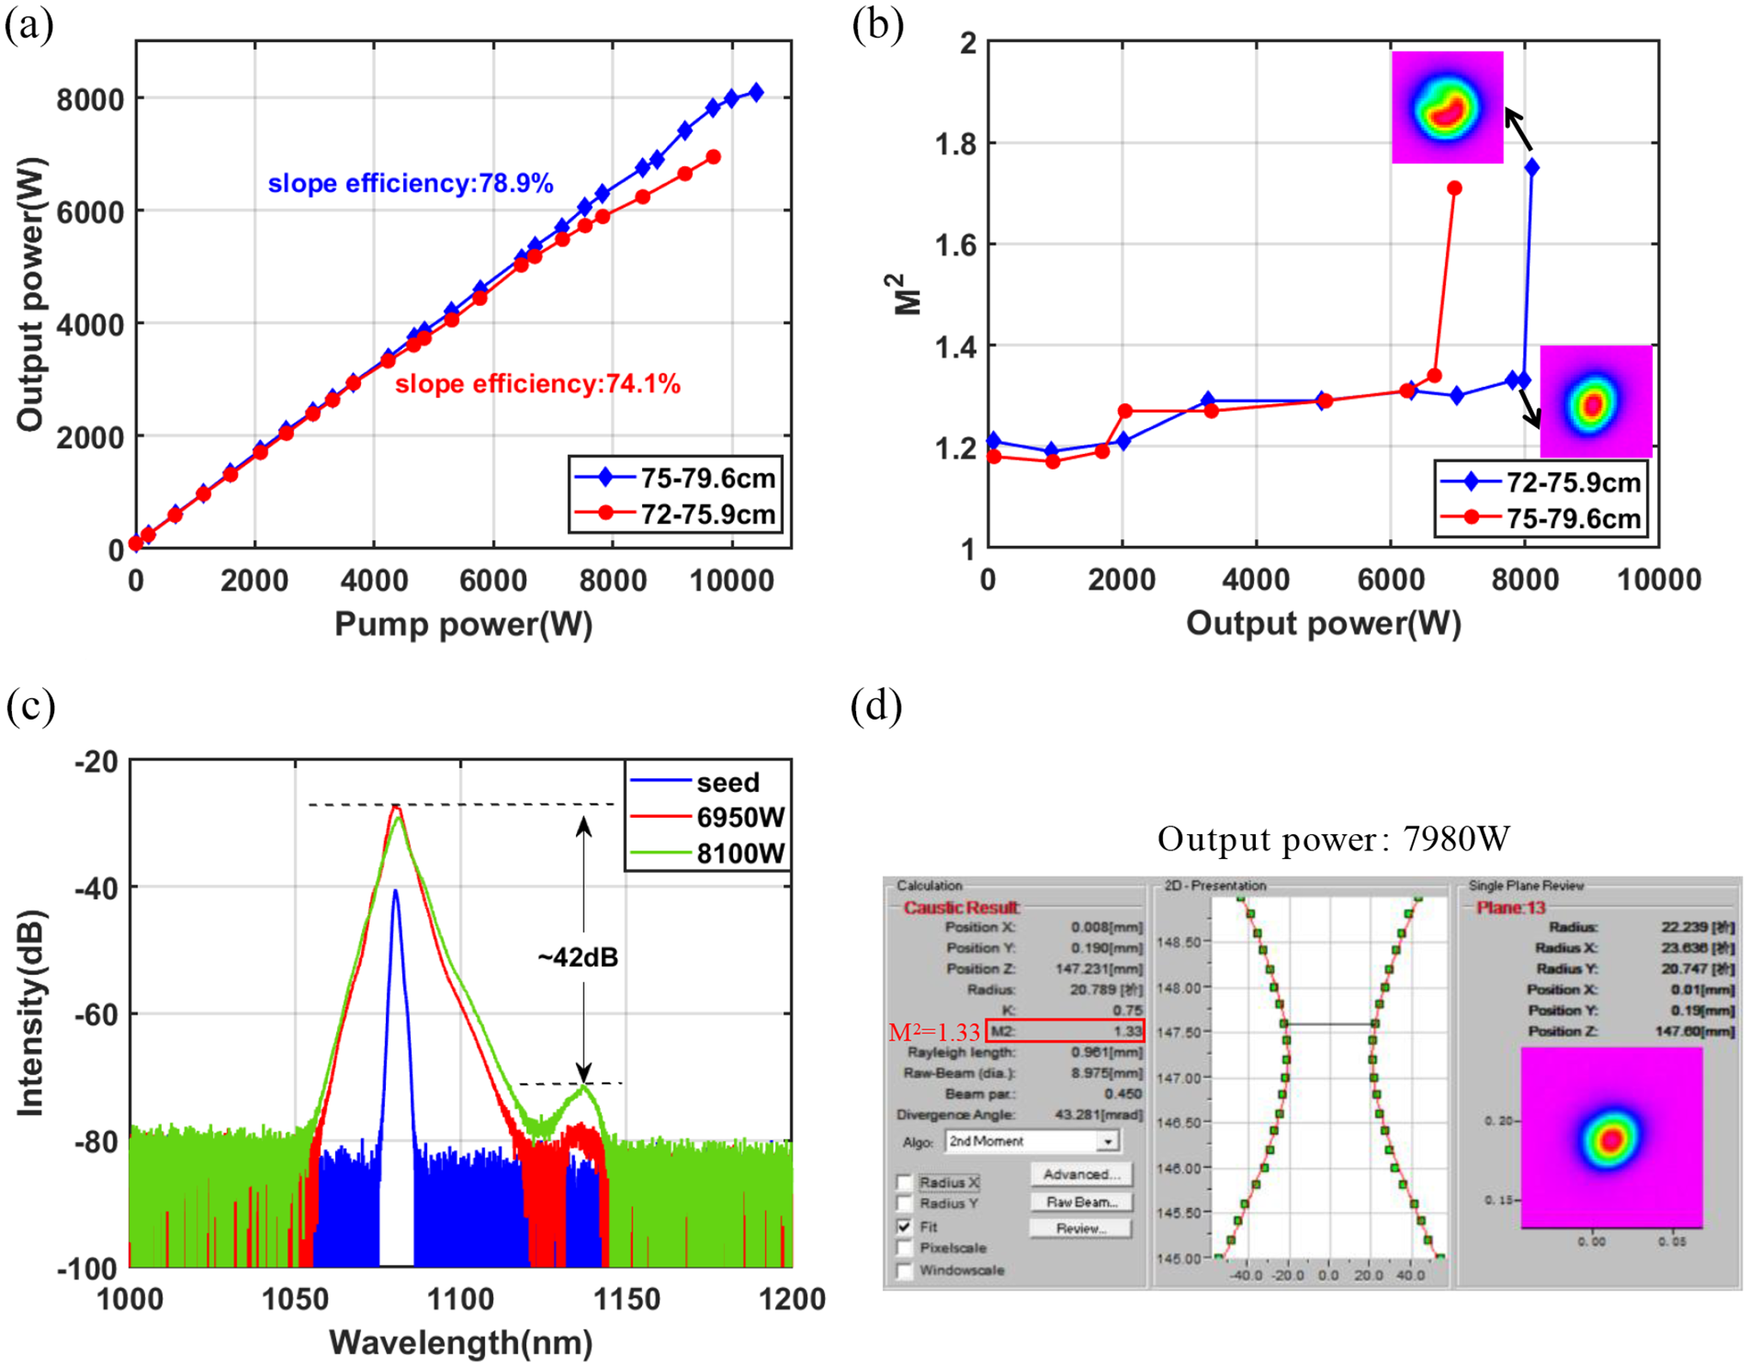
Finally, the bending diameter of low-NA YDF is decreased to 75–80 and 72–77 cm, respectively. The seed laser is still set to be 120 W injected into the amplifier. Figure 12(a) shows the output power versus the pump power under these two bending ranges. The time trace and the corresponding Fourier spectrum near the TMI threshold are depicted in Figure 13, which indicated the TMI appeared at 8100 W at the bending diameter of 75–80 cm, whereas the TMI threshold dropped to 6950 W for the 72–77 cm bending. Compared with the TMI threshold observed under larger bending diameters, the smaller bending condition initially led to a clear increase in the TMI threshold; however, further reduction of the bending diameter resulted in a decrease in both the TMI threshold and efficiency, which aligns well with the simulation analysis. Figure 12(b) describes the variation of the laser beam quality under these two bending ranges. The M 2 of the seed laser, after transmission through the amplifier, is 1.21. At the maximum output power of 7980 W, the M 2 factor is 1.33. After the onset of TMI, the beam quality degrades sharply to 1.75, which may be related to the rapid transfer of energy between the FM and HOM. At the bending diameter of 72–80 cm, the beam quality factor M 2 remained below 1.3 until the onset of TMI, after which it increased to 1.71. Figure 12(c) presents the spectrum of the output laser, with a signal-to-Raman ratio of approximately 42 dB at 8100 W, demonstrating a good SRS suppression of the system. The 3 dB bandwidth is 4.64 nm at 8100 W and 1.6 nm at the seed power.
The temporal signal of the PD (inset) and its corresponding Fourier transform results: (a) at 7980 W; (b) at 8100 W.

Figure 12. Long description
A two-panel figure labeled a and b.
Panel a is titled Output power 7980 W. The horizontal x-axis is Frequency in k H z ranging from 0 to 50. The vertical y-axis is Intensity in d B ranging from minus 160 to minus 20. The data is represented by a dense blue noise floor centered around minus 110 d B with a sharp peak at 0 k H z reaching minus 40 d B. An inset graph in the top right shows Normalized intensity in arbitrary units versus Time in m s from 0 to 1000. The inset data is a dense red band fluctuating between 0.8 and 1.2.
Panel b is titled Output power 8100 W. The horizontal x-axis is Frequency in k H z ranging from 0 to 10. The vertical y-axis is Intensity in d B ranging from minus 160 to minus 20. The blue data shows a similar sharp peak at 0 k H z reaching minus 30 d B, with a noise floor that slopes downward from minus 100 d B at 0 k H z to minus 110 d B at 10 k H z. An inset graph in the top right shows Normalized intensity versus Time in m s from 0 to 1000. The red data band is slightly thicker than in panel a, fluctuating between approximately 0.8 and 1.2 with occasional spikes.
Laser output properties of the gain fiber bending at 75–80 and 72–77 cm. (a) Output power versus pump power. (b) Beam quality under different powers. (c) Output spectra at different output powers. (d) Screenshot of the beam quality measurement software at the operation power of 7980 W.

Figure 13. Long description
Panel a is a line graph of Output power in W versus Pump power in W. Two data series are shown. The blue diamond series for 75 to 79.6 cm shows a slope efficiency of 78.9 percent. The red circle series for 72 to 75.9 cm shows a slope efficiency of 74.1 percent. Both show a linear increase.
Panel b is a line graph of M super 2 versus Output power in W. The red series remains stable near 1.2 until 6000 W, then spikes sharply to 1.7. The blue series remains stable until 8000 W before spiking. Insets show heat maps of the beam profile, with arrows indicating the transition from a concentrated circular core to a distorted shape.
Panel c is a line graph of Intensity in d B versus Wavelength in n m. It shows three spectral peaks centered around 1080 n m. The seed signal in blue is narrowest. The 6950 W red and 8100 W green signals are broader. A secondary peak appears at 1140 n m, with a vertical arrow indicating a difference of approximately 42 d B between the primary and secondary peaks.
Panel d shows a software interface for Caustic Result at an output power of 7980 W. It includes a table of spatial coordinates, a 2 D presentation of the beam waist showing a hyperbolic fit, and a cross-sectional beam profile. A red box highlights the M super 2 value of 1.33.
3.5 Discussion
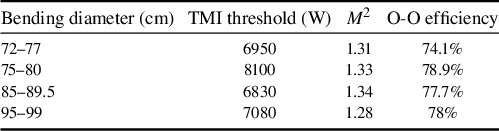
Based on the refractive index profile and bending-loss characteristics of the low-NA fiber, we conducted backward tandem-pumped experiments with four different bend diameters. TMI thresholds and the corresponding beam quality at different bending diameters are listed in Table 2. It is obvious that the TMI threshold exhibits a non-monotonic trend of initial decrease followed by an increase as the bending diameter rises. In addition, benefiting from the low core NA and small V parameter, although the bending diameter of YDF becomes large, the beam quality M 2 remains below 1.35 and no significant degradation is observed before the occurrence of TMI. When the bending diameters exceed 85 cm, the TMI threshold has a positive correlation with the bending diameter, which aligns with the mechanism of TMI suppression through HOM gain competition in the low-loss regime.
Comparison of output performances among different bending diameters at the TMI threshold.

Table 2. Long description
The table consists of four columns: Bending diameter in centimeters, T M I threshold in Watts, M super 2, and O-O efficiency.
* Row 1: Bending diameter 72–77 cm, T M I threshold 6950 W, M super 2 of 1.31, and O-O efficiency of 74.1%.
* Row 2: Bending diameter 75–80 cm, T M I threshold 8100 W, M super 2 of 1.33, and O-O efficiency of 78.9%.
* Row 3: Bending diameter 85–89.5 cm, T M I threshold 6830 W, M super 2 of 1.34, and O-O efficiency of 77.7%.
* Row 4: Bending diameter 95–99 cm, T M I threshold 7080 W, M super 2 of 1.28, and O-O efficiency of 78%.
When the bending diameter is less than 85 cm, the TMI threshold is negatively correlated with the bending diameter, consistent with the high-loss regime. Notably, the TMI threshold in the high-loss region is significantly higher than that in the low-loss region. As the bending diameter is further reduced, both the TMI threshold and the laser efficiency decrease slightly, indicating that the drop in TMI threshold is primarily due to excessive FM loss. Combined with the bending loss of this low-NA fiber, the experimental results largely follow the theoretical analysis presented in Section 2. At a bend diameter of 75 cm, the calculated FM bending loss is 0.0137 dB/m, consistent with simulation results. When the minimum bend diameter was reduced to 70 cm, the laser efficiency fell below 70%, and the cladding light posed a considerable risk to the BPSC, making high-power operation impractical. Both experimental and theoretical analyses demonstrate that for low-NA fibers supporting only a limited number of modes, TMI suppression via the tight bending method is markedly more effective than via loose bending. Moreover, there indeed exists an optimal bending-loss range that maximizes the TMI threshold.
4 Conclusion
In summary, this work provides a detailed analysis of the mechanism and effectiveness of TMI suppression via bending in large-core, low-NA fibers, particularly those supporting only a few modes. For large-core YDFs with NA ~ 0.06, the difference of bending loss between the FM and HOMs is small, typically allowing TMI suppression only through loose bending, which enhances gain competition among HOMs. In contrast, for low-NA fibers, utilizing tight bending for directly suppressing HOMs is more effective in raising TMI thresholds than relying on gain competition. Furthermore, by simultaneously considering the TMI threshold and O-O efficiency, there exists an optimal bending range for low-NA fibers that maximizes the TMI threshold under high-loss conditions. Based on the simulation results, a low-NA YDF with core/cladding diameters of 35/250 μm and a core NA of 0.032 was fabricated. Combining with a backward tandem-pumped scheme and optimized fiber bending, a highest TMI threshold of 8100 W was achieved under the high-loss region with M 2 of 1.33 before TMI onset, which aligns well with the simulation analysis. These results highlight the significant advantage of the high-loss mechanism for TMI suppression in low-NA fibers, and we believe this work would provide a theoretical basis for guiding the experimental design with such fibers, moving beyond the traditional trial-and-error approach to finding the optimal TMI suppression range. Notably, this is currently the highest power reported for a near-single-mode laser based on low-NA YDF without the limitation of SRS. The signal-to-Raman ratio exceeding 40 dB highlights the exceptional nonlinear suppression capability of this low-NA fiber. Compared with fiber lasers at the same power level[ Reference Wang, Kitahara, Kiyoyama, Shirakura, Kurihara, Nakanish, Yamamoto, Nakayama, Ikoma and Shima 39 – Reference Platonov, Yagodkin, De La Cruz, Arambula, Lizotte, Fitts and Sergeev 41 ], this low-NA fiber amplifier exhibits excellent Raman suppression performance. Specifically, it holds great potential for suppressing nonlinear effects in high-power narrow-linewidth fiber lasers to achieve a power increase[ Reference Li, Liu, Deng, Chen, Yang, Chen, Zheng, Xiao, Chen, Pan, Ma, Wang, Si, Xu and Chen 42 ]. Further power scaling will focus on overcoming the TMI limitation by optimizing the low-NA fiber design, for example, low-NA YDFs with a smaller core diameter and NA as well as refractive index profile engineering[ Reference Cui, Wang, Li, Liu, Pan, Xiao, Chen, Yan, Yang, Ma, Wang and Chen 24 ].
Acknowledgements
This work was supported in part by the Strategic Priority Research Program of the Chinese Academy of Sciences (Grant No. XDB0650000). The authors would like to express their sincere gratitude to Mr. Liang Xiao and Ms. Lianzhou Jiang for their selfless assistance during the experiment.


 Open access

