


1 Introduction
As suggested long ago by Vieille (Reference Vieille1900), gaseous detonations are supersonic combustion waves whose internal structure is a reactive layer following a non-reactive shock wave. This is called the ZND structure to honour the works of Zeldovich (Reference Zeldovich1940), Von Neumann (Reference Von Neumann1942) and Döring (Reference Döring1943). The shocked gas velocity relative to the lead shock is of the same order of magnitude as the sound speed  $a_{u}$ and, thanks to a large activation energy, the reaction rate
 $t_{r}^{-1}$ is smaller than the collision frequency
 $1/t_{r}\ll 1/t_{coll}$. Consequently, the molecular diffusivities (viscosity and molecular diffusion) are negligible in the reactive layer as shown by the large Reynolds number
 $la_{u}/\unicode[STIX]{x1D708}$ based on the thickness of the reactive layer
 $l\approx a_{u}t_{r}$ and the viscous diffusivity
 $\unicode[STIX]{x1D708}\approx a_{u}^{2}t_{coll}$,
 $a_{u}^{2}t_{r}/\unicode[STIX]{x1D708}\approx t_{r}/t_{coll}\gg 1$. Even when the propagation Mach number is close to unity
 $0<M-1\ll 1$ as is the case in the forthcoming asymptotic analysis, the thickness of the lead shock
 $a_{u}t_{coll}/(M-1)$ is smaller than the thickness of the reaction layer
 $l$ provided that the ratio of the reaction time to the collision time is sufficiently large,
 $(M-1)t_{r}/t_{coll}\gg 1$. In such a condition, the lead shock can be considered as an inert discontinuity even when the heat release is small
 $0<M-1\ll 1$, see Clavin & Searby (Reference Clavin and Searby2016).
The direct initiation of gaseous detonation refers to the formation of a self-sustained detonation in the decay of a blast wave when a large amount of energy  $E$ is deposited quasi-instantaneously in a small region of space (radius
 $r_{E}$) of an unconfined combustible gas mixture. Here, attention is limited to a spherical geometry. At the very beginning, the density of deposited energy is larger than the density of chemical energy available in the gas mixture
 $E/r_{E}^{3}\gg \unicode[STIX]{x1D70C}_{u}q_{m}$,
 $\unicode[STIX]{x1D70C}_{u}$ and
 $q_{m}$ denoting the density and the chemical energy per unit mass in the initial gaseous mixture. Therefore, the initial condition is the Sedov–Taylor (Sedov Reference Sedov1946; Taylor Reference Taylor1950b) self-similar solution of a strong blast wave in an inert gas, expressing how the propagation velocity
 ${\mathcal{D}}$ decreases with the shock radius
 $r_{f}$,
 ${\mathcal{D}}\propto (E/\unicode[STIX]{x1D70C}_{u})^{1/2}/r_{f}^{3/2}$. A critical radius
 $r^{\ast }$ larger than the detonation thickness,
 $r^{\ast }\gg l$,
 $r^{\ast }/l\approx 300$, and a critical energy
 $E^{\ast }\propto \unicode[STIX]{x1D70C}_{u}q_{m}r^{\ast 3}$ have been identified for a long time by numerous experiments, see Lee (Reference Lee1977) and Lee (Reference Lee1984). For
 $E>E^{\ast }$ the self-sustained Chapman–Jouguet detonation (CJ regime characterized by a sonic condition at the exit of the reaction zone and a minimum propagation velocity
 ${\mathcal{D}}_{_{CJ}}$) is reached at a radius
 ${\approx}(E/\unicode[STIX]{x1D70C}_{u}q_{m})^{1/3}$ larger than
 $r^{\ast }$. For
 $E<E^{\ast }$ a progressive decoupling of the reaction zone from the lead shock produces the failure of initiation; the shock intensity continuously decreases and no detonation occurs.
Pioneering numerical solutions of direct initiation were performed by Korobeinikov (Reference Korobeinikov1971) assuming that the detonation wave is a discontinuity across which the planar jump conditions are satisfied. This problem was reconsidered more recently by Liñan, Kurdyumov & Sanchez (Reference Liñan, Kurdyumov and Sanchez2012), providing us with new insights into the transition between two self-similar solutions, namely the solution of Sedov (Reference Sedov1946) and Taylor (Reference Taylor1950b) for a strong non-reactive blast wave and the solution of Zeldovich (Reference Zeldovich1942) and Taylor (Reference Taylor1950a) for a spherical CJ detonation. Under the approximation of the discontinuous model there is no critical energy: the overdriven detonation that is initially generated by the blast wave relaxes systematically to a planar CJ wave at a finite radius proportional to  $(E/\unicode[STIX]{x1D70C}_{u}q_{m})^{1/3}$ no matter the value of
 $E$. This indicates clearly that the critical energy should be related to small modifications of the inner structure of the detonation wave (finite thickness effect).
A first criterion was proposed by Zeldovich, Kogarko & Simonov (Reference Zeldovich, Kogarko and Simonov1956). Considering that the time taken by the blast wave to reach the planar CJ velocity  ${\mathcal{D}}_{o_{CJ}}\approx 2\,\sqrt{q_{m}}$ should be larger than the reaction time
 $t_{r}$, the order of magnitude of the critical radius predicted by Zeldovich et al. (Reference Zeldovich, Kogarko and Simonov1956) is of the same order of magnitude as the thickness of the planar CJ wave
 $l_{o_{CJ}}$,
 $r^{\ast }\approx l_{o_{CJ}}$. This is in contradiction with experiments. Using a relevant value of
 $t_{r}$, this criterion leads to a critical energy which is smaller than the experimental data by a factor
 $10^{-5}$ to
 $10^{-6}$. A further step was achieved forty years later by He & Clavin (Reference He and Clavin1994), who considered the modification of the inner structure generated by a small curvature of the wave amplified by the strong thermal sensitivity of the induction length governed by an Arrhenius law with a large activation energy
 ${\mathcal{E}}/k_{B}T\gg 1$. The He & Clavin (Reference He and Clavin1994) analysis of curved CJ detonations was performed for a large Mach number
 $M\gg 1$ in the limit
 ${\mathcal{E}}/k_{B}T\rightarrow \infty$, using a quasi-steady inner structure modelled by the crude square-wave model (chemical energy released instantaneously after the induction delay). The analysis leads to a nonlinear relation between the propagation velocity
 ${\mathcal{D}}_{_{CJ}}$ of a curved CJ detonation and the curvature
 $1/r_{f}$. The corresponding curve
 ${\mathcal{D}}_{_{CJ}}/{\mathcal{D}}_{o_{CJ}}$ versus
 $r_{f}/l_{o_{CJ}}$ presents a C-shape exhibiting a quasi-steady curvature-induced quenching; there is no quasi-steady solution of spherical CJ wave with a radius smaller than a critical
 $r_{f}^{\ast }$ which is larger than
 $l_{o_{CJ}}$ by a factor of a few hundreds, essentially because the activation energy is large
 ${\mathcal{E}}/k_{B}T\gg 1$. The energy varying like
 $r_{f}^{3}$, the order of magnitude of the experimental critical energy is recovered.
The quasi-steady analysis is not fully satisfactory, even though the numerical simulations of He & Clavin (Reference He and Clavin1994) (one-step model) and of He (Reference He1996) (detailed chemical scheme for the combustion of hydrogen–oxygen mixtures) are in satisfactory agreement with the critical radius  $r_{f}^{\ast }$, at least concerning its order of magnitude. The unsteady effects are important near criticality. For example, a quasi-quenching of the detonation with a propagation velocity decreasing well below
 ${\mathcal{D}}_{o_{CJ}}$, followed by a sudden re-ignition, is exhibited near criticality. This illustrates that the initiation process is different from the quasi-steady decay of an overdriven detonation. The corresponding interplay of pressure waves and reaction rate was analysed numerically by Lee & Higgins (Reference Lee and Higgins1999). The importance of unsteadiness was emphasized by Ecket, Quirk & Shepherd (Reference Ecket, Quirk and Shepherd2000) whose numerical simulations (for a one-step exothermal reaction governed by an Arrhenius law) show that the unsteady terms are larger than the geometrical terms. However, the critical radius
 $r_{f}^{\ast }$ is not much different from that in He & Clavin (Reference He and Clavin1994), it is smaller by a factor between 2 and 4. Considering the difference of detonation model, the agreement is satisfactory since the square-wave model used by He & Clavin (Reference He and Clavin1994) overestimates the critical radius. Nevertheless the behaviour of the dynamics near criticality cannot be reproduced by the quasi-steady approximation. The specific effect of a small curvature was pointed out in He & Clavin (Reference He and Clavin1994) by comparing the numerical simulations in spherical geometry with those in planar geometry. In the latter case the critical distance
 $r^{\ast }$ is still larger than the detonation thickness but ten times smaller than the critical radius in spherical geometry. Therefore both curvature and unsteadiness are important near criticality. A somewhat different point of view is presented by Ecket et al. (Reference Ecket, Quirk and Shepherd2000), who concluded that ‘the primary failure mechanism is found to be unsteadiness’.
The purpose of the present analytical study is to investigate the role of unsteadiness combined with the curvature effects. There are two different unsteady effects. One is inherent to the driving mechanism of the detonation decay, namely the rarefaction wave in the burnt gas. The other is the intrinsic dynamics of the inner detonation structure controlling the response to variations of the flow of burnt gas. The latter mechanism cannot be described by the square-wave model which is well known to introduce a singular dynamics. The full problem is too complicated for general analytical solutions to be obtained. Not only is the dynamics of the inner structure of the detonation a tough problem but also the rarefaction wave (the cause) depends on the dynamics of the detonation decay (the effect). Moreover, separating the inner structure from the inert rarefaction wave is not an easy task in a spherical geometry. According to the Sedov–Taylor self-similar solution, the characteristic time of evolution of the blast wave  ${\mathcal{D}}/(\text{d}{\mathcal{D}}/\text{d}t)$ is of order
 $r/{\mathcal{D}}$, which is larger than the transit time of a fluid particle through the detonation structure (
 $l/{\mathcal{D}}$) by a factor
 $r/l$ (a large number near criticality
 $r^{\ast }/l\gg 1$). This does not ensure that a quasi-steady approximation is accurate since, according to Clavin & Williams (Reference Clavin and Williams2002), the response time of the inner structure is also larger than
 $l/{\mathcal{D}}$. The cumulative effect of feedback loops controlling the inner dynamics can be summarized as follows. The disturbance, introduced at the lead shock by variation of its velocity
 ${\mathcal{D}}$, propagates downstream (in the reference frame attached to the shock) towards the burnt gas with two modes, a downstream-running acoustic mode and an entropy wave. The resulting modification of heat release in turn perturbs the flow and thereby affects the shock velocity after a time delay associated with the upstream-running acoustic mode and thus depending on the place of emission. When approaching the CJ regime, the flow near the end of heat release becomes quasi-transonic and the delay of the upstream-running mode is larger than those associated with the downstream-running modes, including the entropy wave whose transit time is of order
 $l/{\mathcal{D}}$. At the leading order of a multiple-time-scale analysis, the downstream-running modes can be considered as quasi-instantaneous and the dynamics is mainly controlled by the upstream-running mode. The key unsteady mechanism of direct initiation when the CJ regime is approached is the time delay for transferring the rarefaction-wave-induced deceleration to the lead shock. Because of the transonic flow at the exit of the inner detonation structure, the delay increases and diverges at the CJ velocity, producing a drastic unsteady effect upon the dynamics. This difficult topic has not yet been addressed in the context of the direct initiation process. The present work is an attempt to fill this gap by an asymptotic analysis reducing the problem to solve a single nonlinear hyperbolic equation. Only the end of the detonation decay during a successful initiation is analysed in detail here. The study of the dynamics is more difficult near criticality and requires a different theoretical approach left to future studies.
The multiple-time-scale nature of the dynamics is stressed and enlightened in the limit of small heat release ( $M-1\ll 1$) since the flow becomes quasi-transonic throughout the inner structure of the detonation. Combined with the Newtonian approximation in the reaction zone and a large activation energy, a small heat release is a convenient limit for the analytical study of the unsteady inner structure of detonation since the interplay of pressure waves, entropy wave and chemical kinetics at work in real detonations is fully taken into account. Moreover, purely technical difficulties (such as variation of the sound speed with the temperature and compressional heating in the reaction zone) are suppressed without modifying the order of magnitude of the result. Then, despite the difference of Mach numbers (
 $M$ close to unity while
 $M\in [4,8]$ in ordinary gaseous detonations), the dynamics is relevant for real detonations, at least qualitatively, provided that the shock wave at the leading edge of the ZND structure is still considered as an inert discontinuity satisfying the Rankine–Hugoniot conditions, as discussed earlier. Such asymptotic analyses have been performed in planar geometry by Clavin & Williams (Reference Clavin and Williams2002) for the stability analysis of slightly overdriven detonations against planar disturbances, extended later to multidimensional disturbances in Clavin & Williams (Reference Clavin and Williams2009). The numerical study of weakly nonlinear regimes performed by Faria, Kasimov & Rosales (Reference Faria, Kasimov and Rosales2015) in this limit shows cellular patterns similar to those observed in ordinary detonations.
In the present paper a similar asymptotic analysis is carried out for the direct initiation process in a spherical geometry. The attention is focused onto the trajectories close to the CJ velocity. The primary result is to show that the dynamics is controlled by a single hyperbolic equation for a scalar field representative of the flow inside the inner structure of the detonation. The problem of the dynamics of the inner structure is closed because the deceleration of the burnt at the downstream boundary condition is related to the curvature of the detonation wave. This relation, which was first obtained by Liñan et al. (Reference Liñan, Kurdyumov and Sanchez2012) with the discontinuous model in the opposite limit  $M\gg 1$, is still valid for small heat release. As in the study of Clavin & Denet (Reference Clavin and Denet2018) concerning the decay of plane detonations when the supporting piston is suddenly arrested, the analysis is not limited to a particular chemical kinetics scheme. The basic inputs are the spatial distribution of heat release in the planar CJ detonation (in steady state) and the thermal sensitivity of the detonation thickness. In order to overcome the current technical difficulty in a spherical geometry to match the reaction zone with the external flow through a quasi-transonic zone, the rate of heat release is assumed to drop sharply to zero at the end of the reaction zone. For successful initiation the instantaneous propagation velocity
 ${\mathcal{D}}(t)$ is the solution of an integral equation. Marginally stable and/or unstable detonations are investigated for a parameter controlling the thermal sensitivity of the planar dynamics smaller than that controlling the curvature effect. Unsteadiness is highlighted in the phase space of propagation velocity versus shock radius by comparison with the quasi-steady trajectories. A new and intriguing phenomenon at work during pulsations of unstable detonations is described.
The general formulation is recalled in § 2. Extending previous analyses to a spherical geometry, the double limit of small heat release and large activation energy is presented in § 3. The peninsula of steady spherical CJ detonations representative of a curvature-induced quenching is revisited in § 4, extending the result of He & Clavin (Reference He and Clavin1994) to a smooth distribution of reaction rate. The inner structure of the spherical CJ wave is presented in § 5 with a discussion concerning the sonic point. The closure relation and the hyperbolic equation controlling the initiation process are derived in § 6. The quasi-steady trajectories showing a transition between success and failure of the initiation process are presented in § 7. The limitation of the quasi-steady approximation is discussed in this section. The integral equation for  ${\mathcal{D}}(t)$ is derived in § 8. The results and the complexity of the nonlinear dynamics are discussed in § 9 where unsteady trajectories of ‘velocity–radius’ are presented, pointing out the drastic effect upon the dynamics of the increase of the time delay near the CJ regime. Also a new dynamical phenomenon is identified in this section. Conclusions and perspectives are presented in § 10. In view of a self-contained paper, four appendices supplement the main text. Technical calculations are developed in appendix A. The method of solution of a hyperbolic equation with a moving boundary is presented in appendix B. The dynamics of planar detonations is recalled in appendix C where the cold boundary difficulty of the CJ regime is also discussed. An analytical expression for the time delay along a straight trajectory ending abruptly on the CJ regime is presented in appendix D for a simple model.
2 General formulation
2.1 Constitutive equations
In a spherical geometry,  $\unicode[STIX]{x1D735}\boldsymbol{\cdot }\boldsymbol{u}=\unicode[STIX]{x2202}u/\unicode[STIX]{x2202}r+2u/r$, Euler’s equations take the form
 $$\begin{eqnarray}\frac{1}{\unicode[STIX]{x1D70C}}\left(\frac{\unicode[STIX]{x2202}}{\unicode[STIX]{x2202}t}+u\frac{\unicode[STIX]{x2202}}{\unicode[STIX]{x2202}r}\right)\unicode[STIX]{x1D70C}+\frac{\unicode[STIX]{x2202}u}{\unicode[STIX]{x2202}r}+2\frac{u}{r}=0,\quad \unicode[STIX]{x1D70C}\left(\frac{\unicode[STIX]{x2202}}{\unicode[STIX]{x2202}t}+u\frac{\unicode[STIX]{x2202}}{\unicode[STIX]{x2202}r}\right)u=-\frac{\unicode[STIX]{x2202}p}{\unicode[STIX]{x2202}r},\end{eqnarray}$$
 $$\begin{eqnarray}\left(\frac{\unicode[STIX]{x2202}}{\unicode[STIX]{x2202}t}+u\frac{\unicode[STIX]{x2202}}{\unicode[STIX]{x2202}r}\right)\left[\ln T-\frac{(\unicode[STIX]{x1D6FE}-1)}{\unicode[STIX]{x1D6FE}}\ln p\right]=\frac{q_{m}}{c_{p}T}\frac{{\dot{w}}(T,Y)}{t_{r}},\quad \,\left(\frac{\unicode[STIX]{x2202}}{\unicode[STIX]{x2202}t}+u\frac{\unicode[STIX]{x2202}}{\unicode[STIX]{x2202}r}\right)Y=\frac{{\dot{w}}(T,Y)}{t_{r}},\end{eqnarray}$$
where  $\unicode[STIX]{x1D70C}$,
 $p$ and
 $u$ are respectively the density, the pressure and the radial velocity of the flow in the laboratory frame and
 $\unicode[STIX]{x1D6FE}$,
 $q_{m}$,
 $T$,
 $Y$,
 $t_{r}$ and
 ${\dot{w}}$ are respectively the ratio of specific heat
 $\unicode[STIX]{x1D6FE}\equiv c_{p}/c_{v}=\text{const.}$, the chemical heat release per unit mass of mixture, the temperature, the progress variable (
 $Y=0$ in the initial mixture and
 $Y=1$ in the burned gas,
 $1-Y$ is the reduced mass fraction of the limiting component in a one-step reaction), the reaction time at the Neuman state of the planar CJ detonation and the non-dimensional heat-release rate. The second equation in (2.2) is a short notation for a complex chemical kinetics of combustion, the analysis not being limited to a one-step scheme. Assuming the ideal gas law, the pressure
 $p$ and the sound speed
 $a$ are
 $$\begin{eqnarray}p=\frac{\unicode[STIX]{x1D6FE}-1}{\unicode[STIX]{x1D6FE}}c_{p}\unicode[STIX]{x1D70C}T,\quad a=\sqrt{\unicode[STIX]{x1D6FE}\frac{p}{\unicode[STIX]{x1D70C}}}.\end{eqnarray}$$
Attention is focused on an irreversible exothermal reaction whose rate  ${\dot{w}}(Y,T)\geqslant 0$ is dependent on the temperature
 $T$ and the progress variable
 $Y$. The pressure dependence of the reaction rate is neglected for simplicity by comparison with the thermal sensitivity. An alternative form of the energy equation in (2.2) is expressed in terms of
 $p$ and
 $u$ by using the ideal gas law (2.3) when
 $\unicode[STIX]{x1D70C}$ is eliminated by using the mass conservation (2.1),
 $$\begin{eqnarray}\frac{1}{\unicode[STIX]{x1D6FE}p}\left(\frac{\unicode[STIX]{x2202}}{\unicode[STIX]{x2202}t}+u\frac{\unicode[STIX]{x2202}}{\unicode[STIX]{x2202}r}\right)p+\frac{\unicode[STIX]{x2202}u}{\unicode[STIX]{x2202}r}+2\frac{u}{r}=\frac{q_{m}}{c_{p}T}\frac{{\dot{w}}(T,Y)}{t_{r}}.\end{eqnarray}$$
Equations for the conservation of mass and momentum in (2.1) can be put into the form of two hyperbolic equations for  $u$ and
 $p$ when the equation for conservation of momentum in (2.1) is multiplied by
 $a/(\unicode[STIX]{x1D6FE}p)=1/(\unicode[STIX]{x1D70C}a)$ and added to and subtracted from (2.4)
 $$\begin{eqnarray}\frac{1}{\unicode[STIX]{x1D6FE}p}\left[\frac{\unicode[STIX]{x2202}}{\unicode[STIX]{x2202}t}+(u\pm a)\frac{\unicode[STIX]{x2202}}{\unicode[STIX]{x2202}r}\right]p\pm \frac{1}{a}\left[\frac{\unicode[STIX]{x2202}}{\unicode[STIX]{x2202}t}+(u\pm a)\frac{\unicode[STIX]{x2202}}{\unicode[STIX]{x2202}r}\right]u=\frac{q_{m}}{c_{p}T}\frac{{\dot{w}}}{t_{r}}-2\frac{u}{r}.\end{eqnarray}$$
These equations relating the propagation of the disturbances of pressure  $p$ and radial velocity
 $u$ to the rate of heat release
 ${\dot{w}}/t_{r}$ and the divergence of the flow
 $2u/r$ are the extension of the usual characteristic equations (simple waves) to reacting gases in spherical geometry. When (2.3) is used and when the chemical kinetics
 ${\dot{w}}(T,Y)$ is known, the four equations in (2.2) and (2.5) form a closed set for
 $p$,
 $u$,
 $T$ and
 $Y$.
2.2 Formulation
Considering the lead shock as a discontinuity in the flow of inert gas at initial temperature  $T_{u}$ (composition frozen far from chemical equilibrium,
 $Y=0$,
 ${\dot{w}}(T_{u},0)=0$), the boundary conditions in the compressed gas at the front of the lead shock (Neumann state denoted by the subscript
 $N$) are given by the Rankine–Hugoniot equations
 $$\begin{eqnarray}\frac{p_{N}}{p_{u}}=1+\frac{2\unicode[STIX]{x1D6FE}}{\unicode[STIX]{x1D6FE}+1}(M^{2}-1),\quad \frac{\unicode[STIX]{x1D70C}_{N}}{\unicode[STIX]{x1D70C}_{u}}=\frac{1+(M^{2}-1)}{1+\frac{\unicode[STIX]{x1D6FE}-1}{\unicode[STIX]{x1D6FE}+1}(M^{2}-1)},\quad \frac{u_{N}}{a_{u}}=\left(1-\frac{\unicode[STIX]{x1D70C}_{u}}{\unicode[STIX]{x1D70C}_{N}}\right)M,\end{eqnarray}$$
where the subscript  $u$ denotes the fresh mixture at rest and
 $M\equiv {\mathcal{D}}/a_{u}$ is the propagation Mach number,
 ${\mathcal{D}}$ being the propagation velocity of the lead shock velocity. Introducing the equation for the trajectory of the shock front,
 $r=r_{f}(t)$,
 $\text{d}r_{f}/\text{d}t={\mathcal{D}}(t)$, it is convenient to use the coordinate attached to the lead shock
 $$\begin{eqnarray}\equiv r-r_{f}(t)\quad \Rightarrow \quad \unicode[STIX]{x2202}/\unicode[STIX]{x2202}r\rightarrow \unicode[STIX]{x2202}/\unicode[STIX]{x2202},\quad \unicode[STIX]{x2202}/\unicode[STIX]{x2202}t\rightarrow \unicode[STIX]{x2202}/\unicode[STIX]{x2202}t-{\mathcal{D}}(t)\unicode[STIX]{x2202}/\unicode[STIX]{x2202}.\end{eqnarray}$$
Considering an expanding spherical detonation,  ${\dot{r}}_{f}\equiv \text{d}r_{f}/\text{d}t>0$,
 $u\geqslant 0$, the initial mixture and the compressed gas are located at
 $x>0$ and
 $x\leqslant 0$ respectively. The boundary conditions in the Neumann state take the form
 $$\begin{eqnarray}=0:\quad Y=0,\quad {\dot{w}}={\dot{w}}_{N}(T_{N})>0,\quad p=p_{N}(t),\quad T=T_{N}(t),\quad u=u_{N}(t),\end{eqnarray}$$
where  $p_{N}(t)$,
 $T_{N}(t)$ and
 $u_{N}(t)$ are given in terms of the instantaneous propagation velocity
 ${\mathcal{D}}(t)$ in (2.6).
A rear boundary condition in the burned gas is required to solve the detonation dynamics  $M(t)$. When the length scale of the external flow
 $u_{ext}(r,t)$ in the burnt gas is larger than the detonation thickness,
 $l_{ext}\gg a_{u}t_{r}$,
 $1/l_{ext}\equiv |(1/u_{ext})\unicode[STIX]{x2202}u_{ext}/\unicode[STIX]{x2202}r|_{r=r_{f}(t)}$, and when attention is focused on weakly curved detonations,
 $r_{f}/a_{N}t_{r}\gg 1$, the solution can be decomposed into two parts: the inner structure of the detonation wave and the external flow of burnt gas,
 $u_{ext}(r,t)$. Generally speaking, matching the end of the inner structure and the burnt-gas flow is a delicate issue, especially near the CJ regime, since the flow is transonic in the matching layer. The difficulty is overcome here by a detonation structure in which the distance between the end of the exothermal reaction and the lead shock is bounded. Introducing the non-dimensional coordinate
 $\unicode[STIX]{x1D709}$ attached to the moving front of the lead shock,
 $$\begin{eqnarray}\unicode[STIX]{x1D709}\equiv \frac{r-r_{f}(t)}{a_{u}t_{r}},\end{eqnarray}$$
and denoting by  $\unicode[STIX]{x1D709}_{b}<0$ the end of the inner structure where the external flow is prescribed, the rear boundary condition takes the form
 $$\begin{eqnarray}|\unicode[STIX]{x1D709}_{b}|=O(1),\quad \unicode[STIX]{x1D709}=\unicode[STIX]{x1D709}_{b}(\unicode[STIX]{x1D70F})<0:\quad u=u_{b}(t),\quad u_{b}(t)=u_{ext}(r_{f}(t),t),\end{eqnarray}$$
the flow field of burnt gas  $u_{ext}(r,t)$ being the solution to the external problem. It has been known for a long time that the sonic point inside the inner structure of a curved Chapman–Jouguet detonation in steady state is located at a point of incomplete reaction where the rate of heat release is balanced by the divergence of the flow, see Wood & Kirkwood (Reference Wood and Kirkwood1954) and § 5 below. The sonic locus is a saddle point through which the steady solution satisfying the boundary condition at the Neumann state should go (determining the CJ velocity). More details and references can be found in Fickett & Davis (Reference Fickett and Davis1979), Short & Bdzil (Reference Short and Bdzil2003) and Stewart & Kasimov (Reference Stewart and Kasimov2005). For a weak curvature, the distance between the sonic point and the end of the heat release is small if the thermal sensitivity of the detonation thickness is large, see § 5.1. This is the case in the analysis of a weakly curved detonation in steady state by Yao & Stewart (Reference Yao and Stewart1995) in the limit of a large activation energy of a one-step reaction governed by an Arrhenius law. In the present unsteady study, the instantaneous external flow is prescribed near the end of the exothermal reaction,
 $$\begin{eqnarray}\unicode[STIX]{x1D709}=\unicode[STIX]{x1D709}_{b}(\unicode[STIX]{x1D70F}):\quad {\dot{w}}(Y,T)\approx 0,\quad \unicode[STIX]{x1D709}_{b}<\unicode[STIX]{x1D709}\leqslant 0:\quad {\dot{w}}(Y,T)>0,\end{eqnarray}$$
anticipating that the precise definition of  $\unicode[STIX]{x1D709}_{b}(\unicode[STIX]{x1D70F})$ introduces a negligible correction to the time-dependent velocity
 ${\mathcal{D}}(t)$ of the lead shock when the thermal sensitivity is large.
3 Governing equations in the limit of small heat release
Direct initiation of detonation is studied here by an asymptotic analysis in the double limit of small heat release  $\unicode[STIX]{x1D716}^{2}\equiv q_{m}/c_{p}T_{u}\ll 1$ and large thermal sensitivity, using the Newtonian approximation (ratio of specific heats
 $\unicode[STIX]{x1D6FE}\equiv c_{p}/c_{v}>1$ close to unity),
 $$\begin{eqnarray}\unicode[STIX]{x1D716}\equiv \sqrt{q_{m}/c_{p}T_{u}}\approx (M_{o_{CJ}}-1)\ll 1,\quad (\unicode[STIX]{x1D6FE}-1)/\unicode[STIX]{x1D716}\ll 1,\end{eqnarray}$$
where  $M_{o_{CJ}}\equiv {\mathcal{D}}_{o_{CJ}}/a_{u}\approx 1+\sqrt{q_{m}/c_{p}T_{u}}$ is the Mach number of the planar CJ wave in steady state propagating at the velocity
 ${\mathcal{D}}_{o_{CJ}}$. For a small difference of specific heats such as (3.1), the compressional heating is negligible in the reaction zone by comparison with the chemical heat release. This is indeed an accurate approximation in real detonations. The limit of small heat release provides us with a systematic way to take full advantage of the two time scales of the dynamics.
3.1 Two-time-scale analysis of the transonic flow
Considering a radius of the lead shock  $r_{f}$ larger than the detonation thickness,
 $$\begin{eqnarray}\frac{a_{u}t_{r}}{r_{f}}=\unicode[STIX]{x1D716}\unicode[STIX]{x1D705},\end{eqnarray}$$
where  $\unicode[STIX]{x1D705}$ is a non-dimensional parameter for the curvature of the detonation wave, the simplification in the limit
 $\unicode[STIX]{x1D716}\rightarrow 0$ is similar to that in plane geometry. The flow is transonic throughout the inner structure of the detonation so that the problem is one of two time scales; the inner structure evolves slowly, on a time scale larger by a factor
 $1/\unicode[STIX]{x1D716}$ than the transit time of a fluid particle. Moreover, the variation of the sound speed can be neglected
 $a_{b}/a_{u}=1+O(\unicode[STIX]{x1D716}^{2})$. The modification of the sound speed across the inner structure of real detonations introduces small quantitative differences but no new qualitative effects.
For a propagation velocity close the CJ velocity of the planar detonation we introduce the same dimensionless quantities of order unity in the limit (3.1) as in Clavin & Denet (Reference Clavin and Denet2018),  $\unicode[STIX]{x1D707}(\unicode[STIX]{x1D709},\unicode[STIX]{x1D70F})$,
 $\unicode[STIX]{x03C0}(\unicode[STIX]{x1D709},\unicode[STIX]{x1D70F})$ and
 $\dot{\unicode[STIX]{x1D6FC}}_{\unicode[STIX]{x1D70F}}(\unicode[STIX]{x1D70F})$ for respectively the flow velocity in the laboratory frame, the pressure and the instantaneous propagation velocity of the lead shock
 ${\mathcal{D}}(t)=\text{d}r_{f}/\text{d}t$,
 $$\begin{eqnarray}\frac{u-{\mathcal{D}}_{o_{CJ}}}{a_{u}}\equiv -1+\unicode[STIX]{x1D716}\unicode[STIX]{x1D707}(\unicode[STIX]{x1D709},\unicode[STIX]{x1D70F}),\quad \frac{{\mathcal{D}}-{\mathcal{D}}_{o_{CJ}}}{a_{u}}\equiv \unicode[STIX]{x1D716}\,\dot{\unicode[STIX]{x1D6FC}}_{\unicode[STIX]{x1D70F}}(\unicode[STIX]{x1D70F}),\quad \frac{1}{\unicode[STIX]{x1D6FE}}\ln \left(\frac{p}{p_{u}}\right)\equiv \unicode[STIX]{x1D716}\unicode[STIX]{x03C0}(\unicode[STIX]{x1D709},\unicode[STIX]{x1D70F}).\end{eqnarray}$$
Focusing attention onto the inner structure of the detonations,  $\unicode[STIX]{x1D709}=O(1)$, the non-dimensional curvature term
 $r_{f}/r$ is, according to (2.9) and (3.2), almost constant and equal to unity across the inner structure of the detonation
 $$\begin{eqnarray}\frac{r_{f}}{r}=\frac{1}{1+\unicode[STIX]{x1D716}\unicode[STIX]{x1D705}\unicode[STIX]{x1D709}}=1+O(\unicode[STIX]{x1D716})\quad \Rightarrow \quad \frac{1}{r}=\frac{1}{r_{f}}\left[1+O(\unicode[STIX]{x1D716})\right].\end{eqnarray}$$
When the terms smaller than  $\unicode[STIX]{x1D716}^{2}$ are neglected, equations (2.5), written in the reference frame attached to the lead shock (2.7), take the following non-dimensional form
 $$\begin{eqnarray}\displaystyle & \displaystyle \unicode[STIX]{x1D716}\left[t_{r}\frac{\unicode[STIX]{x2202}}{\unicode[STIX]{x2202}t}+\left[-2+\unicode[STIX]{x1D716}(\unicode[STIX]{x1D707}-\dot{\unicode[STIX]{x1D6FC}}_{\unicode[STIX]{x1D70F}})\right]\frac{\unicode[STIX]{x2202}}{\unicode[STIX]{x2202}\unicode[STIX]{x1D709}}\right](\unicode[STIX]{x03C0}-\unicode[STIX]{x1D707})=\unicode[STIX]{x1D716}^{2}{\dot{w}}-2\unicode[STIX]{x1D716}^{2}(1+\unicode[STIX]{x1D707})\unicode[STIX]{x1D705}, & \displaystyle\end{eqnarray}$$
 $$\begin{eqnarray}\displaystyle & \displaystyle \unicode[STIX]{x1D716}\left[t_{r}\frac{\unicode[STIX]{x2202}}{\unicode[STIX]{x2202}t}+\unicode[STIX]{x1D716}(\unicode[STIX]{x1D707}-\dot{\unicode[STIX]{x1D6FC}}_{\unicode[STIX]{x1D70F}})\frac{\unicode[STIX]{x2202}}{\unicode[STIX]{x2202}\unicode[STIX]{x1D709}}\right](\unicode[STIX]{x03C0}+\unicode[STIX]{x1D707})=\unicode[STIX]{x1D716}^{2}{\dot{w}}-2\unicode[STIX]{x1D716}^{2}(1+\unicode[STIX]{x1D707})\unicode[STIX]{x1D705}, & \displaystyle\end{eqnarray}$$
which are obtained from (2.5) and (2.7) by using (3.1)–(3.3) written in the form
 $$\begin{eqnarray}\frac{u}{a_{u}}=\unicode[STIX]{x1D716}(1+\unicode[STIX]{x1D707}),\quad \frac{(u-{\mathcal{D}})}{a_{u}}=\unicode[STIX]{x1D716}(\unicode[STIX]{x1D707}-\dot{\unicode[STIX]{x1D6FC}}_{\unicode[STIX]{x1D70F}})-1,\quad \frac{u}{r}=\unicode[STIX]{x1D716}^{2}\unicode[STIX]{x1D705}(1+\unicode[STIX]{x1D707})\frac{r_{f}}{r}.\end{eqnarray}$$
Notice the difference of notation from Clavin & Williams (Reference Clavin and Williams2002) who used the notation  $\unicode[STIX]{x1D707}$ for the flow velocity relative to the lead shock
 $({\mathcal{D}}-u)/a_{u}$. The boundary conditions at the Neumann state (2.6) yield
 $$\begin{eqnarray}\unicode[STIX]{x1D709}=0:\quad \unicode[STIX]{x1D707}=\unicode[STIX]{x1D707}_{N}(\unicode[STIX]{x1D70F})=(1+2\dot{\unicode[STIX]{x1D6FC}}_{\unicode[STIX]{x1D70F}})+O(\unicode[STIX]{x1D716}),\quad \unicode[STIX]{x03C0}=\unicode[STIX]{x03C0}_{N}(\unicode[STIX]{x1D70F})=2(1+\dot{\unicode[STIX]{x1D6FC}}_{\unicode[STIX]{x1D70F}})+O(\unicode[STIX]{x1D716}).\end{eqnarray}$$
The two-time-scale nature of the dynamics in the limit (3.1) is seen from (3.5) and (3.6). The velocity of the simple wave (3.5), issued from the lead shock ( $\unicode[STIX]{x1D709}=0$) and propagating toward the exit of the reaction zone (in the negative
 $\unicode[STIX]{x1D709}$ direction) is larger (by a factor
 $1/\unicode[STIX]{x1D716}$) than the velocity of the simple wave (3.6), issued from the reaction zone and propagating in the opposite direction for sending the signal back to the lead shock. Therefore, to leading order in the limit (3.1), the propagation mechanism in (3.5) is considered as instantaneous compared to the simple wave (3.6) which thus controls the dynamics of the inner structure. The resulting dynamics of the inner structure is slow at the scale of the transit time
 $t_{r}$ and the reduced time scale of order unity is
 $$\begin{eqnarray}\unicode[STIX]{x1D70F}\equiv \unicode[STIX]{x1D716}\frac{t}{t_{r}},\quad \frac{\unicode[STIX]{x2202}}{\unicode[STIX]{x2202}t}=\frac{\unicode[STIX]{x1D716}}{t_{r}}\frac{\unicode[STIX]{x2202}}{\unicode[STIX]{x2202}\unicode[STIX]{x1D70F}}.\end{eqnarray}$$
The leading order of (3.5),  $\unicode[STIX]{x2202}(\unicode[STIX]{x03C0}-\unicode[STIX]{x1D707})/\unicode[STIX]{x2202}\unicode[STIX]{x1D709}=0$, shows that, according to (3.8), the quantity
 $\unicode[STIX]{x03C0}-\unicode[STIX]{x1D707}$ is constant,
 $(\unicode[STIX]{x03C0}-\unicode[STIX]{x1D707})\approx 1$. Expressed in terms of the reduced time (3.9) the leading order of (3.6) in the limit (3.1) takes the form of a single nonlinear equation for the non-dimensional flow velocity
 $\unicode[STIX]{x1D707}(\unicode[STIX]{x1D709},\unicode[STIX]{x1D70F})$ satisfying the boundary conditions (2.10) and (3.8)
 $$\begin{eqnarray}\frac{\unicode[STIX]{x2202}\unicode[STIX]{x1D707}}{\unicode[STIX]{x2202}\unicode[STIX]{x1D70F}}+[\unicode[STIX]{x1D707}-\dot{\unicode[STIX]{x1D6FC}}_{\unicode[STIX]{x1D70F}}(\unicode[STIX]{x1D70F})]\frac{\unicode[STIX]{x2202}\unicode[STIX]{x1D707}}{\unicode[STIX]{x2202}\unicode[STIX]{x1D709}}=\frac{{\dot{w}}(T,Y)}{2}-(1+\unicode[STIX]{x1D707})\unicode[STIX]{x1D705}(\unicode[STIX]{x1D70F}),\end{eqnarray}$$
 $$\begin{eqnarray}\unicode[STIX]{x1D709}=0:\quad \unicode[STIX]{x1D707}=1+2\dot{\unicode[STIX]{x1D6FC}}_{\unicode[STIX]{x1D70F}}(\unicode[STIX]{x1D70F}),\quad \unicode[STIX]{x1D709}=\unicode[STIX]{x1D709}_{b}(\unicode[STIX]{x1D70F}):\quad \unicode[STIX]{x1D707}=\unicode[STIX]{x1D707}_{b}(\unicode[STIX]{x1D70F}),\end{eqnarray}$$
where, skipping the matching difficulty mentioned in § 2.2, the function  $\unicode[STIX]{x1D707}_{b}(\unicode[STIX]{x1D70F})$ is given by the external solution, except for the CJ regime for which the dynamics of the inner structure is decoupled from the flow of burnt gas by the sonic condition,
 $$\begin{eqnarray}\text{CJ wave:}\quad \unicode[STIX]{x1D709}=\unicode[STIX]{x1D709}_{b}(\unicode[STIX]{x1D70F}):\quad \unicode[STIX]{x1D707}=\dot{\unicode[STIX]{x1D6FC}}_{\unicode[STIX]{x1D70F}}(\unicode[STIX]{x1D70F})\end{eqnarray}$$
( $\dot{\unicode[STIX]{x1D6FC}}_{\unicode[STIX]{x1D70F}}=0$ in the planar CJ wave,
 $\unicode[STIX]{x1D705}=0$). If the flow of shocked gas is kept subsonic relative to the lead shock, as is the case in the steady state, the term in brackets on the left-hand side of (3.10) is positive everywhere across the inner structure and represents the absolute value of the propagation velocity of the upstream-running mode (simple wave) propagating in the shocked gas toward the lead shock
 $$\begin{eqnarray}\unicode[STIX]{x1D709}_{b}<\unicode[STIX]{x1D709}\leqslant 0:\quad (\unicode[STIX]{x1D707}-\dot{\unicode[STIX]{x1D6FC}}_{\unicode[STIX]{x1D70F}})=\left[a_{u}-({\mathcal{D}}-u)\right]/\unicode[STIX]{x1D716}a_{u}\geqslant 0,\end{eqnarray}$$
where the second relation in (3.7) has been used. The condition  $(\unicode[STIX]{x1D707}-\dot{\unicode[STIX]{x1D6FC}}_{\unicode[STIX]{x1D70F}})>0$ means that the flow is subsonic (relatively to the lead shock) everywhere in the inner structure.
3.2 Unsteady distribution of the heat-release rate
The compressional heating, which is a key mechanism across the (inert) lead shock for the dynamics of a detonation wave, is negligible in the compressed gas and the instantaneous distribution of heat-release rate  ${\dot{w}}(T,Y)=\unicode[STIX]{x1D714}(\unicode[STIX]{x1D709},\dot{\unicode[STIX]{x1D6FC}}_{\unicode[STIX]{x1D70F}}(\unicode[STIX]{x1D70F}))$ can be expressed in terms of the shock velocity
 $\dot{\unicode[STIX]{x1D6FC}}_{\unicode[STIX]{x1D70F}}(\unicode[STIX]{x1D70F})$. This is because the system of equations (2.2) for the entropy wave forms a closed set for
 $T(\unicode[STIX]{x1D709},\unicode[STIX]{x1D70F})$ and
 $Y(\unicode[STIX]{x1D709},\unicode[STIX]{x1D70F})$ in the Newtonian limit (3.1). Moreover, according to the two-time-scale nature of the dynamics (3.9), the unsteady terms are negligible in (2.2) so that, the solutions
 $T(\unicode[STIX]{x1D709},\unicode[STIX]{x1D70F})$ and
 $Y(\unicode[STIX]{x1D709},\unicode[STIX]{x1D70F})$ are the same as in the steady states,
 $\overline{T}(\unicode[STIX]{x1D709},\overline{T}_{N})$,
 $\overline{Y}(\unicode[STIX]{x1D709},\overline{T}_{N})$, but with
 $\overline{T}_{N}$ replaced by the instantaneous value
 $T_{N}(\unicode[STIX]{x1D70F})$, which is expressed in terms of the unsteady shock velocity
 $\dot{\unicode[STIX]{x1D6FC}}_{\unicode[STIX]{x1D70F}}(\unicode[STIX]{x1D70F})$ by (2.3) and (2.6),
 $$\begin{eqnarray}(M^{2}-1)\ll 1:\quad \frac{T_{N}}{T_{u}}\approx 1+2\frac{\unicode[STIX]{x1D6FE}-1}{\unicode[STIX]{x1D6FE}+1}(M^{2}-1),\quad \frac{\unicode[STIX]{x1D6FF}T_{N}(\unicode[STIX]{x1D70F})}{T_{u}}\approx 4\frac{(\unicode[STIX]{x1D6FE}-1)}{\unicode[STIX]{x1D6FE}+1}\unicode[STIX]{x1D6FF}M.\end{eqnarray}$$
Introducing the activation energy  ${\mathcal{E}}$ controlling the variation of the induction length with the Neumann temperature
 $\unicode[STIX]{x1D6FF}l/l=({\mathcal{E}}/k_{b}T_{N})\unicode[STIX]{x1D6FF}T_{N}/T_{N}$,
 $$\begin{eqnarray}\frac{\unicode[STIX]{x1D6FF}l}{l}=-b\,\dot{\unicode[STIX]{x1D6FC}}_{\unicode[STIX]{x1D70F}}\quad \text{where }b\equiv \frac{4}{\unicode[STIX]{x1D6FE}+1}(\unicode[STIX]{x1D6FE}-1)\unicode[STIX]{x1D716}\frac{{\mathcal{E}}}{k_{B}T_{u}},\end{eqnarray}$$
and assuming for simplicity that the thermal sensitivity of the induction length is dominant, the shape of  $\unicode[STIX]{x1D714}(\unicode[STIX]{x1D709},\dot{\unicode[STIX]{x1D6FC}}_{\unicode[STIX]{x1D70F}}(\unicode[STIX]{x1D70F}))$, the solution of (2.2) in the limit (3.1) corresponds simply to a rescaling of the length scale by the time-dependent induction length,
 $$\begin{eqnarray}\unicode[STIX]{x1D714}(\unicode[STIX]{x1D709},b\dot{\unicode[STIX]{x1D6FC}}_{\unicode[STIX]{x1D70F}})=\text{e}^{b\dot{\unicode[STIX]{x1D6FC}}_{\unicode[STIX]{x1D70F}}}\unicode[STIX]{x1D714}_{o_{CJ}}(\unicode[STIX]{x1D709}\,\text{e}^{b\dot{\unicode[STIX]{x1D6FC}}_{\unicode[STIX]{x1D70F}}}),\quad \int _{-\infty }^{0}\unicode[STIX]{x1D714}(\unicode[STIX]{x1D709},b\dot{\unicode[STIX]{x1D6FC}}_{\unicode[STIX]{x1D70F}})\,\text{d}\unicode[STIX]{x1D709}=1,\end{eqnarray}$$
where  $\unicode[STIX]{x1D714}_{o_{CJ}}(\unicode[STIX]{x1D709})$ is the steady distribution of the planar CJ detonation,
 $\int _{-\infty }^{0}\unicode[STIX]{x1D714}_{o_{CJ}}(\unicode[STIX]{x1D709})\,\text{d}\unicode[STIX]{x1D709}=1$. The scaling law (3.16) was shown to be satisfactory for
 $\text{H}_{2}{-}\text{O}_{2}$ detonations, see Clavin & He (Reference Clavin and He1996). Since the curvature is not involved explicitly in (2.2), the expression for
 $\unicode[STIX]{x1D714}(\unicode[STIX]{x1D709},\dot{\unicode[STIX]{x1D6FC}}_{\unicode[STIX]{x1D70F}}(\unicode[STIX]{x1D70F}))$ is the same as in the planar geometry considered previously. Equations (3.10)–(3.11) and (3.16) are the extension of the detonation model of Clavin & Williams (Reference Clavin and Williams2002) to a spherical geometry (
 $\unicode[STIX]{x1D705}\neq 0$). In order to overcome the technical difficulty for matching the inner structure with the external flow, a bounded reaction zone of the CJ wave is assumed,
 $$\begin{eqnarray}\unicode[STIX]{x1D709}\leqslant -1:\quad \unicode[STIX]{x1D714}_{o_{CJ}}=0\quad \text{and}\quad \unicode[STIX]{x1D709}=-1:\quad \text{d}\unicode[STIX]{x1D714}_{o_{CJ}}/\text{d}\unicode[STIX]{x1D709}|_{\unicode[STIX]{x1D709}+1=0^{+}}=h_{\unicode[STIX]{x1D714}}>0,\quad h_{\unicode[STIX]{x1D714}}=O(1).\end{eqnarray}$$
The length scales of the inner structure and of the external flow (rarefaction wave) being clearly separated, the approximation (3.17) does not produce relevant modifications since the heat release in the tail of the distribution of heat release is negligible. Equation (3.17) will be used in the following, except in § 4.2, where the square-wave model is revisited.
The instantaneous distribution of heat release (3.16) depends on the time through  $\text{e}^{b\dot{\unicode[STIX]{x1D6FC}}_{\unicode[STIX]{x1D70F}}(\unicode[STIX]{x1D70F})}$ and on the space through
 $\unicode[STIX]{x1D709}\text{e}^{b\dot{\unicode[STIX]{x1D6FC}}_{\unicode[STIX]{x1D70F}}(\unicode[STIX]{x1D70F})}$ so that the instantaneous thickness of the inner structure follows the same Arrhenius law as the induction length,
 $\unicode[STIX]{x1D709}_{b}=\text{e}^{-b\dot{\unicode[STIX]{x1D6FC}}_{\unicode[STIX]{x1D70F}}}\unicode[STIX]{x1D709}_{bo_{CJ}}$. The reference time scale
 $t_{r}$ in (2.2)–(2.9) being the reaction time at the Neumann state of the planar CJ solution in steady state,
 $\unicode[STIX]{x1D709}_{bo_{CJ}}=-1$, the instantaneous position (relative to the shock) of the exit of the inner structure zone is
 $\unicode[STIX]{x1D709}=-\text{e}^{-b\dot{\unicode[STIX]{x1D6FC}}_{\unicode[STIX]{x1D70F}}(\unicode[STIX]{x1D70F})}$
 $$\begin{eqnarray}\displaystyle \unicode[STIX]{x1D709}_{bo_{CJ}}=-1\quad \Rightarrow \quad \unicode[STIX]{x1D709}_{b}(\unicode[STIX]{x1D70F})\approx -\text{e}^{-b\dot{\unicode[STIX]{x1D6FC}}_{\unicode[STIX]{x1D70F}}(\unicode[STIX]{x1D70F})}. & & \displaystyle\end{eqnarray}$$
The instantaneous distribution of reaction rate (3.16) has a bell-shaped form similar to that of  $\unicode[STIX]{x1D714}_{o_{CJ}}(\unicode[STIX]{x1D709})$
 $$\begin{eqnarray}\unicode[STIX]{x1D709}=\unicode[STIX]{x1D709}_{b}(\unicode[STIX]{x1D70F})\approx -\text{e}^{-b\dot{\unicode[STIX]{x1D6FC}}_{\unicode[STIX]{x1D70F}}(\unicode[STIX]{x1D70F})}:\quad \unicode[STIX]{x1D714}(\unicode[STIX]{x1D709},\dot{\unicode[STIX]{x1D6FC}}_{\unicode[STIX]{x1D70F}})\approx 0,\quad \text{e}^{-b\dot{\unicode[STIX]{x1D6FC}}_{\unicode[STIX]{x1D70F}}(\unicode[STIX]{x1D70F})}<\unicode[STIX]{x1D709}\leqslant 0:\quad \unicode[STIX]{x1D714}(\unicode[STIX]{x1D709},\dot{\unicode[STIX]{x1D6FC}}_{\unicode[STIX]{x1D70F}})>0,\end{eqnarray}$$
with a maximum of order unity at  $\unicode[STIX]{x1D709}=\unicode[STIX]{x1D709}_{m}$,
 $\unicode[STIX]{x1D709}_{m}\in [-\text{e}^{-b\dot{\unicode[STIX]{x1D6FC}}_{\unicode[STIX]{x1D70F}}(\unicode[STIX]{x1D70F})},\,0]$ such that the reduced distance
 $|\unicode[STIX]{x1D709}_{m}+\text{e}^{-b\dot{\unicode[STIX]{x1D6FC}}_{\unicode[STIX]{x1D70F}}(\unicode[STIX]{x1D70F})}|<1$ is not small (
 $\lim _{1/b\rightarrow 0}|\unicode[STIX]{x1D709}_{m}-\unicode[STIX]{x1D709}_{b}|\neq 0$) as is typically the case in real detonations. This difference from the one-step reaction model in the limit of large activation energy (leading to the square-wave model
 $\lim _{1/b\rightarrow 0}|\unicode[STIX]{x1D709}_{m}-\unicode[STIX]{x1D709}_{b}|=0$) is essential for a well-posed problem of detonation dynamics.
4 Peninsula of quasi-steady CJ waves in spherical geometry
A preliminary step before studying the dynamics in the phase space of velocity–radius  ${\mathcal{D}}-r_{f}$ consists in determining the nonlinear relation between the propagation velocity
 ${\mathcal{D}}_{_{CJ}}$ of spherical CJ detonation and the radius of the lead shock
 $r_{f}$,
 ${\mathcal{D}}_{_{CJ}}(\unicode[STIX]{x1D705})$ assuming a steady-state approximation. This was performed by He & Clavin (Reference He and Clavin1994) for large heat release and for a highly thermal-sensitive square-wave model and also by Yao & Stewart (Reference Yao and Stewart1995) for a one-step reaction rate in the limit of large activation energy. The analysis of the curvature-induced quenching is presented below in the limit of small heat release.
4.1 Steady-state approximation of curved CJ detonations
Usually, the steady-state approximation is accurate if the characteristic time of evolution of the propagation velocity is larger than the response time of the inner detonation structure, which is possible for stable detonations. Even though the condition is satisfied, the steady-state approximation is problematic for spherical CJ waves because the unsteady correction is of the same order of magnitude as the curvature effect, as shown below, see (4.19) and the discussion in § 7.3. Nevertheless, the steady-state approximation is worth considering in a first step since it sheds light on the initiation process. The steady-state approximation of the inner structure in the limit (3.1) corresponds to the solution of (3.10) when the unsteady term  $\unicode[STIX]{x2202}\unicode[STIX]{x1D707}/\unicode[STIX]{x2202}t$ is neglected. Denoting the reduced flow and the propagation velocity of the curved CJ detonation in steady state by
 $\overline{\unicode[STIX]{x1D707}}_{_{CJ}}(\unicode[STIX]{x1D709})$ and
 $\overline{\dot{\unicode[STIX]{x1D6FC}}}_{\unicode[STIX]{x1D70F}_{CJ}}$ respectively, equation (3.10) yields
 $$\begin{eqnarray}\displaystyle & \displaystyle \left[\overline{\unicode[STIX]{x1D707}}_{_{CJ}}(\unicode[STIX]{x1D709})-\overline{\dot{\unicode[STIX]{x1D6FC}}}_{\unicode[STIX]{x1D70F}_{CJ}}\right]\frac{\text{d}\overline{\unicode[STIX]{x1D707}}_{_{CJ}}}{\text{d}\unicode[STIX]{x1D709}}=\frac{1}{2}\text{e}^{b\overline{\dot{\unicode[STIX]{x1D6FC}}}_{\unicode[STIX]{x1D70F}_{CJ}}}\unicode[STIX]{x1D714}_{o_{CJ}}(\unicode[STIX]{x1D709}\text{e}^{b\overline{\dot{\unicode[STIX]{x1D6FC}}}_{\unicode[STIX]{x1D70F}_{CJ}}})-[1+\overline{\unicode[STIX]{x1D707}}_{_{CJ}}(\unicode[STIX]{x1D709})]\unicode[STIX]{x1D705}, & \displaystyle\end{eqnarray}$$
 $$\begin{eqnarray}\displaystyle & \displaystyle \unicode[STIX]{x1D709}=0:\quad \overline{\unicode[STIX]{x1D707}}_{_{CJ}}=1+2\overline{\dot{\unicode[STIX]{x1D6FC}}}_{\unicode[STIX]{x1D70F}_{CJ}}. & \displaystyle\end{eqnarray}$$
As recalled in § 2.2, the reaction rate of CJ waves is not exactly zero at the sonic point,
 $$\begin{eqnarray}\displaystyle \unicode[STIX]{x1D709}=\overline{\unicode[STIX]{x1D709}}_{s_{CJ}}:\quad \overline{\unicode[STIX]{x1D707}}_{_{CJ}}=\overline{\dot{\unicode[STIX]{x1D6FC}}}_{\unicode[STIX]{x1D70F}_{CJ}}\,\,\Rightarrow \,\,\text{e}^{b\overline{\dot{\unicode[STIX]{x1D6FC}}}_{\unicode[STIX]{x1D70F}_{CJ}}}\unicode[STIX]{x1D714}_{o_{CJ}}(\unicode[STIX]{x1D709}\text{e}^{b\overline{\dot{\unicode[STIX]{x1D6FC}}}_{\unicode[STIX]{x1D70F}_{CJ}}})=2[1+\overline{\unicode[STIX]{x1D707}}_{_{CJ}}(\overline{\unicode[STIX]{x1D709}}_{s_{CJ}})]\unicode[STIX]{x1D705}\neq 0. & & \displaystyle\end{eqnarray}$$
According to (3.17), the end of the reaction zone corresponds to  $\unicode[STIX]{x1D709}=-\text{e}^{-b\,\overline{\dot{\unicode[STIX]{x1D6FC}}}_{\unicode[STIX]{x1D70F}_{CJ}}}$ so that
 $\overline{\unicode[STIX]{x1D709}}_{s_{CJ}}>-\text{e}^{-b\,\overline{\dot{\unicode[STIX]{x1D6FC}}}_{\unicode[STIX]{x1D70F}_{CJ}}}$. When the reduced curvature
 $\unicode[STIX]{x1D705}$ is small, the reaction rate at the sonic point is also small, of order
 $\unicode[STIX]{x1D705}$ according to (4.3). The difference between
 $\overline{\unicode[STIX]{x1D709}}_{s_{CJ}}$ and
 $-\text{e}^{-b\,\overline{\dot{\unicode[STIX]{x1D6FC}}}_{\unicode[STIX]{x1D70F}_{CJ}}}$ introduces a negligible correction in the limit
 $\unicode[STIX]{x1D705}\ll 1$, and the sonic condition can be considered to hold at the end of the reaction
 $$\begin{eqnarray}\unicode[STIX]{x1D709}\approx -\text{e}^{-b\,\overline{\dot{\unicode[STIX]{x1D6FC}}}_{\unicode[STIX]{x1D70F}_{CJ}}}:\quad \overline{\unicode[STIX]{x1D707}}_{_{CJ}}=\overline{\dot{\unicode[STIX]{x1D6FC}}}_{\unicode[STIX]{x1D70F}_{CJ}}(\unicode[STIX]{x1D705})\equiv \frac{[{\mathcal{D}}_{_{CJ}}(\unicode[STIX]{x1D705})-{\mathcal{D}}_{o_{CJ}}]}{\unicode[STIX]{x1D716}a_{u}},\end{eqnarray}$$
see § 5.1 for a detailed proof. Integration of (4.1) from  $\unicode[STIX]{x1D709}=-\text{e}^{-b\,\overline{\dot{\unicode[STIX]{x1D6FC}}}_{\unicode[STIX]{x1D70F}_{CJ}}}$ to
 $\unicode[STIX]{x1D709}=0$, using the normalization condition (3.16), then yields
 $$\begin{eqnarray}\displaystyle (1+\overline{\dot{\unicode[STIX]{x1D6FC}}}_{\unicode[STIX]{x1D70F}_{CJ}})^{2}=1-2\unicode[STIX]{x1D705}\int _{-\text{e}^{-b\,\overline{\dot{\unicode[STIX]{x1D6FC}}}_{\unicode[STIX]{x1D70F}_{CJ}}}}^{0}(1+\overline{\unicode[STIX]{x1D707}}_{_{CJ}})\,\text{d}\unicode[STIX]{x1D709}, & & \displaystyle\end{eqnarray}$$
showing that the reduced CJ velocity  $\overline{\dot{\unicode[STIX]{x1D6FC}}}_{\unicode[STIX]{x1D70F}_{CJ}}$ is as small as
 $\unicode[STIX]{x1D705}$,
 $\overline{\dot{\unicode[STIX]{x1D6FC}}}_{\unicode[STIX]{x1D70F}_{CJ}}\propto \unicode[STIX]{x1D705}$. When the thermal sensitivity is large,
 $b\gg 1$, the inner structure of the detonation is a strongly nonlinear function of the detonation velocity. As a result, the nonlinear expression for the propagation velocity in term of the curvature
 $\overline{\dot{\unicode[STIX]{x1D6FC}}}_{\unicode[STIX]{x1D70F}_{CJ}}(\unicode[STIX]{x1D705})$ involves a turning point in the phase space of ‘velocity–radius’, as shown now.
4.2 Curvature-induced quenching predicted by the square-wave model
The square-wave model (which is well known to generate a singular dynamics) is useful for enlightening the quasi-steady mechanisms that are associated with a high thermal sensitivity. This model helps us to understand the physical origin of the C-shaped form of the curve  $\overline{\dot{\unicode[STIX]{x1D6FC}}}_{\unicode[STIX]{x1D70F}_{CJ}}(\unicode[STIX]{x1D705})$. The square-wave approximation of the inner structure consists in a uniform profile
 $\overline{\unicode[STIX]{x1D707}}(\unicode[STIX]{x1D709},\unicode[STIX]{x1D70F})$, equal to its value at the Neumann state in (4.1),
 $\overline{\unicode[STIX]{x1D707}}_{_{CJ}}(0,\unicode[STIX]{x1D70F})=1+2\overline{\dot{\unicode[STIX]{x1D6FC}}}_{\unicode[STIX]{x1D70F}_{CJ}}$. Equation (4.5) then takes the form of the nonlinear equation (4.7) for
 $\overline{\dot{\unicode[STIX]{x1D6FC}}}_{\unicode[STIX]{x1D70F}_{CJ}}$
 $$\begin{eqnarray}\displaystyle & \displaystyle \int _{-\text{e}^{-b\,\overline{\dot{\unicode[STIX]{x1D6FC}}}_{\unicode[STIX]{x1D70F}_{CJ}}}}^{0}\left[1+\overline{\unicode[STIX]{x1D707}}_{_{CJ}}(\unicode[STIX]{x1D709})\right]\text{d}\unicode[STIX]{x1D709}=\left[1+\overline{\unicode[STIX]{x1D707}}_{_{CJ}}(0)\right]\text{e}^{-b\,\overline{\dot{\unicode[STIX]{x1D6FC}}}_{\unicode[STIX]{x1D70F}_{CJ}}}=2(1+\overline{\dot{\unicode[STIX]{x1D6FC}}}_{\unicode[STIX]{x1D70F}_{CJ}})\text{e}^{-b\,\overline{\dot{\unicode[STIX]{x1D6FC}}}_{\unicode[STIX]{x1D70F}_{CJ}}}, & \displaystyle\end{eqnarray}$$
 $$\begin{eqnarray}\displaystyle & \displaystyle (1+\overline{\dot{\unicode[STIX]{x1D6FC}}}_{\unicode[STIX]{x1D70F}_{CJ}})^{2}=1-4\unicode[STIX]{x1D705}\,(1+\overline{\dot{\unicode[STIX]{x1D6FC}}}_{\unicode[STIX]{x1D70F}_{CJ}})\text{e}^{-b\,\overline{\dot{\unicode[STIX]{x1D6FC}}}_{\unicode[STIX]{x1D70F}_{CJ}}}. & \displaystyle\end{eqnarray}$$
For expanding spherical detonations ( $\unicode[STIX]{x1D705}>0$) the branch of physical solutions
 $\overline{\dot{\unicode[STIX]{x1D6FC}}}_{\unicode[STIX]{x1D70F}_{CJ}}(\unicode[STIX]{x1D705})$ of (4.7) corresponds to values of
 $\overline{\dot{\unicode[STIX]{x1D6FC}}}_{\unicode[STIX]{x1D70F}_{CJ}}$ in the range
 $\overline{\dot{\unicode[STIX]{x1D6FC}}}_{\unicode[STIX]{x1D70F}_{CJ}}\in [-1,0]$ for
 $\unicode[STIX]{x1D705}\in [0,+\infty ]$,
 $\lim _{\unicode[STIX]{x1D705}\rightarrow \infty }\overline{\dot{\unicode[STIX]{x1D6FC}}}_{\unicode[STIX]{x1D70F}_{CJ}}=-1$,
 $\lim _{\unicode[STIX]{x1D705}\rightarrow 0}\overline{\dot{\unicode[STIX]{x1D6FC}}}_{\unicode[STIX]{x1D70F}_{CJ}}=0$. The detonation velocity of curved CJ detonations is smaller than the velocity of the planar CJ detonation,
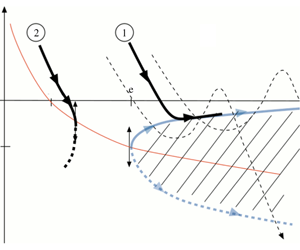
Phase space ‘detonation velocity versus radius’ ( $y$–
 $x$) in the non-dimensional form
 $y\equiv b\,\dot{\unicode[STIX]{x1D6FC}}_{\unicode[STIX]{x1D70F}}=(b/\unicode[STIX]{x1D716})({\mathcal{D}}-{\mathcal{D}}_{o_{CJ}})/a_{u}$,
 $x\equiv 1/(2b\unicode[STIX]{x1D705})$. The equation of the CJ peninsula
 $\overline{y}_{_{CJ}}(x)$ is (4.12) and the quasi-steady trajectories
 $\overline{y}(x)$ are given in (7.1). The trajectories
 $\overline{y}_{1}(x)$ and
 $\overline{y}_{2}(x)$ represent respectively success of detonation initiation and failure.

 $$\begin{eqnarray}\unicode[STIX]{x1D705}>0:\quad \overline{\dot{\unicode[STIX]{x1D6FC}}}_{\unicode[STIX]{x1D70F}_{CJ}}<0\,\,\Rightarrow \,\,\overline{{\mathcal{D}}}_{_{CJ}}(\unicode[STIX]{x1D705})<{\mathcal{D}}_{o_{CJ}},\quad \unicode[STIX]{x1D705}=0:\quad \overline{\dot{\unicode[STIX]{x1D6FC}}}_{\unicode[STIX]{x1D70F}_{CJ}}=0\,\,\Rightarrow \,\,\overline{{\mathcal{D}}}_{_{CJ}}={\mathcal{D}}_{o_{CJ}}.\end{eqnarray}$$
For a thermal sensitivity that is sufficiently small, the function  $\unicode[STIX]{x1D705}(\overline{\dot{\unicode[STIX]{x1D6FC}}}_{\unicode[STIX]{x1D70F}_{CJ}})=-(\overline{\dot{\unicode[STIX]{x1D6FC}}}_{\unicode[STIX]{x1D70F}_{CJ}}/4)(2+\overline{\dot{\unicode[STIX]{x1D6FC}}}_{\unicode[STIX]{x1D70F}_{CJ}})\text{e}^{b\overline{\dot{\unicode[STIX]{x1D6FC}}}_{\unicode[STIX]{x1D70F}_{CJ}}}/(1+\overline{\dot{\unicode[STIX]{x1D6FC}}}_{\unicode[STIX]{x1D70F}_{CJ}})$ in (4.7) is decreasing monotonically from infinity to zero when
 $\overline{\dot{\unicode[STIX]{x1D6FC}}}_{\unicode[STIX]{x1D70F}_{CJ}}$ increases from
 $-1$ to
 $0$,
 $\text{d}\unicode[STIX]{x1D705}/\text{d}\overline{\dot{\unicode[STIX]{x1D6FC}}}_{\unicode[STIX]{x1D70F}_{CJ}}<0$ so that the detonation velocity decreases monotonically when the curvature increases from
 $0$ to
 $+\infty$ (radius decreases from
 $\infty$ to
 $0$). The situation is different for a thermal sensitivity that is sufficiently large; the function
 $\unicode[STIX]{x1D705}(\overline{\dot{\unicode[STIX]{x1D6FC}}}_{\unicode[STIX]{x1D70F}_{CJ}})$ presents two local extrema in the range
 $\overline{\dot{\unicode[STIX]{x1D6FC}}}_{\unicode[STIX]{x1D70F}_{CJ}}\in [-1,0]$ so that the curve
 $\overline{\dot{\unicode[STIX]{x1D6FC}}}_{\unicode[STIX]{x1D70F}_{CJ}}(\unicode[STIX]{x1D705})$ has an S-shaped form. This is already the case for
 $b=3.2$. For a large thermal sensitivity
 $b\gg 1$ the situation is the same as in He & Clavin (Reference He and Clavin1994), see figure 1 below. The graph ‘propagation velocity of the spherical CJ detonation versus the curvature’
 $\overline{{\mathcal{D}}}_{_{CJ}}(\unicode[STIX]{x1D705})$ presents a turning point at a critical radius
 $r=r^{\ast }$ corresponding to a small curvature
 $\unicode[STIX]{x1D705}^{\ast }=O(1/b)$. The difference
 $({\mathcal{D}}_{o_{CJ}}-\overline{{\mathcal{D}}}_{_{CJ}})/(\unicode[STIX]{x1D716}{\mathcal{D}}_{o_{CJ}})>0$ is small, of order
 $1/b$, in the upper branch of solutions (the one going to
 ${\mathcal{D}}_{o_{CJ}}$ at large radius, see figure 1) while it is of order unity in the third branch of solutions (not represented in figure 1) which is non-physical because it corresponds to a too small Neumann temperature. In other words, there is no physical solution for
 $r<r^{\ast }$. Focusing our attention on radii of the same order of magnitude as the critical radius,
 $$\begin{eqnarray}1/b\ll 1:\quad \unicode[STIX]{x1D705}=O(1/b),\quad |\overline{\dot{\unicode[STIX]{x1D6FC}}}_{\unicode[STIX]{x1D70F}_{CJ}}|=O(1/b)\quad \Rightarrow \quad \text{e}^{-b\,\overline{\dot{\unicode[STIX]{x1D6FC}}}_{\unicode[STIX]{x1D70F}_{CJ}}}=O(1),\end{eqnarray}$$
the terms smaller than  $1/b$ can be neglected in (4.7),
 $$\begin{eqnarray}1/b\ll 1:\quad -\overline{\dot{\unicode[STIX]{x1D6FC}}}_{\unicode[STIX]{x1D70F}_{CJ}}=2\unicode[STIX]{x1D705}\text{e}^{-b\,\overline{\dot{\unicode[STIX]{x1D6FC}}}_{\unicode[STIX]{x1D70F}_{CJ}}}>0.\end{eqnarray}$$
In the limit  $b\gg 1$ the quantities of order unity for the propagation velocity and the radius in the upper branch of detonations are respectively,
 $$\begin{eqnarray}\overline{y}_{_{CJ}}\equiv b\,\overline{\dot{\unicode[STIX]{x1D6FC}}}_{\unicode[STIX]{x1D70F}_{CJ}}=\frac{b}{\unicode[STIX]{x1D716}}\left(\frac{\overline{{\mathcal{D}}}_{_{CJ}}-{\mathcal{D}}_{o_{CJ}}}{a_{u}}\right),\quad \frac{1}{x}\equiv 2\,b\,\unicode[STIX]{x1D705}=2\frac{b}{\unicode[STIX]{x1D716}}\left(\frac{l_{o_{CJ}}}{r_{f}}\right)>0,\end{eqnarray}$$
where  $l_{o_{CJ}}=a_{u}t_{r}$ denotes the thickness of the planar CJ detonation,
 $t_{r}$ being the reaction time at the Neumann state (reference time) and, according to (3.15),
 $b/\unicode[STIX]{x1D716}=2(\unicode[STIX]{x1D6FE}-1){\mathcal{E}}/k_{B}T_{u}$. The propagation velocity of a quasi-steady spherical CJ wave
 $\overline{y}_{_{CJ}}(x)$ in term of its radius
 $x$ is, according to (4.10), the solution to
 $$\begin{eqnarray}\displaystyle & \displaystyle 1/b\ll 1:\quad -\overline{y}_{_{CJ}}\text{e}^{\overline{y}_{_{CJ}}}=1/x\quad \Leftrightarrow \quad \overline{y}_{_{CJ}}+\frac{1}{x}\text{e}^{-\overline{y}_{_{CJ}}}=0,\quad & \displaystyle\end{eqnarray}$$
 $$\begin{eqnarray}\displaystyle & \displaystyle \frac{\text{d}\overline{y}_{_{CJ}}}{\text{d}x}=\frac{\text{e}^{-\overline{y}_{_{CJ}}}}{x^{2}}\frac{1}{1+\overline{y}_{_{CJ}}}. & \displaystyle\end{eqnarray}$$
Because the terms of order  $\unicode[STIX]{x1D716}$ have been neglected in (4.1), equations (4.10) and (4.12) are valid in the limit of small heat release (
 $\unicode[STIX]{x1D716}\ll 1$) for intermediate values of
 $1/b$,
 $$\begin{eqnarray}\unicode[STIX]{x1D716}\ll 1/b\ll 1.\end{eqnarray}$$
The solution (4.12),  $\overline{y}_{_{CJ}}(x)$, is plotted in blue in figure 1, where the arrows indicate the direction of propagation (
 $\overline{y}_{_{CJ}}>-1:\text{d}\overline{y}_{_{CJ}}/\text{d}x>0$;
 $\overline{y}_{_{CJ}}<-1:\text{d}\overline{y}_{_{CJ}}/\text{d}x<0$). The critical value
 $r_{f}^{\ast }$ is larger than the detonation thickness of the planar CJ wave,
 $r_{f}^{\ast }\gg l_{o_{CJ}}$,
 $$\begin{eqnarray}\overline{y}_{_{CJ}}^{\ast }=-1,\quad x^{\ast }=\text{e},\quad r_{f}^{\ast }/l_{o_{CJ}}=2\,\text{e}\,b/\unicode[STIX]{x1D716}\gg 1,\quad ({\mathcal{D}}_{o_{CJ}}-{\mathcal{D}}^{\ast })/a_{u}=\unicode[STIX]{x1D716}/b\ll 1,\end{eqnarray}$$
corresponding effectively to the orders of magnitude anticipated in (4.9),
 $$\begin{eqnarray}b\gg 1:\quad \unicode[STIX]{x1D705}^{\ast }=(2\,\text{e})^{-1}/b,\quad \overline{\dot{\unicode[STIX]{x1D6FC}}}_{\unicode[STIX]{x1D70F}_{CJ}}^{\ast }=-1/b.\end{eqnarray}$$
Close to the critical radius, the CJ velocity  $\overline{y}_{_{CJ}}$ varies as the square root of the radius
 $x$
 $$\begin{eqnarray}0<(x-\text{e})/\text{e}\ll 1:\quad \overline{y}_{_{CJ}}\approx -1+\sqrt{2}\sqrt{(x-\text{e})/\text{e}}.\end{eqnarray}$$
According to (4.12), the two branches of solutions  $0>\overline{y}_{_{CJ+}}(x)>\overline{y}_{_{CJ-}}(x)$ for
 $x>x^{\ast }$ (
 $r_{f}>r_{f}^{\ast }$) merge at the critical radius
 $r_{f}=r_{f}^{\ast }$;
 $x=x^{\ast }$:
 $\overline{y}_{_{CJ+}}=\overline{y}_{_{CJ-}}=y^{\ast }=-1$. Both branches correspond to detonation velocities smaller than the velocity of the planar CJ wave,
 $\overline{y}_{_{CJ}\pm }<0$,
 ${\mathcal{D}}<{\mathcal{D}}_{o_{CJ}}$. According to (4.13), the upper (lower) branch of solutions
 $\overline{y}_{_{CJ+}}(x)>-1$, (
 $\overline{y}_{_{CJ-}}(x)<-1$,) is an increasing (decreasing) function of
 $x$,
 $\lim _{x\rightarrow \infty }\overline{y}_{_{CJ+}}=0$ (
 $\lim _{x\rightarrow \infty }\overline{y}_{_{CJ-}}=-\infty$), see figure 1. The solution
 $\overline{{\mathcal{D}}}_{_{CJ}}(r_{f})$ corresponding to
 $\overline{y}_{_{CJ+}}$ is an increasing function of the radius from
 ${\mathcal{D}}^{\ast }$ at
 $r_{f}=r_{f}^{\ast }$ up to the velocity of the planar CJ detonation for infinitely large radius,
 $\lim _{r_{f}/l_{o_{CJ}}\rightarrow \infty }\overline{{\mathcal{D}}}_{_{CJ}}={\mathcal{D}}_{o_{CJ}}$. This branch of solutions is shown in § 7 to play the role of an attractor for the quasi-steady trajectories when the initiation process is successful. The physical mechanism of the curvature-induced quenching is clearly identified from (4.7) to be the thermal sensitivity, responsible for the nonlinear variation of the detonation thickness with the propagation velocity through the Neumann temperature and the Rankine–Hugoniot conditions.
In the opposite limit of a large propagation Mach number  $M\gg 1$ used in He & Clavin (Reference He and Clavin1994), the expression of the Rankine–Hugoniot condition
 $$\begin{eqnarray}\displaystyle (\unicode[STIX]{x1D6FE}-1)M^{2}\gg 1:\quad \frac{\unicode[STIX]{x1D6FF}T_{N}}{T_{N}}\approx 2\frac{\unicode[STIX]{x1D6FF}M}{M} & & \displaystyle\end{eqnarray}$$
differs quantitatively from (3.14). However, the same phenomenology is described in the limit of small heat release (3.1) which will helpful in the following to provide us with a qualitative description of the unsteady effects in the initiation process. The dynamics of a stable detonation on the upper branch of the CJ peninsula is effectively slow, except very close to the turning point. Unfortunately, according to (4.11), (4.13) and  $\text{d}r_{f}/\text{d}t=\overline{{\mathcal{D}}}_{_{CJ}}$, the unsteady term is of the same order of magnitude as the curvature term,
 $1/b$,
 $$\begin{eqnarray}\frac{\text{d}\overline{y}_{_{CJ}}}{\text{d}\unicode[STIX]{x1D70F}}=\frac{1}{2\,b}\frac{\text{e}^{-\overline{y}_{_{CJ}}}}{x^{2}}\frac{1}{1+\overline{y}_{_{CJ}}}.\end{eqnarray}$$
4.3 Critical conditions for a smooth distribution of the reaction rate in the limit (4.14)
To leading order in the limit  $b\gg 1$, the results (4.12)–(4.13) obtained with the square-wave model are still valid for a smooth distribution of the reaction rate provided the factor 2 in the expression (4.11) of
 $1/x$ is replaced by
 $\unicode[STIX]{x1D706}\in [1,\,2]$ where
 $$\begin{eqnarray}b\gg 1:\quad 1/x=\unicode[STIX]{x1D706}\,b\,\unicode[STIX]{x1D705},\,\,\unicode[STIX]{x1D706}\equiv 1+\int _{-1}^{0}\unicode[STIX]{x1D707}_{o_{CJ}}(\unicode[STIX]{x1D709})\,\text{d}\unicode[STIX]{x1D709},\,\,x^{\ast }=\text{e}\,\,\Rightarrow \,\,r_{f}^{\ast }/l_{o_{CJ}}=\unicode[STIX]{x1D706}\,\text{e}\,b/\unicode[STIX]{x1D716},\end{eqnarray}$$
 $\unicode[STIX]{x1D707}_{o_{CJ}}(\unicode[STIX]{x1D709})$ being the planar CJ solution obtained from (4.1) for
 $\unicode[STIX]{x1D705}=0$ and
 $\overline{\dot{\unicode[STIX]{x1D6FC}}}_{\unicode[STIX]{x1D70F}}=0$
 $$\begin{eqnarray}\unicode[STIX]{x1D707}_{o_{CJ}}(\unicode[STIX]{x1D709})=\sqrt{\int _{-1}^{\unicode[STIX]{x1D709}}\unicode[STIX]{x1D714}_{o_{CJ}}(\unicode[STIX]{x1D709}^{\prime })\,\text{d}\unicode[STIX]{x1D709}^{\prime }},\quad \int _{-1}^{0}\unicode[STIX]{x1D714}_{o_{CJ}}(\unicode[STIX]{x1D709}^{\prime })\,\text{d}\unicode[STIX]{x1D709}^{\prime }=1,\,0<\unicode[STIX]{x1D707}_{o_{CJ}}(\unicode[STIX]{x1D709})<1,\,1<\unicode[STIX]{x1D706}<2.\end{eqnarray}$$
The proof is as follows. Consider a spherical CJ wave in the limit  $1/b\ll 1$,
 $\overline{y}_{_{CJ}}\equiv b\overline{\dot{\unicode[STIX]{x1D6FC}}}_{\unicode[STIX]{x1D70F}_{CJ}}=O(1)$,
 $\unicode[STIX]{x1D705}=O(1/b)$,
 $\overline{\unicode[STIX]{x1D707}}_{b_{CJ}}=\overline{\dot{\unicode[STIX]{x1D6FC}}}_{\unicode[STIX]{x1D70F}_{CJ}}=O(1/b)$. Neglecting terms smaller than
 $1/b$ in (4.1), the function
 $\overline{\unicode[STIX]{x1D707}}_{_{CJ}}(\unicode[STIX]{x1D709})$ in the brackets on the right-hand side can be replaced by the steady solution for
 $\unicode[STIX]{x1D705}=0$ but with
 $b\overline{\dot{\unicode[STIX]{x1D6FC}}}_{\unicode[STIX]{x1D70F}_{CJ}}\neq 0$. This is the zeroth-order solution
 $\overline{\unicode[STIX]{x1D707}}_{o_{CJ}}$ of the curved CJ wave
 $\overline{\unicode[STIX]{x1D707}}_{_{CJ}}(\unicode[STIX]{x1D709})$ which can be expressed in terms of the velocity distribution of the planar CJ solution
 $\unicode[STIX]{x1D707}_{o_{CJ}}(\unicode[STIX]{x1D709})$ in the form
 $\overline{\unicode[STIX]{x1D707}}_{o_{CJ}}(\unicode[STIX]{x1D709})=\unicode[STIX]{x1D707}_{o_{CJ}}(\unicode[STIX]{x1D709}\text{e}^{\overline{y}_{_{CJ}}})$, as shown by (4.1), (4.2) and (4.4) in which the terms of order
 $1/b$ are neglected
 $$\begin{eqnarray}\overline{\unicode[STIX]{x1D707}}_{o_{CJ}}\frac{\text{d}\overline{\unicode[STIX]{x1D707}}_{o_{CJ}}}{\text{d}\unicode[STIX]{x1D709}}=\frac{1}{2}\text{e}^{\overline{y}_{_{CJ}}}\unicode[STIX]{x1D714}_{o_{CJ}}(\unicode[STIX]{x1D709}\,\text{e}^{\overline{y}_{_{CJ}}}),\quad \unicode[STIX]{x1D709}=0:\quad \overline{\unicode[STIX]{x1D707}}_{o_{CJ}}=1,\quad \unicode[STIX]{x1D709}=-\text{e}^{-\overline{y}_{_{CJ}}}:\quad \overline{\unicode[STIX]{x1D707}}_{o_{CJ}}=0,\end{eqnarray}$$
 $$\begin{eqnarray}\overline{\unicode[STIX]{x1D707}}_{o_{CJ}}^{2}(\unicode[STIX]{x1D709})=\int _{-\text{e}^{-\overline{y}_{_{CJ}}}}^{\unicode[STIX]{x1D709}}\text{e}^{\overline{y}_{_{CJ}}}\unicode[STIX]{x1D714}_{o_{CJ}}(\unicode[STIX]{x1D709}^{\prime }\,\text{e}^{\overline{y}_{_{CJ}}})\,\text{d}\unicode[STIX]{x1D709}^{\prime },\quad \overline{\unicode[STIX]{x1D707}}_{o_{CJ}}(\unicode[STIX]{x1D709})=\unicode[STIX]{x1D707}_{o_{CJ}}(\unicode[STIX]{x1D709}\text{e}^{\overline{y}_{_{CJ}}}),\end{eqnarray}$$
where  $\unicode[STIX]{x1D707}_{o_{CJ}}(\unicode[STIX]{x1D709})$ is the planar solution (4.21). Equation (4.23) means that the leading order of the distribution
 $\overline{\unicode[STIX]{x1D707}}_{_{CJ}}(\unicode[STIX]{x1D709})$ in the limit
 $b\gg 1$ is obtained from the planar CJ solution by rescaling the length with the thickness of the spherical CJ detonation. At the leading order in the limit
 $b\gg 1$, integration of
 $\overline{\unicode[STIX]{x1D707}}_{_{CJ}}(\unicode[STIX]{x1D709})$ yields
 $$\begin{eqnarray}\displaystyle \int _{-\text{e}^{-\overline{y}_{_{CJ}}}}^{0}\overline{\unicode[STIX]{x1D707}}_{_{CJ}}\,\text{d}\unicode[STIX]{x1D709}\approx \text{e}^{-\overline{y}_{_{CJ}}}\int _{-1}^{0}\unicode[STIX]{x1D707}_{o_{CJ}}(z)\,\text{d}z=\text{e}^{-\overline{y}_{_{CJ}}}(\unicode[STIX]{x1D706}-1). & & \displaystyle\end{eqnarray}$$
Introducing (4.24) into (4.5) leads to (4.12) with the definition (4.20) of  $x$,
 $x=1/(b\unicode[STIX]{x1D706}\unicode[STIX]{x1D705})$. The function
 $\unicode[STIX]{x1D707}_{o_{CJ}}(\unicode[STIX]{x1D709})>0$ varying monotonically from 0 at the exit of the reaction zone of the planar CJ detonation (
 $\unicode[STIX]{x1D709}_{ob_{CJ}}=-1$) to 1 at the Neumann state (
 $\unicode[STIX]{x1D709}=0$),
 $0<\int _{-1}^{0}\unicode[STIX]{x1D707}_{o_{CJ}}(\unicode[STIX]{x1D709}^{\prime })\,\text{d}\unicode[STIX]{x1D709}^{\prime }<1$, the parameter
 $\unicode[STIX]{x1D706}$ is in between 1 and 2,
 $1<\unicode[STIX]{x1D706}<2$. By comparison with (4.15), the critical radius for a smooth distribution in (4.20) is smaller than for the square-wave model by a factor
 $\unicode[STIX]{x1D706}/2<1$.
5 Quasi-steady inner structure of spherical detonations
Assuming that the inner structure of spherical detonations is in quasi-steady state during the decay is instructive, even though it will be shown that this approximation is not accurate. Consider first the CJ regime.
5.1 Curved CJ detonation in steady state. Sonic point
Using the notation (4.20), equation (4.1) takes the form
 $$\begin{eqnarray}\displaystyle 2\left[\overline{\unicode[STIX]{x1D707}}_{_{CJ}}(\unicode[STIX]{x1D709},\overline{y}_{_{CJ}})-\overline{y}_{_{CJ}}/b\right]\frac{\text{d}\overline{\unicode[STIX]{x1D707}}_{_{CJ}}}{\text{d}\unicode[STIX]{x1D709}}=\text{e}^{\overline{y}_{_{CJ}}}\unicode[STIX]{x1D714}_{o_{CJ}}(\unicode[STIX]{x1D709}\text{e}^{\overline{y}_{_{CJ}}})-\frac{1}{b}\left[1+\unicode[STIX]{x1D707}_{o_{CJ}}(\unicode[STIX]{x1D709}\text{e}^{\overline{y}_{_{CJ}}})\right]\frac{2}{\unicode[STIX]{x1D706}x}, & & \displaystyle\end{eqnarray}$$
where the  $\overline{y}_{_{CJ}}$- dependence of the velocity distribution has been written explicitly in
 $\overline{\unicode[STIX]{x1D707}}_{_{CJ}}(\unicode[STIX]{x1D709},\overline{y}_{_{CJ}})$. Integration of (5.1) from the Neumann state (4.2) yields
 $$\begin{eqnarray}\displaystyle \left[\overline{\unicode[STIX]{x1D707}}_{_{CJ}}(\unicode[STIX]{x1D709},\overline{y}_{_{CJ}})-\frac{\overline{y}_{_{CJ}}}{b}\right]^{2} & = & \displaystyle \left(1+\frac{\overline{y}_{_{CJ}}}{b}\right)^{2}-\int _{\unicode[STIX]{x1D709}\text{e}^{\overline{y}_{_{CJ}}}}^{0}\unicode[STIX]{x1D714}_{o_{CJ}}(\unicode[STIX]{x1D709}^{\prime })\,\text{d}\unicode[STIX]{x1D709}^{\prime }\nonumber\\ \displaystyle & & \displaystyle +\,\left[-\unicode[STIX]{x1D709}\text{e}^{\overline{y}_{_{CJ}}}+\int _{\unicode[STIX]{x1D709}\text{e}^{\overline{y}_{_{CJ}}}}^{0}\unicode[STIX]{x1D707}_{o_{CJ}}(\unicode[STIX]{x1D709}^{\prime })\,\text{d}\unicode[STIX]{x1D709}^{\prime }\right]\frac{2}{b}\frac{\text{e}^{-\overline{y}_{_{CJ}}}}{\unicode[STIX]{x1D706}\,x},\end{eqnarray}$$
which takes the following form when using (3.16), (4.20) and (4.21),  $\int _{-1}^{0}\unicode[STIX]{x1D714}_{o_{CJ}}(\unicode[STIX]{x1D709}^{\prime })\,\text{d}\unicode[STIX]{x1D709}^{\prime }$
 $=1$,
 $\unicode[STIX]{x1D706}\equiv 1+\int _{-1}^{0}\unicode[STIX]{x1D707}_{o_{CJ}}(\unicode[STIX]{x1D709}^{\prime })\,\text{d}\unicode[STIX]{x1D709}^{\prime }$ and
 $\unicode[STIX]{x1D707}_{o_{CJ}}(\unicode[STIX]{x1D709})=\int _{-1}^{\unicode[STIX]{x1D709}}\unicode[STIX]{x1D714}_{o_{CJ}}(\unicode[STIX]{x1D709}^{\prime })\,\text{d}\unicode[STIX]{x1D709}^{\prime }$,
 $$\begin{eqnarray}\displaystyle & & \displaystyle \left[\overline{\unicode[STIX]{x1D707}}_{_{CJ}}(\unicode[STIX]{x1D709},\overline{y}_{_{CJ}})-\frac{\overline{y}_{_{CJ}}}{b}\right]^{2}-\frac{\overline{y}_{_{CJ}}^{2}}{b^{2}}=\unicode[STIX]{x1D707}_{o_{CJ}}^{2}(\unicode[STIX]{x1D709}\text{e}^{\overline{y}_{_{CJ}}})\nonumber\\ \displaystyle & & \displaystyle \quad \quad +\frac{2}{b}\left\{\left[\overline{y}_{_{CJ}}+\frac{\text{e}^{-\overline{y}_{_{CJ}}}}{x}\right]-\frac{\text{e}^{-\overline{y}_{_{CJ}}}}{\unicode[STIX]{x1D706}\,x}\left[(\text{e}^{\overline{y}_{_{CJ}}}\unicode[STIX]{x1D709}+1)+\int _{-1}^{\unicode[STIX]{x1D709}\text{e}^{\overline{y}_{_{CJ}}}}\unicode[STIX]{x1D707}_{o_{CJ}}(\unicode[STIX]{x1D709}^{\prime })\,\text{d}\unicode[STIX]{x1D709}^{\prime }\right]\right\}.\quad\end{eqnarray}$$
In the limit (4.14), equation (5.3) shows that the difference  $\overline{\unicode[STIX]{x1D707}}_{_{CJ}}(\unicode[STIX]{x1D709},\overline{y}_{_{CJ}})-\unicode[STIX]{x1D707}_{o_{CJ}}(\unicode[STIX]{x1D709}\text{e}^{\overline{y}_{_{CJ}}})$ is smaller than unity. Neglecting terms of order
 $1/b^{2}$, equations (4.12) with (4.20) are recovered from (5.3) if the sonic condition
 $\left(\overline{\unicode[STIX]{x1D707}}_{_{CJ}}-\overline{y}_{_{CJ}}/b\right)=0$ is assumed to hold at the end of the heat release,
 $\overline{\unicode[STIX]{x1D709}}_{_{CJ}}\text{e}^{\overline{y}_{_{CJ}}}=-1$ where
 $\unicode[STIX]{x1D709}=-1$ is the reduced position of the exit of the reaction zone in the planar CJ wave,
 $\unicode[STIX]{x1D714}_{o_{CJ}}(-1)=0$;
 $\unicode[STIX]{x1D709}\leqslant -\text{e}^{-\overline{y}_{_{CJ}}}:\unicode[STIX]{x1D714}_{o_{CJ}}(\unicode[STIX]{x1D709}\text{e}^{\overline{y}_{_{CJ}}})=0$ and
 $\unicode[STIX]{x1D707}_{o_{CJ}}(\unicode[STIX]{x1D709}\text{e}^{\overline{y}_{_{CJ}}})=0$, see (4.21). In fact, the sonic condition holds inside the detonation thickness just before the end of the exothermal reaction. Denoting by
 $\overline{\unicode[STIX]{x1D709}}_{s_{CJ}}$ its position,
 $$\begin{eqnarray}\displaystyle \unicode[STIX]{x1D709}=\overline{\unicode[STIX]{x1D709}}_{s_{CJ}}:\quad \left(\overline{\unicode[STIX]{x1D707}}_{_{CJ}}-\overline{y}_{_{CJ}}/b\right)=0, & & \displaystyle\end{eqnarray}$$
a first relation linking  $\overline{y}_{_{CJ}}$ and
 $\overline{\unicode[STIX]{x1D709}}_{s_{CJ}}$ is given by (5.2)–(5.3)
 $$\begin{eqnarray}\displaystyle \unicode[STIX]{x1D707}_{o_{CJ}}^{2}(\overline{\unicode[STIX]{x1D709}}_{s_{CJ}}\text{e}^{\overline{y}_{_{CJ}}})+\frac{2}{b}\left[\overline{y}_{_{CJ}}+\frac{\text{e}^{-\overline{y}_{_{CJ}}}}{\unicode[STIX]{x1D706}\,x}\int _{\overline{\unicode[STIX]{x1D709}}_{s_{CJ}}\text{e}^{\overline{y}_{_{CJ}}}}^{0}[1+\unicode[STIX]{x1D707}_{o_{CJ}}(\unicode[STIX]{x1D709}^{\prime })]\,\text{d}\unicode[STIX]{x1D709}^{\prime }\right]+\frac{\overline{y}_{_{CJ}}^{2}}{b^{2}}=0.\quad & & \displaystyle\end{eqnarray}$$
The second relation necessary to determine  $\overline{y}_{_{CJ}}$ and
 $\overline{\unicode[STIX]{x1D709}}_{s_{CJ}}$ is obtained from (5.1) if the derivative
 $\text{d}\overline{\unicode[STIX]{x1D707}}_{_{CJ}}(\unicode[STIX]{x1D709},\overline{y}_{_{CJ}})/\text{d}\unicode[STIX]{x1D709}|_{\unicode[STIX]{x1D709}=-1}$ is bounded
 $$\begin{eqnarray}\displaystyle \text{e}^{\overline{y}_{_{CJ}}}\unicode[STIX]{x1D714}_{o_{CJ}}(\overline{\unicode[STIX]{x1D709}}_{s_{CJ}}\text{e}^{\overline{y}_{_{CJ}}})=\frac{1}{b}\left[1+\unicode[STIX]{x1D707}_{o_{CJ}}(\overline{\unicode[STIX]{x1D709}}_{s_{CJ}}\text{e}^{\overline{y}_{_{CJ}}})\right]\frac{2}{\unicode[STIX]{x1D706}x}\,\,\Rightarrow \,\,\unicode[STIX]{x1D714}_{o_{CJ}}(\overline{\unicode[STIX]{x1D709}}_{s_{CJ}}\text{e}^{\overline{y}_{_{CJ}}})=O(1/b) & & \displaystyle\end{eqnarray}$$
showing that the reaction is not completed at the sonic point  $\unicode[STIX]{x1D714}_{o_{CJ}}(\overline{\unicode[STIX]{x1D709}}_{s_{CJ}}\text{e}^{\overline{y}_{_{CJ}}})>0$,
 $\overline{\unicode[STIX]{x1D709}}_{s_{CJ}}>-\text{e}^{-\overline{y}_{_{CJ}}}$, the reaction rate being, however, small, of order
 $1/b$. Subtracting (5.5) from (5.3) yields
 $$\begin{eqnarray}\displaystyle & & \displaystyle \unicode[STIX]{x1D709}\geqslant \overline{\unicode[STIX]{x1D709}}_{s_{CJ}}>-\text{e}^{-\overline{y}_{_{CJ}}}:\quad \left[\overline{\unicode[STIX]{x1D707}}_{_{CJ}}(\unicode[STIX]{x1D709},\overline{y}_{_{CJ}})-\frac{\overline{y}_{_{CJ}}}{b}\right]^{2}\nonumber\\ \displaystyle & & \displaystyle \quad =\int _{\overline{\unicode[STIX]{x1D709}}_{s_{CJ}}\text{e}^{\overline{y}_{_{CJ}}}}^{\unicode[STIX]{x1D709}\text{e}^{\overline{y}_{_{CJ}}}}\unicode[STIX]{x1D714}_{o_{CJ}}(\unicode[STIX]{x1D709}^{\prime })\,\text{d}\unicode[STIX]{x1D709}^{\prime }-\frac{1}{b}\left[(\unicode[STIX]{x1D709}-\overline{\unicode[STIX]{x1D709}}_{s_{CJ}})\text{e}^{\overline{y}_{_{CJ}}}+\int _{\overline{\unicode[STIX]{x1D709}}_{s_{CJ}}\text{e}^{\overline{y}_{_{CJ}}}}^{\unicode[STIX]{x1D709}\text{e}^{\overline{y}_{_{CJ}}}}\unicode[STIX]{x1D707}_{o_{CJ}}(\unicode[STIX]{x1D709}^{\prime })\,\text{d}\unicode[STIX]{x1D709}^{\prime }\right]\frac{2\text{e}^{-\overline{y}_{_{CJ}}}}{\unicode[STIX]{x1D706}x},\end{eqnarray}$$
so that the right-hand side should be positive
 $$\begin{eqnarray}\displaystyle \int _{\overline{\unicode[STIX]{x1D709}}_{s_{CJ}}\text{e}^{\overline{y}_{_{CJ}}}}^{\unicode[STIX]{x1D709}\text{e}^{\overline{y}_{_{CJ}}}}\unicode[STIX]{x1D714}_{o_{CJ}}(\unicode[STIX]{x1D709}^{\prime })\,\text{d}\unicode[STIX]{x1D709}^{\prime }\geqslant \frac{1}{b}\left[(\unicode[STIX]{x1D709}-\overline{\unicode[STIX]{x1D709}}_{s_{CJ}})\text{e}^{\overline{y}_{_{CJ}}}+\int _{\overline{\unicode[STIX]{x1D709}}_{s_{CJ}}\text{e}^{\overline{y}_{_{CJ}}}}^{\unicode[STIX]{x1D709}\text{e}^{\overline{y}_{_{CJ}}}}\unicode[STIX]{x1D707}_{o_{CJ}}(\unicode[STIX]{x1D709}^{\prime })\,\text{d}\unicode[STIX]{x1D709}^{\prime }\right]\frac{2\text{e}^{-\overline{y}_{_{CJ}}}}{\unicode[STIX]{x1D706}x}.\quad & & \displaystyle\end{eqnarray}$$
The inequality is automatically satisfied in the range  $0<(\unicode[STIX]{x1D709}-\overline{\unicode[STIX]{x1D709}}_{s_{CJ}})=O(1)$ for
 $b\gg 1$ and
 $|\overline{y}_{_{CJ}}|=O(1)$ because the functions
 $\unicode[STIX]{x1D714}_{o_{CJ}}(\unicode[STIX]{x1D709})$ and
 $\unicode[STIX]{x1D707}_{o_{CJ}}(\unicode[STIX]{x1D709})$ are of order unity and positive for
 $\unicode[STIX]{x1D709}>-1$. Both sides of (5.8) are increasing functions of
 $\unicode[STIX]{x1D709}$ from 0 at
 $\unicode[STIX]{x1D709}=\overline{\unicode[STIX]{x1D709}}_{s_{CJ}}$. The case
 $0<(\unicode[STIX]{x1D709}-\overline{\unicode[STIX]{x1D709}}_{s_{CJ}})\ll 1$ is easily investigated within the model (3.17) which will be used from now on. According to (3.17), the distribution of the reaction rate in the planar CJ wave is linear close to
 $\unicode[STIX]{x1D709}=-1$,
 $0<\unicode[STIX]{x1D709}+1\ll 1:\,\unicode[STIX]{x1D714}_{o_{CJ}}\approx h_{\unicode[STIX]{x1D714}}(\unicode[STIX]{x1D709}+1)$,
 $h_{\unicode[STIX]{x1D714}}>0$ and, according to (4.21), the slope of the velocity profile in the plane CJ wave is also positive and of order unity at the end of the reaction zone
 $$\begin{eqnarray}\unicode[STIX]{x1D709}\leqslant -1:\quad \unicode[STIX]{x1D707}_{o_{CJ}}=0\quad \text{but }\text{d}\unicode[STIX]{x1D707}_{o_{CJ}}/\text{d}\unicode[STIX]{x1D709}|_{\unicode[STIX]{x1D709}+1=0^{+}}=h_{\unicode[STIX]{x1D707}}>0,\end{eqnarray}$$
 $$\begin{eqnarray}0<(\unicode[STIX]{x1D709}+1)\ll 1:\quad \unicode[STIX]{x1D707}_{o_{CJ}}(\unicode[STIX]{x1D709})\approx h_{\unicode[STIX]{x1D707}}(\unicode[STIX]{x1D709}+1),\quad h_{\unicode[STIX]{x1D707}}>0,\,h_{\unicode[STIX]{x1D707}}\equiv \sqrt{h_{\unicode[STIX]{x1D714}}/2}=O(1).\end{eqnarray}$$
Then, according to (5.6),  $0<(\overline{\unicode[STIX]{x1D709}}_{s_{CJ}}+\text{e}^{-\overline{y}_{_{CJ}}})=O(1/b)$, the sonic condition can be safely applied at the exit of the reaction zone
 $\unicode[STIX]{x1D709}=-\text{e}^{-\overline{y}_{_{CJ}}}$. The first term of a Taylor expansion around
 $\unicode[STIX]{x1D709}=\overline{\unicode[STIX]{x1D709}}_{s_{CJ}}$ is the same on both sides of (5.8), and the second-order term satisfies the inequality (5.8) in the limit
 $b\gg 1$ when the second derivative
 $\text{d}^{2}\unicode[STIX]{x1D714}_{o_{CJ}}/\text{d}\unicode[STIX]{x1D709}^{2}|_{\unicode[STIX]{x1D709}+1\,=\,0^{+}}$ is of order unity (smaller than
 $b$). A Taylor expansion of (5.3) around the sonic point using (5.5)–(5.6) then yields
 $$\begin{eqnarray}\displaystyle 0\leqslant (\unicode[STIX]{x1D709}-\overline{\unicode[STIX]{x1D709}}_{s_{CJ}})\ll 1 & : & \displaystyle \quad \overline{\unicode[STIX]{x1D707}}_{_{CJ}}(\unicode[STIX]{x1D709},\overline{y}_{_{CJ}})-\frac{\overline{y}_{_{CJ}}}{b}\approx h_{\unicode[STIX]{x1D707}}\,\text{e}^{\overline{y}_{_{CJ}}}(\unicode[STIX]{x1D709}-\overline{\unicode[STIX]{x1D709}}_{s_{CJ}})\left[1+O\left(1/b\right)\right]\end{eqnarray}$$
 $$\begin{eqnarray}\displaystyle \unicode[STIX]{x1D709}<\overline{\unicode[STIX]{x1D709}}_{s_{CJ}} & : & \displaystyle \quad \overline{\unicode[STIX]{x1D707}}_{_{CJ}}(\unicode[STIX]{x1D709},\overline{y}_{_{CJ}})-\overline{y}_{_{CJ}}/b=0,\end{eqnarray}$$
and, more generally, one has
 $$\begin{eqnarray}\displaystyle x\geqslant \text{e}:\quad \overline{\unicode[STIX]{x1D707}}_{_{CJ}}(\unicode[STIX]{x1D709},\overline{y}_{_{CJ}}(x))=\unicode[STIX]{x1D707}_{o_{CJ}}(\unicode[STIX]{x1D709}\text{e}^{\overline{y}_{_{CJ}}(x)})\left[1+O\left(1/b\right)\right], & & \displaystyle\end{eqnarray}$$
valid everywhere inside the inner structure of the detonations on the upper branch of the CJ peninsula, even near the turning point  $x=\text{e}$ where, to leading order,
 $\overline{y}_{_{CJ}}\approx -1$. The correction to (4.12)–(4.13) is then shown to be negligible
 $$\begin{eqnarray}\displaystyle \overline{y}_{_{CJ}}+\frac{1}{x}\text{e}^{-\overline{y}_{_{CJ}}}=O(\overline{y}_{_{CJ}}^{2}/b),\quad \frac{\text{d}\overline{y}_{_{CJ}}}{\text{d}x}=\frac{\text{e}^{-\overline{y}_{_{CJ}}}}{x^{2}}\frac{1}{1+\overline{y}_{_{CJ}}\left[\,1+O(1/b)\,\right]}. & & \displaystyle\end{eqnarray}$$
5.2 Weakly overdriven regimes of spherical detonation
Consider now spherical detonations in a weakly overdriven regime. For a small curvature (4.9), to leading order in the limit (4.14), the term  $\unicode[STIX]{x1D707}$ on the right-hand of (3.10) can be replaced by
 $\unicode[STIX]{x1D707}_{o_{CJ}}(\unicode[STIX]{x1D709}\text{e}^{b\overline{\dot{\unicode[STIX]{x1D6FC}}}_{\unicode[STIX]{x1D70F}}})$. Denoting the steady-state approximation by an overbar, the equation for
 $\overline{\unicode[STIX]{x1D707}}(\unicode[STIX]{x1D709})$ when the unsteady term is neglected in (3.10) reads
 $$\begin{eqnarray}[\overline{\unicode[STIX]{x1D707}}(\unicode[STIX]{x1D709})-\overline{\dot{\unicode[STIX]{x1D6FC}}}_{\unicode[STIX]{x1D70F}}]\frac{\text{d}\overline{\unicode[STIX]{x1D707}}}{\text{d}\unicode[STIX]{x1D709}}=\frac{1}{2}\text{e}^{b\overline{\dot{\unicode[STIX]{x1D6FC}}}_{\unicode[STIX]{x1D70F}}}\unicode[STIX]{x1D714}_{o_{CJ}}(\unicode[STIX]{x1D709}\,\text{e}^{b\overline{\dot{\unicode[STIX]{x1D6FC}}}_{\unicode[STIX]{x1D70F}}})-[1+\unicode[STIX]{x1D707}_{o_{CJ}}(\unicode[STIX]{x1D709}\text{e}^{b\overline{\dot{\unicode[STIX]{x1D6FC}}}_{\unicode[STIX]{x1D70F}}})]\unicode[STIX]{x1D705},\quad \unicode[STIX]{x1D709}=0:\quad \overline{\unicode[STIX]{x1D707}}=1+2\overline{\dot{\unicode[STIX]{x1D6FC}}}_{\unicode[STIX]{x1D70F}}\end{eqnarray}$$
and the boundary condition at the exit of the inner structure,  $\unicode[STIX]{x1D709}=\unicode[STIX]{x1D709}_{b}$, of a slightly overdriven detonation takes the form
 $$\begin{eqnarray}\unicode[STIX]{x1D709}=\unicode[STIX]{x1D709}_{b}:\quad \overline{\unicode[STIX]{x1D707}}\approx \unicode[STIX]{x1D707}_{b},\quad 0<(\unicode[STIX]{x1D707}_{b}-\overline{\dot{\unicode[STIX]{x1D6FC}}}_{\unicode[STIX]{x1D70F}})\ll 1.\end{eqnarray}$$
If the boundary condition  $\overline{\unicode[STIX]{x1D707}}=\unicode[STIX]{x1D707}_{b}$ is taken at the end of the reaction
 $\unicode[STIX]{x1D709}=-\text{e}^{-b\overline{\dot{\unicode[STIX]{x1D6FC}}}_{\unicode[STIX]{x1D70F}}}$, equation (5.15) would lead to a negative slope at the end of the inner structure,
 $(\unicode[STIX]{x1D707}_{b}-\overline{\dot{\unicode[STIX]{x1D6FC}}}_{\unicode[STIX]{x1D70F}})\,\text{d}\overline{\unicode[STIX]{x1D707}}/\text{d}\unicode[STIX]{x1D709}\approx -\unicode[STIX]{x1D705}<0$. This is not satisfactory for the problem of direct initiation since the flow in the rarefaction wave is an increasing function of the radius and the reaction is exothermic. In fact the unsteady term cannot be neglected in the matching region between the inner structure and the inert rarefaction flow (external flow). In this intermediate zone, the flow is quasi-uniform at the scale of the thickness of the inner structure and all the terms of (3.10) are small, of the order of magnitude of the reduced curvature
 $1/\unicode[STIX]{x1D705}=O(1/b)$ at most, in particular, the reaction rate,
 $$\begin{eqnarray}\displaystyle \text{e}^{b\dot{\unicode[STIX]{x1D6FC}}_{\unicode[STIX]{x1D70F}}}\unicode[STIX]{x1D714}_{o_{CJ}}(\unicode[STIX]{x1D709}_{b}\,\text{e}^{b\dot{\unicode[STIX]{x1D6FC}}_{\unicode[STIX]{x1D70F}}})=O(1/b), & & \displaystyle\end{eqnarray}$$
the term involving the flow gradient is even smaller
 $$\begin{eqnarray}\displaystyle [\unicode[STIX]{x1D707}-\dot{\unicode[STIX]{x1D6FC}}_{\unicode[STIX]{x1D70F}}]\,\text{d}\unicode[STIX]{x1D707}/\text{d}\unicode[STIX]{x1D709}=o(1/b). & & \displaystyle\end{eqnarray}$$
In that respect, the situation is similar to the CJ case, the place where the external condition (5.16)  $\overline{\unicode[STIX]{x1D707}}=\unicode[STIX]{x1D707}_{b}$ is applied inside the inner structure is fairly close to the end of the reaction
 $$\begin{eqnarray}\displaystyle b\gg 1:\quad \unicode[STIX]{x1D709}_{b}=-\text{e}^{-b\dot{\unicode[STIX]{x1D6FC}}_{\unicode[STIX]{x1D70F}}}[1+O(1/b)]. & & \displaystyle\end{eqnarray}$$
and the difference from  $-\text{e}^{-b\dot{\unicode[STIX]{x1D6FC}}_{\unicode[STIX]{x1D70F}}}$ will not influence the leading order of the propagation velocity and the calculation for a given flow velocity of burnt gas
 $\unicode[STIX]{x1D707}_{b}$ proceeds as in § 5.1. Focusing our attention on propagation velocities and radii close to their critical values,
 ${\mathcal{D}}^{\ast }$ and
 $r_{f}^{\ast }$ introduced in §§ 4.2–4.3, it is convenient to introduce the dimensionless variables
 $y$ and
 $x$ of order unity, similar to (4.11),
 $$\begin{eqnarray}y\equiv b\dot{\unicode[STIX]{x1D6FC}}_{\unicode[STIX]{x1D70F}}=\frac{b}{\unicode[STIX]{x1D716}}\left(\frac{{\mathcal{D}}-{\mathcal{D}}_{o_{CJ}}}{a_{u}}\right)=O(1),\quad \frac{1}{x}\equiv \unicode[STIX]{x1D706}b\unicode[STIX]{x1D705}=O(1),\end{eqnarray}$$
the parameters  $\unicode[STIX]{x1D716}\ll 1$,
 $b\gg 1$ and
 $\unicode[STIX]{x1D706}\in [1,2]$ being defined in (3.1), (3.15) and (4.20) respectively. Integration of (5.15) from the Neumann state at
 $\unicode[STIX]{x1D709}=0$ leads to an expression similar to (5.3)
 $$\begin{eqnarray}\displaystyle \!\!\left[\overline{\unicode[STIX]{x1D707}}(\unicode[STIX]{x1D709})-\frac{\overline{y}}{b}\right]^{2} & = & \displaystyle \frac{\overline{y}^{2}}{b^{2}}+\unicode[STIX]{x1D707}_{o_{CJ}}^{2}(\unicode[STIX]{x1D709}\text{e}^{\overline{y}})\nonumber\\ \displaystyle \!\! & & \displaystyle +\,\frac{2}{b}\left\{\!\left[\overline{y}+\frac{\text{e}^{-\overline{y}}}{x}\right]-\frac{\text{e}^{-\overline{y}}}{\unicode[STIX]{x1D706}\,x}\left[(\text{e}^{\overline{y}}\unicode[STIX]{x1D709}+1)+\int _{-1}^{\unicode[STIX]{x1D709}\text{e}^{\overline{y}}}\unicode[STIX]{x1D707}_{o_{CJ}}(\unicode[STIX]{x1D709}^{\prime })\,\text{d}\unicode[STIX]{x1D709}^{\prime }\right]\!\right\}\!.\end{eqnarray}$$
The boundary condition in the burnt gas (5.16) using (5.19) and  $\unicode[STIX]{x1D707}_{o_{CJ}}(\unicode[STIX]{x1D709}_{b}\text{e}^{\overline{y}})=O(1/b)$, leads to the relation between
 $\overline{y}$ and
 $\unicode[STIX]{x1D707}_{b}$
 $$\begin{eqnarray}\displaystyle & \displaystyle b\unicode[STIX]{x1D707}_{b}^{2}/2-\overline{y}\unicode[STIX]{x1D707}_{b}=\overline{y}+\text{e}^{-\overline{y}}/x+O(1/b), & \displaystyle \nonumber\\ \displaystyle & \displaystyle \unicode[STIX]{x1D707}_{b}=O(1/\sqrt{b}):\quad b\unicode[STIX]{x1D707}_{b}^{2}/2=\overline{y}+\text{e}^{-\overline{y}}/x+O(1/\sqrt{b}), & \displaystyle\end{eqnarray}$$
where the last term on the right-hand side of (5.21) gives a negligible contribution, of order  $1/b$. The ordering
 $\unicode[STIX]{x1D707}_{b}(\unicode[STIX]{x1D70F})=O(1/\sqrt{b})$ corresponds to a propagation velocity and a radius of the same order of magnitude as at the turning point,
 $\overline{y}=O(1)$ and
 $x=O(1)$. For slightly overdriven detonations in a planar geometry
 $\unicode[STIX]{x1D705}=0$, equations (5.21)–(5.22) reduce to (C 5)–(C 8) in appendix C and the classical square root relation is recovered between the flow velocity in the burnt gas (overdrive factor) and the departure of the detonation velocity from its CJ value,
 $\unicode[STIX]{x1D705}=0,\,\,0<\overline{\dot{\unicode[STIX]{x1D6FC}}}_{\unicode[STIX]{x1D70F}}\ll 1\,\,\Rightarrow \,\,\unicode[STIX]{x1D707}_{b}\approx \sqrt{2\overline{\dot{\unicode[STIX]{x1D6FC}}}_{\unicode[STIX]{x1D70F}}}$. According to (5.21), the
 $\unicode[STIX]{x1D709}$-variation of
 $\overline{\unicode[STIX]{x1D707}}(\unicode[STIX]{x1D709})$ is through the grouping
 $\unicode[STIX]{x1D709}\text{e}^{\overline{y}}$ like in
 $\unicode[STIX]{x1D707}_{o_{CJ}}(\unicode[STIX]{x1D709}\text{e}^{\overline{y}})$. The difference
 $\overline{\unicode[STIX]{x1D707}}(\unicode[STIX]{x1D709})-\unicode[STIX]{x1D707}_{o_{CJ}}(\unicode[STIX]{x1D709}\text{e}^{b\overline{\dot{\unicode[STIX]{x1D6FC}}}_{\unicode[STIX]{x1D70F}}})$ is of order
 $1/\sqrt{b}$ near the end of the reaction where
 $\unicode[STIX]{x1D707}_{o_{CJ}}(\unicode[STIX]{x1D709}\text{e}^{\overline{y}})$ is of order
 $1/\sqrt{b}$ while the difference is smaller, of order
 $1/b$, elsewhere inside the inner structure of the detonation. The quasi-steady trajectories (5.22) are analysed in § 7.1.
6 Hyperbolic equation for the decay of spherical detonations
Using the discontinuous model and starting with the Sedov–Taylor (Sedov Reference Sedov1946; Taylor Reference Taylor1950b) self-similar solution of a strong blast wave in a cylindrical and/or spherical geometry, the numerical simulations of direct initiation of a detonation propagating with a Mach number  $M$ substantially larger than unity
 $M\gg 1$ show that the CJ velocity is reached at finite time and finite radius with a transition analysed by Liñan et al. (Reference Liñan, Kurdyumov and Sanchez2012). In order to describe the unsteady effects near the CJ regime, the limit of small heat release will be considered for the response of the inner detonation structure to the decrease rate of the quasi-uniform external flow at the end of the reaction zone. At the leading order in the limit (4.14), the small gradient of this external flow is assumed to have a negligible effect upon the inner structure.
6.1 Flow of burnt gas near the detonation. Closure relation
In the analysis of Liñan et al. (Reference Liñan, Kurdyumov and Sanchez2012) (discontinuous model and  $M\gg 1$), near the CJ regime, the quasi-transonic flow (relative to the detonation front) is described by a Burgers-like equation. The same equation is derived in the limit (3.1),
 $0<M-1\ll 1$ from (3.10) for the flow of burnt gas close to the end of the reaction zone
 $$\begin{eqnarray}\unicode[STIX]{x1D709}\leqslant \unicode[STIX]{x1D709}_{b},|\unicode[STIX]{x1D709}|=O(1):\quad \unicode[STIX]{x2202}\unicode[STIX]{x1D707}/\unicode[STIX]{x2202}\unicode[STIX]{x1D70F}+(\unicode[STIX]{x1D707}-\dot{\unicode[STIX]{x1D6FC}}_{\unicode[STIX]{x1D70F}})\unicode[STIX]{x2202}\unicode[STIX]{x1D707}/\unicode[STIX]{x2202}\unicode[STIX]{x1D709}=-\unicode[STIX]{x1D705}(\unicode[STIX]{x1D70F})\left[1+\unicode[STIX]{x1D707}\right],\end{eqnarray}$$
leading to the Burgers-like equation obtained by Liñan et al. (Reference Liñan, Kurdyumov and Sanchez2012)
 $$\begin{eqnarray}\dot{\unicode[STIX]{x1D6FC}}_{\unicode[STIX]{x1D70F}}<\unicode[STIX]{x1D707}<1:\quad \unicode[STIX]{x2202}\unicode[STIX]{x1D707}/\unicode[STIX]{x2202}\unicode[STIX]{x1D70F}+\unicode[STIX]{x1D707}\unicode[STIX]{x2202}\unicode[STIX]{x1D707}/\unicode[STIX]{x2202}\unicode[STIX]{x1D709}=-\unicode[STIX]{x1D705}.\end{eqnarray}$$
The curvature on the right-hand is quasi-constant when the radius gets close to the CJ condition. Going back to the dimensional form by using (3.2), (3.4), (3.7) and (3.9), equation (6.1) takes the more explicit form
 $$\begin{eqnarray}\displaystyle u(,t),\quad =r-r_{f}(t):\quad \frac{\unicode[STIX]{x2202}u}{\unicode[STIX]{x2202}t}+[a-({\mathcal{D}}-u)]\frac{\unicode[STIX]{x2202}u}{\unicode[STIX]{x2202}}=-\frac{a}{r}u, & & \displaystyle\end{eqnarray}$$
describing the propagation of the upstream-running mode in the rarefaction flow near the detonation where this flow is quasi-transonic,  $a\gg a-({\mathcal{D}}-u)\geqslant 0$. In the laboratory frame, the flow behind an expending detonation (
 $\text{d}r_{f}/\text{d}t>0$,
 $\unicode[STIX]{x1D709}\leqslant \unicode[STIX]{x1D709}_{b}<0$) decreases when the distance from the detonation front increases; the flow is an increasing function of the radius,
 $\unicode[STIX]{x2202}u/\unicode[STIX]{x2202}r>0$. The burnt-gas flow of the rarefaction wave varies in space on a length scale
 $l_{ext}\equiv [(1/u)\unicode[STIX]{x2202}u/\unicode[STIX]{x2202}r]^{-1}$ typically of the order of magnitude of the radius of the lead shock
 $r_{f}$. When the radius is larger than the detonation thickness,
 $r_{f}\gg l$, the length scale of the external flow is larger than the detonation thickness
 $l_{ext}\gg l$. According to the quasi-transonic flow of burnt gas when approaching the CJ regime,
 $0\leqslant a-({\mathcal{D}}-u)\ll a$, the second term on the left-hand side of (6.1) and (6.3) (the one involving the derivative with respect to space) is smaller than the right-hand side and can be neglected. Therefore, near the end of the reaction zone, the instantaneous flow
 $u_{b}(t)$ or
 $\unicode[STIX]{x1D707}_{b}(\unicode[STIX]{x1D70F})$ is simply a function of the flow curvature
 $$\begin{eqnarray}\frac{\text{d}\unicode[STIX]{x1D707}_{b}}{\text{d}\unicode[STIX]{x1D70F}}=-\unicode[STIX]{x1D705}(\unicode[STIX]{x1D70F})[1+\unicode[STIX]{x1D707}_{b}],\quad \frac{1}{u_{b}}\frac{\text{d}u_{b}}{\text{d}t}=-\frac{a}{r_{f}},\quad \unicode[STIX]{x1D707}_{b}(\unicode[STIX]{x1D70F})=[1+\unicode[STIX]{x1D707}_{bi}]\text{e}^{-\int _{0}^{\unicode[STIX]{x1D70F}}\unicode[STIX]{x1D705}(\unicode[STIX]{x1D70F}^{\prime })\,\text{d}\unicode[STIX]{x1D70F}^{\prime }}-1,\end{eqnarray}$$
where the subscript  $i$ denotes the initial condition at
 $\unicode[STIX]{x1D70F}=0$. Introducing the reduced radius of the shock front (4.20),
 $x=1/(\unicode[STIX]{x1D706}\,b\,\unicode[STIX]{x1D705})$, and the definition (3.3) of
 $\dot{\unicode[STIX]{x1D6FC}}_{\unicode[STIX]{x1D70F}}$, the relations
 ${\mathcal{D}}\equiv \text{d}r_{f}/\text{d}t$,
 $\text{d}/\text{d}\unicode[STIX]{x1D70F}=(t_{r}/\unicode[STIX]{x1D716})\,\text{d}/\text{d}t$ and
 $l_{o_{CJ}}\equiv a_{u}t_{r}$, lead to
 $$\begin{eqnarray}\frac{\text{d}x}{\text{d}\unicode[STIX]{x1D70F}}=\frac{1}{\unicode[STIX]{x1D706}b}\left[1+\unicode[STIX]{x1D716}(1+\dot{\unicode[STIX]{x1D6FC}}_{\unicode[STIX]{x1D70F}})\right]\approx \frac{1}{\unicode[STIX]{x1D706}b},\quad x(\unicode[STIX]{x1D70F})-x_{i}\approx \frac{\unicode[STIX]{x1D70F}}{b\unicode[STIX]{x1D706}},\quad \unicode[STIX]{x1D707}_{b}(\unicode[STIX]{x1D70F})\approx \unicode[STIX]{x1D707}_{bi}-\ln (x/x_{i}),\end{eqnarray}$$
where the last relation is obtained from the first relation in (6.4) for  $\unicode[STIX]{x1D707}_{b}\ll 1$.
According to Liñan et al. (Reference Liñan, Kurdyumov and Sanchez2012), the scale separation insuring the validity of (6.4)–(6.5) breaks down abruptly as soon as the CJ regime is reached. Moreover, this occurs at a finite radius. Therefore the transition to the Chapman–Jouguet regime is abrupt, producing quasi-instantaneously a jump of flow gradient (not of the flow velocity) inside the rarefaction wave. The key point is that the velocity  ${\mathcal{D}}(\unicode[STIX]{x1D70F})$ of an overdriven detonation whose inner structure is in steady state cannot decrease below the CJ velocity
 ${\mathcal{D}}_{o_{CJ}}$ so that the strong deceleration of the detonation (
 $\text{d}{\mathcal{D}}/\text{d}\unicode[STIX]{x1D70F}<0$) which is induced by the rarefaction wave is stopped suddenly (
 $\text{d}{\mathcal{D}}/\text{d}\unicode[STIX]{x1D70F}\approx 0$) when
 ${\mathcal{D}}(t)$ reaches
 ${\mathcal{D}}_{o_{CJ}}$. Then, the velocity gradient of the external flow at the detonation front jumps to infinity and remains infinite subsequently. Just after the transition, the unsteady term
 $\unicode[STIX]{x2202}\unicode[STIX]{x1D707}/\unicode[STIX]{x2202}\unicode[STIX]{x1D70F}$ in (6.1)–(6.2) drops off and, in contrast to (6.4), the curvature term
 $\unicode[STIX]{x1D705}$ is now balanced by the nonlinear term leading to the well-known singularity of the flow gradient in the Taylor–Zeldovich self-similar solution behind the front of a spherical CJ detonation considered as a discontinuity,
 $(\unicode[STIX]{x1D707}-\dot{\unicode[STIX]{x1D6FC}}_{\unicode[STIX]{x1D70F}})\unicode[STIX]{x2202}\unicode[STIX]{x1D707}/\unicode[STIX]{x2202}\unicode[STIX]{x1D709}=-\unicode[STIX]{x1D705}$,
 $\Rightarrow \,(\unicode[STIX]{x1D707}-\dot{\unicode[STIX]{x1D6FC}}_{\unicode[STIX]{x1D70F}})|_{\unicode[STIX]{x1D709}=0^{-}}=-\sqrt{-2\,\unicode[STIX]{x1D705}\,\unicode[STIX]{x1D709}}$, see Zeldovich (Reference Zeldovich1942), Taylor (Reference Taylor1950a) and Zeldovich & Kompaneets (Reference Zeldovich and Kompaneets1960). The singular disturbance (jump of the velocity gradient) which is generated instantaneously at the sonic point moves away from the detonation front in the form of a weak discontinuity, see Liñan et al. (Reference Liñan, Kurdyumov and Sanchez2012). As noticed first by Taylor (Reference Taylor1950a), the compatibility of a discontinuous model and an infinite slope of the burnt-gas velocity at the detonation front is questionable. This point will be clarified when the response of the inner detonation structure is taken into account making the transition softer.
6.2 Formulation in the double limit ‘small heat release and large activation energy’
Solving the characteristic equation (3.10) (upstream-running mode) for the flow field  $\unicode[STIX]{x1D707}(\unicode[STIX]{x1D709},\unicode[STIX]{x1D70F})$ satisfying the two boundary conditions (3.11), the detonation velocity
 $\dot{\unicode[STIX]{x1D6FC}}_{\unicode[STIX]{x1D70F}}(\unicode[STIX]{x1D70F})$ appears as an eigenfunction of the problem. Using (3.16), (3.18) and the notation (4.20)
 $x\equiv 1/(\unicode[STIX]{x1D706}\,b\,\unicode[STIX]{x1D705})$, equations (3.10)–(3.11) take the form
 $$\begin{eqnarray}\frac{\unicode[STIX]{x2202}\unicode[STIX]{x1D707}}{\unicode[STIX]{x2202}\unicode[STIX]{x1D70F}}+\left[\unicode[STIX]{x1D707}-\dot{\unicode[STIX]{x1D6FC}}_{\unicode[STIX]{x1D70F}}(\unicode[STIX]{x1D70F})\right]\frac{\unicode[STIX]{x2202}\unicode[STIX]{x1D707}}{\unicode[STIX]{x2202}\unicode[STIX]{x1D709}}=\frac{1}{2}\text{e}^{b\dot{\unicode[STIX]{x1D6FC}}_{\unicode[STIX]{x1D70F}}}\unicode[STIX]{x1D714}_{o_{CJ}}(\unicode[STIX]{x1D709}\,\text{e}^{b\dot{\unicode[STIX]{x1D6FC}}_{\unicode[STIX]{x1D70F}}})-\frac{1}{b}\left(1+\unicode[STIX]{x1D707}\right)\frac{1}{\unicode[STIX]{x1D706}\,x(\unicode[STIX]{x1D70F})},\end{eqnarray}$$
 $$\begin{eqnarray}\unicode[STIX]{x1D709}=0:\quad \unicode[STIX]{x1D707}=1+2\dot{\unicode[STIX]{x1D6FC}}_{\unicode[STIX]{x1D70F}}(\unicode[STIX]{x1D70F}),\quad \unicode[STIX]{x1D709}=\unicode[STIX]{x1D709}_{b}(\unicode[STIX]{x1D70F}):\quad \unicode[STIX]{x1D707}=\unicode[STIX]{x1D707}_{b}(\unicode[STIX]{x1D70F}),\end{eqnarray}$$
where  $\unicode[STIX]{x1D707}_{b}(\unicode[STIX]{x1D70F})$ is the flow of the rarefaction wave at the detonation wave. For the same reason as in § 5.2, to leading order in the limit of large activation energy (4.14), the external flow
 $\unicode[STIX]{x1D707}_{b}(\unicode[STIX]{x1D70F})$ is imposed on the detonation wave at the end of the reaction rate,
 $\unicode[STIX]{x1D709}_{b}(\unicode[STIX]{x1D70F})\approx -\text{e}^{-b\dot{\unicode[STIX]{x1D6FC}}(\unicode[STIX]{x1D70F})}$. According to (6.5),
 $\unicode[STIX]{x1D707}_{b}(\unicode[STIX]{x1D70F})$ is a decreasing function (
 $\text{d}\unicode[STIX]{x1D707}_{b}/\text{d}\unicode[STIX]{x1D70F}<0$,
 $\text{d}\dot{\unicode[STIX]{x1D6FC}}_{\unicode[STIX]{x1D70F}}/\text{d}\unicode[STIX]{x1D70F}<0$) down to the CJ regime
 $\unicode[STIX]{x1D707}_{b}=\dot{\unicode[STIX]{x1D6FC}}_{\unicode[STIX]{x1D70F}}$ which is reached at
 $x=x_{i_{CJ}}$ and
 $\unicode[STIX]{x1D70F}=\unicode[STIX]{x1D70F}_{i_{CJ}}$
 $$\begin{eqnarray}\displaystyle \unicode[STIX]{x1D70F}_{i_{CJ}}=b\,(x_{i_{CJ}}-x_{i})\unicode[STIX]{x1D706},\quad \ln (x_{i_{CJ}}/x_{i})=\unicode[STIX]{x1D707}_{bi}-\dot{\unicode[STIX]{x1D6FC}}_{\unicode[STIX]{x1D70F}}(\unicode[STIX]{x1D70F}_{i_{CJ}}), & & \displaystyle\end{eqnarray}$$
and the sonic condition keeps on verified afterwards  $\unicode[STIX]{x1D70F}\geqslant \unicode[STIX]{x1D70F}_{i_{CJ}}$,
 $$\begin{eqnarray}\displaystyle & \displaystyle \unicode[STIX]{x1D70F}<\unicode[STIX]{x1D70F}_{i_{CJ}}:\quad \unicode[STIX]{x1D707}_{b}(\unicode[STIX]{x1D70F})=\unicode[STIX]{x1D707}_{bi}-\ln (x/x_{i})\quad \text{where }x(\unicode[STIX]{x1D70F})-x_{i}\approx \unicode[STIX]{x1D70F}/(b\unicode[STIX]{x1D706}) & \displaystyle\end{eqnarray}$$
 $$\begin{eqnarray}\displaystyle & \displaystyle \unicode[STIX]{x1D70F}\geqslant \unicode[STIX]{x1D70F}_{i_{CJ}}:\quad \unicode[STIX]{x1D707}_{b}(\unicode[STIX]{x1D70F})=\dot{\unicode[STIX]{x1D6FC}}_{\unicode[STIX]{x1D70F}}(\unicode[STIX]{x1D70F}). & \displaystyle\end{eqnarray}$$
Focusing our attention on propagation velocities and radii of the same order of magnitude as their critical values  ${\mathcal{D}}^{\ast }$ and
 $r_{f}^{\ast }$,
 $|\dot{\unicode[STIX]{x1D6FC}}_{\unicode[STIX]{x1D70F}}|=O(1/b)$ and
 $\unicode[STIX]{x1D705}=O(1/b)$, it is convenient to introduce the phase space of ‘velocity–radius’
 $y$–
 $x$ involving the dimensionless variables (5.20) of order unity. Anticipating that the flow of burnt gas is then of the same order of magnitude as in the slightly overdriven regimes (5.22),
 $\unicode[STIX]{x1D707}_{b}=O(1/\sqrt{b})$,
 $\dot{\unicode[STIX]{x1D6FC}}_{\unicode[STIX]{x1D70F}}\ll \unicode[STIX]{x1D707}_{b}$, equation (6.8) yields
 $\ln (x_{i_{CJ}}/x_{i})\approx \unicode[STIX]{x1D707}_{bi}=O(1/\sqrt{b})$
 $\Rightarrow$
 $(x_{i_{CJ}}-x_{i})/x_{i}\approx \unicode[STIX]{x1D707}_{bi}=O(1/\sqrt{b})$,
 $$\begin{eqnarray}\displaystyle \unicode[STIX]{x1D707}_{bi}=O(1/\sqrt{b})\quad \Rightarrow \quad \unicode[STIX]{x1D70F}_{i_{CJ}}\approx (b\unicode[STIX]{x1D707}_{bi})\unicode[STIX]{x1D706}x_{i}=O(\sqrt{b}), & & \displaystyle\end{eqnarray}$$
and the boundary condition at the exit of the inner structure  $\unicode[STIX]{x1D709}_{b}\approx -\text{e}^{-y}$ reduces to
 $$\begin{eqnarray}\displaystyle 0\leqslant \unicode[STIX]{x1D70F}<\unicode[STIX]{x1D70F}_{i_{CJ}}:\quad \unicode[STIX]{x1D707}_{b}\approx \unicode[STIX]{x1D707}_{bi}(1-\unicode[STIX]{x1D70F}/\unicode[STIX]{x1D70F}_{i_{CJ}}),\quad \unicode[STIX]{x1D70F}>\unicode[STIX]{x1D70F}_{i_{CJ}}:\quad \unicode[STIX]{x1D707}_{b}\approx 0. & & \displaystyle\end{eqnarray}$$
The first equation in (6.12) is obtained from (6.9) for  $\unicode[STIX]{x1D70F}$ of the same order of magnitude as
 $\unicode[STIX]{x1D70F}_{i_{CJ}}$,
 $\unicode[STIX]{x1D70F}=O(\sqrt{b})$ and the second equation holds since the order of magnitude of
 $|\dot{\unicode[STIX]{x1D6FC}}_{\unicode[STIX]{x1D70F}}|=O(1/b)$ is smaller than
 $\unicode[STIX]{x1D707}_{b}=O(1/\sqrt{b})$ leading to the acceleration of the flow of burnt gas, in agreement with (6.4)
 $\text{d}\unicode[STIX]{x1D707}_{b}/\text{d}\unicode[STIX]{x1D70F}=O(1/b)$. Introducing the radius
 $x_{i_{CJ}}\equiv x(\unicode[STIX]{x1D70F}_{i_{CJ}})$ at which the CJ condition is reached and the functions of order unity
 $\text{m}_{b}(\unicode[STIX]{x1D70F})$ and/or
 $\text{m}_{b}(x)$ (
 $x$ being a linear function of
 $\unicode[STIX]{x1D70F}$),
 $$\begin{eqnarray}\text{m}_{b}\equiv \sqrt{b/2}\,\unicode[STIX]{x1D707}_{b}=O(1),\quad \text{m}_{bi}\equiv \sqrt{b/2}\,\unicode[STIX]{x1D707}_{bi}=O(1),\quad (x_{i_{CJ}}-x_{i})/x_{i}\approx \sqrt{2/b}\,\text{m}_{bi}\quad\end{eqnarray}$$
equations (6.12) take the form
 $$\begin{eqnarray}\displaystyle \hspace{-18.0pt} & \displaystyle x<x_{i_{CJ}}:\quad \text{m}_{b}(x)=\text{m}_{bi}-\sqrt{b/2}\ln (x/x_{i})\Leftrightarrow \unicode[STIX]{x1D70F}<\unicode[STIX]{x1D70F}_{i_{CJ}}:\quad \text{m}_{b}(\unicode[STIX]{x1D70F})/\text{m}_{bi}\approx 1-\unicode[STIX]{x1D70F}/\unicode[STIX]{x1D70F}_{i_{CJ}},\quad & \displaystyle\end{eqnarray}$$
 $$\begin{eqnarray}\displaystyle \hspace{-18.0pt} & \displaystyle x>x_{i_{CJ}}:\quad \text{m}_{b}(x)=0\quad \Leftrightarrow \quad \unicode[STIX]{x1D70F}>\unicode[STIX]{x1D70F}_{i_{CJ}}:\quad \text{m}_{b}(\unicode[STIX]{x1D70F})=0. & \displaystyle\end{eqnarray}$$
To leading order in the double limit (4.14), equations (6.6)–(6.7), written in the notations (5.20), take the form
 $$\begin{eqnarray}\frac{\unicode[STIX]{x2202}\unicode[STIX]{x1D707}}{\unicode[STIX]{x2202}\unicode[STIX]{x1D70F}}+\left(\unicode[STIX]{x1D707}-\frac{y}{b}\right)\frac{\unicode[STIX]{x2202}\unicode[STIX]{x1D707}}{\unicode[STIX]{x2202}\unicode[STIX]{x1D709}}=\frac{1}{2}\text{e}^{y(\unicode[STIX]{x1D70F})}\unicode[STIX]{x1D714}_{o_{CJ}}(\unicode[STIX]{x1D709}\,\text{e}^{y(\unicode[STIX]{x1D70F})})-\frac{1}{b}\left(1+\unicode[STIX]{x1D707}\right)\frac{1}{\unicode[STIX]{x1D706}\,x(\unicode[STIX]{x1D70F})},\end{eqnarray}$$
 $$\begin{eqnarray}\unicode[STIX]{x1D709}=0:\quad \unicode[STIX]{x1D707}=1+2y(\unicode[STIX]{x1D70F})/b,\quad \unicode[STIX]{x1D709}=-\text{e}^{-y(\unicode[STIX]{x1D70F})}:\quad \unicode[STIX]{x1D707}=\sqrt{2/b}\,\text{m}_{b}(\unicode[STIX]{x1D70F}),\end{eqnarray}$$
where  $\text{m}_{b}(\unicode[STIX]{x1D70F})=O(1)$ is given in (6.14)–(6.15). Except for a negligible slope of order
 $1/b$ in the induction layer, the flow field
 $\unicode[STIX]{x1D707}(\unicode[STIX]{x1D709},\unicode[STIX]{x1D70F})$ is an increasing function of
 $\unicode[STIX]{x1D709}$, so that no singularity of the wave breaking type is produced by the nonlinear term on the left-hand side of (6.16). The trajectories approaching the CJ regime are parametrized by an initial condition
 $\unicode[STIX]{x1D70F}=0:x=x_{i}$ and
 $\text{m}_{b}=\text{m}_{bi}$ where
 $x_{i}$ and
 $\text{m}_{bi}$ are non-dimensional parameters of order unity. If the trajectory is in quasi-steady state at the initial state (
 $\unicode[STIX]{x1D70F}=0$), then, according to (5.22), the initial velocity
 $y_{i}$ is expressed in terms of
 $\text{m}_{bi}$ and
 $x_{i}$
 $$\begin{eqnarray}y_{i}+\text{e}^{-\overline{y}_{i}}/x_{i}=\text{m}_{bi}^{2}+O(1/\sqrt{b}).\end{eqnarray}$$
There is, however, no reason for this condition to be verified by unsteady trajectories.
A first rough comment on the initiation criterion can be made right now. If the initial condition is such that the radius  $x_{i_{CJ}}$ is smaller than the critical radius,
 $x_{i_{CJ}}<x^{\ast }$ (
 $x^{\ast }=\text{e}$, see (4.20)), then the peninsula of the quasi-steady CJ waves in § 4 cannot be reached and no success of initiation is expected; see the quasi-steady trajectories in figure 1 discussed in the next section. However, this criterion of failure assumes implicitly that the critical radius is not strongly modified by unsteady effects. This remains to be proven by future studies. In the following, our attention is focused on the unsteady effects for
 $x_{i_{CJ}}$ larger than
 $x^{\ast }$. In this case, the dynamical problem reduces to an integral equation presented in § 8 for the propagation velocity
 $y(\unicode[STIX]{x1D70F})$. Before analysing the fully unsteady solution, it is worth discussing briefly the detonation decay in the quasi-steady-state approximation.
7 Quasi-steady trajectories
In this section the trajectories  $\overline{y}(x)$ in the phase space of ‘velocity–radius’ are analysed in the double limit (4.14) when the unsteady term is neglected in (6.16), the term
 $\unicode[STIX]{x1D707}(\unicode[STIX]{x1D709},\unicode[STIX]{x1D70F})$ in the last term on the right-hand side (curvature term) being replaced by the zeroth-order solution
 $\unicode[STIX]{x1D707}_{o_{CJ}}(\unicode[STIX]{x1D709}\text{e}^{\overline{y}(x)})$. This leads us to solve (5.15) with the boundary condition
 $\unicode[STIX]{x1D709}=-\text{e}^{-\overline{y}(x)}:\unicode[STIX]{x1D707}=\sqrt{2/b}\,\text{m}_{b}$ and
 $\text{m}_{b}(x)$ given in (6.14). According to (5.22) the result is
 $$\begin{eqnarray}\displaystyle \overline{y}(x)+\frac{\text{e}^{-\overline{y}(x)}}{x}=\text{m}_{b}^{2}(x),\quad \sqrt{\overline{y}(x)+\text{e}^{-\overline{y}(x)}/x}=\text{m}_{bi}-\sqrt{b/2}\ln (x/x_{i}). & & \displaystyle\end{eqnarray}$$
Usually, the quasi-steady approximation is accurate for stable detonations whose characteristic time of evolution is larger than the response time of the inner structure. According to (6.11)–(6.12), the driving mechanism of the rarefaction wave evolves effectively on a time scale larger than the response time of the inner structure of a stable detonation,  $\unicode[STIX]{x2202}/\unicode[STIX]{x2202}\unicode[STIX]{x1D70F}=O(1)$ since
 $(1/\unicode[STIX]{x1D707}_{b})\,\text{d}\unicode[STIX]{x1D707}_{b}/\text{d}\unicode[STIX]{x1D70F}=O(1/\sqrt{b})$. Unfortunately, such a slow forcing term
 $\unicode[STIX]{x1D707}_{b}(\unicode[STIX]{x1D70F})$ introduces unsteady effects that are not smaller than the geometrical effect responsible of the S-shaped curve
 $\overline{y}_{_{CJ}}(x)$. Therefore, as discussed in more detail in § 7.3, despite the separation of time scales between the fast response of the inner structure and the slow dynamics of the burnt gas, the quasi-steady approximation is not accurate when the CJ condition is approached. However, the ‘quasi-steady trajectories’ are worth investigating first for two reasons; first, to enlighten the effect of the curvature of the detonation front by comparison with the work of Liñan et al. (Reference Liñan, Kurdyumov and Sanchez2012) in which the curvature is ignored and, second, to exhibit the role of unsteadiness by comparison with the results when the unsteady term is included.
7.1 Quasi-steady trajectory for failure of the initiation process
Two examples of C-shaped curves  $\overline{y}(x)$,
 $\sqrt{\overline{y}(x)+\text{e}^{-\overline{y}(x)}/x}=\overline{m}_{b}$, corresponding to a constant value
 $\overline{m}_{b}$, are plotted in figure 1 for
 $\overline{m}_{b}=0.71$ and
 $\overline{m}_{b}=1$, in comparison with the CJ solution
 $\overline{y}_{_{CJ}}(x)$,
 $\overline{m}_{b}=0:\overline{y}_{_{CJ}}+x^{-1}\text{e}^{-\overline{y}_{_{CJ}}}=0$. Inside the CJ peninsula,
 $\overline{y}+x^{-1}\text{e}^{-\overline{y}}<0$ (dashed domain) there is no solution. The turning point of the iso-
 $\overline{m}$ lines
 $y=\overline{y}(x)$ is located at the intersection with the curve
 $y=-\ln x$ plotted in red in figure 1,
 $\text{d}\overline{y}/\text{d}x|_{\overline{m}^{2}=\text{cost}.}=\text{e}^{-\overline{y}}/[x(x-e^{-\overline{y}})]$. Consider first a trajectory (7.1) which does not intersect the upper branch of the CJ peninsula
 $\overline{y}_{_{CJ}}(x)$,
 $x_{i_{CJ}}<x^{\ast }=\text{e}$. The derivative
 $\text{d}\overline{y}/\text{d}x$ becomes infinite at the intersection point with the curve
 $y=-\ln x$,
 $x=\text{e}^{-\overline{y}}<x^{\ast }$,
 $\overline{y}>y^{\ast }=-1$,
 $\text{d}\overline{y}/\text{d}x|_{x=\text{e}^{-\overline{y}}}=\infty$, where the derivative changes of sign, see (A 5) in appendix A,
 $\text{d}\overline{y}/\text{d}x<0$ for
 $x>\text{e}^{-\overline{y}}$ and
 $\text{d}\overline{y}/\text{d}x>0$ for
 $x<\text{e}^{-\overline{y}}$. The situation is different at the critical point,
 $x=\text{e}$,
 $\overline{y}=-1$ where the derivative is discontinuous,
 $\text{d}\overline{y}/\text{d}x|_{\overline{y}+1=0^{+}}\neq \text{d}\overline{y}/\text{d}x|_{\overline{y}+1=0^{-}}$, see (A 8). In any case, such singularities of the derivative
 $\text{d}\overline{y}/\text{d}x$ indicate that the quasi-steady approximation cannot be valid when approaching the curve
 $y=-\ln x$. The part of the trajectory
 $\overline{y}(x)$ below the curve
 $y=-\ln x$ (
 $\overline{y}<-\ln x$,
 $x<\text{e}^{-\overline{y}}$, dashed part of
 $y_{2}(x)$ in figure 1) is not meaningful and cannot be the extension of the trajectory because, according to (6.5), the radius should increase with the time,
 $\text{d}x/\text{d}\unicode[STIX]{x1D70F}>0$. Even though the quasi-steady-state approximation is no longer valid near the curve
 $y=-\ln x$, the quasi-steady trajectories suggest a curvature-induced failure mechanism.
7.2 Quasi-steady trajectories for a successful initiation process
Consider now a quasi-steady trajectory  $\overline{y}(x)$ intersecting the upper branch of the CJ peninsula
 $\overline{y}_{_{CJ}}(x)$,
 $\overline{y}_{_{CJ}}+\text{e}^{-\overline{y}_{_{CJ}}}/x=0(\overline{m}_{b}=0)$, at a radius
 $x_{_{CJ}}>\text{e}$ not too close to the critical radius,
 $\overline{y}(x_{_{CJ}})>-1$, see
 $y_{1}(x)$ in figure 1. A sharp transition occurs at
 $x=x_{_{CJ}}$, reminiscent of the transition described by Liñan et al. (Reference Liñan, Kurdyumov and Sanchez2012) and the cases
 $x<x_{_{CJ}}$ and
 $x>x_{_{CJ}}$ have to be analysed separately. After expressing
 $x_{_{CJ}}$ in term of the initial condition
 $x=x_{i},\,\overline{y}=y_{i},\,\overline{m}_{b}=m_{bi}>0$, equation (7.1) takes the form
 $$\begin{eqnarray}x\leqslant x_{_{CJ}}:\quad \sqrt{\overline{y}(x)+\frac{1}{x}\text{e}^{-\overline{y}(x)}}=\sqrt{\frac{b}{2}}\,\ln \left(\frac{x_{_{CJ}}}{x}\right),\end{eqnarray}$$
in agreement with (6.14), showing that the trajectory  $\overline{y}(x)$ is tangent to the upper CJ branch
 $y_{_{CJ}}(x)$ from above in the form
 $$\begin{eqnarray}\displaystyle \left[\overline{y}(x)-\overline{y}_{_{CJ}}(x)\right]=\frac{b/2}{x_{_{CJ}}^{2}\left[1+\overline{y}_{_{CJ}}(x_{_{CJ}})\right]}(x_{_{CJ}}-x)^{2}, & & \displaystyle\end{eqnarray}$$
valid for a vicinity of  $x_{_{CJ}}$ defined by the inequality
 $0<(x-x_{_{CJ}})\ll \left[1+\overline{y}_{_{CJ}}(x_{_{CJ}})\right]x_{_{CJ}}$, see (A 9)–(A 18). In that respect, the quasi-steady decay towards the upper branch of the CJ peninsula is similar to the decay towards the planar CJ velocity studied by Liñan et al. (Reference Liñan, Kurdyumov and Sanchez2012) with the discontinuous model (no curvature effect). However, the convergence radius of (7.3) decreases to zero at the turning point (
 $x_{_{CJ}}=\text{e}$,
 $y_{_{CJ}}+1=0$) stressing the critical nature of this point.
7.3 Limitation of the steady-state approximation
Integration of (6.16) across the inner structure when  $\unicode[STIX]{x1D707}$ is replaced by
 $\unicode[STIX]{x1D707}_{o_{CJ}}(\unicode[STIX]{x1D709}\text{e}^{b\overline{y}})$ in the curvature term, gives that the unsteady term introduces an additional term into (7.1)
 $$\begin{eqnarray}\displaystyle \left[y(\unicode[STIX]{x1D70F})+\frac{\text{e}^{-y(\unicode[STIX]{x1D70F})}}{x(\unicode[STIX]{x1D70F})}\right]\approx \text{m}_{b}^{2}(\unicode[STIX]{x1D70F})+b\int _{-\text{e}^{-y(\unicode[STIX]{x1D70F})}}^{0}(\unicode[STIX]{x2202}\unicode[STIX]{x1D707}/\unicode[STIX]{x2202}\unicode[STIX]{x1D70F})\,\text{d}\unicode[STIX]{x1D709}. & & \displaystyle\end{eqnarray}$$
The validity of the quasi-steady assumption requires that the integral term on the right-hand side of (7.4) is smaller than  $1/b$. This cannot be true for unstable detonations,
 $\unicode[STIX]{x2202}\unicode[STIX]{x1D707}/\unicode[STIX]{x2202}\unicode[STIX]{x1D70F}=O(1)$, and attention is limited here on stable waves. In the spirit of the multiple-time-scale approximation, neglecting the fast relaxation of the inner structure toward its quasi-steady state, the unsteady term
 $(\unicode[STIX]{x2202}\unicode[STIX]{x1D707}/\unicode[STIX]{x2202}\unicode[STIX]{x1D70F})$ can be evaluated by using the zeroth order of the solution of (5.21) in the limit
 $b\gg 1$,
 $\overline{\unicode[STIX]{x1D707}}_{0}(\unicode[STIX]{x1D709},\overline{y})=\unicode[STIX]{x1D707}_{o_{CJ}}(\unicode[STIX]{x1D709}\text{e}^{\overline{y}})$,
 $$\begin{eqnarray}\displaystyle \unicode[STIX]{x2202}\overline{\unicode[STIX]{x1D707}}_{0}(\unicode[STIX]{x1D709},\overline{y}(\unicode[STIX]{x1D70F}))/\unicode[STIX]{x2202}\unicode[STIX]{x1D70F}=(\text{d}\overline{y}/\text{d}\unicode[STIX]{x1D70F})\unicode[STIX]{x1D709}\text{e}^{\overline{y}}\,\text{d}\unicode[STIX]{x1D707}_{o_{CJ}}(\unicode[STIX]{x1D709}^{\prime })/\text{d}\unicode[STIX]{x1D709}^{\prime }|_{\unicode[STIX]{x1D709}^{\prime }=\unicode[STIX]{x1D709}\,\text{e}^{\overline{y}}}, & & \displaystyle\end{eqnarray}$$
where  $\text{d}\overline{y}(\unicode[STIX]{x1D70F})/\text{d}\unicode[STIX]{x1D70F}$ is obtained from (7.1) using (6.5),
 $\text{d}x/\text{d}\unicode[STIX]{x1D70F}=1/(\unicode[STIX]{x1D706}b)$,
 $$\begin{eqnarray}\left(1-\frac{\text{e}^{-\overline{y}}}{\overline{x}}\right)\frac{\text{d}\overline{y}}{\text{d}\unicode[STIX]{x1D70F}}=-\frac{1}{\sqrt{b}}\frac{\sqrt{2}\,\overline{\text{m}}_{b}}{\unicode[STIX]{x1D706}\,\overline{x}}+\frac{1}{b}\frac{\text{e}^{-\overline{y}}}{\unicode[STIX]{x1D706}\,\overline{x}^{2}}\quad \Rightarrow \quad \overline{y}\neq -\ln \overline{x}:\quad \frac{\text{d}\overline{y}}{\text{d}\unicode[STIX]{x1D70F}}=O(1/\sqrt{b}).\end{eqnarray}$$
This shows that the unsteady term  $(\unicode[STIX]{x2202}\unicode[STIX]{x1D707}/\unicode[STIX]{x2202}\unicode[STIX]{x1D70F})$ is of order
 $1/\sqrt{b}$, larger than the curvature terms on the right-hand sides of (5.15) and (6.6). Then, the integral term in (7.4), evaluated from (7.5) by an integral by parts,
 $$\begin{eqnarray}\displaystyle \int _{-\text{e}^{-b\overline{\dot{\unicode[STIX]{x1D6FC}}}_{\unicode[STIX]{x1D70F}}}}^{0}(\unicode[STIX]{x2202}\overline{\unicode[STIX]{x1D707}}_{0}/\unicode[STIX]{x2202}\unicode[STIX]{x1D70F})\,\text{d}\unicode[STIX]{x1D709}=-(\unicode[STIX]{x1D706}-1)\frac{\text{d}\overline{y}}{\text{d}\unicode[STIX]{x1D70F}}\text{e}^{-\overline{y}}, & & \displaystyle\end{eqnarray}$$
is of order  $1/\sqrt{b}$, and cannot be neglected in (7.4). Near the curve
 $y=-\ln x$ the situation is even worth since the derivative
 $\text{d}\overline{y}/\text{d}\unicode[STIX]{x1D70F}$ diverges.
To summarize, despite the separation of time scales, the steady-state assumption is not self-consistent near to the critical radius in the limit (4.14) since the unsteady effects are stronger than the geometrical effects. Concerning the evolution of a stable detonation on the upper branch of the CJ peninsula, the dynamics (4.19) is slow,  $(1/{\mathcal{D}}_{_{CJ}})\,\text{d}{\mathcal{D}}_{_{CJ}}/\text{d}\unicode[STIX]{x1D70F}=O(\unicode[STIX]{x1D716}/b^{2})$ but the unsteady term in (6.16) is of the same order of magnitude as the curvature term,
 $\unicode[STIX]{x2202}\unicode[STIX]{x1D707}_{_{CJ}}/\unicode[STIX]{x2202}\unicode[STIX]{x1D70F}=O(1/b)$.
8 Unsteadiness of the inner structure for successful initiation
Consider trajectories for which  $x_{i_{CJ}}$ is larger than
 $x^{\ast }$,
 $x_{i}>x^{\ast }/(1+\sqrt{2/b}\,\text{m}_{bi})$, so that a successful initiation is expected. When approaching the CJ regime, we will now show that the solution of the hyperbolic problem (6.16)–(6.17) for the flow field
 $\unicode[STIX]{x1D707}(\unicode[STIX]{x1D709},\unicode[STIX]{x1D70F})$ leads to an integral equation for the propagation velocity
 $y(\unicode[STIX]{x1D70F})$.
8.1 Splitting
Introducing the decomposition
 $$\begin{eqnarray}\displaystyle \unicode[STIX]{x1D707}(\unicode[STIX]{x1D709},\unicode[STIX]{x1D70F})=\unicode[STIX]{x1D707}_{0}(\unicode[STIX]{x1D709},\unicode[STIX]{x1D70F})+\unicode[STIX]{x1D707}_{1}(\unicode[STIX]{x1D709},\unicode[STIX]{x1D70F}) & & \displaystyle\end{eqnarray}$$
into (6.16)–(6.17) yields the following nonlinear equation for  $\unicode[STIX]{x1D707}_{1}(\unicode[STIX]{x1D709},\unicode[STIX]{x1D70F})$, the field
 $\unicode[STIX]{x1D707}_{0}(\unicode[STIX]{x1D709},\unicode[STIX]{x1D70F})$ being assumed to be known,
 $$\begin{eqnarray}\displaystyle & \displaystyle \frac{\unicode[STIX]{x2202}\unicode[STIX]{x1D707}_{1}}{\unicode[STIX]{x2202}\unicode[STIX]{x1D70F}}+\frac{\unicode[STIX]{x2202}}{\unicode[STIX]{x2202}\unicode[STIX]{x1D709}}\left[\unicode[STIX]{x1D707}_{0}\unicode[STIX]{x1D707}_{1}+\frac{\unicode[STIX]{x1D707}_{1}^{2}}{2}\right]-\frac{y(\unicode[STIX]{x1D70F})}{b}\frac{\unicode[STIX]{x2202}\unicode[STIX]{x1D707}_{1}}{\unicode[STIX]{x2202}\unicode[STIX]{x1D709}}+\frac{1}{b}\frac{\unicode[STIX]{x1D707}_{1}}{\unicode[STIX]{x1D706}x}=H(\unicode[STIX]{x1D709},\unicode[STIX]{x1D70F})+W(\unicode[STIX]{x1D709},\unicode[STIX]{x1D70F}), & \displaystyle\end{eqnarray}$$
 $$\begin{eqnarray}\displaystyle & \displaystyle \text{where}\quad H(\unicode[STIX]{x1D709},\unicode[STIX]{x1D70F})\equiv -\frac{\unicode[STIX]{x2202}\unicode[STIX]{x1D707}_{0}(\unicode[STIX]{x1D709},\unicode[STIX]{x1D70F})}{\unicode[STIX]{x2202}\unicode[STIX]{x1D70F}}-\frac{1}{b}\frac{1}{\unicode[STIX]{x1D706}\,x(\unicode[STIX]{x1D70F})}-\frac{1}{b}\frac{\unicode[STIX]{x1D707}_{0}(\unicode[STIX]{x1D709},\unicode[STIX]{x1D70F})}{\unicode[STIX]{x1D706}\,x(\unicode[STIX]{x1D70F})}\quad & \displaystyle\end{eqnarray}$$
 $$\begin{eqnarray}\displaystyle & \displaystyle \text{and}\quad W(\unicode[STIX]{x1D709},\unicode[STIX]{x1D70F})\equiv \frac{1}{2}\left[\text{e}^{y(\unicode[STIX]{x1D70F})}\unicode[STIX]{x1D714}_{o_{CJ}}(\unicode[STIX]{x1D709}\,\text{e}^{y(\unicode[STIX]{x1D70F})})\right]-\left[\unicode[STIX]{x1D707}_{0}(\unicode[STIX]{x1D709},\unicode[STIX]{x1D70F})-\frac{y(\unicode[STIX]{x1D70F})}{b}\right]\frac{\unicode[STIX]{x2202}\unicode[STIX]{x1D707}_{0}(\unicode[STIX]{x1D709},\unicode[STIX]{x1D70F})}{\unicode[STIX]{x2202}\unicode[STIX]{x1D709}}, & \displaystyle\end{eqnarray}$$
with the boundary conditions (6.17) in the form
 $$\begin{eqnarray}\unicode[STIX]{x1D709}=0:\quad \unicode[STIX]{x1D707}_{1}=1+2\frac{y(\unicode[STIX]{x1D70F})}{b}-\unicode[STIX]{x1D707}_{0}(0,\unicode[STIX]{x1D70F}),\quad \unicode[STIX]{x1D709}=-\text{e}^{-y(\unicode[STIX]{x1D70F})}:\quad \unicode[STIX]{x1D707}_{1}=\unicode[STIX]{x1D707}_{b}(\unicode[STIX]{x1D70F})-\unicode[STIX]{x1D707}_{0}(-\text{e}^{-y(\unicode[STIX]{x1D70F})},\unicode[STIX]{x1D70F}).\end{eqnarray}$$
Our attention being focused on the decay of detonations whose radius is above criticality  $x(\unicode[STIX]{x1D70F})>x^{\ast }$, the choice of the first term
 $\unicode[STIX]{x1D707}_{0}$ in (8.1) is the steady solution of the upper branch of the CJ peninsula
 $\overline{\unicode[STIX]{x1D707}}_{_{CJ}}(\unicode[STIX]{x1D709},\overline{y}_{_{CJ}}(x))$, namely the solution (5.3) in which
 $\overline{y}_{_{CJ}}(x)$ is a function of the time through (6.5),
 $x(\unicode[STIX]{x1D70F})=x_{i}+\unicode[STIX]{x1D70F}/b\unicode[STIX]{x1D706}$,
 $$\begin{eqnarray}\unicode[STIX]{x1D707}_{0}(\unicode[STIX]{x1D709},\unicode[STIX]{x1D70F})=\overline{\unicode[STIX]{x1D707}}_{_{CJ}}(\unicode[STIX]{x1D709},\overline{y}_{_{CJ}}(x)),\quad \unicode[STIX]{x1D707}(\unicode[STIX]{x1D709},\unicode[STIX]{x1D70F})=\overline{\unicode[STIX]{x1D707}}_{_{CJ}}(\unicode[STIX]{x1D709},\overline{y}_{_{CJ}}(x))+\unicode[STIX]{x1D707}_{1}(\unicode[STIX]{x1D709},\unicode[STIX]{x1D70F}),\end{eqnarray}$$
where, according to (4.12)–(4.13), (5.13) and (6.5),
 $$\begin{eqnarray}\displaystyle \overline{\unicode[STIX]{x1D707}}_{_{CJ}}(\unicode[STIX]{x1D709},\overline{y}_{_{CJ}}(x))=\unicode[STIX]{x1D707}_{o_{CJ}}(\unicode[STIX]{x1D709}\text{e}^{\overline{y}_{_{CJ}}(x)})\left[1+O\left(\frac{1}{b}\right)\right],\quad \frac{\text{d}\overline{y}_{_{CJ}}}{\text{d}\unicode[STIX]{x1D70F}}=\frac{1}{b}\frac{\text{e}^{-\overline{y}_{_{CJ}}}}{\unicode[STIX]{x1D706}\,x^{2}}\frac{1}{1+\overline{y}_{_{CJ}}}, & & \displaystyle\end{eqnarray}$$
and  $\unicode[STIX]{x1D707}_{o_{CJ}}(\unicode[STIX]{x1D709})$ is the planar CJ solution (4.21). Sufficiently above the critical radius, the derivative of
 $\overline{\unicode[STIX]{x1D707}}_{_{CJ}}(\unicode[STIX]{x1D709},\overline{y}_{_{CJ}}(x))$ with respect to time is small, of order
 $1/b$,
 $$\begin{eqnarray}\displaystyle \frac{\unicode[STIX]{x2202}\,\overline{\unicode[STIX]{x1D707}}_{_{CJ}}(\unicode[STIX]{x1D709},\overline{y}_{_{CJ}}(x))}{\unicode[STIX]{x2202}\unicode[STIX]{x1D70F}}=\frac{\unicode[STIX]{x2202}\,\unicode[STIX]{x1D707}_{o_{CJ}}(\unicode[STIX]{x1D709}\text{e}^{\overline{y}_{_{CJ}}(x)})}{\unicode[STIX]{x2202}\unicode[STIX]{x1D70F}}\left[1+O(1/b)\right]\approx \frac{1}{\unicode[STIX]{x1D706}\,b}\frac{\text{d}\overline{y}_{_{CJ}}}{\text{d}x}\text{e}^{\overline{y}_{_{CJ}}}\unicode[STIX]{x1D709}\unicode[STIX]{x1D707}_{o_{CJ}}^{\prime }(\unicode[STIX]{x1D709}\,\text{e}^{\overline{y}_{_{CJ}}}),\quad & & \displaystyle\end{eqnarray}$$
where  $\unicode[STIX]{x1D707}_{o_{CJ}}^{\prime }(\unicode[STIX]{x1D709})$ denotes
 $\text{d}\unicode[STIX]{x1D707}_{o_{CJ}}(\unicode[STIX]{x1D709})/\text{d}\unicode[STIX]{x1D709}$. Expressing the last term in (8.4)
 $$\begin{eqnarray}\displaystyle -\left[\unicode[STIX]{x1D707}_{0}-\frac{y}{b}\right]\frac{\unicode[STIX]{x2202}\unicode[STIX]{x1D707}_{0}}{\unicode[STIX]{x2202}\unicode[STIX]{x1D709}}=-\left[\overline{\unicode[STIX]{x1D707}}_{_{CJ}}-\frac{\overline{y}_{_{CJ}}}{b}\right]\frac{\unicode[STIX]{x2202}\overline{\unicode[STIX]{x1D707}}_{_{CJ}}}{\unicode[STIX]{x2202}\unicode[STIX]{x1D709}}+\frac{(y-\overline{y}_{_{CJ}})}{b}\frac{\unicode[STIX]{x2202}\overline{\unicode[STIX]{x1D707}}_{_{CJ}}}{\unicode[STIX]{x2202}\unicode[STIX]{x1D709}} & & \displaystyle \nonumber\end{eqnarray}$$
by using (5.1) and (8.7), the two last terms on the right-hand side of (8.3) are eliminated and the terms  $H(\unicode[STIX]{x1D709},\unicode[STIX]{x1D70F})$ and
 $W(\unicode[STIX]{x1D709},\unicode[STIX]{x1D70F})$ are replaced by
 $\text{h}(\unicode[STIX]{x1D709},\unicode[STIX]{x1D70F})$ and
 $w(\unicode[STIX]{x1D709},\unicode[STIX]{x1D70F})$
 $$\begin{eqnarray}\displaystyle \hspace{-24.0pt} & \displaystyle h(\unicode[STIX]{x1D709},\unicode[STIX]{x1D70F})\equiv -b\frac{\unicode[STIX]{x2202}\,\unicode[STIX]{x1D707}_{o_{CJ}}(\unicode[STIX]{x1D709}\text{e}^{\overline{y}_{_{CJ}}(x)})}{\unicode[STIX]{x2202}\unicode[STIX]{x1D70F}}=-\frac{1}{\unicode[STIX]{x1D706}}\frac{\text{d}\overline{y}_{_{CJ}}}{\text{d}x}\text{e}^{\overline{y}_{_{CJ}}}\unicode[STIX]{x1D709}\unicode[STIX]{x1D707}_{o_{CJ}}^{\prime }(\unicode[STIX]{x1D709}\,\text{e}^{\overline{y}_{_{CJ}}})=-\frac{1}{\unicode[STIX]{x1D706}x^{2}}\frac{\unicode[STIX]{x1D709}\unicode[STIX]{x1D707}_{o_{CJ}}^{\prime }(\unicode[STIX]{x1D709}\,\text{e}^{\overline{y}_{_{CJ}}})}{1+\overline{y}_{_{CJ}}} & \displaystyle\end{eqnarray}$$
 $$\begin{eqnarray}\displaystyle \hspace{-24.0pt} & \displaystyle w(\unicode[STIX]{x1D709},y,\overline{y}_{_{CJ}})\equiv \frac{b}{2}\left[\text{e}^{y}\unicode[STIX]{x1D714}_{o_{CJ}}(\unicode[STIX]{x1D709}\,\text{e}^{y})-\text{e}^{\overline{y}_{_{CJ}}}\unicode[STIX]{x1D714}_{o_{CJ}}(\unicode[STIX]{x1D709}\,\text{e}^{\overline{y}_{_{CJ}}})\right]+\text{e}^{\overline{y}_{_{CJ}}}\unicode[STIX]{x1D707}_{o_{CJ}}^{\prime }(\unicode[STIX]{x1D709}\,\text{e}^{\overline{y}_{_{CJ}}})\,(y-\overline{y}_{_{CJ}}), & \displaystyle\end{eqnarray}$$
so that equations (8.2)–(8.4) take the form
 $$\begin{eqnarray}\frac{\unicode[STIX]{x2202}\unicode[STIX]{x1D707}_{1}}{\unicode[STIX]{x2202}\unicode[STIX]{x1D70F}}+\frac{\unicode[STIX]{x2202}}{\unicode[STIX]{x2202}\unicode[STIX]{x1D709}}\left[\overline{\unicode[STIX]{x1D707}}_{_{CJ}}(\unicode[STIX]{x1D709},\overline{y}_{_{CJ}})\unicode[STIX]{x1D707}_{1}+\frac{\unicode[STIX]{x1D707}_{1}^{2}}{2}\right]-\frac{y(\unicode[STIX]{x1D70F})}{b}\frac{\unicode[STIX]{x2202}\unicode[STIX]{x1D707}_{1}}{\unicode[STIX]{x2202}\unicode[STIX]{x1D709}}+\frac{1}{b}\frac{\unicode[STIX]{x1D707}_{1}}{\unicode[STIX]{x1D706}x}=\frac{1}{b}\left[h(\unicode[STIX]{x1D709},\unicode[STIX]{x1D70F})+w(\unicode[STIX]{x1D709},y,\overline{y}_{_{CJ}})\right]\end{eqnarray}$$
in which  $y$ and
 $\overline{y}_{_{CJ}}$ are functions of
 $\unicode[STIX]{x1D70F}$. Notice the divergence of
 $h(\unicode[STIX]{x1D709},\unicode[STIX]{x1D70F})$ at the turning point
 $\overline{y}_{_{CJ}}=-1$ coming from (8.7). The eigenfunction
 $y(\unicode[STIX]{x1D70F})$ is determined by the two boundary conditions (8.5), written when (4.2) is used
 $\overline{\unicode[STIX]{x1D707}}_{_{CJ}}(0,\overline{y}_{_{CJ}})=1+2\overline{y}_{_{CJ}}/b$
 $$\begin{eqnarray}\unicode[STIX]{x1D709}=0:\quad \unicode[STIX]{x1D707}_{1}=2[y(\unicode[STIX]{x1D70F})-\overline{y}_{_{CJ}}(x(\unicode[STIX]{x1D70F}))]/b;\quad \unicode[STIX]{x1D709}=-\text{e}^{-y(\unicode[STIX]{x1D70F})}:\quad \unicode[STIX]{x1D707}_{1}=\unicode[STIX]{x1D707}_{b}(\unicode[STIX]{x1D70F})-\unicode[STIX]{x1D707}_{o_{CJ}}(-\text{e}^{(\overline{y}_{_{CJ}}-y)}),\end{eqnarray}$$
where, using (8.7), the term of order  $1/b$ has been omitted on the right-hand side of the last equation in (8.12), the function
 $\unicode[STIX]{x1D707}_{b}(\unicode[STIX]{x1D70F})=O(1/\sqrt{b})$ being given in (6.11)–(6.12). The expression for the boundary condition at the exit of the reaction zone in (8.12) changes form depending on whether
 $y>\overline{y}_{_{CJ}}$ or
 $y<\overline{y}_{_{CJ}}$ since
 $\unicode[STIX]{x1D707}_{o_{CJ}}(\unicode[STIX]{x1D709})>0$ for
 $\unicode[STIX]{x1D709}>-1$ and
 $\unicode[STIX]{x1D707}_{o_{CJ}}(\unicode[STIX]{x1D709})=0$ for
 $\unicode[STIX]{x1D709}<-1$. Above the CJ peninsula,
 $y(\unicode[STIX]{x1D70F})>\overline{y}_{_{CJ}}(x(\unicode[STIX]{x1D70F}))$,
 $-\text{e}^{(\overline{y}_{_{CJ}}-y)}>-1$, according to (5.10), the function
 $\unicode[STIX]{x1D707}_{o_{CJ}}(-\text{e}^{(\overline{y}_{_{CJ}}-y)})$ is positive and of order unity when
 $h_{\unicode[STIX]{x1D707}}=O(1)$, so that the value of
 $|\unicode[STIX]{x1D707}_{1}|$ is of order unity at the exit of the reaction zone. Therefore, sufficiently far above the CJ peninsula,
 $y(\unicode[STIX]{x1D70F})>\overline{y}_{_{CJ}}(x(\unicode[STIX]{x1D70F}))$, the velocity field
 $\unicode[STIX]{x1D707}(\unicode[STIX]{x1D709},\unicode[STIX]{x1D70F})$ corresponds to the leading order of the velocity distribution of the quasi-steady solution (5.21)
 $\overline{\unicode[STIX]{x1D707}}(\unicode[STIX]{x1D709},\overline{y})$ in which
 $\overline{y}$ is replaced by
 $y(\unicode[STIX]{x1D70F})$,
 $\unicode[STIX]{x1D707}\approx \unicode[STIX]{x1D707}_{o_{CJ}}(\unicode[STIX]{x1D709}\text{e}^{y})$, see § A.2.
8.2 Integral equation
The decomposition (8.1) with (8.6) is suitable if the term  $\unicode[STIX]{x1D707}_{1}$ is smaller than
 $\unicode[STIX]{x1D707}_{o_{CJ}}$
 $$\begin{eqnarray}\displaystyle \unicode[STIX]{x1D707}_{1}(\unicode[STIX]{x1D709},\unicode[STIX]{x1D70F})<\unicode[STIX]{x1D707}_{o_{CJ}}(\unicode[STIX]{x1D709}\text{e}^{\overline{y}_{_{CJ}}}), & & \displaystyle\end{eqnarray}$$
which is expected to be the case in the vicinity of the CJ peninsula,  $0<y(\unicode[STIX]{x1D70F})-\overline{y}_{_{CJ}}\ll 1$, so that,
 $\unicode[STIX]{x1D707}_{o_{CJ}}(-\text{e}^{(\overline{y}_{_{CJ}}-y)})$ being small, the boundary conditions (8.12) are small,
 $$\begin{eqnarray}\displaystyle 0<(y(\unicode[STIX]{x1D70F})-\overline{y}_{_{CJ}})\ll 1\quad \Rightarrow \quad \unicode[STIX]{x1D707}_{o_{CJ}}(-\text{e}^{(\overline{y}_{_{CJ}}-y)})\ll 1. & & \displaystyle\end{eqnarray}$$
Neglecting the terms of order  $\unicode[STIX]{x1D707}_{1}/b$ on the left-hand side, equation (8.11) yields
 $$\begin{eqnarray}\displaystyle \frac{\unicode[STIX]{x2202}\unicode[STIX]{x1D707}_{1}}{\unicode[STIX]{x2202}\unicode[STIX]{x1D70F}}+\frac{\unicode[STIX]{x2202}}{\unicode[STIX]{x2202}\unicode[STIX]{x1D709}}\left[\unicode[STIX]{x1D707}_{o_{CJ}}(\unicode[STIX]{x1D709}\text{e}^{\overline{y}_{_{CJ}}})\unicode[STIX]{x1D707}_{1}+\frac{\unicode[STIX]{x1D707}_{1}^{2}}{2}\right]=\frac{1}{b}\left[h(\unicode[STIX]{x1D709})+w(\unicode[STIX]{x1D709},\unicode[STIX]{x1D70F})\right] & & \displaystyle\end{eqnarray}$$
the functions  $h(\unicode[STIX]{x1D709})$ and
 $w(\unicode[STIX]{x1D709},y(\unicode[STIX]{x1D70F}))$ being given respectively in (8.9) and (8.10). When the planar CJ detonation is stable or weakly unstable, the right-hand side of (8.15) is small. We will come back to this point later. Moreover, according to (8.7) and (8.9),
 $\text{d}\overline{y}_{_{CJ}}(x)/\text{d}\unicode[STIX]{x1D70F}=O(1/b)$,
 $\unicode[STIX]{x2202}\unicode[STIX]{x1D707}_{o_{CJ}}(\unicode[STIX]{x1D709}\text{e}^{\overline{y}_{_{CJ}}})/\unicode[STIX]{x2202}\unicode[STIX]{x1D70F}=O(1/b)$, the time variation of
 $\unicode[STIX]{x1D707}_{o_{CJ}}(\unicode[STIX]{x1D709}\text{e}^{\overline{y}_{_{CJ}}})$ is negligible on the left-hand side of (8.15). In the steady-state solution, the nonlinear term
 $\unicode[STIX]{x1D707}_{1}\unicode[STIX]{x2202}\unicode[STIX]{x1D707}_{1}/\unicode[STIX]{x2202}\unicode[STIX]{x1D709}$ is essential, especially at the end of the reaction zone near the CJ regime, even when
 $\unicode[STIX]{x1D707}_{1}$ is small. Then, according to (8.15), it is worth introducing the function
 $$\begin{eqnarray}\displaystyle Z(\unicode[STIX]{x1D709},\unicode[STIX]{x1D70F})\equiv b\left[\unicode[STIX]{x1D707}_{o_{CJ}}(\unicode[STIX]{x1D709}\text{e}^{\overline{y}_{_{CJ}}})\unicode[STIX]{x1D707}_{1}+\unicode[STIX]{x1D707}_{1}^{2}/2\right]. & & \displaystyle\end{eqnarray}$$
Assuming that the terms  $\unicode[STIX]{x1D707}_{1}\unicode[STIX]{x2202}\unicode[STIX]{x1D707}_{o_{CJ}}(\unicode[STIX]{x1D709}\text{e}^{\overline{y}_{_{CJ}}})/\unicode[STIX]{x2202}\unicode[STIX]{x1D70F}=O(\unicode[STIX]{x1D707}_{1}/b)$ and
 $\unicode[STIX]{x1D707}_{1}\unicode[STIX]{x2202}\unicode[STIX]{x1D707}_{1}/\unicode[STIX]{x2202}\unicode[STIX]{x1D70F}$ are negligible,
 $$\begin{eqnarray}\displaystyle \unicode[STIX]{x2202}Z(\unicode[STIX]{x1D709},\unicode[STIX]{x1D70F})/\unicode[STIX]{x2202}\unicode[STIX]{x1D70F}\approx b\unicode[STIX]{x1D707}_{o_{CJ}}(\unicode[STIX]{x1D709}\text{e}^{\overline{y}_{_{CJ}}})\unicode[STIX]{x2202}\unicode[STIX]{x1D707}_{1}/\unicode[STIX]{x2202}\unicode[STIX]{x1D70F}, & & \displaystyle\end{eqnarray}$$
equation (8.15) multiplied by  $b\unicode[STIX]{x1D707}_{o_{CJ}}(\unicode[STIX]{x1D709}\text{e}^{\overline{y}_{_{CJ}}})$ takes the form
 $$\begin{eqnarray}\displaystyle \left[\frac{\unicode[STIX]{x2202}}{\unicode[STIX]{x2202}\unicode[STIX]{x1D70F}}+\unicode[STIX]{x1D707}_{o_{CJ}}(\unicode[STIX]{x1D709}\text{e}^{\overline{y}_{_{CJ}}})\frac{\unicode[STIX]{x2202}}{\unicode[STIX]{x2202}\unicode[STIX]{x1D709}}\right]Z(\unicode[STIX]{x1D709},\unicode[STIX]{x1D70F})=\unicode[STIX]{x1D707}_{o_{CJ}}(\unicode[STIX]{x1D709}\text{e}^{\overline{y}_{_{CJ}}})[h(\unicode[STIX]{x1D709})+w(\unicode[STIX]{x1D709},y(\unicode[STIX]{x1D70F}))], & & \displaystyle\end{eqnarray}$$
with the boundary conditions (8.12)
 $$\begin{eqnarray}\displaystyle & \displaystyle \unicode[STIX]{x1D709}=0:\quad Z=Z_{N}(y(\unicode[STIX]{x1D70F}))=2(y(\unicode[STIX]{x1D70F})-\overline{y}_{_{CJ}}) & \displaystyle\end{eqnarray}$$
 $$\begin{eqnarray}\displaystyle & \displaystyle \unicode[STIX]{x1D709}=-\text{e}^{-y(\unicode[STIX]{x1D70F})}:\quad Z=Z_{b}(\unicode[STIX]{x1D70F})\equiv \frac{b}{2}[\unicode[STIX]{x1D707}_{b}^{2}(\unicode[STIX]{x1D70F})-\unicode[STIX]{x1D707}_{o_{CJ}}^{2}(-\text{e}^{-[y(\unicode[STIX]{x1D70F})-\overline{y}_{_{CJ}}]})], & \displaystyle\end{eqnarray}$$
where the term  $b\unicode[STIX]{x1D707}_{b}^{2}(\unicode[STIX]{x1D70F})$ in
 $Z_{b}(\unicode[STIX]{x1D70F})$ is defined in (6.12),
 $b\unicode[STIX]{x1D707}_{b}^{2}(\unicode[STIX]{x1D70F})=O(1)$. Notice that the second term in
 $Z_{b}(\unicode[STIX]{x1D70F})$ is also of order unity if
 $(\overline{y}_{_{CJ}}-y(\unicode[STIX]{x1D70F}))=O(1/\sqrt{b})$. Introducing the change of variable
 $\unicode[STIX]{x1D709}<0\rightarrow \unicode[STIX]{x1D701}<0$ and the time lag
 $|\unicode[STIX]{x1D701}_{b}(\unicode[STIX]{x1D70F})|$,
 $\unicode[STIX]{x1D701}_{b}(\unicode[STIX]{x1D70F})<0$
 $$\begin{eqnarray}\unicode[STIX]{x1D701}(\unicode[STIX]{x1D709})\equiv -\int _{\unicode[STIX]{x1D709}}^{0}\frac{\text{d}\unicode[STIX]{x1D709}^{\prime }}{\unicode[STIX]{x1D707}_{o_{CJ}}(\unicode[STIX]{x1D709}^{\prime }\text{e}^{\overline{y}_{_{CJ}}})}<0,\quad \unicode[STIX]{x1D701}_{b}(\unicode[STIX]{x1D70F})\equiv \unicode[STIX]{x1D701}(-\text{e}^{-y(\unicode[STIX]{x1D70F})})=-\int _{-\text{e}^{-y(\unicode[STIX]{x1D70F})}}^{0}\frac{\text{d}\unicode[STIX]{x1D709}^{\prime }}{\unicode[STIX]{x1D707}_{o_{CJ}}(\unicode[STIX]{x1D709}^{\prime }\text{e}^{\overline{y}_{_{CJ}}})}\end{eqnarray}$$
and neglecting the time variation of  $\unicode[STIX]{x1D707}_{o_{CJ}}(\unicode[STIX]{x1D709}\text{e}^{\overline{y}_{_{CJ}}})$, equations (8.18)–(8.20) yield
 $$\begin{eqnarray}\left[\frac{\unicode[STIX]{x2202}}{\unicode[STIX]{x2202}\unicode[STIX]{x1D70F}}+\frac{\unicode[STIX]{x2202}}{\unicode[STIX]{x2202}\unicode[STIX]{x1D701}}\right]\tilde{Z}(\unicode[STIX]{x1D701},\unicode[STIX]{x1D70F})=\tilde{F}(\unicode[STIX]{x1D701},\unicode[STIX]{x1D70F}),\quad \tilde{F}\equiv \unicode[STIX]{x1D707}_{o_{CJ}}(\unicode[STIX]{x1D709}(\unicode[STIX]{x1D701})\text{e}^{\overline{y}_{_{CJ}}})\left[h(\unicode[STIX]{x1D709}(\unicode[STIX]{x1D701}))+w(\unicode[STIX]{x1D709}(\unicode[STIX]{x1D701}),y(\unicode[STIX]{x1D70F}))\right]\quad\end{eqnarray}$$
 $$\begin{eqnarray}\unicode[STIX]{x1D701}=0:\quad \tilde{Z}=Z_{N}(y(\unicode[STIX]{x1D70F})),\quad \unicode[STIX]{x1D701}=\unicode[STIX]{x1D701}_{b}(\unicode[STIX]{x1D70F}):\quad \tilde{Z}=Z_{b}(\unicode[STIX]{x1D70F}),\end{eqnarray}$$
where  $\tilde{Z}(\unicode[STIX]{x1D701},\unicode[STIX]{x1D70F})\equiv Z(\unicode[STIX]{x1D709}(\unicode[STIX]{x1D701}),\unicode[STIX]{x1D70F})$ and
 $\unicode[STIX]{x1D709}(\unicode[STIX]{x1D701})$ is an inverse function of
 $\unicode[STIX]{x1D701}(\unicode[STIX]{x1D709})$, which is well defined since
 $\unicode[STIX]{x1D707}_{o_{CJ}}(\unicode[STIX]{x1D709}\text{e}^{\overline{y}_{_{CJ}}})$ is an increasing function of
 $\unicode[STIX]{x1D709}$. Using the development recalled in appendix B the solution of (8.22)–(8.23) takes the form
 $$\begin{eqnarray}\tilde{Z}(\unicode[STIX]{x1D701},\unicode[STIX]{x1D70F})=\int _{\unicode[STIX]{x1D701}_{b}(\unicode[STIX]{x1D70F}_{b})}^{\unicode[STIX]{x1D701}}\tilde{F}(\unicode[STIX]{x1D701}^{\prime },\unicode[STIX]{x1D70F}-\unicode[STIX]{x1D701}+\unicode[STIX]{x1D701}^{\prime })\,\text{d}\unicode[STIX]{x1D701}^{\prime }+Z_{b}(\unicode[STIX]{x1D70F}-\unicode[STIX]{x1D701}+\unicode[STIX]{x1D701}_{b}(\unicode[STIX]{x1D70F}_{b})),\end{eqnarray}$$
where  $\unicode[STIX]{x1D70F}_{b}$ is a function of
 $(\unicode[STIX]{x1D701}-\unicode[STIX]{x1D70F})$ which is obtained by the intersection of the characteristic curve going through
 $(\unicode[STIX]{x1D701},\unicode[STIX]{x1D70F})$ and the curve
 $\unicode[STIX]{x1D701}=\unicode[STIX]{x1D701}_{b}(\unicode[STIX]{x1D70F})$, so that
 $\unicode[STIX]{x1D70F}_{b}$ is the solution to the equation
 $$\begin{eqnarray}\unicode[STIX]{x1D701}_{b}(\unicode[STIX]{x1D70F}_{b})-\unicode[STIX]{x1D70F}_{b}=\unicode[STIX]{x1D701}-\unicode[STIX]{x1D70F},\end{eqnarray}$$
see figure 7 in appendix B. The boundary condition at the Neumann state  $\unicode[STIX]{x1D701}=0$ yields
 $$\begin{eqnarray}Z_{N}(y(\unicode[STIX]{x1D70F}))=\int _{\unicode[STIX]{x1D701}_{b}(\unicode[STIX]{x1D70F}_{b})}^{0}\tilde{F}(\unicode[STIX]{x1D701}^{\prime },\unicode[STIX]{x1D70F}+\unicode[STIX]{x1D701}^{\prime })\,\text{d}\unicode[STIX]{x1D701}^{\prime }+Z_{b}(\unicode[STIX]{x1D70F}+\unicode[STIX]{x1D701}_{b}(\unicode[STIX]{x1D70F}_{b})),\quad \text{where }\unicode[STIX]{x1D701}_{b}(\unicode[STIX]{x1D70F}_{b})\equiv \unicode[STIX]{x1D701}(-\text{e}^{-y(\unicode[STIX]{x1D70F}_{b})}).\end{eqnarray}$$
Using the change of variable (8.21)  $\text{d}\unicode[STIX]{x1D701}=\text{d}\unicode[STIX]{x1D709}/\unicode[STIX]{x1D707}_{o_{CJ}}(\unicode[STIX]{x1D709}\text{e}^{\overline{y}_{_{CJ}}})$, the solution of (8.26) takes the form of an integral equation for
 $y(\unicode[STIX]{x1D70F})$
 $$\begin{eqnarray}2(y(\unicode[STIX]{x1D70F})-\overline{y}_{_{CJ}})=\int _{-\text{e}^{-y(\unicode[STIX]{x1D70F}_{b})}}^{0}\left[h(\unicode[STIX]{x1D709})+w\!(\!\unicode[STIX]{x1D709},y(\unicode[STIX]{x1D70F}+\unicode[STIX]{x1D701}(\unicode[STIX]{x1D709}))\right]\text{d}\unicode[STIX]{x1D709}+Z_{b}(\unicode[STIX]{x1D70F}+\unicode[STIX]{x1D701}_{b}(\unicode[STIX]{x1D70F}_{b})),\end{eqnarray}$$
where, according to (8.25),
 $$\begin{eqnarray}\unicode[STIX]{x1D701}=0:\quad \unicode[STIX]{x1D70F}_{b}=\unicode[STIX]{x1D70F}+\unicode[STIX]{x1D701}_{b}(\unicode[STIX]{x1D70F}_{b})<\unicode[STIX]{x1D70F},\end{eqnarray}$$
see figure 7 in appendix B, so that  $\unicode[STIX]{x1D70F}_{b}$ and
 $\unicode[STIX]{x1D701}_{b}(\unicode[STIX]{x1D70F}_{b})$ are both function of the time
 $\unicode[STIX]{x1D70F}$.
The time delay at time  $\unicode[STIX]{x1D70F}$,
 $z_{b}(\unicode[STIX]{x1D70F})\equiv -\unicode[STIX]{x1D701}_{b}(\unicode[STIX]{x1D70F}_{b})>0$,
 $\unicode[STIX]{x1D70F}_{b}=\unicode[STIX]{x1D70F}-z_{b}<\unicode[STIX]{x1D70F}$, is the solution of a nonlinear equation obtained from (8.21)
 $$\begin{eqnarray}z_{b}(\unicode[STIX]{x1D70F})\equiv -\unicode[STIX]{x1D701}_{b}(\unicode[STIX]{x1D70F}_{b})=-\unicode[STIX]{x1D701}(-\text{e}^{-y(\unicode[STIX]{x1D70F}_{b})}),\quad z_{b}=\int _{-\text{e}^{-y(\unicode[STIX]{x1D70F}-z_{b})}}^{0}\frac{\text{d}\unicode[STIX]{x1D709}^{\prime }}{\unicode[STIX]{x1D707}_{o_{CJ}}(\unicode[STIX]{x1D709}^{\prime }\text{e}^{\overline{y}_{_{CJ}}})}>0\end{eqnarray}$$
 $$\begin{eqnarray}z_{b}=\text{e}^{-\overline{y}_{_{CJ}}}\int _{-\text{e}^{-\left[y(\unicode[STIX]{x1D70F}-z_{b})-\overline{y}_{_{CJ}}\right]}}^{0}\frac{\text{d}\unicode[STIX]{x1D709}}{\unicode[STIX]{x1D707}_{o_{CJ}}(\unicode[STIX]{x1D709})},\end{eqnarray}$$
showing that  $z_{b}(\unicode[STIX]{x1D70F})$ is a function of the time through the time-dependent velocity of the lead shock
 $y(\unicode[STIX]{x1D70F})$. Equation (8.30) is discussed in the next sections §§ 9.1–9.3. Introducing
 $\unicode[STIX]{x1D70F}_{b}=\unicode[STIX]{x1D70F}-z_{b}$ into (8.27) yields a nonlinear integral equation for the shock velocity
 $y(\unicode[STIX]{x1D70F})$ in the form
 $$\begin{eqnarray}\displaystyle 2(y(\unicode[STIX]{x1D70F})-\overline{y}_{_{CJ}})=\int _{-\text{e}^{-y(\unicode[STIX]{x1D70F}-z_{b}(\unicode[STIX]{x1D70F}))}}^{0}[h(\unicode[STIX]{x1D709})+w\!(\!\unicode[STIX]{x1D709},y(\unicode[STIX]{x1D70F}+\unicode[STIX]{x1D701}(\unicode[STIX]{x1D709}))]\text{d}\unicode[STIX]{x1D709}+Z_{b}(\unicode[STIX]{x1D70F}-z_{b}(\unicode[STIX]{x1D70F})), & & \displaystyle\end{eqnarray}$$
illustrating the complexity of the dynamics, since, according to (8.28), the time delay  $z_{b}(\unicode[STIX]{x1D70F})$ in the lower bound of the integral
 $-\text{e}^{-y(\unicode[STIX]{x1D70F}-z_{b}(\unicode[STIX]{x1D70F}))}$ and in the last term on the right-hand side depends on the solution
 $y(\unicode[STIX]{x1D70F})$. Equation (8.31) takes a more convenient when the terms
 $Z_{b}(\unicode[STIX]{x1D70F}-z_{b})$ and the integral involving
 $w(\unicode[STIX]{x1D709},y)$ is rewritten by using equation (4.21) for the planar CJ solution
 $\text{d}\unicode[STIX]{x1D707}_{o_{CJ}}^{2}(\unicode[STIX]{x1D709})/\text{d}\unicode[STIX]{x1D709}=\unicode[STIX]{x1D714}_{o_{CJ}}$,
 $\unicode[STIX]{x1D707}_{o_{CJ}}^{2}(0)=1$
 $$\begin{eqnarray}\displaystyle -\frac{b}{2}\int _{-\text{e}^{-y(\unicode[STIX]{x1D70F}-z_{b})}}^{0}\text{e}^{\overline{y}_{_{CJ}}}\unicode[STIX]{x1D714}_{o_{CJ}}(\text{e}^{\overline{y}_{_{CJ}}}\unicode[STIX]{x1D709})\,\text{d}\unicode[STIX]{x1D709}=-\frac{b}{2}+\frac{b}{2}\unicode[STIX]{x1D707}_{o_{CJ}}^{2}(-\text{e}^{-[y(\unicode[STIX]{x1D70F}-z_{b})-\overline{y}_{_{CJ}}]}), & & \displaystyle\end{eqnarray}$$
so that the last term on the right-hand side of (8.32) balances the second term of  $Z_{b}(\unicode[STIX]{x1D70F}-z_{b})$ in the expression (8.20) of
 $Z_{b}(\unicode[STIX]{x1D70F})$. Introducing three functionals of
 $y(\unicode[STIX]{x1D70F})$
 $$\begin{eqnarray}\displaystyle & \displaystyle G_{1}\equiv \int _{-\text{e}^{-y(\unicode[STIX]{x1D70F}-z_{b}(\unicode[STIX]{x1D70F}))}}^{0}[\text{e}^{y(\unicode[STIX]{x1D70F}+\unicode[STIX]{x1D701}(\unicode[STIX]{x1D709}))}\unicode[STIX]{x1D714}_{o_{CJ}}(\unicode[STIX]{x1D709}\,\text{e}^{y(\unicode[STIX]{x1D70F}+\unicode[STIX]{x1D701}(\unicode[STIX]{x1D709}))})]\,\text{d}\unicode[STIX]{x1D709}-1, & \displaystyle\end{eqnarray}$$
 $$\begin{eqnarray}\displaystyle & \displaystyle G_{2}\equiv \int _{-\text{e}^{-y(\unicode[STIX]{x1D70F}-z_{b}(\unicode[STIX]{x1D70F}))}}^{0}\text{e}^{\overline{y}_{_{CJ}}}\unicode[STIX]{x1D707}_{o_{CJ}}^{\prime }(\unicode[STIX]{x1D709}\,\text{e}^{\overline{y}_{_{CJ}}})\,[y(\unicode[STIX]{x1D70F}+\unicode[STIX]{x1D701}(\unicode[STIX]{x1D709}))-\overline{y}_{_{CJ}}]\,\text{d}\unicode[STIX]{x1D709}, & \displaystyle\end{eqnarray}$$
 $$\begin{eqnarray}\displaystyle & \displaystyle I_{h}\equiv \int _{-\text{e}^{-y(\unicode[STIX]{x1D70F}-z_{b}(\unicode[STIX]{x1D70F}))}}^{0}h(\unicode[STIX]{x1D709})\,\text{d}\unicode[STIX]{x1D709},\quad \text{where }h(\unicode[STIX]{x1D709})\text{ is defined in (8.9)}, & \displaystyle\end{eqnarray}$$
the integral equation (8.31) for  $y(\unicode[STIX]{x1D70F})$ takes the form
 $$\begin{eqnarray}\displaystyle 2(y(\unicode[STIX]{x1D70F})-\overline{y}_{_{CJ}})=\frac{b}{2}G_{1}+G_{2}+I_{h}+\text{m}_{b}^{2}(\unicode[STIX]{x1D70F}-z_{b}), & & \displaystyle\end{eqnarray}$$
where  $z_{b}(\unicode[STIX]{x1D70F})=O(1)$ is a functional of
 $y(\unicode[STIX]{x1D70F})$ given in (8.30) and the function
 $\text{m}_{b}(\unicode[STIX]{x1D70F})=O(1)$ is defined in (6.14)–(6.15),
 $$\begin{eqnarray}\displaystyle \unicode[STIX]{x1D70F}<\unicode[STIX]{x1D70F}_{i_{CJ}}:\quad \text{m}_{b}(\unicode[STIX]{x1D70F})/\text{m}_{bi}=1-\unicode[STIX]{x1D70F}/\unicode[STIX]{x1D70F}_{i_{CJ}},\quad \unicode[STIX]{x1D70F}\geqslant \unicode[STIX]{x1D70F}_{i_{CJ}}:\quad \text{m}_{b}(\unicode[STIX]{x1D70F})=0. & & \displaystyle\end{eqnarray}$$
According to (6.11), the time  $\unicode[STIX]{x1D70F}_{i_{CJ}}=\sqrt{2b}\,\unicode[STIX]{x1D706}\,x_{i}\,\text{m}_{bi}$ at which the CJ condition is reached can be expressed in terms of the initial condition (
 $\unicode[STIX]{x1D70F}=0$:
 $x=x_{i}$,
 $\text{m}_{b}=\text{m}_{bi}$), so that
 $\text{d}\text{m}_{b}/\text{d}\unicode[STIX]{x1D70F}=-1/(\sqrt{2b}\,\unicode[STIX]{x1D706}\,x_{i})$ is small, of order
 $1/\sqrt{b}$. The time delay
 $z_{b}$ has to be kept in the forcing term
 $\text{m}_{b}^{2}(\unicode[STIX]{x1D70F}-z_{b})$ since
 $z_{b}(\unicode[STIX]{x1D70F})$ becomes large near the CJ regime, yielding a correction which is not so small, typically of order
 $\ln b/\sqrt{b}$, see (C 30) in appendix. The CJ velocity
 $\overline{y}_{_{CJ}}(x)$ of the quasi-steady spherical detonation in (8.33)–(8.36) is a function of the radius. The trajectories in the phase space
 $y$–
 $x$ are obtained from the solution of (8.36)–(8.37) by using (6.5),
 $x=x_{i}+\unicode[STIX]{x1D70F}/(b\unicode[STIX]{x1D706})$.
9 Discussion of the results
9.1 Physical insights
The nonlinear coupling of the physical mechanisms controlling the dynamics (8.36) can be summarized as follows. According to the Arrhenius law and the two fast downstream-propagating modes, the thickness of the inner structure  $|\unicode[STIX]{x1D709}_{b}(\unicode[STIX]{x1D70F})|=\text{e}^{-y}$ varies quasi-instantaneously with the shock velocity
 $y$,
 $\unicode[STIX]{x1D709}_{b}=-\text{e}^{-y}<0$ denoting the position (relative to the shock) of the downstream boundary on the burnt-gas side. The time
 $\unicode[STIX]{x1D70F}_{b}=\unicode[STIX]{x1D70F}-z_{b}$ at which the upstream-running mode leaves the downstream boundary to reach the lead shock at time
 $\unicode[STIX]{x1D70F}$ depends on the transit time
 $z_{b}(\unicode[STIX]{x1D70F})$ of the upstream-running mode to travel across the detonation thickness from
 $\unicode[STIX]{x1D709}=\unicode[STIX]{x1D709}_{b}(\unicode[STIX]{x1D70F}_{b})<0$ to
 $\unicode[STIX]{x1D709}=0$, explaining that the triggering term
 $\text{m}_{b}^{2}(\unicode[STIX]{x1D70F}-z_{b})$ in (8.36) is shifted by the time delay
 $z_{b}$. The complexity of the dynamics comes from the variation of the time delay
 $z_{b}(\unicode[STIX]{x1D70F})$ which depends on the position of the downstream boundary at an earlier time shifted itself by
 $z_{b}(\unicode[STIX]{x1D70F})$,
 $\unicode[STIX]{x1D709}_{b}(\unicode[STIX]{x1D70F}-z_{b})=-\text{e}^{-y(\unicode[STIX]{x1D70F}-z_{b})}$. Therefore, under the approximation of a frozen field
 $\unicode[STIX]{x1D707}_{o_{CJ}}(\unicode[STIX]{x1D709}\text{e}^{\overline{y}_{_{CJ}}})$,
 $z_{b}$ is the solution of the nonlinear equation (8.30). Notice right now that equation (8.30) is meaningful if and only if
 $y(\unicode[STIX]{x1D70F}-z_{b})>\overline{y}_{_{CJ}}$ since
 $\unicode[STIX]{x1D707}_{o_{CJ}}(\unicode[STIX]{x1D709})$ is zero for
 $\unicode[STIX]{x1D709}\leqslant -1$. We will come back to this point in § 9.3 after discussing another important point concerning causality.
The integral equation (8.36) for  $y(\unicode[STIX]{x1D70F})$ involves the past ranging from
 $\unicode[STIX]{x1D70F}_{b}=\unicode[STIX]{x1D70F}-z_{b}(\unicode[STIX]{x1D70F})$ to
 $\unicode[STIX]{x1D70F}$ in order to integrate the cumulative effects on the lead shock velocity produced by the modification of the reaction rate at different distances from the shock
 $|\unicode[STIX]{x1D709}|$. These modifications at
 $\unicode[STIX]{x1D709}$, that are generated quasi-instantaneously at time
 $\unicode[STIX]{x1D70F}$ by the variation of the shock velocity
 $y(\unicode[STIX]{x1D70F})$, produce a retarded effect on the shock velocity at a time delayed by the transit time (8.21)
 $-\unicode[STIX]{x1D701}(\unicode[STIX]{x1D709})>0$ of the upstream-running mode travelling from
 $\unicode[STIX]{x1D709}$ to 0. According to (8.18), the transit time is computed under the approximation of a frozen flow
 $\unicode[STIX]{x1D707}_{o_{CJ}}(\unicode[STIX]{x1D709}\text{e}^{\overline{y}_{_{CJ}}})$. The memory effects in the integral equation (8.36) are represented by the term
 $(b/2)G_{1}+G_{2}$ which governs the stability of the planar detonation recalled in § 9.4. The dependence on the past is not only through the integration in the expressions (8.33) and (8.34) of
 $G_{1}$ and
 $G_{2}$ but also through the delay
 $z_{b}(\unicode[STIX]{x1D70F})$ in the lower bound of the integrals. The complexity of the dynamics is illustrated by (8.30), showing how
 $z_{b}(\unicode[STIX]{x1D70F})$ is depending on the solution
 $y(\unicode[STIX]{x1D70F})$.
9.2 Causality
When the detonation velocity  $y(\unicode[STIX]{x1D70F})$ evolves under a time-dependent flow of burnt gas at
 $\unicode[STIX]{x1D709}=\unicode[STIX]{x1D709}_{b}(\unicode[STIX]{x1D70F})$, which is represented by the forcing term
 $\text{m}_{b}^{2}(\unicode[STIX]{x1D70F}-z_{b}(\unicode[STIX]{x1D70F}))$ on the right-hand side of (8.36), the time-dependent delay
 $z_{b}(\unicode[STIX]{x1D70F})$ should satisfy a causal link between
 $\text{m}_{b}^{2}(\unicode[STIX]{x1D70F}-z_{b}(\unicode[STIX]{x1D70F}))$ (the cause) and
 $y(\unicode[STIX]{x1D70F})$ (the consequence). Consider a prescribed unsteady forcing term, namely, a known function
 $\text{m}_{b}(\unicode[STIX]{x1D70F})$ (
 $\text{d}\text{m}_{b}/\text{d}\unicode[STIX]{x1D70F}\neq 0$). The retarded responses
 $y(\unicode[STIX]{x1D70F}_{1})$ and
 $y(\unicode[STIX]{x1D70F}_{2})$ at two consecutive times (
 $\unicode[STIX]{x1D70F}_{1}<\unicode[STIX]{x1D70F}_{2}$) correspond to the forcing term at time
 $\unicode[STIX]{x1D70F}_{b}(\unicode[STIX]{x1D70F}_{1})=\unicode[STIX]{x1D70F}_{1}-z_{b}(\unicode[STIX]{x1D70F}_{1})$ and
 $\unicode[STIX]{x1D70F}_{b}(\unicode[STIX]{x1D70F}_{2})=\unicode[STIX]{x1D70F}_{1}-z_{b}(\unicode[STIX]{x1D70F}_{2})$ respectively. Causality then requires that the inequality
 $\unicode[STIX]{x1D70F}_{b}(\unicode[STIX]{x1D70F}_{1})<\unicode[STIX]{x1D70F}_{b}(\unicode[STIX]{x1D70F}_{2})$ should hold if
 $\unicode[STIX]{x1D70F}_{1}<\unicode[STIX]{x1D70F}_{2}$. Otherwise the latest response
 $y(\unicode[STIX]{x1D70F}_{2})$ would be produced by the earliest forcing
 $\text{m}_{b}^{2}(\unicode[STIX]{x1D70F}_{b}(\unicode[STIX]{x1D70F}_{2}))$. This means that the function
 $\unicode[STIX]{x1D70F}_{b}(\unicode[STIX]{x1D70F})\equiv \unicode[STIX]{x1D70F}-z_{b}(\unicode[STIX]{x1D70F})$ should be an increasing function of time
 $\text{d}\unicode[STIX]{x1D70F}_{b}/\text{d}\unicode[STIX]{x1D70F}>0$ so that the derivative of the delay should be bounded,
 $\text{d}z_{b}/\text{d}\unicode[STIX]{x1D70F}\leqslant 1$. Since, according to (8.30),
 $$\begin{eqnarray}\displaystyle & \displaystyle \frac{\text{d}z_{b}}{\text{d}\unicode[STIX]{x1D70F}}={\mathcal{A}}(\unicode[STIX]{x1D70F}-z_{b})\left[1-\frac{\text{d}z_{b}}{\text{d}\unicode[STIX]{x1D70F}}\right]\quad \Rightarrow \quad \frac{\text{d}z_{b}}{\text{d}\unicode[STIX]{x1D70F}}=\frac{1}{[1+1/{\mathcal{A}}(\unicode[STIX]{x1D70F}-z_{b})]}, & \displaystyle\end{eqnarray}$$
 $$\begin{eqnarray}\displaystyle & \displaystyle \text{where}\quad {\mathcal{A}}(\unicode[STIX]{x1D70F})\equiv -\frac{\text{d}y(\unicode[STIX]{x1D70F})}{\text{d}\unicode[STIX]{x1D70F}}\frac{\text{e}^{-[y(\unicode[STIX]{x1D70F})-\overline{y}_{_{CJ}}]}}{\unicode[STIX]{x1D707}_{o_{CJ}}(-\text{e}^{-[y(\unicode[STIX]{x1D70F})-\overline{y}_{_{CJ}}]})}, & \displaystyle\end{eqnarray}$$
the causal relation  $\text{d}z_{b}(\unicode[STIX]{x1D70F})/\text{d}\unicode[STIX]{x1D70F}\leqslant 1$ is satisfied if
 ${\mathcal{A}}\geqslant -1$
 $$\begin{eqnarray}\displaystyle \text{d}y/\text{d}\unicode[STIX]{x1D70F}\leqslant \text{e}^{[y(\unicode[STIX]{x1D70F})-\overline{y}_{_{CJ}}]}\unicode[STIX]{x1D707}_{o_{CJ}}(-\text{e}^{-[y(\unicode[STIX]{x1D70F})-\overline{y}_{_{CJ}}]}). & & \displaystyle\end{eqnarray}$$
This is always the case if the shock velocity decreases monotonically $y(\unicode[STIX]{x1D70F})>\overline{y}_{_{CJ}}$,
 $\text{d}y(\unicode[STIX]{x1D70F})/\text{d}\unicode[STIX]{x1D70F}<0$. In this case, the nonlinear equation (8.30) has a single solution for
 $z_{b}(\unicode[STIX]{x1D70F})$. For a reactive blast wave impinging on the CJ peninsula with a moderately small deceleration of the same order of magnitude as in the quasi-steady decay (7.6)
 $|\text{d}y/\text{d}\unicode[STIX]{x1D70F}|=O(1/\sqrt{b})$, the delay
 $z_{b}$ becomes moderately large when the CJ velocity is reached,
 $z_{b}=O(\sqrt{b})$ see appendix D. Moreover, the causal relation (9.3) is verified when the shock velocity increases
 ${\dot{y}}_{\unicode[STIX]{x1D70F}}>0$ if and only if the acceleration is not too large.
9.3 An intriguing phenomenon: the jump of time delay
Sketch of the geometrical construction of the time delay  $z_{b}(\unicode[STIX]{x1D70F})$ for an oscillatory shock velocity
 $y(\unicode[STIX]{x1D70F})=y_{m}\cos (2\unicode[STIX]{x03C0}\,\unicode[STIX]{x1D70F}/\unicode[STIX]{x1D70F}_{p})$ around the planar CJ regime
 $\overline{y}_{_{CJ}}=0$. The function
 $y(\unicode[STIX]{x1D70F}-z_{b})$ is plotted on top of the figure. The delay
 $z_{b}$ at time
 $\unicode[STIX]{x1D70F}$ is defined as the smallest roots of (8.30). For a given time
 $\unicode[STIX]{x1D70F}$ the roots are represented on a plane (
 $z_{b},z$) by the intersection of the straight line
 $z=z_{b}$ and the array of periodic curves
 $z=f(\unicode[STIX]{x1D70F}-z_{b})$ corresponding to the periodic function
 $f(\unicode[STIX]{x1D70F}-z_{b})\equiv \int _{-\text{e}^{-y(\unicode[STIX]{x1D70F}-z_{b})}}^{0}\text{d}\unicode[STIX]{x1D709}/\unicode[STIX]{x1D707}_{o_{CJ}}(\unicode[STIX]{x1D709})$ defined in the
 $z_{b}$-bands corresponding to
 $y(\unicode[STIX]{x1D70F}-z_{b})>0$. The graph at the bottom of the figure is plotted with
 $\unicode[STIX]{x1D70F}-z_{b}$ on the horizontal axis and
 $z$ on the vertical axis. The forbidden bands are the shaded parts of the horizontal axis. The picture is drawn for the model (9.4)
 $f(\unicode[STIX]{x1D70F}-z_{b})=-\ln [y_{m}\cos (2\unicode[STIX]{x03C0}\,(\unicode[STIX]{x1D70F}-z_{b})/\unicode[STIX]{x1D70F}_{p})]$. The red straight line corresponds to a critical time
 $\unicode[STIX]{x1D70F}$ at which the smallest root, namely the time delay
 $z_{b}(\unicode[STIX]{x1D70F})$, jumps from
 $z_{b}^{-}$ to
 $z_{b}^{+}$,
 $z_{b}^{-}>z_{b}^{+}$. This straight line
 $z=z_{b}$ in red intersects the horizontal axis (
 $z=0$) at the point
 $\unicode[STIX]{x1D70F}-z_{b}=\unicode[STIX]{x1D70F}$ (
 $z_{b}=z=0$) which is chosen to be the position of the vertical
 $z$-axis (and
 $y$-axis for the figure on top). The values
 $z_{b}^{-}$ and
 $z_{b}^{+}$ are associated with the intersection points represented by the red dots on the array of curves at the bottom of the figure. The corresponding values of the shock velocity
 $y(\unicode[STIX]{x1D70F}-z_{b}^{-})$,
 $y(\unicode[STIX]{x1D70F}-z_{b}^{+})$ and
 $y(\unicode[STIX]{x1D70F})$ are represented by the red dots on the harmonic function on top of the figure. According to the picture,
 $y(\unicode[STIX]{x1D70F})<0<y(\unicode[STIX]{x1D70F}-z_{b}^{-})<y(\unicode[STIX]{x1D70F}-z_{b}^{+})$, the detonation thickness, namely the distance between the lead shock and the end of the reaction zone,
 $l(\unicode[STIX]{x1D70F})\equiv \text{e}^{-y(\unicode[STIX]{x1D70F})}\approx 1-y(\unicode[STIX]{x1D70F})>0$ (approximated for
 $y_{m}<1$), taken at the retarded time at which the upstream-running mode leaves the burnt gas to reach the lead shock at the time
 $\unicode[STIX]{x1D70F}$, is larger just before the jump than after, the detonation thickness at the transition time
 $\unicode[STIX]{x1D70F}$ being the largest one,
 $l(\unicode[STIX]{x1D70F}-z_{b}^{+})<l(\unicode[STIX]{x1D70F}-z_{b}^{-})<l(\unicode[STIX]{x1D70F})$. The time delay before and after the transition corresponds to the dots in green and blue respectively.

Numerical solution of (8.30) for  $\overline{y}_{_{CJ}}=0$ and
 $y(\unicode[STIX]{x1D70F})=0.2+0.1\cos 3\,\unicode[STIX]{x1D70F}$ plotted on top and for the reaction rate
 $\unicode[STIX]{x1D714}_{o_{CJ}}(\unicode[STIX]{x1D709})$ used in Clavin & Denet (Reference Clavin and Denet2018). The function
 $-z_{b}(\unicode[STIX]{x1D70F})$,
 $z_{b}(\unicode[STIX]{x1D70F})>0$ being the smallest root of (8.30), is plotted in red. The time on the horizontal axis has been rescaled. The jump of
 $z_{b}$ is slightly smaller than unity and the maximum of
 $z_{b}(\unicode[STIX]{x1D70F})$ is approximately 1.8.

In unsteady regimes, the solution of (8.36) can describe a velocity of the lead shock  $y(\unicode[STIX]{x1D70F})$ decreasing below the CJ velocity (intermittently and for a short period of time). Oscillation of the detonation velocity at the CJ regime or when approaching the CJ regime requires particular attention. The understanding of unstable detonations is somewhat difficult since
 $y(\unicode[STIX]{x1D70F})$ oscillates around
 $\overline{y}_{_{CJ}}$ while the integral in (8.30) diverges for
 $y(\unicode[STIX]{x1D70F}-z_{b})<\overline{y}_{_{CJ}}$. For an oscillatory shock velocity around its CJ value, the nonlinear equation (8.30) is meaningful at any time
 $\unicode[STIX]{x1D70F}$, indeed, with a discrete set of roots
 $z_{b}(\unicode[STIX]{x1D70F})$, none of which involve a shock velocity corresponding to a forbidden band
 $y(\unicode[STIX]{x1D70F}-z_{b})<\overline{y}_{_{CJ}}$. Keeping in mind the response of the shock velocity to variations in the burnt gas, causality implies that the time delay
 $z_{b}(\unicode[STIX]{x1D70F})$ is properly defined as the smallest root. The latter is a continuous function of time except for a periodic discontinuity of the first order (jump). More precisely, the delay
 $z_{b}(\unicode[STIX]{x1D70F})$ increases when
 $y(\unicode[STIX]{x1D70F}-z_{b})$ approaches 0 from above and decreases suddenly by a jump to a smaller value corresponding to a larger shock velocity
 $y(\unicode[STIX]{x1D70F}-z_{b})$. The problem is more easily understood by the geometrical construction in figure 2. Consider a simplified example
 $\unicode[STIX]{x1D707}_{o_{CJ}}(\unicode[STIX]{x1D709})=\unicode[STIX]{x1D709}+1$ of the model (5.9)–(5.10) and the case
 $\overline{y}_{_{CJ}}=0$ (planar geometry) for simplicity, equation (8.30) then takes the form written for
 $|y|\ll 1$
 $$\begin{eqnarray}\displaystyle y(\unicode[STIX]{x1D70F}-z_{b})>0:\quad z_{b}=-\ln y(\unicode[STIX]{x1D70F}-z_{b}),\quad y(\unicode[STIX]{x1D70F}-z_{b})<0:\quad \text{no solution.} & & \displaystyle\end{eqnarray}$$
Consider, for example, a harmonic pulsation of period  $\unicode[STIX]{x1D70F}_{p}$,
 $y(\unicode[STIX]{x1D70F})=y_{m}\cos (2\unicode[STIX]{x03C0}\,\unicode[STIX]{x1D70F}/\unicode[STIX]{x1D70F}_{p})$ with
 $y_{m}<1$. At any time
 $\unicode[STIX]{x1D70F}$, equation (8.30)
 $z_{b}=-\ln [y_{m}\cos (2\unicode[STIX]{x03C0}\,(\unicode[STIX]{x1D70F}-z_{b})/\unicode[STIX]{x1D70F}_{p})]$ has a countable (infinite) set of roots
 $z_{b}(\unicode[STIX]{x1D70F})$ which is bounded from below, none of the roots being smaller than
 $-\ln y_{m}>0$. As shown in figure 2, the smallest root, namely the time delay, jumps at a critical time denoted
 $\unicode[STIX]{x1D70F}$ in the figure from a value
 $z_{b}^{-}$ well above the absolute minimum
 $-\ln y_{m}$ to
 $z_{b}^{+}$ slightly larger than
 $-\ln y_{m}$,
 $z_{b}^{-}>z_{b}^{+}$. In other words, a new lower bound
 $z_{b}^{+}$ smaller than
 $z_{b}^{-}$ appears suddenly at
 $\unicode[STIX]{x1D70F}$ when the time increases. For times before
 $\unicode[STIX]{x1D70F}$, the smallest root (in green in figure 2) increases continuously up to
 $z_{b}^{-}$ while, for times after
 $\unicode[STIX]{x1D70F}$, the new smallest root
 $z_{b}^{+}$ begins to decrease for a while, crosses the minimum
 $-\ln y_{m}$ and then increases continuously again (in blue), reaching
 $z_{b}^{-}$ followed by the same jump as before, and so on. The same scenario is observed for an oscillation of
 $y(\unicode[STIX]{x1D70F})$ around a positive mean value
 $\overline{y}>0$ see the numerical solution of (8.30) in figure 3. The function
 $z_{b}(\unicode[STIX]{x1D70F})$ corresponding to the case investigated in figure 2 has a shape similar to the red curve in figure 3. Causality is satisfied when the delay
 $z_{b}$ increases during the deceleration range
 $\text{d}y/\text{d}\unicode[STIX]{x1D70F}<0$ since the calculation of
 $\text{d}z_{b}/\text{d}\unicode[STIX]{x1D70F}$ leads to (9.1) with
 ${\mathcal{A}}=-y^{-1}\text{d}y/\text{d}\unicode[STIX]{x1D70F}>0$. During the short laps of time (after the jump) during which
 $z_{b}$ is decreasing smoothly after the jump down to the minimum
 $-\ln y_{m}>0$, the causality condition
 $\text{d}z_{b}/\text{d}\unicode[STIX]{x1D70F}<1$ is also verified since the acceleration
 $\text{d}y/\text{d}\unicode[STIX]{x1D70F}>0$ is small. It is worth noticing that the jumps of
 $z_{b}(\unicode[STIX]{x1D70F})$ not only avoid the forbidden bands when they exist (
 $y(\unicode[STIX]{x1D70F}-z_{b})<0$) but also eliminate the eventual non-causal variation of
 $z_{b}(\unicode[STIX]{x1D70F})$ which would result from a sufficiently large acceleration of the lead shock
 $\text{d}y(\unicode[STIX]{x1D70F}-z_{b})/\text{d}\unicode[STIX]{x1D70F}>0$. The jump of the time delay
 $z_{b}(\unicode[STIX]{x1D70F})$ corresponds to two different values of the detonation thicknesses at two different moments in the past
 $\text{e}^{-y(\unicode[STIX]{x1D70F}-z_{b}^{+})}$ and
 $\text{e}^{-y(\unicode[STIX]{x1D70F}-z_{b}^{-})}$ while the detonation thickness
 $\text{e}^{-y(\unicode[STIX]{x1D70F})}$ is a continuous function of time if the propagation velocity
 $y(\unicode[STIX]{x1D70F})$ is continuous. Moreover the time delay
 $z_{b}$ increases but its jump becomes negligible when the amplitude of oscillation of
 $y(\unicode[STIX]{x1D70F})$ becomes small
 $-\ln y_{m}\gg \unicode[STIX]{x1D70F}_{p}$, since, according to the geometrical construction, the order of magnitude of the time delay
 $z_{b}$ and of its jump
 $\unicode[STIX]{x0394}z_{b}$ is
 $-\ln y_{m}$ and
 $\unicode[STIX]{x1D70F}_{p}$ respectively,
 $z_{b}=O(-\ln y_{m})$,
 $\unicode[STIX]{x0394}z_{b}=O(\unicode[STIX]{x1D70F}_{p})$,
 $\unicode[STIX]{x0394}z_{b}\approx 3\unicode[STIX]{x1D70F}_{p}/4$ in figure 2,
 $\lim _{y_{m}\rightarrow 0}\unicode[STIX]{x0394}z_{p}/z_{b}=0$.
9.4 Intrinsic dynamics of the inner structure and detonation decay
The quasi-steady-state approximation of (8.36) is obtained when the time delays  $\unicode[STIX]{x1D701}(\unicode[STIX]{x1D709})$ and
 $z_{b}$ of the upstream-running mode are neglected,
 $G_{1}=0$ and
 $G_{2}=y-\overline{y}_{_{CJ}}$. Neglecting also the unsteady term
 $I_{h}$ coming from (7.7), the quasi-steady solution
 $y_{qs}(\unicode[STIX]{x1D70F})-\overline{y}_{_{CJ}}\approx \overline{m}_{b}^{2}(\unicode[STIX]{x1D70F})$, yields a trajectory tangent to the upper branch of the peninsula of the steady spherical solution
 $\overline{y}_{_{CJ}}(x)$ described in § 7.2.
The time delays  $\unicode[STIX]{x1D701}(\unicode[STIX]{x1D709})$ in
 $G_{1}$ and
 $G_{2}$ control the intrinsic dynamics of the inner structure of the detonation wave. When
 $\overline{y}_{_{CJ}}(x)$ in
 $(b/2)G_{1}+G_{2}$ is replaced by the unperturbed planar solution
 $\overline{y}_{o}$ corresponding to a constant flow of burnt gas
 $\text{m}_{b}=\text{const}.>0$ and when the unsteady curvature term
 $I_{h}$ is neglected, equation (8.36) describes the dynamics of a slightly overdriven detonation in a planar geometry. Following the same method as in the text, the corresponding equation is obtained whatever
 $b$ from the constitutive equations in § 2 (written in a planar geometry) in the limit of small heat release (3.1). The total time delay
 $|z_{b}|$ (from the exit of the inner structure to the lead shock) is defined in a way similar to (8.30)
 $$\begin{eqnarray}\displaystyle z_{b}=\text{e}^{-\overline{y}_{o}}\int _{-\text{e}^{-\left[y(\unicode[STIX]{x1D70F}-z_{b})-\overline{y}_{o}\right]}}^{0}\frac{\text{d}\unicode[STIX]{x1D709}}{\overline{\unicode[STIX]{x1D707}}_{o}(\unicode[STIX]{x1D709})}, & & \displaystyle\end{eqnarray}$$
where  $\overline{\unicode[STIX]{x1D707}}_{o}(\unicode[STIX]{x1D709})$ is the flow (C 5) inside the inner structure of an overdriven detonation satisfying the condition in the burnt gas
 $\unicode[STIX]{x1D709}\leqslant -\text{e}^{-\overline{y}_{o}}:\overline{\unicode[STIX]{x1D707}}_{o}=\sqrt{2/b}\,\text{m}_{b}$. The steady-state solution is
 $\overline{y}_{o}=\text{m}_{b}^{2}>0$ and there is no divergence of the delay
 $z_{b}$. For unstable detonations against longitudinal disturbances, equation (9.5) becomes multivalued introducing jumps of
 $z_{b}(\unicode[STIX]{x1D70F})$ if the acceleration
 $\text{d}y/\text{d}\unicode[STIX]{x1D70F}>0$ becomes sufficiently large during an oscillatory period of the propagation velocity
 $y(\unicode[STIX]{x1D70F})$, see figures 2 and 3.
Stability for a constant flow of burnt gas,  $\text{m}_{b}=\text{const.}>0$, is analysed with the linear version of
 $(b/2)G_{1}+G_{2}$ around
 $\overline{y}_{o}$. This leads to the integral equation (C 24) obtained by Clavin & Williams (Reference Clavin and Williams2002) and recalled in § C.2. The disturbance of the lower bound of the integrals (8.33)–(8.34) yields a nonlinear contribution which is neglected in the linear approximation so that
 $-\text{e}^{-y(\unicode[STIX]{x1D70F}-z_{b})}$ is replaced by
 $-\text{e}^{-\overline{y}_{o}}$, which in turn can be replaced by
 $-\infty$ in (C 24) because the linear version (C 22) of the integrant is zero for
 $\unicode[STIX]{x1D709}\leqslant -\text{e}^{-\overline{y}_{o}}$:
 $g_{o}(\unicode[STIX]{x1D709})=0$; see the text below (C 20) in § C.2. Notice also that the linear integral equation thus written is valid for a CJ wave with a reaction rate
 $\unicode[STIX]{x1D714}_{o_{CJ}}(\unicode[STIX]{x1D709})$ decreasing smoothly to zero in the burnt gas, free from the assumption (3.17). Usually, the threshold of instability against longitudinal disturbances corresponds to a critical value
 $b_{c}$ of
 $b$ which is not large. For example,
 $b_{c}\approx 1.27$ for a CJ wave sustained by the same reaction rate as in Clavin & Denet (Reference Clavin and Denet2018).
The above simplification of the lower bound of the integrals in  $G_{1}$ and
 $G_{2}$ can also be used for the nonlinear dynamics of a weakly unstable detonation wave because the pulsations with small amplitude are mainly governed by the deformation of the distribution of heat release at a distance from the lead shock significantly shorter than the detonation thickness. This is a good approximation when the variations of the distance of the maximum of heat release from the lead shock produce modifications of the integral that are much larger than the variations near the end of the reaction where the reaction rate is very small. Putting
 $-\infty$ in the lower bound of the integrals (8.33) and (8.34) (as in the linear analysis) leads to equations (C 25)–(C 26) that describe the intrinsic dynamics of weakly unstable detonations. In the unstable domain, the corresponding solution
 $y(\unicode[STIX]{x1D70F})$ becomes chaotic when
 $b$ is increased beyond the instability threshold. Pushing the lower bound of the integrals in
 $G_{1}$ and
 $G_{2}$ to
 $-\infty$, which is a good approximation for the intrinsic dynamics of weakly unstable detonation, is no longer relevant for strongly unstable detonations nor for the unsteady response of the detonation wave to modifications of the flow in the burnt gas. The total time delay
 $z_{b}(\unicode[STIX]{x1D70F})$ from the exit of the inner structure to the lead shock is a key mechanism in the rarefaction-wave-driven detonation decay. Not only is
 $z_{b}$ non-negligible in the forcing term
 $\text{m}_{b}^{2}(\unicode[STIX]{x1D70F}-z_{b})$ when
 $z_{b}$ is not sufficiently smaller than the time scale of the external flow but, also, the lower bound
 $-\text{e}^{-y(\unicode[STIX]{x1D70F}-z_{b}(\unicode[STIX]{x1D70F}))}$ should be kept in the integrals (8.33)–(8.35), as shown by the comparison of the solutions of (8.36)–(8.37) with and without the lower bound replaced by
 $-\infty$, see figure 4.
Decay in a spherical geometry of a stable detonation. The trajectory corresponding to the solution of (9.6) with (8.37) is plotted in red for  $\unicode[STIX]{x1D6FD}=0.8$ with the reaction rate used in Clavin & Denet (Reference Clavin and Denet2018),
 $\unicode[STIX]{x1D6FD}_{c}\approx 1.27$, and for
 $x_{i_{CJ}}=5.1$ (
 $x_{i}=2.8$,
 $\unicode[STIX]{x1D707}_{bi}=0.6$), the trajectory being computed by using
 $\text{d}x/\text{d}\unicode[STIX]{x1D70F}=0.08$ (
 $b\unicode[STIX]{x1D706}=12$). The quasi-steady trajectory is plotted in blue and the trajectory of the weakly nonlinear version of (9.6) is plotted in black. In green is the peninsula of the quasi-steady CJ detonation.

9.5 Extension to marginally stable or unstable CJ regimes
For usual reaction rates, the double limit (4.14)  $\unicode[STIX]{x1D716}\ll 1$ and
 $b\gg 1$ (small heat release and large activation energy) corresponds to unstable detonations
 $b>b_{c}$ since
 $b_{c}$ is not a large number for a typical reaction rate
 $\unicode[STIX]{x1D714}_{o_{CJ}}(\unicode[STIX]{x1D709})$. CJ detonations of usual gaseous mixtures are effectively unstable against longitudinal perturbations. However, the decay of a spherical detonation to a marginally stable (or unstable) CJ regime is instructive in many ways, for example by comparison with the existing direct numerical simulations and also with the steady-state approximation, including the discontinuous model used by Liñan et al. (Reference Liñan, Kurdyumov and Sanchez2012). In addition, the erratic dynamics of strongly unstable detonations is avoided with marginally stable and unstable detonations. Working near the CJ regime, the asymptotic analysis in the limit (4.14) introduces the same non-dimensional parameter of thermal sensitivity
 $b$ for the quasi-steady curvature-induced quenching and for the intrinsic dynamics of the inner structure controlling the stability (and the response) of the detonation wave. For real detonations with a propagation Mach number sufficiently large (typically
 $\sqrt{q_{m}/c_{p}T_{u}}\approx 2$ and
 $M_{_{CJ}}^{2}\approx 16$), the two parameters are different even though the same physical mechanism, namely the thermal sensitivity of the reaction rate, is at the root of the two phenomena. In fact, the only parameter
 $b$ left in (8.36) is the one controlling the dynamics of the inner structure discussed in § 9.4. Then, equation (8.36) can be formally extended to the decay toward a marginally stable or unstable CJ wave by considering values of the parameter
 $b$ in front of
 $G_{1}$ close to its marginal value
 $b_{c}$ at the instability threshold, keeping the expression (4.12) with (4.20) for
 $\overline{y}_{_{CJ}}(x)$. Since typically
 $b_{c}$ is not a large number while equations (4.12) and (4.20) are valid when corrections of order
 $1/b$ are neglected, the extended expression (8.36) is not relevant near the critical radius
 $x^{\ast }$ of curvature-induced quenching. Anyway, this region where the term
 $I_{h}$ is large was already outside the validity domain of (8.36). Equation (8.36) thus modified yields relevant results away from the curvature quenching, namely, for a radius sufficiently large compared with
 $x^{\ast }$ in the intermediate range of CJ velocity where the curvature effect is non-negligible but not strong enough for quenching
 $-1<\overline{y}_{_{CJ}}<0$. It is then convenient to re-write equation (8.36) by using a notation for the parameter of thermal sensitivity controlling the inner dynamics different from that involved in the curvature-induced quenching
 $$\begin{eqnarray}\displaystyle 2(y(\unicode[STIX]{x1D70F})-\overline{y}_{_{CJ}})=\frac{\unicode[STIX]{x1D6FD}}{2}G_{1}+G_{2}+I_{h}+\text{m}_{b}^{2}(\unicode[STIX]{x1D70F}-z_{b}), & & \displaystyle\end{eqnarray}$$
where the functionals  $z_{b}$,
 $G_{1}$,
 $G_{2}$,
 $I_{h}$ are given in (8.30), (8.33)–(8.35) respectively and the function
 $\text{m}_{b}(\unicode[STIX]{x1D70F})$ is defined in (8.37). The critical value of the parameter
 $\unicode[STIX]{x1D6FD}$ at the instability threshold is called
 $\unicode[STIX]{x1D6FD}_{c}$ in the following. The trajectory in the phase space (
 $x$–
 $y$) is obtained from the solution
 $y(\unicode[STIX]{x1D70F})$ of (9.6) by using the linear relation between
 $x$ and
 $\unicode[STIX]{x1D70F}$ in (6.11). For
 $\unicode[STIX]{x1D6FD}$ close to
 $\unicode[STIX]{x1D6FD}_{c}$, equation (9.6) constitutes a model for successful initiation of spherical detonations that are stable or marginally unstable against radial disturbances. The strongly unstable detonations in the asymptotic limit (4.14) are recovered for values of
 $\unicode[STIX]{x1D6FD}$ sufficiently larger than
 $\unicode[STIX]{x1D6FD}_{c}$. A weakly nonlinear version of (9.6) is obtained when the lower bound of the integral in
 $G_{1}$,
 $G_{2}$ and
 $I_{h}$ is replaced by
 $-\infty$, as discussed in § 9.4. This is an accurate approximation only at the very end of the decay of a stable or marginally unstable CJ detonation when
 $y(\unicode[STIX]{x1D70F})$ becomes very small. Comparison of the full solution of (9.6) with the solution of the weakly nonlinear version helps to clarify the importance of the different physical phenomena at work during the detonation decay.
9.6 Numerical solutions of the integral equation. Unsteadiness
A difficulty in the numerical analysis of integral equations comes from the fact that the past of the solution should be known. A relevant numerical solution is obtained if the memory effect of the initial condition is forgotten after a time lag that is relatively short. In the parameter space ( $x$–
 $y$), initialization of the trajectories that are solution of (9.6) requires us to proceed by iteration. For a given initial condition,
 $x_{i}>x^{\ast }$ and
 $\text{m}_{bi}$ corresponding to a function
 $\text{m}_{b}(\unicode[STIX]{x1D70F})$, namely, for a given
 $\unicode[STIX]{x1D70F}_{i_{CJ}}$ in (8.37), the initial value
 $y_{i}\equiv y(x_{i})$ is part of the solution. The difficulty is overcome more easily for a stable detonation
 $\unicode[STIX]{x1D6FD}<\unicode[STIX]{x1D6FD}_{c}$ by using an iterative procedure. If the initial value of
 $y$ is too far from
 $y(x_{i})$, the numerical solution
 $y(x)$ of (9.6) shows large oscillations, decreasing quickly to a quiet trajectory. The relevance of the solution is checked by extrapolating the quiet trajectory in the past for
 $x<x_{i}$ and re-starting the numerical simulation. An example of the trajectory decaying to the upper branch of the CJ peninsula is presented in figure 4 where the solution of (9.6) with (8.37) is plotted in red for
 $\unicode[STIX]{x1D6FD}=0.8$ with the reaction rate used in Clavin & Denet (Reference Clavin and Denet2018),
 $\unicode[STIX]{x1D6FD}_{c}\approx 1.27$, and for
 $x_{i_{CJ}}=5.1$ (
 $x_{i}=2.8$,
 $\unicode[STIX]{x1D707}_{bi}=0.6$), the trajectory being computed for
 $\text{d}x/\text{d}\unicode[STIX]{x1D70F}=0.08$ (
 $b\unicode[STIX]{x1D706}=12$). For comparison, the quasi-steady trajectory in blue in figure 4, obtained by neglecting the delays
 $\unicode[STIX]{x1D701}(\unicode[STIX]{x1D709})$ and
 $z_{b}$ in (9.6), is effectively tangent to the CJ peninsula at
 $x=x_{i_{CJ}}$, as predicted in § 7.2. The comparison of the two trajectories enlightens us to the effect of unsteadiness produced by the time delays. Two main pieces of information are extracted from this comparison. First, in contrast to the quasi-steady approximation, the transition to the CJ regime is not abrupt; a relatively long tail of the velocity decay is observed. However, the trajectory is quite close to the CJ peninsula as soon as the radius is sufficiently large, for example at
 $x\approx 10$, while the difference from the planar CJ velocity is still non-negligible. This illustrates to what extent the quasi-steady CJ peninsula is an attractor of the trajectories. Second, far from the CJ peninsula in the early part of the decay, that is for
 $y(x)$ larger than
 $\overline{y}_{_{CJ}}(x)$, the trajectory is never quasi-steady. The cause of this spectacular manifestation of unsteadiness is clearly shown by the comparison with the solution of the weakly nonlinear version of (9.6), namely, when the lower bound of the integrals in
 $G_{1}$,
 $G_{2}$ and
 $I_{h}$ are replaced by
 $-\infty$. The corresponding trajectory is plotted in black in figure 4, showing a quasi-steady behaviour far away from the CJ peninsula, in contrast to the previous solution. This points out the drastic unsteady effect which is produced upon the detonation decay by the time delay from the exit of the inner structure to the lead shock resulting from the upstream-running mode.


Decay in a spherical geometry of a strongly unstable detonation. The pulsating solution of the weakly nonlinear version of (9.6) with (8.37) is plotted in red for the same condition as in figure 4, except for  $\unicode[STIX]{x1D6FD}=2$, above the instability threshold
 $\unicode[STIX]{x1D6FD}_{c}\approx 1.27$.

Similar results illustrating unsteadiness during the decay of stable detonations are obtained when the curvature effect on the inner structure is neglected, namely the solutions of (9.6) for  $\overline{y}_{_{CJ}}=0$ and
 $I_{h}=0$.
The instantaneous trajectories of marginally unstable detonations characterized by a small amplitude of pulsation are obtained in a similar way. The result is plotted in figure 5 for the same conditions as in figure 4, except for  $\unicode[STIX]{x1D6FD}=1.3$, slightly large than
 $\unicode[STIX]{x1D6FD}_{c}=1.27$. The frequency of pulsation is that predicted by the stability analysis at bifurcation,
 $\unicode[STIX]{x1D714}_{c}=4.5$. The mean trajectory, averaged over a time window larger than the period of pulsation, is quite similar to the trajectory of the stable detonation shown by the red curve in figure 4 for
 $\unicode[STIX]{x1D6FD}=0.8$.
Numerical solution of (9.6) is much more difficult for strongly unstable detonations. The solution becomes quickly chaotic above the instability threshold. Then it is practically impossible to guess a reasonably accurate past of the solution which is required to initiate a relevant calculation of the trajectory. Moreover, the relative jumps of the time delay  $\unicode[STIX]{x0394}z_{b}/z_{b}$ become sufficiently large to pollute the numerical solution of the trajectory from the beginning. This could also be the case in direct numerical simulation of the decay of strongly unstable detonations. Much work remains to be done on this topic. An illustration of the problem is shown in figure 6 for
 $\unicode[STIX]{x1D6FD}=2$ when part of the difficulty is removed by using the weakly nonlinear version of (9.6). The initial trajectory is effectively chaotic but becomes regular some time later. Unfortunately, this is no more the case when the lower bound
 $-\text{e}^{-y(\unicode[STIX]{x1D70F}-z_{b})}$ is kept in the integrals
 $G_{1}$,
 $G_{2}$ and
 $I_{h}$ in (9.6).
10 Conclusion and perspective
The theoretical analysis presented in this paper brought to light unsteadiness of the detonation decay during a successful direct initiation of a stable or weakly unstable detonation. The unsteady mechanism is clearly identified on the example of figure 4 as being the time delay  $z_{b}$ of the upstream-running mode (relative to the lead shock) for propagating the rarefaction-wave-induced deceleration from the exit of the inner structure to the lead shock.
No definitive conclusion can be formulated for strongly unstable detonations. An intriguing new phenomenon associated with jumps of  $z_{b}$ during an oscillatory pulsation of the shock velocity is identified. This phenomenon, which is related to causality, has no noticeable effect on the dynamics of the lead shock for stable or marginally unstable detonations near the instability threshold against longitudinal disturbances. However, it could play an important role for strongly unstable detonations. Much work remains to be done on this topic, including further direct numerical simulations.
The role of unsteadiness near criticality is an open question at the present stage of the analysis. Future works have to be devoted to answering the key question: to what extent does unsteadiness modify the quasi-steady curvature-induced quenching? According to the existing direct numerical simulations, the order of magnitude of the critical radius is not modified from its quasi-steady value  $r^{\ast }$. If this is the case, why and how? In order to describe the dynamics of stable and marginally unstable detonations near the critical condition of initiation, the analysis has to be extended in two directions. First, an analytical study of the rarefaction flow has to be performed with the objective of developing a matching procedure with the internal structure. This work is in process in the limit of small heat release, showing that the rarefaction wave has the same properties as in the opposite limit of large Mach number. These results will be published soon. Second, the parameters controlling the thermal sensibility of the curvature effect and of the intrinsic dynamics of the inner structure should be identified separately right from the beginning. Such a parameter differentiation, which has been done here on the integral equation for successful initiation (radius larger than
 $r^{\ast }$), cannot be made on the hyperbolic equation obtained in the double limit of small heat release and large activation energy. The basic idea for future analytical works is to keep the dynamics of the inner structure controlled by the upstream-running mode even for a heat release which is not small. These semi-phenomenological results could be quantitatively accurate for real detonations near the CJ regime because the response of their inner structure to disturbances of the burnt-gas flow is one of two time scales.
Acknowledgements
Professor A. Li $\tilde{\text{n}}$an is acknowledged for stimulating and enlightening discussions. Partial financial support of Agence National de la Recherche (contract ANR-18-CE05-0030) is acknowledged.
Declaration of interests
The authors report no conflict of interest.
Appendix A. Technical details
A.1 Calculation in § 7
Denoting by ( $x_{o}$,
 $y_{o}$) the coordinates of the intersection of the steady-state trajectory with the curve
 $y=-\ln x$, equation (7.1) yields
 $$\begin{eqnarray}\sqrt{\overline{y}(x)+\text{e}^{-\overline{y}(x)}/x}-\sqrt{y_{o}+\text{e}^{-y_{o}}/x_{o}}=-\sqrt{b/2}\ln (x/x_{o}).\end{eqnarray}$$
Expanding the first term on the left-hand side around ( $x_{o},y_{o}$) yields
 $$\begin{eqnarray}\displaystyle \overline{y}+\frac{\text{e}^{-\overline{y}}}{x} & = & \displaystyle y_{o}+(\overline{y}-y_{o})+\frac{\text{e}^{-y_{o}}}{x_{o}}\nonumber\\ \displaystyle & & \displaystyle \times \,\left[1-\frac{(x-x_{o})}{x_{o}}+\cdots \,\right]\left[1-(\overline{y}-y_{o})+\frac{1}{2}(\overline{y}-y_{o})^{2}+\cdots \,\right].\end{eqnarray}$$
Using the relation  $e^{-y_{o}}/x_{o}=1$ the linear terms
 $(y-y_{o})$ cancel and anticipating that the term
 $(x-x_{o})(\overline{y}-y_{o})$ is smaller than
 $(\overline{y}-y_{o})^{2}$ one gets
 $$\begin{eqnarray}\displaystyle \overline{y}+\frac{\text{e}^{-\overline{y}}}{x}=y_{o}+\frac{\text{e}^{-y_{o}}}{x_{o}}+\left[-\frac{(x-x_{o})}{x_{o}}+\frac{1}{2}(\overline{y}-y_{o})^{2}+\cdots \,\right]. & & \displaystyle\end{eqnarray}$$
Equation (A 1) then yields
 $$\begin{eqnarray}\displaystyle & \displaystyle y_{o}\neq -1,\,\,y_{o}+1>0:\quad \frac{(\overline{y}-y_{o})^{2}/2-(x-x_{o})/x_{o}}{2\sqrt{y_{o}+1}}\approx -\sqrt{b/2}\frac{\left(x-x_{o}\right)}{x_{o}}, & \displaystyle\end{eqnarray}$$
 $$\begin{eqnarray}\displaystyle & \displaystyle 2(y_{o}+1)\sqrt{b/2}\,\,\gg 1\,\,\Rightarrow \,\,\frac{\left(x-x_{o}\right)}{x_{o}}\approx -\frac{(\overline{y}-y_{o})^{2}}{4\sqrt{b/2}\sqrt{y_{o}+1}}, & \displaystyle\end{eqnarray}$$
describing a turning point of the trajectory at ( $x_{o}$,
 $y_{o}$), as shown figure 1.
The expansion (A 3) is no longer valid at the critical point. For  $x_{o}=\text{e}$,
 $y_{o}+1=0$,
 $\sqrt{y_{o}+\text{e}^{-y_{o}}/x_{o}}=0$, equation (A 1)
 $$\begin{eqnarray}\displaystyle \hspace{-14.39996pt} & \displaystyle \sqrt{\overline{y}+\frac{\text{e}^{-\overline{y}}}{x}}=\left[\frac{(\text{e}-x)}{\text{e}}-\frac{(\text{e}-x)}{\text{e}}(\overline{y}+1)+\frac{1}{2}(\overline{y}+1)^{2}+\cdots \,\right]^{1/2}\approx \sqrt{b/2}\frac{\left(\text{e}-x\right)}{\text{e}}, & \displaystyle\end{eqnarray}$$
 $$\begin{eqnarray}\displaystyle \hspace{-14.39996pt} & \displaystyle \frac{(\text{e}-x)}{\text{e}}-\frac{(\text{e}-x)}{\text{e}}(y+1)+\frac{1}{2}(y+1)^{2}+\cdots \approx \frac{b}{2}\left[\frac{(\text{e}-x)}{\text{e}}\right]^{2}, & \displaystyle\end{eqnarray}$$
showing that there is a small neighbourhood of the critical point for  $x<\text{e}$,
 $(\text{e}-x)/\text{e}=O(1/\sqrt{b})$,
 $(y+1)^{2}\approx b[(\text{e}-x)/\text{e}]^{2}$ in which the trajectory
 $\overline{y}(x)$ is linear with a large slope
 $$\begin{eqnarray}b\gg 1,\,\,(\text{e}-x)/\text{e}=O(1/\sqrt{b}):\quad \lim _{(x-\text{e})\rightarrow 0^{-}}|\overline{y}+1|=\sqrt{b}(\text{e}-x)/\text{e},\,\,\left[\frac{\text{d}\overline{y}}{\text{d}x}\right]_{\overline{y}+1=0^{-}}^{\overline{y}+1=0^{+}}=-\frac{2\sqrt{b}}{\text{e}}.\end{eqnarray}$$
Consider now a quasi-steady trajectory intersecting the upper branch of the CJ peninsula. According to (7.1) and  $\text{m}_{bi}=\sqrt{y_{i}+\text{e}^{-y_{i}}/x_{i}}$ and
 $$\begin{eqnarray}\displaystyle & \displaystyle \sqrt{\overline{y}(x)+\text{e}^{-\overline{y}(x)}/x}-\sqrt{y_{i}+\text{e}^{-y_{i}}/x_{i}}=-\sqrt{b/2}\ln (x/x_{i}), & \displaystyle\end{eqnarray}$$
 $$\begin{eqnarray}\displaystyle & \displaystyle \overline{y}_{_{CJ}}(x_{_{CJ}})+\text{e}^{-\overline{y}_{_{CJ}}(x_{_{CJ}})}/x_{_{CJ}}=0\quad \Rightarrow \quad -\sqrt{y_{i}+\text{e}^{-y_{i}}/x_{i}}=-\sqrt{b/2}\ln (x_{_{CJ}}/x_{i}). & \displaystyle\end{eqnarray}$$
This leads to (7.2), which can be written for  $(x_{_{CJ}}-x)/x_{_{CJ}}\ll 1$ in the form
 $$\begin{eqnarray}\sqrt{\overline{y}(x)+\text{e}^{-\overline{y}(x)}/x}=\sqrt{b/2}(x_{_{CJ}}-x)/x_{_{CJ}}.\end{eqnarray}$$
According to the equation of the CJ peninsula,  $\overline{y}_{_{CJ}}(x)+\text{e}^{-\overline{y}_{_{CJ}}(x)}/x=0$, equation (A 11) can be written in the form
 $$\begin{eqnarray}\displaystyle & \displaystyle \sqrt{\overline{y}(x)-\overline{y}_{_{CJ}}(x)+\text{e}^{-\overline{y}(x)}/x-\text{e}^{-\overline{y}_{_{CJ}}(x)}/x}=\sqrt{b/2}(x_{_{CJ}}-x)/x_{_{CJ}}, & \displaystyle\end{eqnarray}$$
 $$\begin{eqnarray}\displaystyle & \displaystyle \overline{y}(x)-\overline{y}_{_{CJ}}(x)+\text{e}^{-\overline{y}(x)}/x-\text{e}^{-\overline{y}_{_{CJ}}(x)}/x=b/2(x_{_{CJ}}-x)^{2}/x_{_{CJ}}^{2}. & \displaystyle\end{eqnarray}$$
Expanding  $\text{e}^{-\overline{y}(x)}$ around
 $\text{e}^{-\overline{y}_{_{CJ}}(x)}$ yields
 $$\begin{eqnarray}\displaystyle & \displaystyle \overline{y}-\overline{y}_{_{CJ}}+\frac{\text{e}^{-\overline{y}_{_{CJ}}(x)}}{x}[1+(\overline{y}_{_{CJ}}-\overline{y})]-\frac{\text{e}^{-\overline{y}_{_{CJ}}(x)}}{x}=b/2\frac{(x_{_{CJ}}-x)^{2}}{x_{_{CJ}}^{2}}, & \displaystyle\end{eqnarray}$$
 $$\begin{eqnarray}\displaystyle & \displaystyle \overline{y}(x)-\overline{y}_{_{CJ}}(x)+\frac{\text{e}^{-\overline{y}_{_{CJ}}(x)}}{x}\left[\overline{y}_{_{CJ}}(x)-\overline{y}(x)\right]=b/2\frac{(x_{_{CJ}}-x)^{2}}{x_{_{CJ}}^{2}}, & \displaystyle\end{eqnarray}$$
which can also be written, using again  $\text{e}^{-\overline{y}_{_{CJ}}(x)}/x=-\overline{y}_{_{CJ}}(x)$,
 $$\begin{eqnarray}\displaystyle & \displaystyle \overline{y}(x)-\overline{y}_{_{CJ}}(x)-y_{_{CJ}}(x)\left[\overline{y}_{_{CJ}}(x)-\overline{y}(x)\right]=b/2\frac{(x_{_{CJ}}-x)^{2}}{x_{_{CJ}}^{2}}, & \displaystyle\end{eqnarray}$$
 $$\begin{eqnarray}\displaystyle & \displaystyle \left[\overline{y}(x)-\overline{y}_{_{CJ}}(x)\right]\left[1+\overline{y}_{_{CJ}}(x)\right]=b/2\frac{(x_{_{CJ}}-x)^{2}}{x_{_{CJ}}^{2}}. & \displaystyle\end{eqnarray}$$
For an intersection point sufficiently far from the critical point  $x_{_{CJ}}>\text{e}$,
 $1+y_{_{CJ}}(x_{_{CJ}})>0$, the derivative
 $\text{d}\overline{y}_{_{CJ}}/\text{d}x$ is finite,
 $\overline{y}_{_{CJ}}(x)\approx \overline{y}_{_{CJ}}(x_{_{CJ}})+(x-x_{_{CJ}})\,\text{d}\overline{y}_{_{CJ}}/\text{d}x|_{x_{_{CJ}}}$ and (A 17) leads to (7.3) valid for
 $$\begin{eqnarray}\displaystyle 0<(x-x_{_{CJ}})\ll -\overline{y}_{_{CJ}}(x_{_{CJ}})[\text{d}\overline{y}_{_{CJ}}/\text{d}x|_{x_{_{CJ}}}]^{-1}=\left[1+\overline{y}_{_{CJ}}(x_{_{CJ}})\right]x_{_{CJ}}. & & \displaystyle\end{eqnarray}$$
A.2 Calculation in § 8.1
Sufficiently above the CJ peninsula such that  $\unicode[STIX]{x1D707}_{o_{CJ}}(-\text{e}^{(\overline{y}_{_{CJ}}-y)})=O(1)$, the zeroth order of the steady version of (8.11)–(8.12) takes the form
 $$\begin{eqnarray}\frac{\unicode[STIX]{x2202}}{\unicode[STIX]{x2202}\unicode[STIX]{x1D709}}\left[\unicode[STIX]{x1D707}_{o_{CJ}}(\unicode[STIX]{x1D709}\text{e}^{\overline{y}_{_{CJ}}})\unicode[STIX]{x1D707}_{1,0}+\frac{\unicode[STIX]{x1D707}_{1,0}^{2}}{2}\right]=\frac{1}{2}\left[\text{e}^{y}\unicode[STIX]{x1D714}_{o_{CJ}}(\unicode[STIX]{x1D709}\,\text{e}^{y})-\text{e}^{\overline{y}_{_{CJ}}}\unicode[STIX]{x1D714}_{o_{CJ}}(\unicode[STIX]{x1D709}\,\text{e}^{\overline{y}_{_{CJ}}})\right],\end{eqnarray}$$
 $$\begin{eqnarray}\unicode[STIX]{x1D709}=0:\quad \unicode[STIX]{x1D707}_{1,0}=0;\quad \unicode[STIX]{x1D709}=-\text{e}^{-y}:\quad \unicode[STIX]{x1D707}_{1,0}=-\unicode[STIX]{x1D707}_{o_{CJ}}(-\text{e}^{(\overline{y}_{_{CJ}}-y)}),\end{eqnarray}$$
and the solution is
 $$\begin{eqnarray}\displaystyle 0<(y-\overline{y}_{_{CJ}})=O(1)\quad \Rightarrow \quad \unicode[STIX]{x1D707}_{1,0}(\unicode[STIX]{x1D709},\unicode[STIX]{x1D70F})=\unicode[STIX]{x1D707}_{o_{CJ}}(\unicode[STIX]{x1D709}\text{e}^{y(\unicode[STIX]{x1D70F})})-\unicode[STIX]{x1D707}_{o_{CJ}}(\unicode[STIX]{x1D709}\,\text{e}^{\overline{y}_{_{CJ}}(x)}), & & \displaystyle\end{eqnarray}$$
as it is verified by introducing (A 21) into the left-hand side of (A 19) and by performing a spatial integration from  $\unicode[STIX]{x1D709}=-\text{e}^{-y}$ where
 $\unicode[STIX]{x1D707}_{1,0}=-\unicode[STIX]{x1D707}_{o_{CJ}}(-\text{e}^{-(y-\overline{y}_{_{CJ}})})$ since
 $\unicode[STIX]{x1D707}_{o_{CJ}}(\unicode[STIX]{x1D709}\text{e}^{y})=0$
 $$\begin{eqnarray}\displaystyle & & \displaystyle \unicode[STIX]{x1D707}_{o_{CJ}}(\unicode[STIX]{x1D709}\text{e}^{\overline{y}_{_{CJ}}})\unicode[STIX]{x1D707}_{1,0}+\frac{\unicode[STIX]{x1D707}_{1,0}^{2}}{2}+\frac{\unicode[STIX]{x1D707}_{o_{CJ}}^{2}(-\text{e}^{-(y-\overline{y}_{_{CJ}})})}{2}\nonumber\\ \displaystyle & & \displaystyle \quad =\frac{1}{2}\left[\int _{-\text{e}^{-y}}^{\unicode[STIX]{x1D709}}\text{e}^{y}\unicode[STIX]{x1D714}_{o_{CJ}}(\unicode[STIX]{x1D709}^{\prime }\,\text{e}^{y})\,\text{d}\unicode[STIX]{x1D709}^{\prime }-\int _{-\text{e}^{-y}}^{\unicode[STIX]{x1D709}}\text{e}^{\overline{y}_{_{CJ}}}\unicode[STIX]{x1D714}_{o_{CJ}}(\unicode[STIX]{x1D709}^{\prime }\,\text{e}^{\overline{y}_{_{CJ}}})\,\text{d}\unicode[STIX]{x1D709}^{\prime }\right],\end{eqnarray}$$
which takes the form  $[\unicode[STIX]{x1D707}_{1,0}+\unicode[STIX]{x1D707}_{o_{CJ}}(\unicode[STIX]{x1D709}\,\text{e}^{\overline{y}_{_{CJ}}})]^{2}=\unicode[STIX]{x1D707}_{o_{CJ}}^{2}(\unicode[STIX]{x1D709}\,\text{e}^{y})$ since the first integral on the right-hand side of (A 22) corresponds to
 $\unicode[STIX]{x1D707}_{o_{CJ}}^{2}(\unicode[STIX]{x1D709}\text{e}^{y})/2$ and the second integral, decomposes into
 $-(1/2)\int _{-\text{e}^{-y}}^{-\text{e}^{-\overline{y}_{_{CJ}}}}-(1/2)\int _{-\text{e}^{-\overline{y}_{_{CJ}}}}^{\unicode[STIX]{x1D709}}$, gives
 $\unicode[STIX]{x1D707}_{o_{CJ}}^{2}(-\text{e}^{-(y-\overline{y}_{_{CJ}})})/2-\unicode[STIX]{x1D707}_{o_{CJ}}^{2}(\unicode[STIX]{x1D709}\text{e}^{\overline{y}_{_{CJ}}})/2$, so that (A 21) is recovered. Equation (A 21) corresponds simply to the leading order of the velocity distribution of the quasi-steady solution (5.21)
 $\overline{\unicode[STIX]{x1D707}}(\unicode[STIX]{x1D709},\overline{y})$ in which
 $\overline{y}$ is replaced by
 $y(\unicode[STIX]{x1D70F})$,
 $\unicode[STIX]{x1D707}\approx \unicode[STIX]{x1D707}_{o_{CJ}}(\unicode[STIX]{x1D709}\text{e}^{y})$.
Appendix B. Useful example of hyperbolic problems
Consider the following hyperbolic problem for the field  $z(\unicode[STIX]{x1D701},\unicode[STIX]{x1D70F})$
 $$\begin{eqnarray}0\geqslant \unicode[STIX]{x1D701}\geqslant \unicode[STIX]{x1D701}_{b}:\quad \frac{\unicode[STIX]{x2202}z}{\unicode[STIX]{x2202}\unicode[STIX]{x1D70F}}+\frac{\unicode[STIX]{x2202}z}{\unicode[STIX]{x2202}\unicode[STIX]{x1D701}}=f(\unicode[STIX]{x1D701},\unicode[STIX]{x1D70F})>0,\quad \unicode[STIX]{x1D701}=\overline{\unicode[STIX]{x1D701}}_{b}:\quad z(\overline{\unicode[STIX]{x1D701}}_{b},\unicode[STIX]{x1D70F})=z_{b}(\unicode[STIX]{x1D70F})>0,\end{eqnarray}$$
where  $\overline{\unicode[STIX]{x1D701}}_{b}$ is a fixed coordinate, the source term
 $f(\unicode[STIX]{x1D701},\unicode[STIX]{x1D70F})>0$ and
 $z_{b}(\unicode[STIX]{x1D70F})>0$ being given functions. The general solution
 $z(\unicode[STIX]{x1D701},\unicode[STIX]{x1D70F})$ is obtained by the method of characteristics,
 $\text{d}\unicode[STIX]{x1D701}(\unicode[STIX]{x1D70F}^{\prime })/\text{d}\unicode[STIX]{x1D70F}^{\prime }=1$,
 $\unicode[STIX]{x1D701}(\unicode[STIX]{x1D70F}^{\prime })=\unicode[STIX]{x1D701}-\unicode[STIX]{x1D70F}+\unicode[STIX]{x1D70F}^{\prime }$
 $$\begin{eqnarray}\displaystyle \forall \unicode[STIX]{x1D70F}_{b}\quad z(\unicode[STIX]{x1D701},\unicode[STIX]{x1D70F})=\int _{\unicode[STIX]{x1D70F}_{b}}^{\unicode[STIX]{x1D70F}}f(\unicode[STIX]{x1D701}-\unicode[STIX]{x1D70F}+\unicode[STIX]{x1D70F}^{\prime },\,\unicode[STIX]{x1D70F}^{\prime })\,\text{d}\unicode[STIX]{x1D70F}^{\prime }+z(\unicode[STIX]{x1D701}-\unicode[STIX]{x1D70F}+\unicode[STIX]{x1D70F}_{b},\unicode[STIX]{x1D70F}_{b}). & & \displaystyle\end{eqnarray}$$
Choosing for  $\unicode[STIX]{x1D70F}_{b}$ the time at which the characteristic curve goes through the position
 $\overline{\unicode[STIX]{x1D701}}_{b}$,
 $\forall \unicode[STIX]{x1D70F}^{\prime }:\unicode[STIX]{x1D701}(\unicode[STIX]{x1D70F}^{\prime })-\unicode[STIX]{x1D70F}^{\prime }=\overline{\unicode[STIX]{x1D701}}_{b}-\unicode[STIX]{x1D70F}_{b}$,
 $\unicode[STIX]{x1D701}(\unicode[STIX]{x1D70F})=\unicode[STIX]{x1D701}$,
 $\unicode[STIX]{x1D701}-\unicode[STIX]{x1D70F}=\overline{\unicode[STIX]{x1D701}}_{b}-\unicode[STIX]{x1D70F}_{b}$, the solution of (B 1) takes the form
 $$\begin{eqnarray}\displaystyle & \displaystyle z(\unicode[STIX]{x1D701},\unicode[STIX]{x1D70F})=\int _{\unicode[STIX]{x1D70F}_{b}}^{\unicode[STIX]{x1D70F}}f(\unicode[STIX]{x1D701}-\unicode[STIX]{x1D70F}+\unicode[STIX]{x1D70F}^{\prime },\,\unicode[STIX]{x1D70F}^{\prime })\,\text{d}\unicode[STIX]{x1D70F}^{\prime }+z(\overline{\unicode[STIX]{x1D701}}_{b},\unicode[STIX]{x1D70F}-\unicode[STIX]{x1D701}+\overline{\unicode[STIX]{x1D701}}_{b}), & \displaystyle\end{eqnarray}$$
 $$\begin{eqnarray}\displaystyle & \displaystyle z(\unicode[STIX]{x1D701},\unicode[STIX]{x1D70F})=\int _{\unicode[STIX]{x1D70F}_{b}}^{\unicode[STIX]{x1D70F}}f(\unicode[STIX]{x1D701}-\unicode[STIX]{x1D70F}+\unicode[STIX]{x1D70F}^{\prime },\,\unicode[STIX]{x1D70F}^{\prime })\,\text{d}\unicode[STIX]{x1D70F}^{\prime }+z_{b}(\unicode[STIX]{x1D70F}-\unicode[STIX]{x1D701}+\overline{\unicode[STIX]{x1D701}}_{b}), & \displaystyle\end{eqnarray}$$
 $$\begin{eqnarray}\displaystyle & \displaystyle z(\unicode[STIX]{x1D701},\unicode[STIX]{x1D70F})=\int _{\unicode[STIX]{x1D70F}_{b}}^{\unicode[STIX]{x1D70F}}f(\unicode[STIX]{x1D701}-\unicode[STIX]{x1D70F}+\unicode[STIX]{x1D70F}^{\prime },\,\unicode[STIX]{x1D70F}^{\prime })\,\text{d}\unicode[STIX]{x1D70F}^{\prime }+z_{b}(\unicode[STIX]{x1D70F}_{b}). & \displaystyle\end{eqnarray}$$
A change of variable of integration  $\unicode[STIX]{x1D70F}^{\prime }\rightarrow \unicode[STIX]{x1D701}^{\prime }=\unicode[STIX]{x1D701}-\unicode[STIX]{x1D70F}+\unicode[STIX]{x1D70F}^{\prime }$ leads to a self-explanatory form by eliminating the time
 $\unicode[STIX]{x1D70F}_{b}$ (in the lower bound of the integral) in favour of
 $\overline{\unicode[STIX]{x1D701}}_{b}$,
 $$\begin{eqnarray}\displaystyle z(\unicode[STIX]{x1D701},\unicode[STIX]{x1D70F})=\int _{\unicode[STIX]{x1D701}-\unicode[STIX]{x1D70F}+\unicode[STIX]{x1D70F}_{b}=\overline{\unicode[STIX]{x1D701}}_{b}}^{\unicode[STIX]{x1D701}}f(\unicode[STIX]{x1D701}^{\prime },\,\,\unicode[STIX]{x1D70F}+\unicode[STIX]{x1D701}^{\prime }-\unicode[STIX]{x1D701})\,\text{d}\unicode[STIX]{x1D701}^{\prime }+z_{b}(\unicode[STIX]{x1D70F}-\unicode[STIX]{x1D701}+\overline{\unicode[STIX]{x1D701}}_{b}). & & \displaystyle\end{eqnarray}$$
Taking  $\unicode[STIX]{x1D701}=0$ leads to the self-explanatory form,
 $$\begin{eqnarray}\displaystyle \unicode[STIX]{x1D701}=0,\quad \overline{\unicode[STIX]{x1D701}}_{b}<0:\quad z(0,\unicode[STIX]{x1D70F})=\int _{\overline{\unicode[STIX]{x1D701}}_{b}}^{0}f(\unicode[STIX]{x1D701}^{\prime },\,\,\unicode[STIX]{x1D70F}+\unicode[STIX]{x1D701}^{\prime })\,\text{d}\unicode[STIX]{x1D701}^{\prime }+z_{b}(\unicode[STIX]{x1D70F}-|\overline{\unicode[STIX]{x1D701}}_{b}|), & & \displaystyle\end{eqnarray}$$
where  $\unicode[STIX]{x1D70F}+\overline{\unicode[STIX]{x1D701}}_{b}=\unicode[STIX]{x1D70F}_{b}$ since
 $\unicode[STIX]{x1D701}=0$, so that
 $z_{b}(\unicode[STIX]{x1D70F}-|\overline{\unicode[STIX]{x1D701}}_{b}|)=z_{b}(\unicode[STIX]{x1D70F}_{b})$, the function
 $z_{b}(\unicode[STIX]{x1D70F})$ in the boundary condition (B 1) being given.
Consider now the case of a moving boundary. If  $\overline{\unicode[STIX]{x1D701}}_{b}$ in (B 1) is replaced by a known function of the time
 $\unicode[STIX]{x1D701}_{b}(\unicode[STIX]{x1D70F})$,
 $$\begin{eqnarray}\displaystyle \unicode[STIX]{x1D701}=\unicode[STIX]{x1D701}_{b}(\unicode[STIX]{x1D70F}):\quad z(\unicode[STIX]{x1D701}_{b}(\unicode[STIX]{x1D70F}),\unicode[STIX]{x1D70F})=z_{b}(\unicode[STIX]{x1D70F})>0, & & \displaystyle\end{eqnarray}$$
the solution is still given by (B 2) in which  $\unicode[STIX]{x1D70F}_{b}$ is a function of
 $\unicode[STIX]{x1D70F}-\unicode[STIX]{x1D701}$ obtained from the intersection of the curve
 $\unicode[STIX]{x1D701}^{\prime }=\unicode[STIX]{x1D701}_{b}(\unicode[STIX]{x1D70F}^{\prime })$ and the characteristic curve going through the point (
 $\unicode[STIX]{x1D701},\,\unicode[STIX]{x1D70F}$) in the phase space
 $\unicode[STIX]{x1D701}^{\prime }=\unicode[STIX]{x1D70F}^{\prime }+(\unicode[STIX]{x1D701}-\unicode[STIX]{x1D70F})$ so that
 $\unicode[STIX]{x1D70F}_{b}$ is the root of the equation
 $$\begin{eqnarray}\displaystyle \unicode[STIX]{x1D701}_{b}(\unicode[STIX]{x1D70F}_{b})-\unicode[STIX]{x1D70F}_{b}=\unicode[STIX]{x1D701}-\unicode[STIX]{x1D70F}\quad \Rightarrow \quad \unicode[STIX]{x1D70F}_{b}(\unicode[STIX]{x1D70F}-\unicode[STIX]{x1D701}), & & \displaystyle\end{eqnarray}$$
showing that  $\unicode[STIX]{x1D70F}_{b}$ and thus
 $\unicode[STIX]{x1D701}_{b}(\unicode[STIX]{x1D70F}_{b})$ are functions of
 $\unicode[STIX]{x1D70F}-\unicode[STIX]{x1D701}$, see figure 7. Then the solution is obtained from (B 2) and/or (B 4) in which
 $\overline{\unicode[STIX]{x1D701}}_{b}$ is replaced by
 $\unicode[STIX]{x1D701}_{b}(\unicode[STIX]{x1D70F}_{b})$,
 $$\begin{eqnarray}\displaystyle & \displaystyle z(\unicode[STIX]{x1D701},\unicode[STIX]{x1D70F})=\int _{\unicode[STIX]{x1D70F}_{b}}^{\unicode[STIX]{x1D70F}}f(\unicode[STIX]{x1D701}-\unicode[STIX]{x1D70F}+\unicode[STIX]{x1D70F}^{\prime },\unicode[STIX]{x1D70F}^{\prime })\,\text{d}\unicode[STIX]{x1D70F}^{\prime }+z_{b}(\unicode[STIX]{x1D70F}-\unicode[STIX]{x1D701}+\unicode[STIX]{x1D701}_{b}(\unicode[STIX]{x1D70F}_{b})) & \displaystyle\end{eqnarray}$$
 $$\begin{eqnarray}\displaystyle & \displaystyle z(\unicode[STIX]{x1D701},\unicode[STIX]{x1D70F})=\int _{\unicode[STIX]{x1D701}_{b}(\unicode[STIX]{x1D70F}_{b})}^{\unicode[STIX]{x1D701}}f(\unicode[STIX]{x1D701}^{\prime },\,\unicode[STIX]{x1D701}^{\prime }+\unicode[STIX]{x1D70F}-\unicode[STIX]{x1D701})\,\text{d}\unicode[STIX]{x1D701}^{\prime }+z_{b}(\unicode[STIX]{x1D70F}_{b}), & \displaystyle\end{eqnarray}$$
where the relations  $z_{b}(\unicode[STIX]{x1D70F}-\unicode[STIX]{x1D701}+\unicode[STIX]{x1D701}_{b}(\unicode[STIX]{x1D70F}_{b}))=z(\unicode[STIX]{x1D701}_{b}(\unicode[STIX]{x1D70F}_{b}),\unicode[STIX]{x1D70F}-\unicode[STIX]{x1D709}+\unicode[STIX]{x1D701}_{b}(\unicode[STIX]{x1D70F}_{b}))$ and
 $\unicode[STIX]{x1D70F}-\unicode[STIX]{x1D701}+\unicode[STIX]{x1D701}_{b}(\unicode[STIX]{x1D70F}_{b})=\unicode[STIX]{x1D70F}_{b}$ have been used.
Determination of  $\unicode[STIX]{x1D70F}_{b}$ from the intersection of the characteristic curve in blue going through the point (
 $\unicode[STIX]{x1D701},\,\unicode[STIX]{x1D70F}$)
 $\unicode[STIX]{x1D701}^{\prime }-\unicode[STIX]{x1D70F}^{\prime }=\unicode[STIX]{x1D701}-\unicode[STIX]{x1D70F}$ with the curve
 $\unicode[STIX]{x1D701}^{\prime }=\unicode[STIX]{x1D701}_{b}(\unicode[STIX]{x1D70F}^{\prime })$ in red.

If the right-hand side of the first equation (B 1) depends on  $\unicode[STIX]{x1D70F}$ through an unknown function
 $y(\unicode[STIX]{x1D70F})$,
 $f(\unicode[STIX]{x1D701},\unicode[STIX]{x1D70F})=F(\unicode[STIX]{x1D701},y(\unicode[STIX]{x1D70F}))>0$, an integral equation for
 $y(\unicode[STIX]{x1D70F})$ is obtained when an additional boundary condition is imposed on
 $z(\unicode[STIX]{x1D701},\unicode[STIX]{x1D70F})$, for example at
 $\unicode[STIX]{x1D701}=0$,
 $z(0,\unicode[STIX]{x1D70F})=z_{N}(y(\unicode[STIX]{x1D70F}))$ where
 $z_{N}(y)$ is a given function,
 $$\begin{eqnarray}\displaystyle z_{N}(y(\unicode[STIX]{x1D70F}))=\int _{\unicode[STIX]{x1D701}_{b}(\unicode[STIX]{x1D70F}_{b})}^{0}F(\unicode[STIX]{x1D701}^{\prime },y(\unicode[STIX]{x1D70F}+\unicode[STIX]{x1D701}^{\prime }))\,\text{d}\unicode[STIX]{x1D701}^{\prime }+z_{b}(\unicode[STIX]{x1D70F}_{b}),\quad \unicode[STIX]{x1D70F}_{b}=\unicode[STIX]{x1D70F}+\unicode[STIX]{x1D701}_{b}(\unicode[STIX]{x1D70F}_{b})<\unicode[STIX]{x1D70F}, & & \displaystyle\end{eqnarray}$$
where the expression of  $\unicode[STIX]{x1D70F}_{b}$ is valid for
 $\unicode[STIX]{x1D701}=0$.
Appendix C. Dynamics of planar detonations for small heat release
The dynamics of planar detonations is briefly revisited here in the small heat limit (4.14). The corresponding stability analysis against planar disturbances was first performed by Clavin & Williams (Reference Clavin and Williams2002) for a smooth distribution of reaction rate. Here, attention is focused on the model (3.17)–(5.10) with (3.16) for which the reaction rate drops sharply to zero at the end of the reaction zone. Including the response to fluctuations of the flow of burnt gas, the flow field  $\unicode[STIX]{x1D707}(\unicode[STIX]{x1D709},\unicode[STIX]{x1D70F})$ is described by (3.10)–(3.11) with
 $\unicode[STIX]{x1D705}=0$, yielding with the notation
 $y/b\equiv \dot{\unicode[STIX]{x1D6FC}}_{\unicode[STIX]{x1D70F}}$
 $$\begin{eqnarray}\displaystyle \unicode[STIX]{x1D709}_{b}\leqslant \unicode[STIX]{x1D709}\leqslant 0:\quad \frac{\unicode[STIX]{x2202}\unicode[STIX]{x1D707}}{\unicode[STIX]{x2202}\unicode[STIX]{x1D70F}}+\left(\unicode[STIX]{x1D707}-\frac{y}{b}\right)\frac{\unicode[STIX]{x2202}\unicode[STIX]{x1D707}}{\unicode[STIX]{x2202}\unicode[STIX]{x1D709}}=\frac{1}{2}\unicode[STIX]{x1D714}(\unicode[STIX]{x1D709},y(\unicode[STIX]{x1D70F})),\quad \unicode[STIX]{x1D714}(\unicode[STIX]{x1D709},y)=\text{e}^{y}\unicode[STIX]{x1D714}_{o_{CJ}}(\unicode[STIX]{x1D709}\text{e}^{y})>0,\end{eqnarray}$$
 $$\begin{eqnarray}\unicode[STIX]{x1D709}=0:\quad \unicode[STIX]{x1D707}=1+2y(\unicode[STIX]{x1D70F})/b,\quad \unicode[STIX]{x1D709}=\unicode[STIX]{x1D709}_{b}=-\text{e}^{-y(\unicode[STIX]{x1D70F})}:\quad \unicode[STIX]{x1D707}=\unicode[STIX]{x1D707}_{b}(\unicode[STIX]{x1D70F}),\,\,0<y/b\leqslant \unicode[STIX]{x1D707}_{b}\ll 1,\end{eqnarray}$$
where the reduced velocity at the exit of the reaction zone  $\unicode[STIX]{x1D707}_{b}(\unicode[STIX]{x1D70F})$ is a given function of the time and
 $\unicode[STIX]{x1D714}_{o_{CJ}}(\unicode[STIX]{x1D709})>0$,
 $\int _{-1}^{0}\unicode[STIX]{x1D714}_{o_{CJ}}(\unicode[STIX]{x1D709})\,\text{d}\unicode[STIX]{x1D709}=1$, denotes the reduced distribution of the rate of heat release in the planar CJ wave (
 $\unicode[STIX]{x1D707}_{b}=0$ and
 $\overline{y}=0$) in steady state.
C.1 Planar overdriven detonations in steady state
Planar overdriven detonations in steady state,  $y=\overline{y}_{o}$,
 $\unicode[STIX]{x1D707}=\overline{\unicode[STIX]{x1D707}}_{o}(\unicode[STIX]{x1D709},\overline{y}_{o})$,
 $\unicode[STIX]{x2202}\overline{y}_{o}/\unicode[STIX]{x2202}\unicode[STIX]{x1D70F}=0$,
 $\unicode[STIX]{x2202}\overline{\unicode[STIX]{x1D707}}_{o}/\unicode[STIX]{x2202}\unicode[STIX]{x1D70F}=0$,
 $\unicode[STIX]{x1D707}_{b}=\overline{\unicode[STIX]{x1D707}}_{ob}=\text{const.}$,
 $\overline{\unicode[STIX]{x1D707}}_{ob}-\overline{y}_{o}/b>0$ (subsonic condition), are solutions to
 $$\begin{eqnarray}\left(\overline{\unicode[STIX]{x1D707}}_{o}-\frac{\overline{y}_{o}}{b}\right)\,\frac{\text{d}\overline{\unicode[STIX]{x1D707}}_{o}}{\text{d}\unicode[STIX]{x1D709}}=\frac{1}{2}\text{e}^{\overline{y}_{o}}\unicode[STIX]{x1D714}_{o_{CJ}}(\unicode[STIX]{x1D709}\,\text{e}^{\overline{y}_{o}})\end{eqnarray}$$
 $$\begin{eqnarray}\unicode[STIX]{x1D709}=0:\quad \overline{\unicode[STIX]{x1D707}}_{o}=1+2\overline{y}_{o}/b,\quad \unicode[STIX]{x1D709}=-\text{e}^{-\overline{y}_{o}}:\quad \overline{\unicode[STIX]{x1D707}}_{o}=\overline{\unicode[STIX]{x1D707}}_{ob}.\end{eqnarray}$$
Introducing the velocity profile of the CJ wave  $\unicode[STIX]{x1D707}_{o_{CJ}}(\unicode[STIX]{x1D709})=\sqrt{\int _{-1}^{\unicode[STIX]{x1D709}}\unicode[STIX]{x1D714}_{o_{CJ}}(\unicode[STIX]{x1D709}^{\prime })\,\text{d}\unicode[STIX]{x1D709}^{\prime }}$ and using the relation
 $\int _{\unicode[STIX]{x1D709}}^{0}\text{e}^{\overline{y}}\unicode[STIX]{x1D714}_{o_{CJ}}(\unicode[STIX]{x1D709}^{\prime }\text{e}^{\overline{y}})\,\text{d}\unicode[STIX]{x1D709}^{\prime }=\int _{\unicode[STIX]{x1D709}\text{e}^{\overline{y}}}^{0}\unicode[STIX]{x1D714}_{o_{CJ}}(\unicode[STIX]{x1D709}^{\prime \prime })\,\text{d}\unicode[STIX]{x1D709}^{\prime \prime }$, integration of (C 3) from the exit of the reaction zone yields
 $$\begin{eqnarray}\displaystyle \overline{\unicode[STIX]{x1D707}}_{o}(\unicode[STIX]{x1D709})-\overline{y}_{o}/b & = & \displaystyle \sqrt{(\overline{\unicode[STIX]{x1D707}}_{ob}-\overline{y}_{o}/b)^{2}+\unicode[STIX]{x1D707}_{o_{CJ}}^{2}(\unicode[STIX]{x1D709}\text{e}^{\overline{y}_{o}})}.\end{eqnarray}$$
For overdriven detonations  $(\overline{\unicode[STIX]{x1D707}}_{ob}-\overline{y}_{o}/b)>0$, the model (5.9)–(5.10) leads to the following behaviour of the distribution
 $\overline{\unicode[STIX]{x1D707}}_{o}(\unicode[STIX]{x1D709})$ at the end of the reaction zone
 $0<(\unicode[STIX]{x1D709}+\text{e}^{-\overline{y}_{o}})\ll 1$ of
 $$\begin{eqnarray}\displaystyle & \displaystyle \unicode[STIX]{x1D709}<-\text{e}^{-\overline{y}_{o}}:\quad \overline{\unicode[STIX]{x1D707}}_{o}(\unicode[STIX]{x1D709})=\overline{\unicode[STIX]{x1D707}}_{ob},\,\,\text{d}\overline{\unicode[STIX]{x1D707}}_{o}/\text{d}\unicode[STIX]{x1D709}=0 & \displaystyle\end{eqnarray}$$
 $$\begin{eqnarray}\displaystyle & \displaystyle (\overline{\unicode[STIX]{x1D707}}_{ob}-\overline{y}_{o}/b)>0,\quad 0<\unicode[STIX]{x1D709}\text{e}^{\overline{y}_{o}}+1\ll 1:\quad \overline{\unicode[STIX]{x1D707}}_{o}(\unicode[STIX]{x1D709})-\overline{\unicode[STIX]{x1D707}}_{ob}\approx \frac{a^{2}/2}{(\overline{\unicode[STIX]{x1D707}}_{ob}-\overline{y}_{o}/b)}(\unicode[STIX]{x1D709}\text{e}^{\overline{y}_{o}}+1)^{2},\quad & \displaystyle\end{eqnarray}$$
showing the existence of a thin layer at the end of the reaction zone of thickness  $\sqrt{\overline{\unicode[STIX]{x1D707}}_{ob}}$ if the detonation is weakly overdriven
 $0<\overline{\unicode[STIX]{x1D707}}_{ob}-\overline{y}_{o}/b\ll 1$. In the limit
 $\overline{\unicode[STIX]{x1D707}}_{ob}\rightarrow 0^{+}$, the derivative
 $\text{d}\overline{\unicode[STIX]{x1D707}}_{o}/\text{d}\unicode[STIX]{x1D709}$ degenerates into the singularity (5.9)–(5.10) of
 $\text{d}\unicode[STIX]{x1D707}_{o_{CJ}}(\unicode[STIX]{x1D709})/\text{d}\unicode[STIX]{x1D709}$ at
 $\unicode[STIX]{x1D709}=-1$ for the planar CJ wave. The propagation velocity
 $\overline{y}_{o}$ is obtained and expressed in terms of the flow velocity at the exit of the reaction zone
 $\overline{\unicode[STIX]{x1D707}}_{ob}$ by the boundary condition at the Neumann state,
 $1+\overline{y}_{o}/b=\sqrt{(\overline{\unicode[STIX]{x1D707}}_{ob}-\overline{y}_{o}/b)^{2}+1}$
 $$\begin{eqnarray}\displaystyle \overline{y}_{o}=(1+\overline{\unicode[STIX]{x1D707}}_{ob})^{-1}b\,\overline{\unicode[STIX]{x1D707}}_{ob}^{2}/2,\quad \overline{y}_{o}/b\ll 1\Rightarrow \overline{y}_{o}\approx b\,\overline{\unicode[STIX]{x1D707}}_{ob}^{2}/2=O(1), & & \displaystyle\end{eqnarray}$$
the last relation in (C 8) corresponding to a weakly overdriven regime at the leading order in the limit (4.14),  $\overline{y}_{o}=O(1)\Leftrightarrow 0<\overline{\unicode[STIX]{x1D707}}_{ob}=O(1/\sqrt{b})$.
C.2 Planar dynamics of overdriven detonations
Subtracting (C 3) from (C 1) takes the form, when using the notation  $y(\unicode[STIX]{x1D70F})=\overline{y}_{o}+\unicode[STIX]{x1D6FF}y(\unicode[STIX]{x1D70F})$,
 $\unicode[STIX]{x1D707}(\unicode[STIX]{x1D709},\unicode[STIX]{x1D70F})=\overline{\unicode[STIX]{x1D707}}_{o}(\unicode[STIX]{x1D709})+\unicode[STIX]{x1D6FF}\unicode[STIX]{x1D707}(\unicode[STIX]{x1D709},\unicode[STIX]{x1D70F})$,
 $$\begin{eqnarray}\displaystyle & \displaystyle \frac{\unicode[STIX]{x2202}\unicode[STIX]{x1D6FF}\unicode[STIX]{x1D707}}{\unicode[STIX]{x2202}\unicode[STIX]{x1D70F}}+\frac{\unicode[STIX]{x2202}}{\unicode[STIX]{x2202}\unicode[STIX]{x1D709}}\left[\left(\overline{\unicode[STIX]{x1D707}}_{o}-\frac{\overline{y}_{o}}{b}\right)\unicode[STIX]{x1D6FF}\unicode[STIX]{x1D707}+\frac{1}{2}\unicode[STIX]{x1D6FF}\unicode[STIX]{x1D707}^{2}\right]=\frac{1}{2}\unicode[STIX]{x0394}\unicode[STIX]{x1D714}(\unicode[STIX]{x1D709},y)+\frac{\text{d}\overline{\unicode[STIX]{x1D707}}_{o}}{\text{d}\unicode[STIX]{x1D709}}\frac{\unicode[STIX]{x1D6FF}y}{b}+\frac{\unicode[STIX]{x1D6FF}y}{b}\frac{\unicode[STIX]{x2202}\unicode[STIX]{x1D6FF}\unicode[STIX]{x1D707}}{\unicode[STIX]{x2202}\unicode[STIX]{x1D709}}, & \displaystyle\end{eqnarray}$$
 $$\begin{eqnarray}\displaystyle & \displaystyle \text{where}\quad \unicode[STIX]{x0394}\unicode[STIX]{x1D714}(\unicode[STIX]{x1D709},y)\equiv \left[\text{e}^{y}\unicode[STIX]{x1D714}_{o_{CJ}}(\unicode[STIX]{x1D709}\text{e}^{y})-\text{e}^{\overline{y}_{o}}\unicode[STIX]{x1D714}_{o_{CJ}}(\unicode[STIX]{x1D709}\,\text{e}^{\overline{y}_{o}})\right]. & \displaystyle\end{eqnarray}$$
The fluctuation of the propagation velocity  $\unicode[STIX]{x1D6FF}y(\unicode[STIX]{x1D70F})$ is obtained by solving (C 9) with the boundary conditions (C 2) and (C 4). For a uniform velocity fluctuating in the burnt gas
 $\unicode[STIX]{x1D707}_{b}(\unicode[STIX]{x1D70F})=\overline{\unicode[STIX]{x1D707}}_{ob}+\unicode[STIX]{x1D6FF}\unicode[STIX]{x1D707}_{b}(\unicode[STIX]{x1D70F})$ where
 $\overline{\unicode[STIX]{x1D707}}_{ob}=\overline{\unicode[STIX]{x1D707}}(-\text{e}^{-\overline{y}_{o}})$, the condition at the exit of the reaction zone
 $\unicode[STIX]{x1D707}(-\text{e}^{-y})=\unicode[STIX]{x1D707}_{b}(\unicode[STIX]{x1D70F})$ yields
 $\overline{\unicode[STIX]{x1D707}}_{o}(-\text{e}^{-y})+\unicode[STIX]{x1D6FF}\unicode[STIX]{x1D707}(-\text{e}^{-y},\unicode[STIX]{x1D70F})=\unicode[STIX]{x1D707}_{b}(\unicode[STIX]{x1D70F})$, so that the boundary conditions (C 4) takes the form
 $$\begin{eqnarray}\unicode[STIX]{x1D6FF}\unicode[STIX]{x1D707}(0,\unicode[STIX]{x1D70F})=2\,\unicode[STIX]{x1D6FF}y(\unicode[STIX]{x1D70F})/b,\quad \unicode[STIX]{x1D6FF}\unicode[STIX]{x1D707}(-\text{e}^{-y(\unicode[STIX]{x1D70F})},\unicode[STIX]{x1D70F})=\unicode[STIX]{x1D6FF}\unicode[STIX]{x1D707}_{b}(\unicode[STIX]{x1D70F})-[\overline{\unicode[STIX]{x1D707}}_{o}(-\text{e}^{-y(\unicode[STIX]{x1D70F})})-\overline{\unicode[STIX]{x1D707}}_{o}(-\text{e}^{-\overline{y}_{o}})].\end{eqnarray}$$
According to (C 6)–(C 7), the expression in the brackets in (C 11) depends on the sign of  $\unicode[STIX]{x1D6FF}y\equiv y(\unicode[STIX]{x1D70F})-\overline{y}_{o}$ since
 $\overline{\unicode[STIX]{x1D707}}_{o}(-\text{e}^{-y(\unicode[STIX]{x1D70F})})=\overline{\unicode[STIX]{x1D707}}_{o}(-\text{e}^{-\overline{y}_{o}})$ for
 $\unicode[STIX]{x1D6FF}y\leqslant 0$ so that
 $\unicode[STIX]{x1D6FF}\unicode[STIX]{x1D707}(-\text{e}^{-y(\unicode[STIX]{x1D70F})},\unicode[STIX]{x1D70F})=\unicode[STIX]{x1D6FF}\unicode[STIX]{x1D707}_{b}(\unicode[STIX]{x1D70F})$ while the expression in the brackets in (C 11) is different from zero if
 $\unicode[STIX]{x1D6FF}y>0$ and is continuous and equal to zero at
 $\unicode[STIX]{x1D6FF}y=0$ (
 $y(\unicode[STIX]{x1D70F})=\overline{y}_{o}$). According to (3.17), a similar behaviour characterizes the reaction term (C 10),
 $\unicode[STIX]{x1D709}\text{e}^{\overline{y}_{o}}\leqslant -1:\unicode[STIX]{x0394}\unicode[STIX]{x1D714}=\text{e}^{y}\unicode[STIX]{x1D714}_{o_{CJ}}(\unicode[STIX]{x1D709}\text{e}^{y})>0$ in the intermediate range
 $-\text{e}^{-y}<\unicode[STIX]{x1D709}<-\text{e}^{-\overline{y}_{o}}$ for
 $\unicode[STIX]{x1D6FF}y<0$. The expression for
 $\unicode[STIX]{x0394}\unicode[STIX]{x1D714}(\unicode[STIX]{x1D709},y)$ is different for
 $\unicode[STIX]{x1D6FF}y>0$ in the range
 $-\text{e}^{-\overline{y}_{o}}<\unicode[STIX]{x1D709}<-\text{e}^{-y}$ where
 $\unicode[STIX]{x0394}\unicode[STIX]{x1D714}=-\text{e}^{\overline{y}_{o}}\unicode[STIX]{x1D714}_{o_{CJ}}(\unicode[STIX]{x1D709}\,\text{e}^{\overline{y}_{o}})<0$ but
 $\unicode[STIX]{x0394}\unicode[STIX]{x1D714}(\unicode[STIX]{x1D709},y)\equiv 0$
 $\forall \unicode[STIX]{x1D709}$ when
 $\unicode[STIX]{x1D6FF}y=0$.
In the linear approximation  $y(\unicode[STIX]{x1D70F})=\overline{y}_{o}+\unicode[STIX]{x1D6FF}y(\unicode[STIX]{x1D70F})$ with
 $|\unicode[STIX]{x1D6FF}y|/\overline{y}_{o}\ll 1$, according to (C 11), the boundary condition at the end of the reaction zone reduces to
 $$\begin{eqnarray}\displaystyle \unicode[STIX]{x1D6FF}\unicode[STIX]{x1D707}(-\text{e}^{-y},\unicode[STIX]{x1D70F})=\unicode[STIX]{x1D6FF}\unicode[STIX]{x1D707}(-\text{e}^{-\overline{y}_{o}},\unicode[STIX]{x1D70F})=\unicode[STIX]{x1D6FF}\unicode[STIX]{x1D707}_{b}(\unicode[STIX]{x1D70F}), & & \displaystyle\end{eqnarray}$$
since, according to (C 7),  $\text{d}\overline{\unicode[STIX]{x1D707}}_{o}/\text{d}\unicode[STIX]{x1D709}|_{(\unicode[STIX]{x1D709}+\text{e}^{-\overline{y}_{o}})=0^{+}}$ =
 $\text{d}\overline{\unicode[STIX]{x1D707}}_{o}/\text{d}\unicode[STIX]{x1D709}|_{(\unicode[STIX]{x1D709}+\text{e}^{-\overline{y}_{o}})=0^{-}}=0$, so that the brackets in (C 11) introduce a quadratic term. Moreover, the amplitude of the fluctuation of the position of the end of the reaction is limited to the thin layer mentioned below (C 7). Consider the transit time
 $\int _{\unicode[STIX]{x1D709}}^{0}\text{d}\unicode[STIX]{x1D709}^{\prime }/[\overline{\unicode[STIX]{x1D707}}_{o}(\unicode[STIX]{x1D709}^{\prime })-\overline{y}_{o}/b]$ of the upward-running acoustic mode for propagating disturbances from a point
 $\unicode[STIX]{x1D709}<0$ to the lead shock
 $\unicode[STIX]{x1D709}=0$. For overdriven detonations, focusing attention on
 $\overline{\unicode[STIX]{x1D707}}_{o}(\unicode[STIX]{x1D709})>0$ larger than
 $1/b$, see (C 8), and neglecting correction of order
 $1/b$, the transit time can be written as the absolute value of a new coordinate system
 $\overline{\unicode[STIX]{x1D701}}_{o}(\unicode[STIX]{x1D709})$,
 $$\begin{eqnarray}\overline{\unicode[STIX]{x1D701}}_{o}(\unicode[STIX]{x1D709})\equiv -\int _{\unicode[STIX]{x1D709}}^{0}\text{d}\unicode[STIX]{x1D709}^{\prime }/\overline{\unicode[STIX]{x1D707}}_{o}(\unicode[STIX]{x1D709}^{\prime })\leqslant 0,\quad \overline{\unicode[STIX]{x1D701}}_{ob}\equiv \overline{\unicode[STIX]{x1D701}}_{o}(-\text{e}^{-\overline{y}_{o}})=-\int _{-\text{e}^{-\overline{y}_{o}}}^{0}\text{d}\unicode[STIX]{x1D709}^{\prime }/\overline{\unicode[STIX]{x1D707}}_{o}(\unicode[STIX]{x1D709}^{\prime })<0.\end{eqnarray}$$
The distribution  $\overline{\unicode[STIX]{x1D707}}_{o}(\unicode[STIX]{x1D709})$ being a positive function increasing monotonically with
 $\unicode[STIX]{x1D709}$ inside the inner structure
 $\unicode[STIX]{x1D709}\in [-\text{e}^{-\overline{y}_{o}},0]$, the relation between
 $\unicode[STIX]{x1D709}$ and
 $\overline{\unicode[STIX]{x1D701}}_{o}$ is bijective and the inverse function
 $\unicode[STIX]{x1D709}(\overline{\unicode[STIX]{x1D701}}_{o})$ is well defined. The transit time from the end of the reaction zone to the lead shock is
 $|\overline{\unicode[STIX]{x1D701}}_{ob}|$ and one has
 $\overline{\unicode[STIX]{x1D701}}_{ob}\leqslant \overline{\unicode[STIX]{x1D701}}_{o}(\unicode[STIX]{x1D709})\leqslant 0$ for
 $-\text{e}^{-\overline{y}_{o}}\leqslant \unicode[STIX]{x1D709}\leqslant 0$ while
 $$\begin{eqnarray}\unicode[STIX]{x1D709}\leqslant -\text{e}^{-\overline{y}_{o}}:\quad \overline{\unicode[STIX]{x1D701}}_{o}(\unicode[STIX]{x1D709})=\overline{\unicode[STIX]{x1D701}}_{ob}+(\unicode[STIX]{x1D709}\text{e}^{\overline{y}_{o}}+1)\text{e}^{-\overline{y}_{o}}/\overline{\unicode[STIX]{x1D707}}_{ob},\end{eqnarray}$$
since  $\text{e}^{\overline{y}_{o}}\unicode[STIX]{x1D714}_{o_{CJ}}(\unicode[STIX]{x1D709}\,\text{e}^{\overline{y}_{o}})=0$ and
 $\overline{\unicode[STIX]{x1D707}}_{o}(\unicode[STIX]{x1D709})=\overline{\unicode[STIX]{x1D707}}_{ob}$.
When the term  $-(\overline{y}_{o}/b)\unicode[STIX]{x2202}\unicode[STIX]{x1D6FF}\unicode[STIX]{x1D707}/\unicode[STIX]{x1D6FF}\unicode[STIX]{x1D709}$ is neglected in front of
 $\overline{\unicode[STIX]{x1D707}}_{o}\,\unicode[STIX]{x2202}\unicode[STIX]{x1D6FF}\unicode[STIX]{x1D707}/\unicode[STIX]{x1D6FF}\unicode[STIX]{x1D709}$, linearization of (C 9) and (C 11) after multiplication by
 $\overline{\unicode[STIX]{x1D707}}_{o}(\unicode[STIX]{x1D709})$ yields, according to (C 12),
 $$\begin{eqnarray}\frac{\unicode[STIX]{x2202}(\overline{\unicode[STIX]{x1D707}}_{o}\,\unicode[STIX]{x1D6FF}\unicode[STIX]{x1D707})}{\unicode[STIX]{x2202}\unicode[STIX]{x1D70F}}+\frac{\unicode[STIX]{x2202}(\overline{\unicode[STIX]{x1D707}}_{o}\,\unicode[STIX]{x1D6FF}\unicode[STIX]{x1D707})}{\unicode[STIX]{x2202}\overline{\unicode[STIX]{x1D701}}_{o}}=f(\unicode[STIX]{x1D709},y),\quad f(\unicode[STIX]{x1D709},y)\equiv \overline{\unicode[STIX]{x1D707}}_{o}(\unicode[STIX]{x1D709})\left[\frac{1}{2}\unicode[STIX]{x0394}\unicode[STIX]{x1D714}(\unicode[STIX]{x1D709},y)+\frac{1}{b}\frac{\text{d}\overline{\unicode[STIX]{x1D707}}_{o}}{\text{d}\unicode[STIX]{x1D709}}\unicode[STIX]{x1D6FF}y\right]\end{eqnarray}$$
 $$\begin{eqnarray}\unicode[STIX]{x1D709}=0:\quad \unicode[STIX]{x1D6FF}\unicode[STIX]{x1D707}=2\,\unicode[STIX]{x1D6FF}y(\unicode[STIX]{x1D70F})/b,\quad \unicode[STIX]{x1D709}=-\text{e}^{-y(\unicode[STIX]{x1D70F})}:\quad \unicode[STIX]{x1D6FF}\unicode[STIX]{x1D707}=\unicode[STIX]{x1D6FF}\unicode[STIX]{x1D707}_{b}(\unicode[STIX]{x1D70F}),\end{eqnarray}$$
where  $\unicode[STIX]{x1D709}$ in
 $f(\unicode[STIX]{x1D709},y)$ is a function of
 $\overline{\unicode[STIX]{x1D701}}_{o}$,
 $\unicode[STIX]{x1D709}(\overline{\unicode[STIX]{x1D701}}_{o})$ obtained by inversion of (C 13). Using the relation
 $\text{d}\overline{\unicode[STIX]{x1D701}}_{o}(\unicode[STIX]{x1D709})=\text{d}\unicode[STIX]{x1D709}/\overline{\unicode[STIX]{x1D707}}_{o}(\unicode[STIX]{x1D709})$, the instantaneous propagation velocity
 $\unicode[STIX]{x1D6FF}y(\unicode[STIX]{x1D70F})$ obtained from (C 15)–(C 16) is, according to (B 12), the solution to the following integral equation,
 $$\begin{eqnarray}\displaystyle 2\overline{\unicode[STIX]{x1D707}}_{o}(0)\unicode[STIX]{x1D6FF}y(\unicode[STIX]{x1D70F}) & = & \displaystyle \int _{-\text{e}^{-y(\unicode[STIX]{x1D70F}_{b})}}^{0}\left[\frac{b}{2}\unicode[STIX]{x0394}\unicode[STIX]{x1D714}(\unicode[STIX]{x1D709},y(\unicode[STIX]{x1D70F}+\overline{\unicode[STIX]{x1D701}}_{o}(\unicode[STIX]{x1D709})))+\frac{\text{d}\overline{\unicode[STIX]{x1D707}}_{o}}{\text{d}\unicode[STIX]{x1D709}}\unicode[STIX]{x1D6FF}y(\unicode[STIX]{x1D70F}+\overline{\unicode[STIX]{x1D701}}_{o}(\unicode[STIX]{x1D709}))\right]\,\text{d}\unicode[STIX]{x1D709}\nonumber\\ \displaystyle & & \displaystyle +\,b\overline{\unicode[STIX]{x1D707}}_{ob}\unicode[STIX]{x1D6FF}\unicode[STIX]{x1D707}_{b}(\unicode[STIX]{x1D70F}+\overline{\unicode[STIX]{x1D701}}_{o}(-\text{e}^{-y(\unicode[STIX]{x1D70F}_{b})})),\end{eqnarray}$$
where  $\unicode[STIX]{x1D70F}_{b}=\unicode[STIX]{x1D70F}+\overline{\unicode[STIX]{x1D701}}_{o}(-\text{e}^{-y(\unicode[STIX]{x1D70F}_{b})})$. In the linear approximation
 $$\begin{eqnarray}\displaystyle & \displaystyle y(\unicode[STIX]{x1D70F}_{b})\approx \overline{y}_{o}+\unicode[STIX]{x1D6FF}y(\unicode[STIX]{x1D70F}+\overline{\unicode[STIX]{x1D701}}_{ob})\approx y(\unicode[STIX]{x1D70F}+\overline{\unicode[STIX]{x1D701}}_{ob}), & \displaystyle\end{eqnarray}$$
 $$\begin{eqnarray}\displaystyle & \displaystyle -\text{e}^{-y(\unicode[STIX]{x1D70F}_{b})}\approx -\text{e}^{-y(\unicode[STIX]{x1D70F}+\overline{\unicode[STIX]{x1D701}}_{ob})}\approx -\text{e}^{-\overline{y}_{o}}[1-\unicode[STIX]{x1D6FF}y(\unicode[STIX]{x1D70F}+\overline{\unicode[STIX]{x1D701}}_{ob})], & \displaystyle\end{eqnarray}$$
where  $\unicode[STIX]{x1D701}_{ob}\equiv \overline{\unicode[STIX]{x1D701}}_{o}(-\text{e}^{-\overline{y}_{o}})$, the function
 $\unicode[STIX]{x1D6FF}\unicode[STIX]{x1D707}_{b}(\unicode[STIX]{x1D70F}+\overline{\unicode[STIX]{x1D701}}_{o}(-\text{e}^{-y(\unicode[STIX]{x1D70F}_{b})}))$ in the last term on the right-hand side of (C 17) can be replaced by
 $\unicode[STIX]{x1D6FF}\unicode[STIX]{x1D707}_{b}(\unicode[STIX]{x1D70F}+\overline{\unicode[STIX]{x1D701}}_{ob})$ and the lower bound of the integral can be replaced by
 $-\text{e}^{-y(\unicode[STIX]{x1D70F}+\overline{\unicode[STIX]{x1D701}}_{ob})}$. Consider first the case
 $\unicode[STIX]{x1D6FF}y(\unicode[STIX]{x1D70F}+\overline{\unicode[STIX]{x1D701}}_{ob})<0$,
 $y(\unicode[STIX]{x1D70F}+\overline{\unicode[STIX]{x1D701}}_{ob})<\overline{y}_{o}$,
 $-\text{e}^{-y(\unicode[STIX]{x1D70F}+\overline{\unicode[STIX]{x1D701}}_{ob})}<-\text{e}^{-\overline{y}_{o}}$. Starting the
 $\unicode[STIX]{x1D709}$-integration from the lower bound, there is a small
 $\unicode[STIX]{x1D709}$-range adjacent to
 $\unicode[STIX]{x1D709}=-\text{e}^{-\overline{y}_{o}}$ of thickness
 $\text{e}^{-\overline{y}_{o}}|\unicode[STIX]{x1D6FF}y(\unicode[STIX]{x1D70F}+\overline{\unicode[STIX]{x1D701}}_{ob})|$,
 $$\begin{eqnarray}\displaystyle -\text{e}^{-y(\unicode[STIX]{x1D70F}+\overline{\unicode[STIX]{x1D701}}_{ob})}<\unicode[STIX]{x1D709}<-\text{e}^{-\overline{y}_{o}}, & & \displaystyle\end{eqnarray}$$
where the unperturbed reaction rate  $\text{e}^{\overline{y}_{o}}\unicode[STIX]{x1D714}_{o_{CJ}}(\unicode[STIX]{x1D709}\,\text{e}^{\overline{y}_{o}})$ is identically zero so that, according to (C 10),
 $\unicode[STIX]{x0394}\unicode[STIX]{x1D714}(\unicode[STIX]{x1D709},y(\unicode[STIX]{x1D70F}+\overline{\unicode[STIX]{x1D701}}_{o}))=\text{e}^{y(\unicode[STIX]{x1D70F}+\overline{\unicode[STIX]{x1D701}}_{o}(\unicode[STIX]{x1D709}))}\unicode[STIX]{x1D714}_{o_{CJ}}(\unicode[STIX]{x1D709}\,\text{e}^{y(\unicode[STIX]{x1D70F}+\overline{\unicode[STIX]{x1D701}}_{o}(\unicode[STIX]{x1D709}))})$. According to (3.17), this term
 $\unicode[STIX]{x0394}\unicode[STIX]{x1D714}$ is linear in
 $\unicode[STIX]{x1D709}$ in the small range (C 20),
 $\unicode[STIX]{x0394}\unicode[STIX]{x1D714}\approx c\,\text{e}^{y(\unicode[STIX]{x1D70F}+\overline{\unicode[STIX]{x1D701}}_{ob})}[\unicode[STIX]{x1D709}\,\text{e}^{y(\unicode[STIX]{x1D70F}+\overline{\unicode[STIX]{x1D701}}_{ob})}+1]$ so that the integral
 $\int _{-\text{e}^{-y(\unicode[STIX]{x1D70F}_{b})}}^{-\text{e}^{-\overline{y}_{o}}}\unicode[STIX]{x0394}\unicode[STIX]{x1D714}(\unicode[STIX]{x1D709},y(\unicode[STIX]{x1D70F}+\overline{\unicode[STIX]{x1D701}}_{o}))\,\text{d}\unicode[STIX]{x1D709}$ yields a quadratic term
 $\propto |\unicode[STIX]{x1D6FF}y(\unicode[STIX]{x1D70F}+\overline{\unicode[STIX]{x1D701}}_{ob})|^{2}$ which is thus negligible in the linear analysis. A similar conclusion holds for
 $\unicode[STIX]{x1D6FF}y(\unicode[STIX]{x1D70F}+\overline{\unicode[STIX]{x1D701}}_{ob})>0$ since
 $\unicode[STIX]{x0394}\unicode[STIX]{x1D714}=\text{e}^{\overline{y}_{o}}\unicode[STIX]{x1D714}_{o_{CJ}}(\unicode[STIX]{x1D709}\,\text{e}^{\overline{y}_{o}})\approx c\,\text{e}^{\overline{y}_{o}}[\unicode[STIX]{x1D709}\,\text{e}^{\overline{y}_{o}}+1]$ in the small
 $\unicode[STIX]{x1D709}$-range
 $-\text{e}^{-\overline{y}_{o}}<\unicode[STIX]{x1D709}<-\text{e}^{-y(\unicode[STIX]{x1D70F}+\overline{\unicode[STIX]{x1D701}}_{ob})}$. Therefore, the lower bound of the integral in (C 17) can be taken to be equal to
 $-\text{e}^{-\overline{y}_{o}}$. The linear version of equation (C 17) then takes the form,
 $$\begin{eqnarray}\displaystyle 2\overline{\unicode[STIX]{x1D707}}_{o}(0)\unicode[STIX]{x1D6FF}y(\unicode[STIX]{x1D70F}) & = & \displaystyle \int _{-\text{e}^{-\overline{y}_{o}}}^{0}g_{o}(\unicode[STIX]{x1D709})\unicode[STIX]{x1D6FF}y(\unicode[STIX]{x1D70F}+\overline{\unicode[STIX]{x1D701}}_{o}(\unicode[STIX]{x1D709}))\,\text{d}\unicode[STIX]{x1D709}+b\overline{\unicode[STIX]{x1D707}}_{ob}\unicode[STIX]{x1D6FF}\unicode[STIX]{x1D707}_{b}(\unicode[STIX]{x1D70F}+\overline{\unicode[STIX]{x1D701}}_{ob}),\end{eqnarray}$$
 $$\begin{eqnarray}\displaystyle \text{where}\quad g_{o}(\unicode[STIX]{x1D709}) & \equiv & \displaystyle \frac{b}{2}\frac{\unicode[STIX]{x2202}}{\unicode[STIX]{x2202}y}[\text{e}^{y}\unicode[STIX]{x1D714}_{o_{CJ}}(e^{y}\unicode[STIX]{x1D709})]_{y=\overline{y}_{o}}+\frac{\text{d}\overline{\unicode[STIX]{x1D707}}_{o}(\unicode[STIX]{x1D709})}{\text{d}\unicode[STIX]{x1D709}}\end{eqnarray}$$
 $$\begin{eqnarray}\displaystyle & = & \displaystyle \frac{b}{2}\text{e}^{\overline{y}_{o}}[\unicode[STIX]{x1D714}_{o_{CJ}}(\unicode[STIX]{x1D709}\,\text{e}^{\overline{y}_{o}})+\unicode[STIX]{x1D709}\,\text{e}^{\overline{y}_{o}}\unicode[STIX]{x1D714}_{o_{CJ}}^{\prime }(\unicode[STIX]{x1D709}\,\text{e}^{\overline{y}_{o}})]+\frac{\text{d}\overline{\unicode[STIX]{x1D707}}_{o}(\unicode[STIX]{x1D709})}{\text{d}\unicode[STIX]{x1D709}},\end{eqnarray}$$
where  $\unicode[STIX]{x1D714}_{o_{CJ}}^{\prime }(\unicode[STIX]{x1D709})\equiv \text{d}\unicode[STIX]{x1D714}_{o_{CJ}}(\unicode[STIX]{x1D709})/\text{d}\unicode[STIX]{x1D709}$. The lower bound of the integral
 $-\text{e}^{-\overline{y}_{o}}$ in (C 21) can be set equal to
 $-\infty$ since
 $g_{o}(\unicode[STIX]{x1D709})=0$ for
 $\unicode[STIX]{x1D709}\leqslant -\text{e}^{-\overline{y}_{o}}$ and
 $\int _{-\infty }^{0}g_{o}(\unicode[STIX]{x1D709})\,\text{d}\unicode[STIX]{x1D709}=\overline{\unicode[STIX]{x1D707}}_{o}(0)-\overline{\unicode[STIX]{x1D707}}_{ob}$
 $\forall b$ yielding
 $\int _{-\infty }^{0}g_{o}(\unicode[STIX]{x1D709})\,\text{d}\unicode[STIX]{x1D709}\approx \overline{\unicode[STIX]{x1D707}}_{o}(0)$
 $\forall b$ for a weakly overdriven regime (
 $\overline{\unicode[STIX]{x1D707}}_{ob}\ll 1$). The linear stability of weakly overdriven detonations sustained by a distribution of reaction rate satisfying (3.17) is obtained from (C 21) for
 $\unicode[STIX]{x1D6FF}\unicode[STIX]{x1D707}_{b}=0$. This leads to the same equation as that derived by Clavin & Williams (Reference Clavin and Williams2002) near the CJ regime for a distribution of reaction rate
 $\unicode[STIX]{x1D714}_{o_{CJ}}(\unicode[STIX]{x1D709})$ and its derivative
 $\text{d}\unicode[STIX]{x1D714}_{o_{CJ}}(\unicode[STIX]{x1D709})/\text{d}\unicode[STIX]{x1D709}$ decreasing continuously to zero at the end of the reaction
 $\lim _{\unicode[STIX]{x1D709}\rightarrow -\infty }\unicode[STIX]{x1D714}_{o_{CJ}}(\unicode[STIX]{x1D709})=0$,
 $$\begin{eqnarray}2\,\overline{\unicode[STIX]{x1D707}}_{o}(0)\unicode[STIX]{x1D6FF}y(\unicode[STIX]{x1D70F})=\int _{-\infty }^{0}g_{o}(\unicode[STIX]{x1D709})\unicode[STIX]{x1D6FF}y(\unicode[STIX]{x1D70F}+\overline{\unicode[STIX]{x1D701}}_{o}(\unicode[STIX]{x1D709}))\,\text{d}\unicode[STIX]{x1D709},\quad \int _{-\infty }^{0}g_{o}(\unicode[STIX]{x1D709})\,\text{d}\unicode[STIX]{x1D709}=\overline{\unicode[STIX]{x1D707}}_{o}(0)\quad \forall b.\end{eqnarray}$$
Detonations are unstable to planar disturbances when  $b$ is sufficiently large. For typical reaction rates, the threshold of instability corresponds to
 $b$ of order unity, see appendix B of Clavin & Denet (Reference Clavin and Denet2018) where a slightly different notation has been used
 $\overline{\unicode[STIX]{x1D707}}(\unicode[STIX]{x1D709})g(\unicode[STIX]{x1D709})\rightarrow g(\overline{\unicode[STIX]{x1D701}})$. Near the instability threshold, assuming that the dominant nonlinear mechanisms stabilizing the instability are the chemical kinetics, the nonlinear pulsation of weakly unstable detonations is the solution to a nonlinear equation extending (C 24) when
 $g_{o}(\unicode[STIX]{x1D709})\unicode[STIX]{x1D6FF}y$ is replaced by its nonlinear version
 $W_{o}(\unicode[STIX]{x1D709},y)$,
 $$\begin{eqnarray}\displaystyle & \displaystyle 2\,\overline{\unicode[STIX]{x1D707}}_{o}(0)\unicode[STIX]{x1D6FF}y(\unicode[STIX]{x1D70F})=\int _{-\infty }^{0}W_{o}(\unicode[STIX]{x1D709},y(\unicode[STIX]{x1D70F}+\overline{\unicode[STIX]{x1D701}}_{o}(\unicode[STIX]{x1D709})))\,\text{d}\unicode[STIX]{x1D709}, & \displaystyle\end{eqnarray}$$
 $$\begin{eqnarray}\displaystyle & \displaystyle W_{o}(\unicode[STIX]{x1D709},y)\equiv \frac{b}{2}\left[\text{e}^{y}\unicode[STIX]{x1D714}_{o_{CJ}}(\unicode[STIX]{x1D709}\text{e}^{y})-\text{e}^{\overline{y}_{o}}\unicode[STIX]{x1D714}_{o_{CJ}}(\unicode[STIX]{x1D709}\,\text{e}^{\overline{y}_{o}})\right]+\frac{\text{d}\overline{\unicode[STIX]{x1D707}}_{o}(\unicode[STIX]{x1D709})}{\text{d}\unicode[STIX]{x1D709}}(y-\overline{y}_{o}). & \displaystyle\end{eqnarray}$$
A similar equation was derived previously in the opposite limit of strongly overdriven detonations with a large Mach number, see Clavin & He (Reference Clavin and He1996).
C.3 CJ regime. The hot boundary difficulty
The hot boundary difficulty is associated with the sonic condition at the end of the reaction of a CJ wave,  $\unicode[STIX]{x1D709}=-1:\overline{\unicode[STIX]{x1D707}}_{o_{CJ}}(\unicode[STIX]{x1D709})=0$,
 $\overline{y}_{o_{CJ}}=0$ so that the transit time from the end of the reaction of the upwards-running acoustic mode diverges. This divergence is weak for the model (3.17)–(5.10) as shown now. Consider a weakly overdriven regime,
 $\overline{\text{m}}_{ob}^{2}\equiv b\overline{\unicode[STIX]{x1D707}}_{ob}^{2}/2=O(1)$, for which the small parameter
 $1/\sqrt{b}$ characterizes the proximity of the CJ regime,
 $$\begin{eqnarray}\overline{\unicode[STIX]{x1D707}}_{ob}=O(1/\sqrt{b}),\quad \overline{y}_{o}\approx \overline{\text{m}}_{ob}^{2}=O(1),\quad \overline{\unicode[STIX]{x1D707}}_{o}(\unicode[STIX]{x1D709},\overline{y}_{o})\approx \sqrt{2\,\overline{\text{m}}_{ob}^{2}/b+\unicode[STIX]{x1D707}_{o_{CJ}}^{2}(\unicode[STIX]{x1D709}\text{e}^{\overline{\text{m}}_{ob}^{2}})},\end{eqnarray}$$
the explicit dependence on the detonation velocity  $\overline{y}_{o}$ being now incorporated into the expression of the velocity distribution
 $\overline{\unicode[STIX]{x1D707}}_{o}(\unicode[STIX]{x1D709},\overline{y}_{o})$. Inside the inner structure of the detonation for
 $\unicode[STIX]{x1D709}\text{e}^{\overline{\text{m}}_{ob}^{2}}+1$ not close to zero, namely for
 $\overline{\unicode[STIX]{x1D707}}_{o}(\unicode[STIX]{x1D709},\overline{y}_{o})\approx \unicode[STIX]{x1D707}_{o_{CJ}}(\unicode[STIX]{x1D709}\text{e}^{\overline{\text{m}}_{ob}^{2}})>0$ of order unity, the time delay
 $|\overline{\unicode[STIX]{x1D701}}_{o}(\unicode[STIX]{x1D709})|$ is also of order unity. It increases and becomes as large as
 $\ln \sqrt{b}$ in a thin layer near the end of the reaction zone
 $(\unicode[STIX]{x1D709}\text{e}^{\overline{\text{m}}_{ob}^{2}}+1)=O(1/\sqrt{b})$ and diverges logarithmically when approaching the CJ regime (limit
 $\overline{\text{m}}_{ob}\rightarrow 0$). This is checked by considering a point
 $\unicode[STIX]{x1D709}_{m}$ outside the thin layer so that the integral
 $\int _{0}^{\unicode[STIX]{x1D709}_{m}}$ in (C 13) is finite (of order unity) and by computing
 $\int _{\unicode[STIX]{x1D709}_{m}}^{\unicode[STIX]{x1D709}}$ for
 $\unicode[STIX]{x1D709}$ inside the thin layer,
 $\unicode[STIX]{x1D707}_{o_{CJ}}(\unicode[STIX]{x1D709}\text{e}^{\overline{\text{m}}_{ob}^{2}})\approx a\,(\unicode[STIX]{x1D709}\text{e}^{\overline{\text{m}}_{ob}^{2}}+1)=O(1/\sqrt{b})$
 $$\begin{eqnarray}\displaystyle -\int _{\unicode[STIX]{x1D709}}^{\unicode[STIX]{x1D709}_{m}}\frac{\text{d}\unicode[STIX]{x1D709}^{\prime }}{\overline{\unicode[STIX]{x1D707}}_{o}(\unicode[STIX]{x1D709}^{\prime })}=-\sqrt{b/2}\frac{\text{e}^{-\overline{\text{m}}_{ob}^{2}}}{\overline{\text{m}}_{ob}}\int _{\unicode[STIX]{x1D709}\text{e}^{\overline{\text{m}}_{ob}^{2}}}^{\unicode[STIX]{x1D709}_{m}\text{e}^{\overline{\text{m}}_{ob}^{2}}}\frac{\text{d}\unicode[STIX]{x1D709}^{\prime \prime }}{\sqrt{1+b(\unicode[STIX]{x1D709}^{\prime \prime }+1)^{2}a^{2}/(2\,\overline{\text{m}}_{ob}^{2})}}. & & \displaystyle\end{eqnarray}$$
A change of variable  $Y^{\prime \prime }=\sqrt{b}\,(\unicode[STIX]{x1D709}^{\prime \prime }+1)a/(\sqrt{2}\,\text{m}_{b})$ leads to
 $$\begin{eqnarray}\displaystyle -\int _{\unicode[STIX]{x1D709}}^{\unicode[STIX]{x1D709}_{m}}\frac{\text{d}\unicode[STIX]{x1D709}^{\prime }}{\overline{\unicode[STIX]{x1D707}}_{o}(\unicode[STIX]{x1D709}^{\prime })}=-\frac{\text{e}^{-\overline{\text{m}}_{ob}^{2}}}{a}\int _{Y}^{Y(\unicode[STIX]{x1D709}_{m})}\frac{\text{d}Y^{\prime \prime }}{\sqrt{1+{Y^{\prime \prime }}^{2}}}=-\frac{\text{e}^{-\overline{\text{m}}_{ob}^{2}}}{a}\ln \left(Y^{\prime \prime }+\sqrt{1+{Y^{\prime \prime }}^{2}}\right)\Big|_{Y}^{Y_{m}}, & & \displaystyle \nonumber\end{eqnarray}$$
where  $Y\equiv \sqrt{b}\,(\unicode[STIX]{x1D709}\text{e}^{\overline{\text{m}}_{ob}^{2}}+1)a/(\sqrt{2}\,\overline{\text{m}}_{ob})$,
 $Y(\unicode[STIX]{x1D709})=O(1)$ inside the thin layer and
 $Y(\unicode[STIX]{x1D709}_{m})\gg 1$ of order
 $\sqrt{b}$ outside. Moreover, using the limit
 $\lim _{\sqrt{b}\,(\unicode[STIX]{x1D709}\text{e}^{\overline{\text{m}}_{ob}^{2}}+1)\rightarrow 0^{+}}Y=0$
 $\forall \,\overline{\text{m}}_{ob}$, the time delay
 $|\overline{\unicode[STIX]{x1D701}}_{o}(\unicode[STIX]{x1D709})|$ at the end of the reaction zone behaves like
 $$\begin{eqnarray}\displaystyle -\frac{\text{e}^{-\overline{\text{m}}_{ob}^{2}}}{a}\ln \left[\frac{\sqrt{2\,b}}{\overline{\text{m}}_{ob}}\left(\unicode[STIX]{x1D709}_{m}\text{e}^{\overline{\text{m}}_{ob}^{2}}+1\right)\right],\quad \text{where }\unicode[STIX]{x1D709}_{m}\text{e}^{\overline{\text{m}}_{ob}^{2}}+1=O(1), & & \displaystyle\end{eqnarray}$$
showing an order of magnitude equal to  $\ln (\sqrt{b})$ inside the thin layer and a logarithmic divergence when approaching the CJ regime (
 $\overline{\text{m}}_{ob}\rightarrow 0^{+}$),
 $$\begin{eqnarray}\displaystyle \lim _{\overline{\text{m}}_{ob}\rightarrow 0}|\overline{\unicode[STIX]{x1D701}}_{o}(\unicode[STIX]{x1D709})|_{\sqrt{b}\,(\unicode[STIX]{x1D709}+1)=0^{+}}\propto \ln (\sqrt{b}/\,\overline{\text{m}}_{ob}). & & \displaystyle\end{eqnarray}$$
Thanks to the rapid decease of the reaction rate at the end of the reaction zone, equations (C 24) and (C 26) still work for the CJ regime despite the divergence of the transit time.
Model of constant reaction rate during a finite time after the induction delay.

Appendix D. Time lag along a straight trajectory
Considering a trajectory with a detonation velocity decreasing toward the CJ velocity,  $\text{d}y/\text{d}\unicode[STIX]{x1D70F}<0$, an analytical expression of the time lag
 $z_{b}$ can be obtained by using the piecewise-linear model for
 $\unicode[STIX]{x1D707}_{o_{CJ}}(\unicode[STIX]{x1D709})$ in figure 8 where
 $h_{\unicode[STIX]{x1D707}}>1$ (typically
 $h_{\unicode[STIX]{x1D707}}\approx 1.5-2$). To obtain
 $z_{b}(\unicode[STIX]{x1D70F})$ from (8.30), two cases have to be considered depending on the sign of
 $-\text{e}^{-[y(\unicode[STIX]{x1D70F}-z_{b})-\overline{y}_{_{CJ}}]}+1-h_{\unicode[STIX]{x1D707}}^{-1}$:
(i) Consider first conditions for which  $y(\unicode[STIX]{x1D70F}-z_{b})$ is not too far from the CJ regime, so that that the difference
 $y(\unicode[STIX]{x1D70F}-z_{b})-\overline{y}_{_{CJ}}$ is such that,
 $$\begin{eqnarray}\displaystyle -1<-\text{e}^{-[y(\unicode[STIX]{x1D70F}-z_{b})-\overline{y}_{_{CJ}}]}<-1+h_{\unicode[STIX]{x1D707}}^{-1}\quad \Rightarrow \quad y(\unicode[STIX]{x1D70F}-z_{b})-\overline{y}_{_{CJ}}<\ln [h_{\unicode[STIX]{x1D707}}/(h_{\unicode[STIX]{x1D707}}-1)], & & \displaystyle\end{eqnarray}$$
 $-\text{e}^{-[y(\unicode[STIX]{x1D70F}-z_{b})-\overline{y}_{_{CJ}}]}<-1+h_{\unicode[STIX]{x1D707}}^{-1}$, where
 $\ln [h_{\unicode[STIX]{x1D707}}/(h_{\unicode[STIX]{x1D707}}-1)]\approx 0.7$ for
 $h_{\unicode[STIX]{x1D707}}\approx 2$. This implies that
 $y(\unicode[STIX]{x1D70F})-\overline{y}_{_{CJ}}$ is also not too large
 $$\begin{eqnarray}\displaystyle y(\unicode[STIX]{x1D70F})<y(\unicode[STIX]{x1D70F}-z_{b})\quad \Rightarrow \quad y(\unicode[STIX]{x1D70F})-\overline{y}_{_{CJ}}<\ln [h_{\unicode[STIX]{x1D707}}/(h_{\unicode[STIX]{x1D707}}-1)]. & & \displaystyle\end{eqnarray}$$
Then, according to (8.30), one gets the following equation for the delay  $z_{b}$ in the form
 $$\begin{eqnarray}(h_{\unicode[STIX]{x1D707}}\text{e}^{\overline{y}_{_{CJ}}})z_{b}=a-\ln \left(1-\text{e}^{-[y(\unicode[STIX]{x1D70F}-z_{b})-\overline{y}_{_{CJ}}]}\right),\quad a\equiv (h_{\unicode[STIX]{x1D707}}-1)-\ln h_{\unicode[STIX]{x1D707}}>0,\,\,a\approx 0.3.\end{eqnarray}$$
Consider a decreasing velocity larger than the CJ velocity,  $\text{d}y(\unicode[STIX]{x1D70F})/\text{d}\unicode[STIX]{x1D70F}<0$ and
 $y(\unicode[STIX]{x1D70F})-\overline{y}_{_{CJ}}>0$, equation (D 3) has a single and finite root
 $z_{b}>0$ since the right-hand side is an increasing function of
 $z_{b}$ from
 $(h_{\unicode[STIX]{x1D707}}-1)-\ln h_{\unicode[STIX]{x1D707}}<0$ at
 $z_{b}=\infty (y(\unicode[STIX]{x1D70F}+\unicode[STIX]{x1D701}_{b})=\infty )$ to a smaller value at
 $\unicode[STIX]{x1D701}_{b}=0$. For consistency the solution should satisfy (D 1).
Graphic solution of equation (D 8) for  $h_{\unicode[STIX]{x1D707}}\approx 2$. The dot line denotes the limit of the straight line whose intersection with the curve
 $-\ln (1-\text{e}^{-X})$ determines the solution
 $X_{o}$.

For the sake of simplicity, consider a straight trajectory approaching the CJ regime from above (constant deceleration of the blast wave  $A>0$)
 $$\begin{eqnarray}\displaystyle & \displaystyle y(\unicode[STIX]{x1D70F})=\overline{y}_{_{CJ}}+A(\unicode[STIX]{x1D70F}_{CJ}-\unicode[STIX]{x1D70F}),\quad A>0,\quad (\unicode[STIX]{x1D70F}_{CJ}-\unicode[STIX]{x1D70F})>0 & \displaystyle\end{eqnarray}$$
 $$\begin{eqnarray}\displaystyle & \displaystyle y(\unicode[STIX]{x1D70F}-z_{b})-\overline{y}_{_{CJ}}=[y(\unicode[STIX]{x1D70F})-\overline{y}_{_{CJ}}]+Az_{b} & \displaystyle\end{eqnarray}$$
 $$\begin{eqnarray}\displaystyle & \displaystyle (h_{\unicode[STIX]{x1D707}}\text{e}^{\overline{y}_{_{CJ}}})z_{b}=a-\ln \left(1-\text{e}^{-[y(\unicode[STIX]{x1D70F})-\overline{y}_{_{CJ}}]-Az_{b}}\right), & \displaystyle\end{eqnarray}$$
where the parameter  $A>0$ is the non-dimensional deceleration,
 $\unicode[STIX]{x1D70F}_{CJ}$ is the time at which the trajectory intersects the CJ peninsula (
 $\unicode[STIX]{x1D70F}<\unicode[STIX]{x1D70F}_{CJ}$) and the parameter
 $a>0$ is given in (D 3). Introducing
 $X=y(\unicode[STIX]{x1D70F}-z_{b})-\overline{y}_{_{CJ}}>0$ and the parameter
 $B>0$ characterizing the reduced velocity
 $y(\unicode[STIX]{x1D70F})$ at time
 $\unicode[STIX]{x1D70F}$,
 $$\begin{eqnarray}\displaystyle X=[y(\unicode[STIX]{x1D70F})-\overline{y}_{_{CJ}}]+Az_{b}\geqslant 0,\quad B=[y(\unicode[STIX]{x1D70F})-\overline{y}_{_{CJ}}]+Aa/(h_{\unicode[STIX]{x1D707}}\text{e}^{\overline{y}_{_{CJ}}})\geqslant 0, & & \displaystyle\end{eqnarray}$$
equation (D 6) for  $z_{b}$ at time
 $\unicode[STIX]{x1D70F}$ takes the form
 $$\begin{eqnarray}\displaystyle \frac{h_{\unicode[STIX]{x1D707}}\text{e}^{\overline{y}_{_{CJ}}}}{A}[X-B]=-\ln \left(1-\text{e}^{-X}\right). & & \displaystyle\end{eqnarray}$$
For consistency with (D 1), the root  $X_{o}$ of (D 8) should be smaller than
 $\ln [h_{\unicode[STIX]{x1D707}}/(h_{\unicode[STIX]{x1D707}}-1)]\approx 0.7$, so that the parameter
 $B$ should be sufficiently small
 $B<0.7$ since
 $B<X_{o}<\ln [h_{\unicode[STIX]{x1D707}}/(h_{\unicode[STIX]{x1D707}}-1)]$, see figure 9. These conditions on
 $X_{o}$ imply that the slope of the straight line in figure 9,
 $h_{\unicode[STIX]{x1D707}}\text{e}^{\overline{y}_{_{CJ}}}/A$ is larger than
 $\ln h_{\unicode[STIX]{x1D707}}/[\ln (h_{\unicode[STIX]{x1D707}}/(h_{\unicode[STIX]{x1D707}}-1))-B]$ yielding a maximum value
 $A_{m}$ of the deceleration
 $A$
 $$\begin{eqnarray}\displaystyle A\leqslant A_{m},\quad \frac{A_{m}}{\text{e}^{\overline{y}_{_{CJ}}}}\frac{(h_{\unicode[STIX]{x1D707}}-1)}{h_{\unicode[STIX]{x1D707}}}=\ln \left(\frac{h_{\unicode[STIX]{x1D707}}}{h_{\unicode[STIX]{x1D707}}-1}\right)-(y(\unicode[STIX]{x1D70F})-\overline{y}_{_{CJ}}) & & \displaystyle\end{eqnarray}$$
corresponding to a maximum  $X_{m}$ of
 $X_{o}$,
 $X_{m}=\ln [h_{\unicode[STIX]{x1D707}}/(h_{\unicode[STIX]{x1D707}}-1)]$,
 $A_{m}z_{b}+(y(\unicode[STIX]{x1D70F})-\overline{y}_{_{CJ}})=\ln [h_{\unicode[STIX]{x1D707}}/(h_{\unicode[STIX]{x1D707}}-1)]$ and to a delay
 $z_{b}=(h_{\unicode[STIX]{x1D707}}-1)/h_{\unicode[STIX]{x1D707}}\text{e}^{\overline{y}_{CJ}}$. For a deceleration of order unity,
 $A=O(1)$, the solution of (D 8) and the time delay
 $z_{b}(\unicode[STIX]{x1D70F})$ are of order unity and the latter varies weakly when approaching the CJ regime
 $[y(\unicode[STIX]{x1D70F})-\overline{y}_{_{CJ}}]\ll 1$.
Consider now a small deceleration of the blast wave  $A\ll 1$. The limit of a small slope of the trajectory
 $A\rightarrow 0^{+}$,
 $X_{o}\rightarrow B$, requires some attention. If one considers the limit
 $A\rightarrow 0^{+}$ for a fixed and non-zero value of
 $y(\unicode[STIX]{x1D70F})-\overline{y}_{_{CJ}}=A(\unicode[STIX]{x1D70F}-\unicode[STIX]{x1D70F}_{CJ})\neq 0$, the parameter
 $B$ in (D 7) remains non-zero
 $B\rightarrow y(\unicode[STIX]{x1D70F})-\overline{y}_{_{CJ}}\neq 0$, and the limit
 $X_{o}\rightarrow B$ shows that the delay still goes to a value of order unity
 $z_{b}\rightarrow a/h_{\unicode[STIX]{x1D707}}\text{e}^{\overline{y}_{CJ}}$. To summarize, at a finite distance from the CJ regime at time
 $\unicode[STIX]{x1D70F}$, the time delay
 $z_{b}$ is still of order unity. The limit of a small deceleration
 $A\rightarrow 0^{+}$ is different when the propagation velocity
 $y(\unicode[STIX]{x1D70F})$ reaches the CJ velocity at finite time
 $\unicode[STIX]{x1D70F}=\unicode[STIX]{x1D70F}_{CJ}$ :
 $y(\unicode[STIX]{x1D70F})=\overline{y}_{_{CJ}}$,
 $X=Az_{b}$ and
 $B=Aa/(h_{\unicode[STIX]{x1D707}}\text{e}^{\overline{y}_{_{CJ}}})$,
 $\lim _{A\rightarrow 0^{+}}B=0$. Then, equation (D 8) yields
 $$\begin{eqnarray}\displaystyle \unicode[STIX]{x1D70F}=\unicode[STIX]{x1D70F}_{CJ}\quad A\rightarrow 0^{+}:\quad h_{\unicode[STIX]{x1D707}}\text{e}^{\overline{y}_{_{CJ}}}X=-A\ln \left(1-\text{e}^{-X}\right)\rightarrow 0^{+}, & & \displaystyle\end{eqnarray}$$
showing that the delay  $z_{b}$ diverges weakly when the slope of the trajectory decreases to zero,
 $z_{b}=X/A\rightarrow \infty$,
 $z_{b}\approx \ln A^{-1}$ in a way reminiscent of (C 30).
(ii) Consider now the case opposite to (D 1)
 $$\begin{eqnarray}\displaystyle -1+h_{\unicode[STIX]{x1D707}}^{-1}<-\text{e}^{-[y(\unicode[STIX]{x1D70F}-z_{b})-\overline{y}_{_{CJ}}]}\quad \Rightarrow \quad \ln [h_{\unicode[STIX]{x1D707}}/(h_{\unicode[STIX]{x1D707}}-1)]<y(\unicode[STIX]{x1D70F}-z_{b})-\overline{y}_{_{CJ}}. & & \displaystyle\end{eqnarray}$$
Equation (8.30) then yields  $z_{b}=\text{e}^{-y(\unicode[STIX]{x1D70F}-z_{b})}$. Using (D 4) and
 $X=Az_{b}$ this gives
 $$\begin{eqnarray}\displaystyle X\text{e}^{X}=A\text{e}^{-A(\unicode[STIX]{x1D70F}_{CJ}-\unicode[STIX]{x1D70F})}. & & \displaystyle\end{eqnarray}$$
For a decreasing trajectory  $A>0$ with
 $y(\unicode[STIX]{x1D70F})>y_{_{CJ}}$, the delay
 $z_{b}(\unicode[STIX]{x1D70F})$ at time
 $\unicode[STIX]{x1D70F}<\unicode[STIX]{x1D70F}_{CJ}$ increases with the time to a maximum value
 $X_{m}\text{e}^{X_{m}}=A$ (when reaching the CJ velocity,
 $\unicode[STIX]{x1D70F}=\unicode[STIX]{x1D70F}_{CJ}$) and decreases quickly to zero in the past,
 $z_{b}\approx \text{e}^{-A(\unicode[STIX]{x1D70F}_{CJ}-\unicode[STIX]{x1D70F})}$ for
 $A(\unicode[STIX]{x1D70F}_{CJ}-\unicode[STIX]{x1D70F})\gg 1$.
For an increasing trajectory,  $\text{d}y/\text{d}\unicode[STIX]{x1D70F}>0$,
 $A<0$, equation (D 12) has no root or the solution for
 $z_{b}$ multivalued. This is in agreement with the fact that, according to § 9.2, causality is not satisfied.



